Rembrandt Klopper - Alternation Journal - University of KwaZulu-Natal
Rembrandt Klopper - Alternation Journal - University of KwaZulu-Natal
Rembrandt Klopper - Alternation Journal - University of KwaZulu-Natal

Create successful ePaper yourself
Turn your PDF publications into a flip-book with our unique Google optimized e-Paper software.
ALTERNATION<br />
Interdisciplinary <strong>Journal</strong> for the Study <strong>of</strong> the Arts and Humanities in<br />
Southern Africa Special Edition 4, 2011<br />
ISSN 1023-1757
* <strong>Alternation</strong> is an international journal which publishes interdisciplinary contributions<br />
in the fields <strong>of</strong> the Arts and Humanities in Southern Africa.<br />
* Prior to publication, each publication in <strong>Alternation</strong> is refereed by at least two<br />
independent peer referees.<br />
* <strong>Alternation</strong> is indexed in The Index to South African Periodicals (ISAP) and<br />
reviewed in The African Book Publishing Record (ABPR).<br />
* <strong>Alternation</strong> is published every semester.<br />
* <strong>Alternation</strong> was accredited in 1996.<br />
EDITOR ASSOCIATE EDITOR<br />
Johannes A Smit (UKZN) Judith Lütge Coullie (UKZN)<br />
Editorial Assistant: Beverly Vencatsamy<br />
EDITORIAL COMMITTEE<br />
Catherine Addison (UZ); Denzil Chetty (Unisa); Brian Fulela (UKZN); Mandy<br />
Goedhals (UKZN); <strong>Rembrandt</strong> <strong>Klopper</strong> (UKZN); Jabulani Mkhize (UFort<br />
Hare); Shane Moran (UKZN); Priya Narismulu (UKZN); Nobuhle Ndimande-<br />
Hlongwa (UKZN); Thengani Ngwenya (DUT); Corinne Sandwith (UKZN);<br />
Mpilo Pearl Sithole (UKZN); Graham Stewart (DUT).<br />
EDITORIAL BOARD<br />
Richard Bailey (UKZN); Marianne de Jong (Unisa); Betty Govinden (UKZN);<br />
Dorian Haarh<strong>of</strong>f (Namibia); Sabry Hafez (SOAS); Dan Izebaye (Ibadan); RK<br />
Jain (Jawaharlal Nehru); Robbie Kriger (NRF); Isaac Mathumba (Unisa);<br />
Godfrey Meintjes (Rhodes); Fatima Mendonca (Eduardo Mondlane);<br />
Sikhumbuzo Mngadi (UJ); Louis Molamu (Botswana); Katwiwa Mule<br />
(Pennsylvania); Isidore Okpewho (Binghamton); Andries Oliphant (Unisa);<br />
Julie Pridmore (Unisa); Rory Ryan (UJ); Michael Samuel (UKZN); Maje<br />
Serudu (Unisa); Marilet Sienaert (UCT); Ayub Sheik (UKZN); Liz Thompson<br />
(UZ); Cleopas Thosago (UNIN); Helize van Vuuren (NMMU); Hildegard van<br />
Zweel (Unisa).<br />
NATIONAL AND INTERNATIONAL ADVISORY BOARD<br />
Carole Boyce-Davies (Florida Int.); Ampie Coetzee (UWC); Simon During<br />
(Melbourne); Elmar Lehmann (Essen); Douglas Killam (Guelph); Andre<br />
Lefevere (Austin); David Lewis-Williams (Wits); Bernth Lindfors (Austin); Jeff<br />
Opland (Charterhouse); Graham Pechey (Hertfordshire); Erhard Reckwitz<br />
(Essen).<br />
COVER DESIGN<br />
<strong>Rembrandt</strong> <strong>Klopper</strong><br />
CORRESPONDENCE ADDRESS<br />
The Editor: <strong>Alternation</strong>, Univ. <strong>of</strong> <strong>KwaZulu</strong>-<strong>Natal</strong>, Priv. Bag X10, Dalbridge, 4041,<br />
DURBAN, South Africa; Tel: +27-(0)31-260-7303;<br />
Fax: +27-(0)31-260-7286; Web: http://alternation.ukzn.ac.za<br />
e-mail: smitj@ukzn.ac.za; vencatsamyb@ukzn.ac.za<br />
ISSN 1023-1757<br />
Copyright Reserved: <strong>Alternation</strong>
<strong>Alternation</strong><br />
Interdisciplinary <strong>Journal</strong> for the Study <strong>of</strong> the<br />
Arts and Humanities in<br />
Southern Africa<br />
Management,<br />
Informatics and<br />
Research Design<br />
Guest Editor<br />
<strong>Rembrandt</strong> <strong>Klopper</strong><br />
2011<br />
CSSALL<br />
Durban
Acknowledgement <strong>of</strong> Reviewers<br />
We wish to acknowledge the participation <strong>of</strong> the following reviewers in the<br />
production <strong>of</strong> this issue <strong>of</strong> <strong>Alternation</strong>.<br />
Kasturi Behari-Leak - <strong>University</strong> <strong>of</strong> <strong>KwaZulu</strong>-<strong>Natal</strong><br />
Shamim Bodhanya - <strong>University</strong> <strong>of</strong> <strong>KwaZulu</strong>-<strong>Natal</strong><br />
Teresa Carmichael - <strong>University</strong> <strong>of</strong> Witswaterrand<br />
Stanley Fore - <strong>University</strong> <strong>of</strong> <strong>KwaZulu</strong>-<strong>Natal</strong><br />
Cecile Gerwel - <strong>University</strong> <strong>of</strong> <strong>KwaZulu</strong>-<strong>Natal</strong><br />
Mari Jansen van Rensburg - <strong>University</strong> <strong>of</strong> South Africa<br />
<strong>Rembrandt</strong> <strong>Klopper</strong> - <strong>University</strong> <strong>of</strong> <strong>KwaZulu</strong>-<strong>Natal</strong><br />
Evert Louw - North West <strong>University</strong><br />
Sam Lubbe - North West <strong>University</strong><br />
Manoj Maharaj - <strong>University</strong> <strong>of</strong> <strong>KwaZulu</strong>-<strong>Natal</strong><br />
Charles O'Neill - <strong>University</strong> <strong>of</strong> <strong>KwaZulu</strong>-<strong>Natal</strong><br />
Shaun Pather - Cape Peninsula <strong>of</strong> Technology<br />
Sadhasivan Perumal - <strong>University</strong> <strong>of</strong> <strong>KwaZulu</strong>-<strong>Natal</strong><br />
Kasthuri Poovalingam - <strong>University</strong> <strong>of</strong> <strong>KwaZulu</strong>-<strong>Natal</strong><br />
Nisha Ramlutchman - Durban <strong>University</strong> <strong>of</strong> Technology<br />
Hemduth Rugbeer - <strong>University</strong> <strong>of</strong> Zululand<br />
Yasmin Rugbeer - <strong>University</strong> <strong>of</strong> Zululand<br />
Anesh Singh - <strong>University</strong> <strong>of</strong> <strong>KwaZulu</strong>-<strong>Natal</strong><br />
Chris Skinner - <strong>University</strong> <strong>of</strong> <strong>KwaZulu</strong>-<strong>Natal</strong><br />
Johannes A. Smit - <strong>University</strong> <strong>of</strong> <strong>KwaZulu</strong>-<strong>Natal</strong><br />
Marie Spruyt- <strong>University</strong> <strong>of</strong> Zululand<br />
Barry Strydom - <strong>University</strong> <strong>of</strong> <strong>KwaZulu</strong>-<strong>Natal</strong><br />
Wilfred Ukpere - <strong>University</strong> <strong>of</strong> Johannesburg<br />
André van der Poll- <strong>University</strong> <strong>of</strong> South Africa<br />
Huibrecht van der Poll - <strong>University</strong> <strong>of</strong> South Africa<br />
Dewald van Niekerk - North West <strong>University</strong><br />
D. Veersamy - Durban <strong>University</strong> <strong>of</strong> Technology<br />
Sandra Williams - <strong>University</strong> <strong>of</strong> <strong>KwaZulu</strong>-<strong>Natal</strong><br />
Sylvia Zulu - Durban <strong>University</strong> <strong>of</strong> Technology
Editorial<br />
<strong>Rembrandt</strong> <strong>Klopper</strong><br />
From the point <strong>of</strong> view <strong>of</strong> differences between the submissions that passed<br />
peer review, this issue <strong>of</strong> <strong>Alternation</strong> consists <strong>of</strong> 19 articles from the fields <strong>of</strong><br />
Management, Informatics, Media Communication and Research<br />
Methodology. All 11 <strong>of</strong> the Management contributions report the results <strong>of</strong><br />
research in a variety <strong>of</strong> fields <strong>of</strong> Business Management, namely Change<br />
Management, Diversity Management, Economics, Entrepreneurship,<br />
Finance, and Management <strong>of</strong> Service Delivery. Of the six Informatics<br />
contributions, three have an applied research methods focus. Two <strong>of</strong> them<br />
focus on specific aspects <strong>of</strong> Grounded Theory in Information Systems<br />
Research, while the third focuses on Information Quality in Information<br />
Systems Research. The other three Informatics articles deal with themes like<br />
Digital Convergence, Information Systems in Higher Education and Mobile<br />
Communication Technologies.<br />
Two contributions have their own particular focuses. One <strong>of</strong> them<br />
analyses Media Communication. The other one focuses on Concept-Centric<br />
Literature Review.<br />
The cover <strong>of</strong> this issue was created by combining the keywords <strong>of</strong> all<br />
the articles, and thereafter generating a visual representation – a font size<br />
sensitive lexi-graph <strong>of</strong> sorts – <strong>of</strong> how frequently terms are used in relation to<br />
one another. This was achieved by using the generously free online service,<br />
WORDLE (that is gratefully acknowledged here). WORDLE equates the<br />
frequency at which terms are used with their font sizes among the other terms<br />
displayed on the image. From the cover page one can therefore see that the<br />
most frequently used keyword in this issue is information, followed at a<br />
considerably lesser but co-equal frequency by research and theory, and<br />
<strong>Alternation</strong> Special Edition 4 (2011) 1 – 2 1<br />
ISSN 1023-1757
<strong>Rembrandt</strong> <strong>Klopper</strong><br />
thereafter in more or less descending interval steps by business, grounded<br />
(theory), systems, reporting, economic, firm, knowledge, success, differential,<br />
entrepreneurial, information, technology, quality, timelines, etc.<br />
The names <strong>of</strong> individual contributors appear with article titles and<br />
pagination information in the table <strong>of</strong> contents on the back outer cover.<br />
Summaries <strong>of</strong> individual articles appear as abstracts at the beginning <strong>of</strong> each<br />
article.<br />
2<br />
<strong>Rembrandt</strong> <strong>Klopper</strong><br />
Special issues editor<br />
<strong>Alternation</strong> Special Edition 4 (2011)<br />
rklopper@gmail.com
The Quality <strong>of</strong> the Human Factor and its<br />
Implications for Network Dynamics and<br />
Small Business Growth and Development 1<br />
Kwame Owusu-Ampomah<br />
Abstract<br />
This paper explores using network theory, in real terms, to explain economic<br />
growth and/or organizational performance, and its implications for small<br />
business growth and development. Whereas network theory suggests that<br />
networks support organisational and/or economic performance descriptive<br />
notions <strong>of</strong> the concept are vague, and network attributes are difficult to<br />
measure; how networks work is also unclear. Many observers maintain that<br />
trust is the key determinant <strong>of</strong> network outcomes. In this article it is argued<br />
that this position runs the risk <strong>of</strong> reductionism. The paper postulates that the<br />
primary determinant <strong>of</strong> economic performance in network relationships is<br />
the quality <strong>of</strong> the human factor, <strong>of</strong> which trust is only one but an important<br />
component. The relevance <strong>of</strong> this thesis in small business growth and<br />
development is explored, drawing on data from a study on the network<br />
perspective <strong>of</strong> the growth paths <strong>of</strong> small clothing manufacturing enterprises<br />
in Durban.<br />
Keywords: small business growth and development, network theory,<br />
embeddedness, economic performance, trust, human factor.<br />
1 This paper was presented under the title Understanding Network<br />
Dynamics: The Human Factor and Small Business Growth and Development<br />
at the Business Management Conference, 5 th- 7 th November, 2009, at the<br />
Graduate School <strong>of</strong> Business, Faculty <strong>of</strong> Management, <strong>University</strong> <strong>of</strong><br />
<strong>KwaZulu</strong>-<strong>Natal</strong>, Durban, South Africa.<br />
<strong>Alternation</strong> Special Edition 4 (2011) 3 – 29<br />
ISSN 1023-1757<br />
3
Kwame Owusu-Ampomah<br />
Context and Purpose<br />
Interest in network theory and practice, particularly in relation to<br />
organisational performance and national economic growth, has increased<br />
phenomenally in the past two decades or so. Whereas in the real world, most<br />
firms have or are linked to one or more types <strong>of</strong> networks the volume <strong>of</strong><br />
network literature has also increased exponentially across all disciplines.<br />
The surge in interest and logic <strong>of</strong> networks, in part, derives from the widely<br />
documented pragmatic gains arising from networks or networking (see, for<br />
example, Putnam, Leonardi & Nanetti 1993; Uzzi 1996; Lee & Humphreys<br />
2007 and Ofcom 2008) and the notion <strong>of</strong> embeddedness – the notion that<br />
economic behaviour does not occur in a social vacuum but is embedded in<br />
social relations (Granovetter 1985: 485-510). The latter alludes to the<br />
recognition that the social is as important as the economic in exchange<br />
relations. The social is particularly critical in periods <strong>of</strong> economic stress or<br />
failure <strong>of</strong> markets and hierarchies, which in part arises from bounded<br />
rationality, the idea that individuals ‘… are intentionally rational, but only to<br />
a limited extent (Simon 1957b: xxiv, cited in Hardt 2009:34). Shorn <strong>of</strong><br />
bounded rationality, all economic exchange could efficiently be organized<br />
by contract (Williamson 1981:553). Failing this, networks assume an intermediating<br />
role in the exchange system under the assumption that relational<br />
network structures can reduce uncertainty, malfeasance and/or opportunistic<br />
behaviour, and thereby lower transaction costs. This notwithstanding,<br />
descriptive notions <strong>of</strong> networks are vague, and network attributes are <strong>of</strong>ten<br />
difficult to measure. How networks work is also unclear; there is no<br />
consensus on the binding mechanism, which provides coherence to a<br />
network and its outcomes (Gonzales 2006:1). Whereas some analysts point<br />
at licence agreements, shares in equity, subcontracting agreements and/or<br />
values (Gipoulox, 2000:58), others (e.g. Arrow 1972; Fukuyama 1995;<br />
Algan & Cahuc 2007; Yang 2007) isolate trust as the key determinant <strong>of</strong><br />
network coherence and outcomes.<br />
Exploring network theory, in real terms, to explain economic growth<br />
and organisational performance, this article argues that the notion that trust<br />
is the key determinant <strong>of</strong> network coherence and outcomes runs the risk <strong>of</strong><br />
reductionism. The article posits that the primary determinant <strong>of</strong> network<br />
coherence and desirable economic outcomes in network relationships is the<br />
quality <strong>of</strong> the human factor, <strong>of</strong> which trust is only one but an important<br />
4
The Human Factor, Network Dynamics and Small Business Growth ...<br />
component. In other words how networks work is better explained by the<br />
human factor paradigm (HFP). In the rest <strong>of</strong> the article a conceptual<br />
overview <strong>of</strong> networks is provided, focusing on what networks are, and<br />
typology. A discussion <strong>of</strong> the attributes and effects <strong>of</strong> networks follow this.<br />
Next, how networks work is critically analysed; and the human factor<br />
paradigm is advanced as the primary explanatory model for network<br />
coherence and outcomes. The relevance <strong>of</strong> this thesis in small business<br />
growth and development is explored, drawing on data from a recent study on<br />
the network perspective <strong>of</strong> the growth paths <strong>of</strong> small clothing manufacturing<br />
enterprises in Durban.<br />
Networks – A Conceptual Overview<br />
What are Networks?<br />
The term network is not a new phenomenon. In contemporary usage<br />
however, the concept is used in different ways by different people, reflecting<br />
‘some confusion about quite what a network perspective entails’ (Faulkner<br />
& de Rond 2000:20). Some analysts perceive networks as a metaphor,<br />
lacking any properties and strategies to maximise the benefits <strong>of</strong> networks<br />
(Aldrich & Whetten 1981; Ibara 1992, cited in Faulkner & de Rond 2000:<br />
20). Others view networks as a hybrid form <strong>of</strong> organisation located on the<br />
markets-hierarchies spectrum (Thorelli 1986; Powell 1990). Generally,<br />
however, the concept <strong>of</strong> social networks is <strong>of</strong>ten defined as a structure <strong>of</strong><br />
ties or set <strong>of</strong> nodes among actors in a social system or a set <strong>of</strong> high-trust<br />
linkages connecting a set <strong>of</strong> entities (Nohria 1992a:288; Castilla, Hwang,<br />
Granovetter & Granovetter 2000; Gipouloux 2000; Casson 2000:170;<br />
Bogarti & Li 2009:2). For others like Faulkner and de Rond (2000:20),<br />
however, social networks are persistent and structured sets <strong>of</strong> autonomous<br />
players - persons or organisations - who co-operate on the basis <strong>of</strong> implicit<br />
and open-ended contracts.<br />
Besides the general notion <strong>of</strong> social networks two conceptions <strong>of</strong><br />
networks have emerged in recent times. At one level, a network refers to a<br />
new organisational form - the network organisation. It is a form <strong>of</strong><br />
organisation which is integrated across formal groups created by vertical,<br />
horizontal, and spatial differentiation for any type <strong>of</strong> relation, and distinct<br />
from Weberian bureaucracy or hierarchies and markets (Baker 1992; Piore<br />
5
Kwame Owusu-Ampomah<br />
1992). The basis <strong>of</strong> relationships in this new organisational form is also<br />
different from those designed by market or hierarchical authority (Nohria<br />
1992a; Nohria & Eccles 1992:288; Piore 1992:430; Ibara 1992:169; Baker<br />
1992).<br />
All organisations are networks – patterns <strong>of</strong> roles and relationships –<br />
whether or not they fit the network organisation image.<br />
Organisational type depends on the particular pattern and<br />
characteristics <strong>of</strong> the network. For example, a network characterised<br />
by a rigid hierarchical subdivision <strong>of</strong> tasks and roles, vertical<br />
relationships and an administrative apparatus separated from<br />
production is commonly called a bureaucracy. In contrast, a network<br />
characterised by flexibility, decentralized planning and control, and<br />
lateral (as opposed to vertical) ties is closer to the network<br />
organisation type (Baker 1992:399-400).<br />
At another level, a variant <strong>of</strong> the new organisational form derives<br />
from the modern information and telecommunications technologies, e.g.<br />
facsimile, e-mail, teleconferencing, and Internet. Castells (2000:187) calls<br />
this organisational form the network enterprise, defined as ‘that specific<br />
form <strong>of</strong> enterprise whose system <strong>of</strong> means is constituted by the intersection<br />
<strong>of</strong> segments <strong>of</strong> autonomous systems <strong>of</strong> goals’. The conception <strong>of</strong> network<br />
from the information and communication technologies perspective has<br />
drawn conclusions towards a vision <strong>of</strong> Network Nation (Hiltz & Tur<strong>of</strong>f<br />
1978) or Network Society (Castells 2000).<br />
Nohria and Eccles (1992:289) point out that the two conceptions <strong>of</strong><br />
network <strong>of</strong>ten converge but network organisation is not the same as<br />
electronic networks although the latter can, and will play a key role in<br />
shaping the former. For these authors electronically mediated interactions<br />
are not always as effective as face-to-face exchanges. Inasmuch as this may<br />
be true, it can also be argued that the use <strong>of</strong> the electronic medium does not<br />
obliterate the traditional medium <strong>of</strong> communication: printed matter. This<br />
view is likely to be upheld by the actor-network perspective <strong>of</strong> the network<br />
phenomenon which emphasises the human as well as the technical<br />
components in social network relationships but this need not detain us here.<br />
It might suffice to say that actor network perspective recognises an<br />
6
The Human Factor, Network Dynamics and Small Business Growth ...<br />
environment <strong>of</strong> interconnected hybrid entities, and that ‘(i)n networks <strong>of</strong><br />
humans, machines, animals, and matter in general, humans are not the only<br />
beings with agency, not the only ones to act; matter matters’ (Risan 1997).2<br />
Typology <strong>of</strong> Networks<br />
The conceptual uncertainty surrounding network theory is not limited to<br />
what networks are: typology <strong>of</strong> networks is, as well, a source <strong>of</strong> uncertainty.<br />
Inasmuch as many types <strong>of</strong> networks exist, there is also a considerable<br />
degree <strong>of</strong> overlapping. In some cases differences may not be real but a<br />
matter <strong>of</strong> semantics. This is reflected in the works <strong>of</strong> network analysts such<br />
as Redding (1990), Brass and Burkhardt (1992), Ernst (in Castells 2000:<br />
207), Casson (2000), Wu Wei-ping (2000), and Bogarti & Li 2009: 2-3).<br />
Ernst (in Castells 2000:207), for instance, maintains that a great deal <strong>of</strong><br />
economic activity in industries in the global economy is organized around<br />
five different types <strong>of</strong> networks, namely, supplier networks, producer (or<br />
factor) networks, customer networks, standard coalition networks and<br />
technology co-operation.<br />
Whereas Brass and Burkhardt (1992), highlight communication and<br />
fraternal networks, Casson (2000: 178) identifies a spectrum <strong>of</strong> binary<br />
network-types, e.g., regional and inter-regional networks; open and closed<br />
networks; vertical and horizontal networks; and visible and invisible<br />
networks. For Casson (2000), a network may be forgiving or unforgiving;<br />
transparent or opaque; open or closed; tough or lenient; vertical or<br />
horizontal; business or social; and visible or invisible. Bogarti and Li (2009:<br />
2-3) on the other hand observe network types at two levels. At the top level<br />
the typology divides ties into two basic kinds, continuous and discrete; at the<br />
next level, four major groups are identified: similarities, social relations<br />
proper, interactions, and flows. The authors maintain that any or all these<br />
types <strong>of</strong> ties can exist simultaneously, a property known as multiplexity.<br />
Arguably, network theory is a labyrinth <strong>of</strong> conceptual uncertainties,<br />
but this does not appear to significantly undermine its instrumental and/or<br />
2 For more information on actor-networks perspective see, for example,<br />
Callon (1987; 1993); Latour (1992; 1993); Stalder (1997); Risan (1997);<br />
Cordella and Shaik (2006).<br />
7
Kwame Owusu-Ampomah<br />
analytical capacity in the context <strong>of</strong> economic and/or organisational growth<br />
and development. Adapting Hernando de Soto’s insight on what the informal<br />
sector is, we may not be able to define a network accurately but we know it<br />
exists (see de Soto 1989, cited in Parlevliet, Jütting & Xenogiani 2008:1);<br />
the key elements being actors, activities, resources and a binding mechanism<br />
(Gipouloux 2000:58), which is the focus <strong>of</strong> this paper.<br />
Network Characteristics and Effects<br />
Several network analysts, e.g., Ibara (1992), Castells (2000), and Casson<br />
(2000) observe that network outcomes are contingent upon network type and<br />
properties. A well-structured network is an invaluable resource to its<br />
members. Castells, (2000: 187), for example identifies two fundamental<br />
attributes <strong>of</strong> a network that determine a network’s performance: consistency<br />
and connectedness. Consistency refers to the extent to which there is a<br />
sharing <strong>of</strong> interests between a network’s goals and the goals <strong>of</strong> its<br />
components; connectedness, on the other hand, refers to the ability <strong>of</strong> a<br />
network to facilitate noise-free communication between its components, i.e.,<br />
the nature <strong>of</strong> connections and how it facilitates interactions between the<br />
members in a network. The dimensions <strong>of</strong> connectedness include density<br />
(presumably, the most important), positioning, openness, diversity, strength<br />
<strong>of</strong> ties and medium <strong>of</strong> interactions, e.g., face-to-face (FTF), the print and<br />
electronic.<br />
In diverse ways, network characteristics, individually and<br />
collectively, affect exchange outcomes, and this is evident in a large and still<br />
growing body <strong>of</strong> literature (e.g. Perrow 1992; Nohria & Eccles 1992; Uzzi<br />
1996; Villasalero 1999; Chan Kwok Bun & Chee Kiong 2000). Perrow<br />
(1992:460), for instance, maintain that the success <strong>of</strong> networks is the result<br />
<strong>of</strong> economic power <strong>of</strong> economies <strong>of</strong> scale through networks, trust and cooperation<br />
co-existing with competition, and welfare effects <strong>of</strong> networks that<br />
increase the efficiency <strong>of</strong> regions and industries. However, networks could<br />
have fewer welfare functions for society, particularly when an elite that<br />
generates trust among its members becomes powerful and exploitative<br />
(Perrow 1992:463).<br />
Piore (1992), on the other hand, contends that networks facilitate the<br />
deepening <strong>of</strong> social division <strong>of</strong> labour, which enhances expertise and<br />
8
The Human Factor, Network Dynamics and Small Business Growth ...<br />
integration, in a way that markets cannot. Whereas networks tend to enhance<br />
economic performance through inter-firm resource pooling, co-operation,<br />
and co-ordinated adaptation regarding production and information flows,<br />
business decisions and organisational learning (Uzzi 1996), Putnam (1993)<br />
observes that the quality <strong>of</strong> networking is a common factor in vibrant<br />
regional economies and polities:<br />
Networks facilitate flows <strong>of</strong> information about technological<br />
developments, about the creditworthiness <strong>of</strong> would-be entrepreneurs,<br />
about the reliability <strong>of</strong> individual workers, and so on. Innovation<br />
depends on ‘continual informal interaction in cafes and bars and in the<br />
streets.’ Social norms that forestall opportunism are so deeply<br />
internalised that the issue <strong>of</strong> opportunism at the expense <strong>of</strong> community<br />
obligation is said to arise less <strong>of</strong>ten here than in areas characterised by<br />
vertical and clientistic networks. What is crucial about these smallfirm<br />
industrial districts, conclude, most observers, is mutual trust,<br />
social co-operation and a well developed sense <strong>of</strong> civic duty – in short,<br />
the hallmarks <strong>of</strong> the civic community (Putnam 1993:161).<br />
Networks also mediate labour and capital flows, with significant<br />
effects on industry and economic outcomes (Granovetter 1973; Nohria<br />
1992b; Castilla, Hwang, Granovetter & Granovetter 2000; Kwok Bun &<br />
Chee Kiong 2000; Schak 2000). Family and friendship networks are not only<br />
a source <strong>of</strong> start-up capital and recruitment but also hiring <strong>of</strong> trusted and<br />
efficient employees. Granovetter (1973: 1369-1373) observes that<br />
recruitment occurs through the strength <strong>of</strong> weak ties where weak ties are<br />
acquaintances that form better bridges to new contacts and non-redundant<br />
information relative to strong ties, i.e., close friends who invariably know<br />
the same people and have the same information as others in the network.<br />
‘rom the individual’s point <strong>of</strong> view, then, weak ties are an important<br />
resource for possible mobility opportunity’ (Granovetter 1973: 1373).<br />
Burt (1992) provides a mirror image <strong>of</strong> the weak ties argument in his<br />
concept <strong>of</strong> ‘structural holes’ which functions in a similar way as weak ties:<br />
diffusion <strong>of</strong> rich information and knowledge. Although the strength <strong>of</strong> weak<br />
ties argument holds some truth, it does not imply that strong ties can be<br />
discounted. Under certain circumstances strong ties generate internal<br />
9
Kwame Owusu-Ampomah<br />
solidarity and trust with pr<strong>of</strong>ound effect on collective achievements<br />
(Granovetter 1982; Krackhardt 1992).<br />
From the organisational ecology perspective, institutional<br />
embeddedness, i.e. relational density – which in a limited sense, increases<br />
with population density - confers high survival rates on organisations (Baum<br />
& Oliver 1992). Baum and Oliver (1992:541) concur that institutional<br />
relationships act as buffers that protect organisations from environmental<br />
uncertainty and competitive threats to survival. As their reward for their<br />
institutional relationships organisations in a community derive legitimacy,<br />
status and vital resources that enhance their chances <strong>of</strong> survival and growth.<br />
Notwithstanding positive network outcomes, networks could be<br />
cumbersome and costly when there are too many obligations to fulfil (Kwok<br />
Bun & Chee Kiong 2000:74). Dependence on personalized relations, as in<br />
family firms, tends to create problems <strong>of</strong> inheritance and wealth distribution.<br />
In some cases, a firm may dissolve or fragment into separate firms upon the<br />
death <strong>of</strong> the founder. Although family firms are believed to provide an<br />
organisational solution to agency costs in the labour market for managers<br />
and institutional development, strong dependence on family management<br />
coupled with restrictions on family size constrains the firms from optimally<br />
choosing management size. Large families, however, are more likely to have<br />
a larger pool <strong>of</strong> potential managers and end up with bigger firms (Ilias<br />
2005:1).<br />
Unguarded openness could also be detrimental whilst information<br />
flow could be hampered by gatekeepers or disgruntled network partners.<br />
Self-seeking individuals, especially if centrally placed in communication<br />
activity and have control over such activity in a network, may block the flow<br />
<strong>of</strong> information, and considerably impact on the distribution <strong>of</strong> resources<br />
(Marsden 1982:205). Similarly, negative connections do not also facilitate<br />
information flow and distribution <strong>of</strong> resources (Yamagishi, Gillmore &<br />
Cook 1988). Besides, invisible networks tend to be harmful. In opaque<br />
networks, the weak and ordinary members tend to be vulnerable, and easily<br />
fall prey to the strong and powerful members <strong>of</strong> the group (Casson 2000).<br />
In its entirety network theory constructed upon structural and<br />
cognitive properties is problematic: structural analytical approach negates<br />
cultural nuances, agency, process, and the quality <strong>of</strong> the human factor. This<br />
limitation suggests that structural analysis <strong>of</strong> network relations, though<br />
10
The Human Factor, Network Dynamics and Small Business Growth ...<br />
useful, cannot, and does not sufficiently explain economic behaviour and<br />
outcomes. The question may be posed: What, then, makes networks work?<br />
This is discussed in the next section, which also presents a plausible<br />
explanatory model.<br />
How do Networks Work?<br />
How networks work or what makes networks work is not easily perceptible<br />
(Gipouloux 2000:60). Attempts to explain how networks work tend to focus<br />
on co-operation though, paradoxically, co-operation co-exists with<br />
competition in the real world. Analysts <strong>of</strong> diverse theoretical persuasions<br />
explain the rationale for co-operation differently. Explanations range from<br />
administrative and legal precepts, designed to enforce contractual<br />
obligations, to the qualitative properties <strong>of</strong> networks, particularly the idea <strong>of</strong><br />
embeddedness, values, culture and social capital (Gipouloux 200:58). Many<br />
business networks and/or social capital analysts (e.g. Arrow 1972;<br />
Fukuyama 1995; Knack & Keefer 1997; Faulkner & de Rond 2002; Yang<br />
2007)), however, pay particular attention to trust, as the key determinant <strong>of</strong><br />
economic success. For Faulkner and de Rond (2002):<br />
Trust gives rise not only to lower transaction costs and higher<br />
investment returns, but also to more rapid innovation and learning,<br />
according to Sabel (1994), as a consequence <strong>of</strong> a joint problem-solving<br />
attitude by the partners, free from the constraints that follow from<br />
anticipated defection (Faulkner & de Rond 2002:31).<br />
Fukuyama (1995:7) observes that a nation’s (or be as it may, an<br />
organisation’s) well-being, as well as its ability to compete, is conditioned<br />
by a single pervasive cultural characteristic: the level <strong>of</strong> trust inherent in the<br />
society.<br />
Whereas legal-administrative precepts and antecedents are<br />
secondary but important devices to pre-empt transaction costs this paper<br />
argues that the key role assigned to trust in economic performance in the<br />
industrial networks literature is problematic; it runs the risk <strong>of</strong> reductionism,<br />
and as critics <strong>of</strong> reductionism argue, complex systems are inherently<br />
irreducible (wikipedia.org/wiki/Reductionism). Trust does not manifest itself<br />
11
Kwame Owusu-Ampomah<br />
in isolation <strong>of</strong> other human characteristics and values; it does so in pari<br />
passu with several attributes such as honesty, competence, loyalty,<br />
accountability, reputation, discipline and responsibility. The degree to which<br />
one party trusts another is a measure <strong>of</strong> belief in the honesty, benevolence<br />
and competence <strong>of</strong> the other party (wikipedia.org/wiki/Trust). Together with<br />
other personality traits trust elicits appropriate behaviour that contributes to<br />
economic performance.<br />
While it is difficult to refute the role <strong>of</strong> trust in the functioning <strong>of</strong><br />
economies, social institutions, organisations and communities, much <strong>of</strong> the<br />
claim is largely anecdotal and/or intuitive. To isolate and establish trust as a<br />
decisive factor would require a far more rigorous empiricist approach than<br />
has thus far been demonstrated in the literature. Of the few empirical studies<br />
<strong>of</strong> note some have managed to establish a strong correlation, but not<br />
causality between trust and economic performance (e.g. Knack & Keefer<br />
1997). Those studies that appear to have <strong>of</strong>fered a plausible causal<br />
explanation, have only done so indirectly, using a proxy variable (see Aglan<br />
& Cahuc 2007); others have neither found any significant relationship (see<br />
Wei-Ping Wu & Choi 2004) nor uncovered significant evidence to support<br />
the valorisation <strong>of</strong> trust amongst other values (see Adobor 2005; McCarthy<br />
2007, in CDE 2008:32-33). A common trend in the literature has, however,<br />
been the establishment <strong>of</strong> the positive effects <strong>of</strong> socio-cultural factors or<br />
social attitudes, which include trust, on entrepreneurship and economic<br />
performance.<br />
The difficulty <strong>of</strong> measuring the causal impact <strong>of</strong> trust is largely<br />
because trust in a moral sense is a mental state that cannot be measured<br />
directly although confidence in the results <strong>of</strong> trusting may be measured<br />
through behaviour. Alternatively, one can measure self-reported trust, (with<br />
all the caveats surrounding that method) (wikipedia.org/wiki/Trust (social<br />
sciences), and the thrust <strong>of</strong> conceptual complexities underlying trust. On the<br />
latter, for example, it may be asked: What kind <strong>of</strong> trust should be<br />
prioritised? Is it trust evoked by personalised confidence or trust conditioned<br />
by impersonalised or rationalised confidence (Tönnies 1955)? Or in<br />
Luhman’s equivalent terminologies, is it personal trust or system trust?<br />
(Luhman 1979 cited in Holbig 2000:19)<br />
Whereas these questions are essentially rhetorical, it is even<br />
suggested that trust, networks, civil society, and the like are all<br />
12
The Human Factor, Network Dynamics and Small Business Growth ...<br />
epiphenomenal. They arise as a result <strong>of</strong> social capital but do not constitute<br />
social capital itself (Fukuyama 1999: 2). The valorisation <strong>of</strong> social capital,<br />
however, does not resolve the puzzle <strong>of</strong> pinning down the primary<br />
determinant <strong>of</strong> economic progress. Social capital is conceptually<br />
problematic. It has been described as nebulous and unwieldy; an umbrella<br />
concept that means many things to many people (Adler & Seok-Woo Kwon<br />
2002); and something <strong>of</strong> a cure-all (Portes 1998). Nevertheless, used<br />
interchangeably with networks, the concept is not entirely irrelevant as it<br />
rejuvenates interest in culture in relation to economic growth and<br />
development (see Weber 1968). For human factor proponents, however, it is<br />
neither social capital nor just simply trust alone that primarily underscores<br />
economic or organisational performance but the quality <strong>of</strong> the human factor<br />
(See for example, Adjibolosoo 1993; 1995 and Owusu-Ampomah 2001;<br />
2002).<br />
By human factor it is meant the ‘spectrum <strong>of</strong> personality<br />
characteristics and other dimensions <strong>of</strong> human performance that enable [or<br />
disable] social, economic and political institutions to function and remain<br />
functional, over time ….’ (Adjibolosoo 1995: 33). Extending the human<br />
factor concept Owusu-Ampomah (2001: 6) argues that HF also connotes the<br />
entire socio-cultural and political milieu in which the being finds expression,<br />
and which defines its identity, institutions, values, needs, rights, and duties.<br />
This, in effect, implies the social, moral, and political values that promote<br />
social cohesion and guarantee the progress <strong>of</strong> a civic community.<br />
The spectrum <strong>of</strong> personality characteristics includes honesty,<br />
reputation, accountability, trust, commitment and integrity; and the array has<br />
been broadly classified as spiritual capital, aesthetic capital, moral capital,<br />
human capital, human potential and human abilities (Adjibolosoo 1995).<br />
These human characteristics are not only a sine qua non for co-operation and<br />
network outcomes but also, more broadly, for organisational performance<br />
and/or growth and development (Adjbolosoo 1993; 1995). Whereas the<br />
positive human factor <strong>of</strong> persons in a social network may, for instance,<br />
enhance the flow and equitable distribution <strong>of</strong> resources the negative human<br />
factor may compromise the society-wide gains inherent in a social network.<br />
Contextually, networks may be either functional or dysfunctional; and the<br />
mediating factor is the quality <strong>of</strong> the human factor. Networks in which the<br />
components have positive personality traits are more likely to create<br />
13
Kwame Owusu-Ampomah<br />
opportunities and benefits for the greatest majority in a society than those<br />
with negative traits. The negative personality traits have been described as<br />
human factor decay, that is, ‘attitudes, behaviours and actions that are<br />
contrary to principle-centeredness, moral injunctions, and ethical standards’<br />
(Adjibolosoo 2004: 14). The greater the level <strong>of</strong> human factor decay in an<br />
organisation or society the lesser the chances <strong>of</strong> progress; conversely, the<br />
lesser the level <strong>of</strong> human factor decay the greater will be the chances <strong>of</strong><br />
progress. The development <strong>of</strong> appropriate human factor is therefore<br />
imperative for organisational performance or societal progress. In the next<br />
section the relevance <strong>of</strong> this thesis is explored in the context <strong>of</strong> small<br />
business growth and development, drawing on a study by Owusu-Ampomah<br />
(2004) on the network perspective <strong>of</strong> the growth paths <strong>of</strong> the small clothing<br />
manufacturing enterprises (SCMEs) in Durban.<br />
Relevance <strong>of</strong> Thesis: Empirical Evidence<br />
Data Description and Results<br />
The study on the network perspective <strong>of</strong> the growth paths <strong>of</strong> small clothing<br />
manufacturing enterprises in Durban, inter alia, investigated (a) the<br />
relationship between network characteristics (density, openness, diversity<br />
and geography <strong>of</strong> networks) and economic performance <strong>of</strong> small business<br />
(b) the scope <strong>of</strong> networks and inter-firm co-operation amongst the small<br />
clothing manufacturing enterprises in Durban, (c) whether the poor<br />
performance <strong>of</strong> the clothing industry could be attributed, at least, in part, to<br />
inadequate networking and inter-firm co-operation, and if so (d) the reasons<br />
for the inadequate networking and inter-firm co-operation. Ethnographic<br />
data was collected from a sample <strong>of</strong> 61 SCMEs, out <strong>of</strong> a cluster sampling<br />
frame <strong>of</strong> 237 firms. Eligibility was first determined by a simple quantitative<br />
definition <strong>of</strong> small business, i.e., a firm having not more than 200<br />
employees; followed by a random selection <strong>of</strong> firms. The sample size was<br />
influenced largely by the willingness <strong>of</strong> the selected firms to participate in<br />
the study. Besides the sample <strong>of</strong> 61 SCMEs five key actors in the industry -<br />
representing labour and employers’ unions - were selected on the basis <strong>of</strong><br />
purposeful sampling for in-depth interview.<br />
14
The Human Factor, Network Dynamics and Small Business Growth ...<br />
Table 1: A Comparison <strong>of</strong> Very High and Very Low<br />
Performance SCMEs<br />
Characteristics<br />
All Sampled<br />
Firms (N=61)<br />
Source: Owusu-Ampomah (2004)<br />
Combining questionnaire-based and qualitative research approaches,<br />
and descriptive network data and hermeneutic analyses the study found<br />
limited networks and/or networking and inter-firm co-operation amongst the<br />
sampled small clothing manufacturing enterprises (SCMEs) in Durban. The<br />
mean density <strong>of</strong> business networks <strong>of</strong> the sampled firms (N=61) was 23.6,<br />
with a standard deviation <strong>of</strong> 18.76 (Table 1). The maximum density for the<br />
sample was 110, and the minimum was 6. The means for the very high (n=6)<br />
and very low (n=7) performance SCMEs were calculated as 30.2 and 16.6<br />
respectively. Within the very high performance firms (VHPF), the maximum<br />
density <strong>of</strong> network contacts was 50, and the minimum was 15. In contrast the<br />
maximum density <strong>of</strong> network contacts <strong>of</strong> the very low performance firms<br />
(VLPF) was 30, and the minimum was 9.<br />
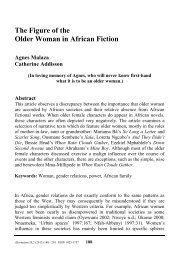
The study strikingly observed that the number <strong>of</strong> networks <strong>of</strong> two<br />
out <strong>of</strong> three <strong>of</strong> the sampled SCMEs did not exceed two dozen, with<br />
diminishing proportions in the higher ranks <strong>of</strong> network contacts (Figure 1).<br />
This was in sharp contrast with network density <strong>of</strong> Chinese firms which<br />
could be several dozen at any particular time (Wei-ping 2000:46).<br />
15<br />
Outliers<br />
(n=13)<br />
Very High<br />
Performance<br />
Firms (n=6)<br />
Size/Density <strong>of</strong> Business<br />
Networks (Direct)<br />
Mean 23.6 22.9 30.2 16.6<br />
Minimum 6 9 15 9<br />
Maximum 110 50 50 30<br />
Standard Deviation 18.76 14.39 16.73 9.02<br />
Openness Index<br />
Mean 52.64 58.9 68.8 50.4<br />
Minimum 30 35 50 35<br />
Maximum 95 80 79 80<br />
Standard Deviation 14.93 16.12 10.3 15.78<br />
Diversity <strong>of</strong> Network<br />
Contacts (Mean Points Scored) 25 20<br />
Geography <strong>of</strong> Contacts<br />
(i) Local only (%) 58 33.0 83.0<br />
(ii) Local and External (%) 42 67.0 17.0<br />
Very Low<br />
Performance<br />
Firms (n=7)
Kwame Owusu-Ampomah<br />
Figure 1. Size <strong>of</strong> Business Networks <strong>of</strong> the Sampled SCMEs<br />
Source: Owusu-Ampomah (2004)<br />
Regarding the extent <strong>of</strong> openness amongst the sampled SCMEs, the<br />
study recorded openness indices <strong>of</strong> 52.64 and 58.9 for the sampled SCMEs<br />
as a whole and the outliers respectively (see Table 1). Strikingly, the<br />
openness index for the VHPFs (68.8) was significantly higher than the index<br />
for the VLPFs, estimated at 50.4. Whereas the data suggested a positive<br />
relationship between openness and economic performance <strong>of</strong> firms, it was<br />
evident that the level <strong>of</strong> openness <strong>of</strong> the sample as whole was extremely low,<br />
and this appeared to partially explain the low performance <strong>of</strong> the sampled<br />
SCMEs in Durban. Similar conclusions were drawn with respect to<br />
diversity, which showed a relatively high mean score for the VHPFs (25),<br />
compared to the mean score <strong>of</strong> the VLPFs (20). On the geography <strong>of</strong><br />
networks, a good majority (67%) <strong>of</strong> the VHPFs had local and external<br />
networks, compared to the VLPFs, an overwhelming majority (83%) <strong>of</strong><br />
which had locally-based networks. The data reflected the relevance <strong>of</strong> the<br />
geography <strong>of</strong> networks in relation to economic performance.<br />
16
The Human Factor, Network Dynamics and Small Business Growth ...<br />
In sum, the statistical data confirmed limited network contacts<br />
and/or networking and inter-firm co-operation amongst the sampled SCMEs<br />
in Durban – to reiterate, network density was low, the firms were<br />
significantly inward-looking, the degree <strong>of</strong> diversity was low, and most <strong>of</strong><br />
the networks were localised. The data also suggested a positive relationship<br />
between network characteristics and economic performance <strong>of</strong> firms.<br />
Density <strong>of</strong> networks and degree <strong>of</strong> openness were higher amongst HPFs than<br />
they were amongst the VLPFs; similarly network diversity and spatial<br />
distribution were more pronounced amongst HPFs than they were amongst<br />
VLPFs (see Table 1). This suggested a positive relationship between<br />
network characteristics and economic performance. In other words the<br />
SCMEs in Durban were more likely to perform better if they were more<br />
open, had high network density which were also diverse, and an appropriate<br />
mix <strong>of</strong> local and external networks. On the basis <strong>of</strong> the statistical data it was<br />
clear that (a) the disparities in the performances <strong>of</strong> the sampled firms, and<br />
(b) the relatively poor performance <strong>of</strong> the industry in Durban as a whole<br />
over the past decade and a half, could be partly explained in terms <strong>of</strong><br />
inadequate networks and/or networking and inter-firm co-operation.<br />
This finding was unanimously confirmed in interviews with a few<br />
key actors in the clothing manufacturing industry in Durban. A Cl<strong>of</strong>ed<br />
<strong>of</strong>ficial observed that inter-firm co-operation within the industry was at one<br />
level primarily pipeline driven. At another level it was needs driven, and<br />
<strong>of</strong>ten occurred at the level <strong>of</strong> policy intervention, particularly where the<br />
government’s trade and industrial policy seemed to have a negative impact<br />
on the industry, and success was not always guaranteed. From labour<br />
perspective relations in the clothing manufacturing sector was anything but<br />
cordial, and clearly not supportive <strong>of</strong> effective inter-firm co-operation:<br />
The small companies are being squeezed by the big companies. If<br />
you are small you’ll be small until you die or don’t survive; if you<br />
are big you’ll be big in order to squeeze those that are small. That’s<br />
the fact <strong>of</strong> the game in South Africa. Small companies are not<br />
enjoying any good co-operation from the bigger companies. In the<br />
clothing sector it is really a disaster area, except that if a big<br />
company wants to outsource some job because they have a huge<br />
customer base that they cannot satisfy then they begin to look for<br />
17
Kwame Owusu-Ampomah<br />
companies that they can outsource to do the work, i.e. CMTs. But they<br />
dictate the price. If you (CMTs) don’t take their price you (they) are<br />
out. They will look for other smaller companies that will take their<br />
price (SACTWU Official 2001).<br />
Comparatively, the Durban cluster appeared to be atypical:<br />
When you look at the Far East the SMMEs are very supportive <strong>of</strong> each<br />
other hence they are very successful in the export market. What they<br />
do is they try and help each other to overcome problems …. all their<br />
problems are dealt with by groups <strong>of</strong> people that have got the interests<br />
<strong>of</strong> the country at heart. In South Africa we work as individuals<br />
because we haven’t been exposed to the culture. To a large extent, that<br />
explains the failure <strong>of</strong> the SMME sector to grow as it should (Cl<strong>of</strong>ed<br />
<strong>of</strong>ficial 2001; e.a.).<br />
Discussion<br />
Several factors account for the low level <strong>of</strong> networking and inter-firm cooperation<br />
which in turn explains, albeit, partially, the poor performances <strong>of</strong><br />
the Durban cluster as a whole. The key factors that came to light in the study<br />
under reference (Owusu-Ampomah 2004) were human factor decay, cultural<br />
and religious differences, and the erstwhile apartheid system. An interview<br />
with an <strong>of</strong>ficial <strong>of</strong> the South African Clothing Workers Union (SACTWU)<br />
in <strong>KwaZulu</strong> <strong>Natal</strong>, was very illuminating, and it is worthwhile quoting him<br />
at length:<br />
There are two sections <strong>of</strong> the Indian community: Muslim and Hindu,<br />
who traditionally do not want any form <strong>of</strong> association with one<br />
another. They don’t co-operate. They even undermine each other,<br />
which badly affects workers and the industry. Even the nature <strong>of</strong> the<br />
relationship they have with their workforce is different. I don’t want to<br />
be unfair to any <strong>of</strong> the religions but to hear a worker say, ‘I don't know<br />
what it means for my employer to go to the Mosque (or Temple, if you<br />
like) and pray while he’s doing this to us’ is bad for business. I am<br />
thirteen years old in the clothing industry so I know that culture and<br />
religion play a role in business (SACTWU 2001; e.a.).<br />
18
The Human Factor, Network Dynamics and Small Business Growth ...<br />
A critical element underlying the lack <strong>of</strong> co-operation between the<br />
Muslim and Hindu owner-managers, and the tendency to undermine one<br />
another, could be attributed to a high level <strong>of</strong> mistrust and suspicion, and a<br />
Cl<strong>of</strong>ed <strong>of</strong>ficial was unambiguously frank about it: ‘When a party approaches<br />
you, and tells you here is an opportunity for, say, export, you ask yourself,<br />
‘Where is the catch?’ That is something <strong>of</strong> a mindset among the actors in the<br />
industry’ (Cl<strong>of</strong>ed Official 2001). Interestingly, the mindset was not only<br />
rooted in religious differences but also in the apartheid system which sowed<br />
seeds <strong>of</strong> fragmentation, hate, selfishness and other forms <strong>of</strong> human factor<br />
decay, and disrupted social and economic relations within and between races<br />
(Maasdorp & Humphreys 1975).<br />
It may be conceded, however, that mistrust is ubiquitous, especially<br />
in a competitive environment. Co-operation is not enhanced where firms<br />
produce the same product and compete in the same market for financial<br />
rewards. In this event homogeneity is antithetical to cooperation and<br />
ultimate success; diversity in specialisation, e.g., by garment components<br />
and gender, may enhance trust co-operation and joint action, say, in export<br />
orders. But this is not a reality in Durban’s clothing manufacturing sector.<br />
Most <strong>of</strong> the firms compete for subcontracts from the big manufacturers and<br />
wholesalers. Specialisation is limited to occupational, age and gender<br />
categories (see Owusu-Ampomah 1997); and specialisation by garment<br />
components which holds much promise for inter-firm co-operation, is yet to<br />
develop on a large scale.<br />
Scholars <strong>of</strong> the New Institutional Economics (NIE) e.g. North<br />
(1981) insist that formal institutions play a significant role in economic<br />
performance. However, as Owusu-Ampomah (2004) observed, the ownermanagers<br />
<strong>of</strong> the sampled SCMEs did not appear to have faith in their formal<br />
network structures - the Clothing Federation <strong>of</strong> Southern Africa and the<br />
<strong>Natal</strong> Clothing Manufacturers’ Association (Cl<strong>of</strong>ed Official 2001). While<br />
this has the potential to exert negative impact on networking, inter-firm cooperation,<br />
and performance, it also suggests that economic actors shape<br />
network structures inasmuch as network structures shape actors’ behaviours<br />
and the performance <strong>of</strong> firms. In this context, informal institutions shaped by<br />
culture, norms, ideology, religious beliefs, values, morals and ethics, <strong>of</strong>ten<br />
neglected by classical and neo-classical economics and the NIE are critical<br />
elements in the growth <strong>of</strong> firms.<br />
19
Kwame Owusu-Ampomah<br />
As observed elsewhere in this paper, Granovetter (1985)<br />
particularly, stresses the embeddedness <strong>of</strong> economic behaviour in social<br />
relations. But while he may be correct in arguing that economic behaviour<br />
cannot be explained by under-socialised (institutional structures) or oversocialised<br />
(general morality) conception <strong>of</strong> humans but by on-going<br />
networks <strong>of</strong> social relations between people (Granovetter 1985:495), he<br />
misses the point that the functioning <strong>of</strong> networks is premised primarily on<br />
the human factor as defined in this paper. From the human factor<br />
perspective, norms, ethics, values, and social relations are not only<br />
instrumental in business performance, but are also ‘environmentally<br />
determined’ (Adjibolosoo 1993:146). For effective and efficient networks,<br />
entrepreneurs must acquire appropriate skills e.g. information skills, and<br />
personality traits such as integrity, loyalty, drive, positive attitude, vision,<br />
negotiation skills, trustworthiness, reliability, reciprocity, willingness to<br />
share, credibility, love, responsibility, and accountability. These skills are<br />
acutely relevant for fruitful strategic alliances and relationships. Ineffective<br />
networks may be the result <strong>of</strong> negative personality traits in entrepreneurs<br />
such as lack <strong>of</strong> management and information skills, cynicism, suspicion,<br />
mistrust, disloyalty, acrimony, deceit, selfishness, fecklessness, dishonesty,<br />
penchant for a free ride, fraudulence, haughtiness, and greed, to mention a<br />
few. Such qualities are antithetical to building sound business relations rich<br />
in information and potentially productive.<br />
Although impersonal social exchange and agency relationships<br />
persist, principals still willingly trust strangers (Shapiro 1987). For most<br />
people however reputation is worth protecting. ‘You sleep with dogs, you<br />
catch fleas’ (Govender 2001), and therefore partnership, for instance, may<br />
be determined not only by opportunity and pr<strong>of</strong>it but also the quality <strong>of</strong> the<br />
human factor <strong>of</strong> potential partners. To be sure, pervasive human factor decay<br />
would discourage co-operation, which in turn would underscore poor<br />
performance, as has been the case with the small clothing manufacturing<br />
enterprises in Durban. Manifesting itself in the larger South African society<br />
as racism, deprivation, corruption, discrimination, and hatred, human factor<br />
decay has historical roots in the ideological values <strong>of</strong> the apartheid system.<br />
This decay has created a condition for entrepreneurial malfeasance and nonco-operation,<br />
resulting in the collective poor performance <strong>of</strong> the SCMEs in<br />
Durban in the last few years, contrary to the collective efficiency theory <strong>of</strong><br />
20
The Human Factor, Network Dynamics and Small Business Growth ...<br />
clusters elsewhere (Marshall 1920; Nadvi 1997). Thus, in the same way as<br />
colonialism killed the entrepreneurial spirit <strong>of</strong> Africans (Adjibolosoo 1999),<br />
apartheid denied blacks in South Africa the opportunity to acquire the<br />
appropriate qualities <strong>of</strong> entrepreneurship and/or build upon whatever<br />
entrepreneurial skills they were endowed with.3<br />
3 It is not implied here that all categories <strong>of</strong> blacks were equally deprived <strong>of</strong><br />
economic participation, ideal for entrepreneurial development. Indians/<br />
Asians enjoyed far more industrial exposure than Africans, and it is not<br />
accidental that, today, they do not only control the Durban economy but also<br />
own a sizeable proportion <strong>of</strong> the country’s wealth. Considering the fact that<br />
the unit <strong>of</strong> analysis <strong>of</strong> the study in question was the clothing manufacturing<br />
industry, which is controlled by the Indian/ Asian community, this viewpoint<br />
is arguable, and ought to be qualified.<br />
21<br />
Instead it opened the<br />
floodgates for horizontal, negative and/or underground networks that are<br />
inconsistent with production coordination, competitiveness and firm/<br />
industry performance in the current international capitalist economy.<br />
However, with the advent <strong>of</strong> the new South Africa, some observers<br />
believe that cultural and religious differences among the SCMEs ownermanagers<br />
are becoming a less serious factor than it was about twenty years<br />
ago.<br />
Culture is certainly an issue but mostly among the older generation,<br />
who are more conservative and traditionalist. The majority in the clothing<br />
industry today regards themselves first as Indian, and Muslim or Hindu,<br />
second. As the young become educated, cultural distinctions tend to blur.<br />
The level <strong>of</strong> education <strong>of</strong> today’s CMT operators is higher than that <strong>of</strong> their<br />
counterparts <strong>of</strong> the past, and what we have today is ‘Westernised-Indian’<br />
who is more open (Cl<strong>of</strong>ed Official 2001).<br />
In spite <strong>of</strong> this, the level <strong>of</strong> openness in general is yet to be<br />
optimised, although the optimum level <strong>of</strong> openness necessary to maximise<br />
the gains from social and business networks is open to conjecture. Perhaps it<br />
is too early to expect too much but if higher levels <strong>of</strong> networking and interfirm<br />
co-operation are a necessary condition for performance enhancement <strong>of</strong><br />
SCMEs, rapid transformation <strong>of</strong> the black entrepreneur is the ultimate<br />
solution.
Kwame Owusu-Ampomah<br />
Conclusion<br />
This article has explored using network theory to explain economic growth<br />
and organisational performance. The article has shown that there are<br />
conceptual uncertainties surrounding networks. Acknowledging the role <strong>of</strong><br />
legal-administrative precepts and trust as important explanatory models for<br />
economic performance, the article maintains that while the legal<br />
administrative precepts are secondary and critical to the reduction <strong>of</strong><br />
transaction costs, trust runs the risk <strong>of</strong> reductionism. The central argument<br />
has been that whereas networks provide opportunities and benefits the<br />
primary determinant <strong>of</strong> network coherence and economic outcomes is the<br />
quality <strong>of</strong> human factor, including but not limited to trust. Trust is an<br />
indicator <strong>of</strong> belief in several attributes <strong>of</strong> the Other, e.g., honesty,<br />
competence, commitment and loyalty, and together with these attributes it<br />
elicits appropriate response and action in exchange relations for economic<br />
performance. On the other hand mistrust and its corresponding negative<br />
attributes, or human factor decay, e.g., dishonesty, incompetence, bad<br />
reputation, and disloyalty tend to undermine economic performance.<br />
Networks may thus be functional or dysfunctional and the primary<br />
determinant is the quality <strong>of</strong> the human factor; not institutions or systems<br />
which by themselves cannot function without a network <strong>of</strong> people who are<br />
committed, loyal, honest and determined to make such institutions and<br />
systems work.<br />
The article has illustrated the implications <strong>of</strong> this thesis in the<br />
context <strong>of</strong> the growth and development <strong>of</strong> the small clothing manufacturing<br />
enterprises in Durban. There is empirical basis to believe that the poor<br />
performance <strong>of</strong> the clothing manufacturing industry in Durban is partly due<br />
to inadequate networking and inter-firm co-operation, and, controlling for<br />
other factors, this in turn is significantly underscored by human factor decay.<br />
Whereas other analysts (e.g. Fukuyama 1995) would point at low-trust as the<br />
key explanatory factor for the poor performance, this paper has shown that it<br />
is not only low-trust but also an array <strong>of</strong> inappropriate personality traits, i.e.,<br />
human factor decay that accounts for it. It is thus fair to argue that the<br />
development <strong>of</strong> appropriate personality traits or human factor is a<br />
precondition for network effectiveness and economic performance.<br />
Entrepreneurs make things happen, not inputs, by themselves; but whereas<br />
this is true, it is the quality <strong>of</strong> entrepreneurship that really matters.<br />
22
The Human Factor, Network Dynamics and Small Business Growth ...<br />
Entrepreneurs who possess appropriate personality traits, including trust,<br />
ceteris paribus, are more likely to succeed than those who do not. Similarly,<br />
industrial districts that boast a network <strong>of</strong> men and women who are<br />
committed to not only their personal successes but also the well-being <strong>of</strong> the<br />
region as a whole, ceteris paribus, is more likely to prosper than industrial<br />
districts in which entrepreneurs show little or no commitment to the<br />
collective good <strong>of</strong> their society. In light <strong>of</strong> this, human factor development<br />
amongst entrepreneurs, focusing on the spectrum <strong>of</strong> appropriate personality<br />
traits and values, not only trust, is a sine qua non for effective networks and<br />
small business growth and development, which in turn constitute a catalyst<br />
for national economic performance.<br />
References<br />
Adler, PS & Seok-Woo Kwon 2002. Social Capital: Prospects for a New<br />
Concept. Academy <strong>of</strong> Management Review 27,1: 17-40.<br />
Adobor, H 2005. Optimal Trust? Uncertainty as a Determinant and Limit to<br />
Trust in Inter-firm Alliances. Leadership & Organization Development<br />
<strong>Journal</strong> 27,7: 537-553.<br />
Adjibolosoo, S 1993. The Human Factor in Development. Scandinavian<br />
<strong>Journal</strong> <strong>of</strong> Development Alternatives 12,4: 139-149.<br />
Adjibolosoo, S 1995. The Human Factor in Developing Africa. Westport:<br />
Praeger.<br />
Aldrich, H & DA Whetten 1981. Organisation-Sets, Action-Sets, and<br />
Networks: Making the Most <strong>of</strong> Simplicity. In Nystrom, PC & WH<br />
Starbuck Nystrom (ed): Handbook <strong>of</strong> Organisational Design. New York:<br />
Oxford <strong>University</strong> Press.<br />
Algan, Y & P Cahuc 2007. Social Attitudes and Economic Development: An<br />
Epidemiological Approach. Available at: http://www.voxeu.org.<br />
(Accessed November 27, 2009.)<br />
Arrow, K 1972. Gifts and Exchanges. Philosophy and Public Affairs 1: 343-<br />
362.<br />
Baker, WE 1992. The Network Organisation in Theory and Practice. In<br />
Nohria, N & RG Eccles (ed): Networks and Organisations: Structure,<br />
Form and Action. Boston: Harvard Business School Press.<br />
23
Kwame Owusu-Ampomah<br />
Baum, JAC & C Oliver 1992. Institutional Embeddedness and the Dynamics<br />
<strong>of</strong> Organisational Populations. American Sociological Review 57,4: 540-<br />
559.<br />
Borgatti, SP & X Li 2009. On Social Network Analysis in a Supply Chain<br />
Context. <strong>Journal</strong> <strong>of</strong> Supply Chain Management Spring: 1-17.<br />
Brass, DJ and ME Burkhardt 1992. Centrality and Power in Organisations. In<br />
Nohria, N & RG Eccles (ed): Networks and Organisations: Structure,<br />
Form and Action. Boston: Harvard Business School Press.<br />
Burt, S 1992. The Social Structure <strong>of</strong> Competition. In Nohria, N & RG Eccles<br />
(ed): Networks and Organisations: Structure, Form and Action. Boston:<br />
Harvard Business School Press.<br />
Callon, M 1987. Society in the Making: The Study <strong>of</strong> Technology as a Tool<br />
for Sociological Analysis. In Bijker, WE, TP Hughes & TJ Pinch (ed):<br />
The Social Construction <strong>of</strong> Technological Systems: New Directions in the<br />
Sociology and History <strong>of</strong> Technology. Cambridge, MA: MIT Press.<br />
Callon, M 1993. Variety and Irreversibility in Networks <strong>of</strong> Technique<br />
Conception and Adoption. In Forray, D & C Freeman (eds): Technology<br />
and the Wealth <strong>of</strong> Nations: Dynamics <strong>of</strong> Constructed Advantage. London:<br />
Pinter.<br />
Casson, M 2000. Enterprise and Leadership: Studies on Firms, Markets and<br />
Networks. Cheltenham: Edward Elgar.<br />
Castells, M 2000. The Information Age: Economy, Society and Culture,<br />
Volume 1. The Rise <strong>of</strong> the Network Society. Oxford: Blackwell.<br />
Castilla, EJ, H Hwang, E Granovetter & M Granovetter, 2000. Social<br />
Networks in Silicon Valley. In Lee, Chong-Moon, WF Miller, MG<br />
Hancock & HS Rowen (ed): The Silicon Valley Edge: A Habitat for<br />
Innovation and Entrepreneurship. Standford, California: Stanford<br />
<strong>University</strong> Press.<br />
Centre for Development and Enterprise (CDE). South Africa’s Door<br />
Knockers: Young People and Unemployment in Metropolitan South<br />
Africa. Available: http://www.cde.org.za. (Accessed on December 02,<br />
2009.)<br />
Chan Kwok Bun & C Kiong 2000. Singaporean Chinese Doing Business in<br />
China. In Chan Kwok Bun (ed): Chinese Business Networks: State,<br />
Economy and Culture. Singapore: Pearson Education Asia.<br />
Cl<strong>of</strong>ed Official, Interview, Sept. 10 2001.<br />
24
The Human Factor, Network Dynamics and Small Business Growth ...<br />
Cordella, A & M Shaik 2006. From Epistemology to Ontology: Challenging<br />
the Constructed ‘truth’ <strong>of</strong> ANT. Department <strong>of</strong> Information Systems<br />
Working Paper Series, No. 143, London School <strong>of</strong> Economics and<br />
Political Science.<br />
De Soto, H 1989. The Other Path. New York: Harper & Row.<br />
Ernst, D 1994. Inter-firms Networks and Market Structure: Driving Forces,<br />
Barriers and Patterns <strong>of</strong> Control. Berkeley, CA: <strong>University</strong> <strong>of</strong> California.<br />
(BRIE Research Paper.)<br />
Faulkner, D & Mde Rond 2000. Perspectives on Co-operative Strategy. In<br />
Faulkner, D & Mde Rond (ed): Cooperative Strategy: Economic,<br />
Business, and Organisational Issues. New York: Oxford <strong>University</strong><br />
Press.<br />
Fukuyama, F 1995. Trust: The Social Virtues and the Creation <strong>of</strong> Prosperity.<br />
London: Hamish Hamilton.<br />
Fukuyama, F 1999. Social Capital and Civil Society. Available at:<br />
http://www.imf.org. (Accessed on July 03, 2008.)<br />
Gipoloux, F 2000. Networks and Guanxi: Towards an Informal Integration<br />
through Common Business Practices in Greater China. In Chan Kwok<br />
Bun (ed): Chinese Business Networks: State, Economy and Culture.<br />
Singapore: Pearson Education Asia.<br />
Gonzalez, M 2006. Bridging Paths to Educational Attainment: Ethnic<br />
Contingencies <strong>of</strong> Bridging and Bonding Forms <strong>of</strong> Social Capital.<br />
Available: http://www.allacademic.com. (Accessed November 11, 2009.)<br />
Granovetter, MS 1973. The Strength <strong>of</strong> Weak Ties. American <strong>Journal</strong> <strong>of</strong><br />
Sociology 78,6: 1360-1380.<br />
Granovetter, MS 1982. The Strength <strong>of</strong> Weak Ties: A Network Theory<br />
Revisited. In Marsden, PV & N Lin (ed): Social Structure and Network<br />
Analysis. London: SAGE Publications.<br />
Granovetter, MS 1985. Economic Action and Social Structure: The Problem<br />
<strong>of</strong> Embeddedness. American <strong>Journal</strong> <strong>of</strong> Sociology 91,3: 481-510.<br />
Hardt, Ł 2009. The History <strong>of</strong> Transaction Cost Economics and its Recent<br />
Developments. Erasmus <strong>Journal</strong> for Philosophy and Economics 2,1,<br />
Summer: 29-51.<br />
Hiltz, SR & M Tur<strong>of</strong>f 1978. The Network Nation: Communication via<br />
Computer. Reading, MA: Addison-Wesley Publishing Company Inc.<br />
Holbig, H 2000. Trust and its Limitations: A Changing Discourse on Money<br />
25
Kwame Owusu-Ampomah<br />
during the People’s Republic <strong>of</strong> China’s Reform Period. In Chan Kwok<br />
Bun (ed): Chinese Business Networks: State, Economy and Culture.<br />
Singapore: Pearson Education Asia Pte Ltd.<br />
Ibarra, H 1992. Structural Alignments, Individual Strategies, and Managerial<br />
Action: Elements Toward a Network Theory <strong>of</strong> Getting Things Done. In<br />
Nohria, N & RG Eccles (ed): Networks and Organisations: Structure,<br />
Form and Action. Boston: Harvard Business School Press.<br />
Ilias, N 2005. Families and Firms: Agency Costs and Labour Market<br />
Imperfections in Sialkot’s Surgical Industry. <strong>Journal</strong> <strong>of</strong> Development<br />
Economics 80: 329-349.<br />
Knack, S & P Keefer 1997. Does Social Capital have an Economic Pay<strong>of</strong>f? A<br />
Cross-country Comparison. Quarterly Economic <strong>Journal</strong> 112: 1251-<br />
1288.<br />
Krackhardt, D 1992. The Strength <strong>of</strong> Strong Ties: The Importance <strong>of</strong> Philos<br />
in Organisations. In Nohria, N & RG Eccles (ed): Networks and<br />
Organisations: Structure, Form and Action. Boston: Harvard Business<br />
School Press.<br />
Latour, B 1992. Where are the Missing Masses? The Sociology <strong>of</strong> a Few<br />
Mundane Artefacts. In Bijker, WL & J Law (ed): Shaping Technology/<br />
Building Society. London: MIT Press.<br />
Latour, B 1993. We Have Never Been Modern. Hemel: Harvester<br />
Wheatsheaf.<br />
Lee, PKC & PK Humphreys 2007. The Role <strong>of</strong> Guanxi in Supply<br />
Management Practices. International <strong>Journal</strong> <strong>of</strong> Production Economics<br />
106,2: 450-467.<br />
Li, PS 2000. Overseas Chinese Networks: A Reassessment. In Chan Kwok<br />
Bun (ed): Chinese Business Networks: State, Economy and Culture.<br />
Singapore: Nordic Institute <strong>of</strong> Asian Studies.<br />
Luhman, N 1979. Trust and Power. Chichester: John Wiley.<br />
Marsden, PV 1982. Brokerage Behaviour in Restricted Exchange Networks.<br />
In Marsden, PV & N Lin (ed): Social Structure and Network Analysis.<br />
Beverly Hills: Sage Publications.<br />
Marshall, A 1920. Principles <strong>of</strong> Economics, London: Macmillan.<br />
McCarthy, J 2007. Giving the Door Knockers a Better Chance for Success.<br />
Research Report commissioned by Centre for Development and<br />
Enterprise, Johannesburg.<br />
26
The Human Factor, Network Dynamics and Small Business Growth ...<br />
Nadvi, K 1997. The Cutting Edge: Collective Efficiency and International<br />
Competitiveness in Pakistan. <strong>University</strong> <strong>of</strong> Sussex, Brighton: Institute <strong>of</strong><br />
Development Studies. (IDS Discussion Paper No. 360.)<br />
Nohria, N & RG Eccles 1992. Face-to-Face: Making Network Organisations<br />
Work. In Nohria, N & RG Eccles (ed): Networks and Organisations:<br />
Structure, Form and Action. Boston: Harvard Business School Press.<br />
Office <strong>of</strong> Communication (Ofcom) 2008. Social Networking: A Quantitative<br />
and Qualitative Research Report into Attitudes, Behaviours and Use.<br />
Available: http://www.<strong>of</strong>com.org.uk. (Accessed: November 02, 2009.)<br />
Owusu-Ampomah, K 1997. The Export Potential <strong>of</strong> Small, Micro and<br />
Medium Enterprises: The Case <strong>of</strong> the Clothing Industry in the Durban<br />
Metropolis. Unpublished MA Thesis.<br />
Owusu-Ampomah, K 2001. The Human Factor in Social Policy Formulation<br />
and Implementation in Emerging Democracies. Review <strong>of</strong> Human Factor<br />
Studies 7,1: 1-43.<br />
Owusu-Ampomah, K 2004. The Growth Paths <strong>of</strong> Small Business in a<br />
Competitive Global Economy: The Network Perspective in the Context <strong>of</strong><br />
the Clothing Manufacturing Industry in Durban. Unpublished DBA<br />
Thesis.<br />
Parlevliet, J, J Jütting & T Xenogiani, 2008. Informal Employment: Can We<br />
Tame the Beast? Paris: OECD Development Centre. (Policy Insights, No.<br />
56, Jan 2008.)<br />
Perrow, C 1992. Small-Firm Networks. In Nohria, N & RG Eccles (ed):<br />
Networks and Organizations: Structure, Form and Action. Boston:<br />
Harvard Business School Press.<br />
Piore, MJ 1992. Fragments <strong>of</strong> a Cognitive Theory <strong>of</strong> Technological Change<br />
and Organisational Structure. In Nohria, N & RG Eccles (ed): Networks<br />
and Organisations: Structure, Form and Action. Boston: Harvard<br />
Business School Press.<br />
Portes, A 1998. Social Capital: Its Origins and Applications in Modern<br />
Sociology. Annual Review <strong>of</strong> Sociology 24: 1-24.<br />
Powell, WW 1990. Neither Market nor Hierarchy: Network Forms <strong>of</strong><br />
Organisation. Research in Organisational Behaviour 12: 295-336.<br />
Putnam, RD with R Leonardi & RY Nanetti (1993). Making Democracy<br />
Work: Civic Traditions in Modern Italy. Princeton, NJ: Princeton<br />
<strong>University</strong> Press.<br />
27
Kwame Owusu-Ampomah<br />
Putnam, R 2000. Bowling Alone: The Collapse and Revival <strong>of</strong> American<br />
Community. New York: Simon and Schuster.<br />
Risan, LC 1997. Artificial Life: A Technoscience Leaving Modernity? An<br />
Anthropology <strong>of</strong> Subjects and Objects. Available: http://www.<br />
anthrobase.net. (Accessed: October 18, 2009.)<br />
Rocha, Hector O and R Sternberg 2005. Entrepreneurship: The Role <strong>of</strong><br />
Clusters Theoretical Perspectives and Empirical Evidence from Germany.<br />
Small Business and Economics 24,3: 267-292.<br />
SACTWU Official, Interview, September, 10 2001.<br />
Schak, DC 2000. Networks and their Uses in the Taiwanese Society. In<br />
Nohria, N & RG Eccles (ed): Networks and Organisations: Structure,<br />
Form and Action. Boston: Harvard Business School Press.<br />
Shapiro, SP 1987. The Social Control <strong>of</strong> Impersonal Trust. American <strong>Journal</strong><br />
<strong>of</strong> Sociology 93,3: 623-658.<br />
Stalder, F 1997. Actor-Network-Theory and Communication Networks:<br />
Towards Convergence. Available: http://felix.openflows.org/. (Accessed:<br />
August 24, 2009.)<br />
Thorelli, HB 1986. Networks: Between Markets and Hierarchies. Strategic<br />
Management <strong>Journal</strong> 7: 37-51.<br />
Tönnies, F 1955. Community and Association (Gemeinschaft und<br />
Gesellschaft). Translated and Supplemented by C. P. Loomis. London:<br />
Routledge & Kegan Paul.<br />
Uzzi, B 1996. The Sources and Consequences <strong>of</strong> Embeddedness for the<br />
Economic Performance <strong>of</strong> Organizations: The Network Effect. American<br />
Sociological Review 61,4: 674-698.<br />
Villasalero, M 1999. A Modern Contractual Approach to Inter-firm Flows <strong>of</strong><br />
Knowledge in Industrial Districts among Small and Medium-Sized<br />
Enterprises: Towards an Optimum Structure. Available: http://www.<br />
sbaer.uca.edu. (Accessed: February 02, 2001.)<br />
Wikipedia 2009. Trust (Social Services). Available at: http://en.wikipedia.<br />
org. (Accessed: September 05, 2009.)<br />
Wikipedia 2009. Reductionism. Available at: http://www.en.wikipedia.org.<br />
(Accessed on September 05 2009.)<br />
Williamson, OE 1981. The Economics <strong>of</strong> Organisation: The Transaction Cost<br />
Approach. American <strong>Journal</strong> <strong>of</strong> Sociology 87,3: 548-577.<br />
Wu Wei-ping 2000. Transaction Cost, Cultural Values and Chinese Business<br />
28
The Human Factor, Network Dynamics and Small Business Growth ...<br />
Networks: An Integrated Approach. In Chan Kwok Bun (ed): Chinese<br />
Business Networks: State, Economy and Culture. Singapore: NIAS<br />
Publishing, Nordic Institute <strong>of</strong> Asia Studies.<br />
Wei-ping Wu & WL Choi 2004. Transaction Cost, Social Capital and Firms<br />
Synergy Creation in Chinese Business Networks: An Integrative<br />
Approach. Asia Pacific <strong>Journal</strong> <strong>of</strong> Management 21,3: 325-343.<br />
Yang, P 2007. Government Behaviour and Trust: The Case <strong>of</strong> China. CATO<br />
<strong>Journal</strong> 27,3,Fall.<br />
Yamagishi, T, MR Gillmore & KS Cook 1988. Network Connections and the<br />
Distribution <strong>of</strong> Power in Exchange Networks. American <strong>Journal</strong> <strong>of</strong><br />
Sociology 93,4: 833-851.<br />
K. Owusu-Ampomah<br />
Health Economics and HIV and AIDS<br />
Research Division (HEARD),<br />
Faculty <strong>of</strong> Management<br />
<strong>University</strong> <strong>of</strong> <strong>KwaZulu</strong>-<strong>Natal</strong>,<br />
Durban, South Africa<br />
owusuk@ukzn.ac.za<br />
29
An Orientation and Roadmap to<br />
Simulation and Gaming<br />
Cecile Gerwel<br />
Shamim Bodhanya<br />
Abstract<br />
Simulation and gaming have a rich and long history in the fields <strong>of</strong><br />
organisational theory and social policy. Simulations have been applied in a<br />
variety <strong>of</strong> ways and to achieve myriad different purposes. They have been<br />
used for pedagogical purposes in under-graduate, post-graduate and<br />
executive education. They have been applied in a variety <strong>of</strong> domains such as<br />
agriculture, landscape dynamics, natural resources management and strategic<br />
management, as a form <strong>of</strong> social learning and to contribute to policy<br />
development and implementation. Other areas <strong>of</strong> simulation use have been<br />
in the domain <strong>of</strong> organisational learning and change. Although not quite as<br />
common, simulations have been utilised as an additional method <strong>of</strong> research,<br />
especially in relation to theory building and testing. Given this wide and<br />
disparate purposes and applications <strong>of</strong> simulation, it appears quite confusing<br />
and complex to researchers who may wish to benefit from the field. At a<br />
theoretical level, this paper seeks to provide an ordering mechanism to help<br />
make sense <strong>of</strong> simulation and gaming, their objectives, essential components<br />
and relationships between them, strengths and weaknesses, design<br />
approaches, modalities and deployment. At a practical level, the paper <strong>of</strong>fers<br />
suggestions on whether to utilise simulations and when, the importance <strong>of</strong><br />
the various phases <strong>of</strong> running simulations, the significance <strong>of</strong> debriefing, and<br />
drawing relationships back to real world contexts. It is anticipated that the<br />
paper may serve as roadmap for those who wish to apply simulations in a<br />
variety <strong>of</strong> contexts including teaching and learning, social policy, change<br />
management, and problem solving and decision-making in complex and<br />
uncertain contexts.<br />
<strong>Alternation</strong> Special Edition 4 (2011) 30 – 47<br />
ISSN 1023-1757<br />
30
An Orientation and Roadmap to Simulation and Gaming<br />
Keywords: Simulation and gaming, change management, social learning,<br />
complexity.<br />
Introduction<br />
Thiagarajan (2003: 235) defines a simulation as ‘the representation <strong>of</strong> the<br />
objects, characteristics, behaviours, and relationships <strong>of</strong> one system through<br />
the use <strong>of</strong> another system, which contains play objects, goals, rules and<br />
roles. A simulation is therefore an operational model that allows participants<br />
to view a certain system rather than just certain aspects there<strong>of</strong> (Le Roux &<br />
Steyn 2007). A simulation <strong>of</strong>fers incredible learning opportunities by<br />
engaging participants in a unique learning from experience approach.<br />
Attention must however be paid to the many factors that can influence the<br />
effectiveness <strong>of</strong> simulations.<br />
Simulations can enhance learning and may be employed by a diverse<br />
audience, including those from organisational, teaching and learning, and<br />
research backgrounds. This paper therefore sets out to familiarise the reader<br />
on the potential <strong>of</strong> utilising simulations, whether it be for academic or<br />
organisational purposes. The paper commences by elaborating on the<br />
learning from experience approach found in simulations, as well as the<br />
appropriateness for use in complex and uncertain situations. This is followed<br />
by a section, which deals with the benefits <strong>of</strong> using simulations. The focus<br />
then shifts to the various settings in which simulations can be used. This<br />
subsequently leads into concerns around designing simulations, and the<br />
conducting there<strong>of</strong>. A brief conclusion is then presented.<br />
Experiential Learning and Complexity<br />
Simulations <strong>of</strong>fer a significantly different and powerful route to learning by<br />
immersing participants in a safe environment where they learn from<br />
experience. Lane (1995) draws upon Kolb’s model <strong>of</strong> experiential learning<br />
to explain how this occurs. This comprises <strong>of</strong> participants having concrete<br />
experiences, which leads them to observe and reflect on the experience,<br />
thereby promoting the development <strong>of</strong> abstract concepts that should then be<br />
applied and tested.<br />
31
Cecile Gerwel & Shamim Bodhanya<br />
Figure 1: Experiential learning cycle (Kolb 1984 in Enciso 2001: 10)<br />
The experiential learning method presents a way <strong>of</strong> captivating the<br />
attention <strong>of</strong> those involved. It engages the mental faculties, resulting in<br />
participants actively digesting information through involvement in a learning<br />
environment (Feinstein, Mann & Corsun 2002). Through the experiential<br />
perspective, participants work through an actual and complex problem by<br />
learning through various stages (Geurts, Duke & Vermeulen 2007). This<br />
then means that simulations are also appropriate for use in complex and<br />
uncertain situations. This is pertinent in situations where precedent means<br />
very little, and can assist in diagnosis and decision-making in uncertain<br />
conditions (Geurts et al. 2007; Dooley 2002). Self-organisation in a<br />
simulation occurs when behaviour emerges from the actions <strong>of</strong> various<br />
entities; important to note is that no one controls this and that the emergent<br />
behaviour has its own rules and laws (Dooley 2002). This feature is<br />
particularly potent in <strong>of</strong>fering an alternative to traditional educational<br />
approaches, whether it is in a tertiary institution or organisational<br />
setting.<br />
Participants can better comprehend complex systems, thereby<br />
allowing for the acquisition <strong>of</strong> systemic skills (Enciso 2001). Enhancing<br />
such skills can benefit learners and impact positively on various spheres <strong>of</strong><br />
their lives. Simulations can also challenge common misperceptions that<br />
people have concerning what they think they know for certain, to rather<br />
discover emerging possibilities from specific actions (Leigh 2004).<br />
32
An Orientation and Roadmap to Simulation and Gaming<br />
Benefits <strong>of</strong> Using Simulations<br />
Reframing Mental Models<br />
Simulations <strong>of</strong>fer powerful cognitive learning, which have far reaching<br />
consequences that tap into mental models (Dentico 1999). An effective<br />
simulation therefore portrays shared mental models and produces holistic<br />
communication (Keys, Fulmer & Stumpf 1996). The sort <strong>of</strong> learning where<br />
people engage in processes <strong>of</strong> interpretation is encouraged, in order for<br />
people to understand each other’s thoughts and decision-making to<br />
consequently react effectively (Fannon 2003).<br />
Double-loop Learning<br />
People can be encouraged to do things differently, through the double-loop<br />
learning from the various roles, rules and behaviours found in simulation<br />
(Serrano et al. 2006). This deeper learning is achieved when the existing<br />
ways <strong>of</strong> thinking about how we go about things are challenged (Enciso<br />
2001). Future behaviour is affected as participants become more cognisant.<br />
Simulations also incorporate cognition and emotion resulting in active<br />
learning to facilitate with dynamic and complex situations (Enciso 2001).<br />
The emotional aspects <strong>of</strong> the learner are thus acknowledged and embraced to<br />
enhance the learning experience.<br />
Organisational Learning<br />
Simulations can be particularly beneficial for organisations. Wenzler and<br />
Chartier (1999) argue that simulations are crucial to organisational learning,<br />
where the focus is on an organisation’s ability to continuously learn and<br />
adapt to changes, rather than on attempting to forecast the future.<br />
Organisations can use this as an opportunity to approach change<br />
management from a very different angle that could have long-term benefits.<br />
Simulations provide an opportunity for reflection, experimentation, and<br />
action, and are useful in facilitating learning within the organisation (Keys et<br />
al. 1996). Furthermore, the outlook and behaviours <strong>of</strong> participants can<br />
change through their involvement in the simulation (Keys et al. 1996). It is<br />
important to note though that this is achieved in an unforced and natural<br />
manner, as opposed to the method <strong>of</strong>ten found in most traditional<br />
educational approaches.<br />
33
Cecile Gerwel & Shamim Bodhanya<br />
Simulations also play a role in strengthening relationships between<br />
organisational members. Independent exploration is promoted (Adobor &<br />
Daneshfar 2006) but Pivec, Dziabenko and Schinnerl (2003) also point to a<br />
community <strong>of</strong> learning, which occurs through participants communicating<br />
their ideas, problems and solutions to each other. This joint learning is key<br />
to organisational effectiveness.<br />
Problem-solving<br />
It is useful to present people with a full view <strong>of</strong> how things work, but this is<br />
however not easily accomplished. Simulations can illustrate ‘the totality <strong>of</strong> a<br />
model and the dynamics <strong>of</strong> a system’ and prove critical in showing<br />
participants a holistic view <strong>of</strong> a problem (Geurts et al. 2007: 544). This is<br />
important in having them contribute towards solving the problem, and in so<br />
doing become accountable. Simulations allow participants to be introduced<br />
to the situation and problem, and they are encouraged to work towards<br />
solving it; thus, content is self-discovered (Lane 1995). Another important<br />
aspect is that participants may discover new features to a problem, as well as<br />
idea generation that can be considered by others (Geurts et al. 2007).<br />
Simulations can thus elicit creativity and increase respect and initiative<br />
amongst participants. Simulations can also unearth how people naturally<br />
deal with problems and relate to others in the real world (Stumpf, Watson &<br />
Rustogi 1994). This can assist participants in directing future behaviour.<br />
Simulations provide a ‘rich’ experience due to the complex types <strong>of</strong><br />
knowledge and the mixture <strong>of</strong> human reactions, emotions and interactions<br />
involved (Lane 1995). The richness also originates from the variety <strong>of</strong> issues<br />
involved, and it is this that allows for the creation <strong>of</strong> a new world emerging<br />
during the simulation (Stumpf et al. 1994). This includes participants<br />
choosing to investigate certain issues, who will be responsible for making<br />
choices, power distribution, climate and actions. A simulation can therefore<br />
be used to deal with an array <strong>of</strong> issues, which people may not even have<br />
been aware <strong>of</strong>. It is also more efficient to discuss all the issues concurrently,<br />
and while still fresh in the minds <strong>of</strong> the participants.<br />
It is <strong>of</strong>ten difficult to analyse events, which are not in real time.<br />
During the rounds in a simulation, ordinarily slow processes are sped up and<br />
vice versa (Jackson 2004). Participants can therefore see the outcomes <strong>of</strong> a<br />
34
An Orientation and Roadmap to Simulation and Gaming<br />
decision in minimal time. The time pressure can also reveal a great deal to<br />
participants. Time constraints and uncertainties can affect the manner in<br />
which participants’ access and share information, and contributes to<br />
bounded rationality (Stumpf et al. 1994). Simulation can help participants<br />
understand how processes are influenced by limited information and<br />
resources in reality. In the process, participants can develop critical skills<br />
such as decision-making and negotiation (Pivec et al. 2003) in the safety <strong>of</strong><br />
the simulation where there are no serious consequences (Fannon 2003).<br />
Participants can therefore unreservedly become more adept.<br />
Communication and Participation<br />
Simulations can be used to engage various individuals in meaningful<br />
processes <strong>of</strong> communication and participation. It can be used to facilitate<br />
communication in complex situations with various groups in discussing<br />
ideas and closing communication gaps (Geurts et al. 2007). This is useful in<br />
almost any context. Barreteau, Le Page and Perez (2007) contend that<br />
simulations permit for legitimate and candid articulation from all<br />
stakeholders by promoting communication, positive dialogue, clarity and<br />
training in a complex system. Furthermore, if various participants from<br />
different organisational levels and backgrounds, as well as top management,<br />
are involved in the simulation, organisational learning can be great (Keys et<br />
al. 1996). Simulations can thus be used to negotiate through difficult<br />
situations involving people from various backgrounds who may have<br />
conflicting views. Simulations can also assist organisational members to see<br />
how their own role and that <strong>of</strong> others fits into the big picture. Simulations<br />
thus strengthen ties between those dealing with common resources and<br />
ensure future exchange among participants (Barreteau et al. 2007).<br />
Testing<br />
A problem faced by many organisations is that they <strong>of</strong>ten rush into<br />
implementation without consideration for a variety <strong>of</strong> factors. Simulations<br />
can aid an organisation confronted with significant change requirements in<br />
that strategy and implementation can be practised in a risk-free environment<br />
(Keys et al. 1996). Enciso (2001) also points out that testing can repeated as<br />
35
Cecile Gerwel & Shamim Bodhanya<br />
many times as possible. This allows the organisation to be proactive and take<br />
corrective action before implementation <strong>of</strong> the change. Furthermore,<br />
participants can assess whether their skills are indeed adequate to embrace<br />
the new changes.<br />
Settings for Simulation Use<br />
Before proceeding into the different contexts where simulations can be used,<br />
it is useful to point out that most simulations can be computer-based or<br />
interactive. Computer-based simulations essentially use mathematics or<br />
object representations to imitate characteristics <strong>of</strong> a system (Feinstein et al.<br />
2002). A problem with such simulations however, is that interpersonal<br />
learning and human processes cannot be effectively represented (Feinstein et<br />
al. 2002; Dentico 1999).<br />
Simulations that do not utilise computers are interpersonal and focus<br />
on behavioural learning, with the aim <strong>of</strong> achieving agreement amongst<br />
stakeholders by experimenting and validating requirements for information<br />
and coordination (Keys & Wolfe 1990; Dentico 1999). It is suggested that<br />
the intended learning outcomes dictate the chosen simulation method<br />
(Feinstein et al. 2002).<br />
Educational<br />
It has been found that games are <strong>of</strong>ten preferred over conventional exercises<br />
(Pannese & Carlesi 2007). An example is that <strong>of</strong> case studies. Case studies<br />
are frequently used to assist learners but, as Fripp (1994) argues, fail in<br />
providing participants with a chance to experience the outcomes <strong>of</strong> their<br />
choices. Another problem is that case studies lead to single loop learning,<br />
whereas simulations <strong>of</strong>fer double loop learning (Dentico 1999). Single-loop<br />
learning <strong>of</strong>ten results in short-term benefits and will probably be less<br />
effective. Simulations can therefore provide a fresh perspective to usual<br />
learning activities.<br />
Simulation methods have been employed in many educational<br />
settings, both for under-graduate and post-graduate purposes and for a<br />
variety <strong>of</strong> subjects. Some <strong>of</strong> these include knowledge management,<br />
entrepreneurial learning and strategic management (Chua 2005; Pittaway &<br />
36
An Orientation and Roadmap to Simulation and Gaming<br />
Cope 2007; Zantow, Knowlton & Sharp 2005). Emphasis is placed on<br />
highlighting the importance <strong>of</strong> acquiring practical experience to either<br />
solidify concepts or to develop pr<strong>of</strong>essional skills necessary for students to<br />
enter into future careers. This could be a way <strong>of</strong> addressing a common<br />
criticism that tertiary institutions <strong>of</strong>ten produce graduates who are illprepared<br />
for the world <strong>of</strong> work.<br />
Organisational<br />
Much emphasis is <strong>of</strong>ten placed on finding ways <strong>of</strong> engaging adults in<br />
learning processes. The use <strong>of</strong> simulations in a business context can<br />
therefore be particularly useful in this regard. Simulations have been used<br />
for learning in areas such as, agriculture, landscape dynamics, natural<br />
resources management, strategic management, and policy development<br />
(Dionnet et al. 2008; Depigny & Michelin 2007; Barreteau et al. 2007;<br />
Zantow et al. 2005; Geurts et al. 2007). Simulations are powerful tools <strong>of</strong><br />
teaching (Jackson 2004) and are ideal for adult employees in organisations<br />
(Green 2002; Pivec et al. 2003). Business games model a whole or partial<br />
organisation, so that participants are able to see the connections (Pivec et al.<br />
2003). This can enable individuals in various departments to better<br />
comprehend the organisation. There are also benefits in engaging learners in<br />
environments where they experience similarities to that at work (Feinstein et<br />
al. 2002). This is most likely to get their attention.<br />
The active component <strong>of</strong> simulation as opposed to many approaches,<br />
which involve mere listening, appeals to executives and an array <strong>of</strong> problems<br />
can be dealt with in minimal time, thereby accelerating learning (Fripp<br />
1994). Simulations therefore encompass the utilisation and not only the<br />
knowledge <strong>of</strong> facts and ideas, which entails a move from passive to active<br />
learning (Jackson 2004). This is critical in understanding why isolated<br />
training and/or education programmes may be insufficient. Simulations<br />
allow participants to produce new knowledge by interpreting their decisions<br />
and actions (Enciso 2001). This is a way for participants to become involved<br />
and responsible in their own learning.<br />
A few examples <strong>of</strong> simulations utilised in organisational settings, as<br />
presented by Lane (1995) are briefly presented. Fish Banks is a game that<br />
teaches sustainable management in the fishing industry by allowing<br />
37
Cecile Gerwel & Shamim Bodhanya<br />
participants to experience the benefits <strong>of</strong> initial success, which is later<br />
followed by the sudden depletion <strong>of</strong> the resource. The Beer Distribution<br />
Game aims to illustrate the dynamic behaviour <strong>of</strong> systems by allowing<br />
participants to be in charge <strong>of</strong> an integrated beer production, distribution,<br />
wholesaling and retail organisation. People Express Airline is focused on the<br />
factors that limit growth in organisations and aims to encourage long-term<br />
strategic thinking. These examples therefore illustrate the powerful learning<br />
outcomes that can be imparted through participation in a simulation.<br />
Research<br />
Simulations can also be used to aid in research. This is useful in theory<br />
testing and building (Dooley 2002). Simulation is thus seen as a different<br />
approach to conducting scientific studies, and can be viewed as ‘a third way<br />
<strong>of</strong> doing science’ (Axelrod 1997: 5). Simulations are ideal due to the<br />
observations that can be made in the setting, which then allows for the<br />
discovery <strong>of</strong> theoretically pertinent behaviour and outcomes (Feld 1997).<br />
Simulations also permit for observations into the future, unlike most<br />
research methods which examine the past (Dooley 2002). Researchers can<br />
thus engage in very stimulating studies. An appeal by Keys and Wolfe<br />
(1990) specifically calls for research into management gaming.<br />
Designing Simulations<br />
There are many notable existing simulations which can be utilised. The<br />
following points can however provide guidance in designing a simulation, if<br />
there is a need to construct a specialised simulation.<br />
Collaboration in the Design Phase<br />
There are many benefits in involving various individuals in the design phase.<br />
Firstly, it is useful to interview internal and external stakeholders to<br />
determine problem boundaries (Geurts et al. 2007). Furthermore,<br />
stakeholders will be in a better position to comprehend models and improve<br />
their knowledge by participating in the simulation with the result that a<br />
variety <strong>of</strong> opinions can be expressed (Barreteau et al. 2007). It is also<br />
important in that the models actually end up being examined, due to having<br />
38
An Orientation and Roadmap to Simulation and Gaming<br />
those who actually do the work, be involved in the simulation (Savolainen<br />
1997). Such feedback can be used for the evaluation <strong>of</strong> the simulation.<br />
Another benefit is that participants will respond more readily to learning,<br />
when they feel that those at the top are involved and support the simulation<br />
(Green 2002).<br />
Problem Identification and Illustration<br />
The importance <strong>of</strong> consulting relevant literature is emphasised. Chua (2005)<br />
argues that not only should games be based on a sound, methodologically<br />
and empirically tested conceptual model, but also that applicable literature<br />
must be consulted. Reviewing the literature thus allows for identification <strong>of</strong><br />
related models and concepts so that critical issues and events can be<br />
included in the simulation (Geurts et al. 2007; Chua 2005).<br />
The problem should then be identified and its causes and<br />
characteristics be determined, and subsequent to that is the simplification<br />
and effective representation <strong>of</strong> critical elements (Leigh 2004). A model<br />
therefore is a simplified representation <strong>of</strong> the real world. It is necessary to<br />
simplify aspects in order to grasp the basics (Axelrod 1997); thus, the focus<br />
is not on exact duplication (Feinstein et al. 2002). This leads to the notion <strong>of</strong><br />
verisimilitude, which is extremely important in simulations. Verisimilitude<br />
refers to the activities in the simulation being similar to those in the real<br />
world, so that participants can carry over experiential lessons to the real<br />
world (Lane 1995). This therefore means that participants are able to make<br />
critical connections to their reality.<br />
Simulations also need to display outward simplicity, while still<br />
encompassing inner complexity, in order for participants to better<br />
understand issues by focusing on the achievement <strong>of</strong> a few goals (Borodzicz<br />
2004). Research from Adobor and Daneshfar’s (2006) study clearly<br />
indicates a link between individual learning, and that <strong>of</strong> the realism and userfriendliness<br />
<strong>of</strong> the simulation. It is recommended that a balance exists<br />
between simplification needed to grasp processes and realism to link this to<br />
reality, as this ensures that participants feel confident yet free (Barreteau et<br />
al. 2007).<br />
Learners<br />
Learners, and precisely what they should learn needs to be determined<br />
39
Cecile Gerwel & Shamim Bodhanya<br />
(Leigh 2004; Pivec et al. 2003). This would entail taking into account the<br />
individuality <strong>of</strong> those involved. Green (2002) warns <strong>of</strong> simulations failing<br />
unless the significance <strong>of</strong> comprehending what intensifies the learning<br />
experience is identified. Furthermore, what learners need to do and the<br />
materials that they require must be considered (Leigh 2004).<br />
Conducting Simulations<br />
Simulations essentially consist <strong>of</strong> three set sequences: briefing, the action<br />
and debriefing, as well as further interrelated elements composed <strong>of</strong> rules<br />
which govern actions, specific roles and the relevant situations, and any<br />
physical records (Leigh 2004).<br />
Briefing<br />
This phase run by the facilitator is usually not as lengthy as the rest, and<br />
essentially involves captivating the interest <strong>of</strong> participants (Leigh 2004). It<br />
may be necessary to highlight the learning objectives <strong>of</strong> the simulation<br />
(Adobor & Daneshfar 2006) as well as the rules and requirements (Chua<br />
2005). This phase although brief, is nonetheless important in ensuring that<br />
the simulation proceeds well.<br />
Chua (2005) also advises administrators to incorporate aspects <strong>of</strong><br />
theory, practice and assurance in the briefing. Furthermore, the intention <strong>of</strong><br />
the simulation can be explained and this can be an opportunity to ease any<br />
fears by perhaps having a question and answer session (Chua 2005). It may<br />
be useful to point out that participants can note actions and behaviours,<br />
which can be discussed later. This will be useful during the debriefing<br />
phase.<br />
Roles Assumed<br />
Barreteau et al. (2007) draw attention to roles being formed by simulating<br />
certain features <strong>of</strong> people in the real world. This is influenced by access to<br />
resources, personal assets and goals, environmental factors, and behaviours.<br />
Players are assigned these simulated roles which may, or may not be similar<br />
to their reality, as is the case <strong>of</strong> those who play opposite roles. It is thus<br />
important that designers and facilitators bear this in mind.<br />
40
An Orientation and Roadmap to Simulation and Gaming<br />
During the actual simulation, participants construct their<br />
experiences, play their roles and meet set goals, whereas the facilitator steps<br />
aside to observe, and may circulate necessary information (Leigh 2004). The<br />
facilitator should therefore not interfere but should rather allow the<br />
simulation to unfold naturally. It is important that participants play various<br />
roles so they can acquire knowledge, practical experience and s<strong>of</strong>t skills<br />
(Pivec et al. 2003). Participants must discover for themselves what it feels<br />
like to be in a specific role, along with the accompanying choices and<br />
outcomes (Chua 2005). This could be specifically pertinent in having<br />
participants better understand each other’s jobs, and the relation there<strong>of</strong> to<br />
their own.<br />
Participants should be kept engaged, and scenarios can be modified<br />
to create fresh experiences for people who have played before (Chua 2005).<br />
New unanticipated events to facilitate learning should be introduced (Pivec<br />
et al. 2003; Borodzicz 2004). A further purpose <strong>of</strong> playing roles is to ensure<br />
that those involved remember that they are participating in a game where<br />
they can build the future by drawing on their creativity (Geurts et al. 2007).<br />
This could therefore lead to the emergence <strong>of</strong> valuable ideas which could be<br />
used.<br />
Level <strong>of</strong> Challenge in the Simulation<br />
Goals with an adequate challenge level need to be set; the simulation should<br />
not be too difficult or easy, as it is important to keep participants’ attention<br />
(Pivec et al. 2003; Chua 2005). It may be useful to have trial runs before the<br />
simulation in the case <strong>of</strong> a game that is difficult to understand (Green 2002).<br />
Other benefits <strong>of</strong> running a trial are to identify any problems and also to<br />
become acquainted with the game (Fannon 2003).<br />
The People in the Simulation<br />
It is important to note the influence <strong>of</strong> group dynamics. Consideration<br />
should be given to the mix <strong>of</strong> people, for example, as Green (2002) points<br />
out, having participants together who are familiar with each other could<br />
result in groupthink, whereas having different people with their own<br />
personalities could create other problems. Issues <strong>of</strong> social structure between<br />
41
Cecile Gerwel & Shamim Bodhanya<br />
management and employees may also affect the game negatively and it is<br />
important to remember the emotional elements <strong>of</strong> the game (Bordozicz<br />
2004).<br />
Care must be taken as to how teams are formed. Instructors should<br />
decide whether to allocate participants to teams or allow them to selfassemble<br />
rather (Adobor & Daneshfar 2006). It is recommended that one<br />
bears in mind the purpose <strong>of</strong> bringing together people and how precisely<br />
they are organised (Green 2002). Participants should also be encouraged to<br />
engage in constructive debate and dialogue rather than having personal<br />
conflicts with other participants (Adobor & Daneshfar 2006). This would be<br />
critical in the case <strong>of</strong> a group that already has existing conflict. Simulations<br />
must however not avoid constructive criticism for the sake <strong>of</strong> keeping peace,<br />
as this could result in group-think (Geurts et al. 2007). Cohesion building<br />
exercises prior to the simulation could assist, as well as the existence <strong>of</strong> a<br />
culture that encourages trust and respect for all people (Green 2002).<br />
Facilitating the Simulation<br />
Keys and Wolfe (1990) argue that the administration <strong>of</strong> a game is nearly as<br />
critical as the quality. Instructors should therefore not only focus on learning<br />
but also on factors around learning, like group dynamics (as mentioned<br />
previously) and features <strong>of</strong> the simulation (Adobor & Daneshfar 2006).<br />
Much attention should be placed on preparation. Barreteau et al.<br />
(2007) caution those in charge <strong>of</strong> simulations to consider their choice <strong>of</strong><br />
participants, medium, location, time, as well as illuminating their motives<br />
for raising awareness and their role in the process. It is recommended that<br />
every aspect, including the rules, confines, and feedback and anticipated<br />
commitment levels, <strong>of</strong> the simulation be made clear (Chua 2005). Leigh<br />
(2004) however cautions against facilitators inflicting their own views on<br />
participants, as players have to experience the consequences <strong>of</strong> their own<br />
decisions (Pivec et al. 2003). This again relates to the facilitator or<br />
administrator allowing for the simulation to proceed at its own pace.<br />
The use <strong>of</strong> simulation essentially centres on facilitators embracing<br />
flexibility and releasing excessive command (Le Roux & Steyn 2007). It is<br />
important for designers and facilitators to bear in mind that there will be<br />
uncontrolled aspects due to the unique experiences and requirements <strong>of</strong><br />
42
An Orientation and Roadmap to Simulation and Gaming<br />
participants, but that there will be order despite the appearance <strong>of</strong> disorder<br />
(Leigh 2004). This is in line with the acknowledgement <strong>of</strong> complexity.<br />
Debriefing<br />
This final phase <strong>of</strong> the simulation bears the most significance. This is where<br />
collective learning and discussions about reality occur (Barreteau et al.<br />
2007). The following processes could increase the effectiveness <strong>of</strong> the<br />
debriefing phase. Borodzicz (2004) recommends overviewing the purpose <strong>of</strong><br />
the game during the debriefing. Debriefing can also touch on positive and<br />
negative emotions experienced by participants, and to disengage from the<br />
roles (Fannon 2003). Participants can reflect on what they learnt with<br />
assistance from the facilitator, and this can be used to decide how to transfer<br />
the knowledge to the real world (Green 2002). The facilitator should<br />
therefore have been perceptive to occurrences in the simulation, in order to<br />
assist participants to reflect and learn.<br />
Chua (2005) explains further advantages <strong>of</strong> the debriefing phase <strong>of</strong><br />
the game. Participants can describe their experiences in the simulation to<br />
commence discussion. This can open up their emotions to acknowledge the<br />
affective component in learning and also encourage trust amongst<br />
participants. They can also raise any expectations that they had which were<br />
not consistent with the game, so that they can gather new insights (Chua<br />
2005). Facilitators can use such information to assist with future<br />
simulations. Pivec et al. (2003) argue that participants learn not only by<br />
making mistakes but also through the consequent feedback. Learning<br />
opportunities that arise from the debriefing should be maximised.<br />
Conclusion<br />
Simulations are ideal in augmenting the learning experiences <strong>of</strong> students, as<br />
well as for addressing a multitude <strong>of</strong> complex situations faced in<br />
organisational settings. Simulations can be thus be used as an alternative to<br />
traditional learning approaches which <strong>of</strong>ten focus on passive listening.<br />
Researchers can also employ simulation as a powerful methodology.<br />
Through experiential learning, participants explore a problem and<br />
experience for themselves the outcomes <strong>of</strong> choices that they made. Benefits<br />
43
Cecile Gerwel & Shamim Bodhanya<br />
<strong>of</strong> using this method include the opportunity for the exploration <strong>of</strong> mental<br />
models in order to acknowledge stakeholders’ varying perspectives.<br />
Processes <strong>of</strong> communication and participation can be better handled, and<br />
participants can also test strategies in the simulation before implementation<br />
in the real world. On a practical level, it is advised that consideration be<br />
given to the many aspects <strong>of</strong> designing simulations. These include involving<br />
participants in the design phase to determine the problems, and how best to<br />
represent pertinent issues in a model. Aspects pertaining to learners and their<br />
needs, as well as to the designers and facilitators must be taken into account.<br />
Attention must also be dedicated to comprehending the different phases <strong>of</strong><br />
simulations. It is hoped that this paper has illustrated the suitability <strong>of</strong><br />
simulations for use in a variety <strong>of</strong> settings and presented a useful framework<br />
to navigate through.<br />
References<br />
Adobor, H & A Daneshfar 2006. Management Simulations: Determining their<br />
Effectiveness. The <strong>Journal</strong> <strong>of</strong> Management Development 25,2: 151-168.<br />
Axelrod, R 1997. Advancing the Art <strong>of</strong> Simulation in the Social Sciences. In<br />
Conte, R, R Hegselmann & P Terna (eds): Simulating Social Phenomena.<br />
Berlin: Springer.<br />
Barreteau, O, C le Page & P Perez 2007. Contribution <strong>of</strong> Simulation and<br />
Gaming to Natural Resource Management Issues: An Introduction.<br />
Simulation & Gaming 38,2: 185-194.<br />
Borodzicz, EP 2004. The Missing Ingredient is the Value <strong>of</strong> Flexibility.<br />
Simulation & Gaming 35,3: 414-426.<br />
Chua, AYK 2005. The Design and Implementation <strong>of</strong> a Simulation Game for<br />
Teaching Knowledge Management. <strong>Journal</strong> <strong>of</strong> the American Society for<br />
Information Science and Technology 56,11: 1207-1216.<br />
Dentico, JP 1999. Games Leaders Play: Using Process Simulations to<br />
Develop Collaborative Leadership Practices for a Knowledge-based<br />
Society. Career Development International 4,3: 175-182.<br />
Depigny, S & Y Michelin 2007. SHRUB BATTLE: Understanding the<br />
Making <strong>of</strong> Landscape. Simulation & Gaming 38,2: 263-277.<br />
Dionnet, M, M Kuper, A Hammani & P Garin 2008. Combining Role-playing<br />
44
An Orientation and Roadmap to Simulation and Gaming<br />
Games and Policy Simulation Exercises: An Experience with Moroccan<br />
Smallholder Farmers. Simulation & Gaming 39,4: 498-514.<br />
Dooley, K 2002. Simulation Research Methods. In Baum, J (ed): Companion<br />
to Organisations. London: Blackwell.<br />
Enciso, RZ 2001. Simulation Games: A Learning Tool. Paper presented at the<br />
ISAGA 2001 Conference, Bari, Italy.<br />
Fannon, K 2003. ‘Needle stick’ – A Role Play Simulation: Transformative<br />
Learning in Complex Dynamic Social Systems. International <strong>Journal</strong> <strong>of</strong><br />
Training Research 1,2: 100-116.<br />
Feinstein, AH, S Mann & DL Corsun 2002. Charting the Experiential<br />
Territory. <strong>Journal</strong> <strong>of</strong> Management Development 21,10: 732-744.<br />
Feld, SL 1997. Simulation Games in Theory Development. Sociological<br />
Forum 12,1: 103-115.<br />
Fripp, J 1994. Why Use Business Simulations? Executive Development 7,1:<br />
29-32.<br />
Geurts, JLA, RD Duke & PAM Vermeulen 2007. Policy Gaming for Strategy<br />
and Change. Long Range Planning 40,6: 535-558.<br />
Green, J 2002 Encourage your Employees to Play: Simulations Provide<br />
Opportunities to Learn about Complex Decisions. Grazidio Business<br />
Report 5. Available at: http://gbr.pepperdine.edu/023/simulations.html.<br />
(Accessed on January 27, 2009.)<br />
Jackson, M 2004. Making Visible: Using Simulation and Game Environments<br />
across Disciplines. On the Horizon 12,1: 22-25.<br />
Keys, B & J Wolfe 1990. The Role <strong>of</strong> Management Games and Simulations<br />
in Education and Research. <strong>Journal</strong> <strong>of</strong> Management 16,2: 307-336.<br />
Keys, JB, RM Fulmer & SA Stumpf 1996. Microworlds and Simuworlds:<br />
Practice Fields for the Learning Organization. Organizational Dynamics<br />
24,4: 36-49.<br />
Lane, DC 1995. On a Resurgence <strong>of</strong> Management Simulations and Games.<br />
The <strong>Journal</strong> <strong>of</strong> the Operational Research Society 46,5: 604-625.<br />
Leigh, E 2004. Making Learning a Game. Public Management Electronic<br />
<strong>Journal</strong> 4. Available at: http://e-journal.spa.msu.ru/images/File/2004/<br />
leigh.pdf. (Accessed on February 02, 2009.)<br />
Le Roux, I & B Steyn 2007. Experiential Learning and Critical Reflection as<br />
a Tool for Transfer <strong>of</strong> Business Knowledge: An Empirical Case Study <strong>of</strong><br />
a Start-up Simulation Intervention for Nascent Entrepreneurs. South<br />
45
Cecile Gerwel & Shamim Bodhanya<br />
African <strong>Journal</strong> <strong>of</strong> Economic and Management Sciences 10,3: 330-347.<br />
Pannese, L & M Carlesi 2007. Games and Learning Come together to<br />
Maximise Effectiveness: The Challenge <strong>of</strong> Bridging the Gap. British<br />
<strong>Journal</strong> <strong>of</strong> Educational Technology 38,3: 438-454.<br />
Pittaway, L & J Cope 2007. Simulating Entrepreneurial Learning: Integrating<br />
Experiential and Collaborative Approaches to Learning. Management<br />
Learning 38, 2: 211-233.<br />
Pivec, M, O Dziabenko & I Schinnerl 2003. Aspects <strong>of</strong> Game-based<br />
Learning. Paper presented at the I-know 03 Third International<br />
Conference on Knowlegde Management. Graz, Austria.<br />
Savolainen, T 1997. Simulation Games in CIM and the Learning<br />
Organisation. Computers in Industry 33,2: 217-221.<br />
Serrano, MC, GC Ariza, R Sotaquira, LN Gelvez & JA Parra 2006. From<br />
Individualistic to Collective Rationality in Simulation Games for Social<br />
Sustainability. Paper presented at the 24th International Conference <strong>of</strong> the<br />
System Dynamics Society, Nijmegen, The Netherlands.<br />
Stumpf SA, MA Watson & H Rustogi 1994. Leadership in a Global Village:<br />
Creating Practice Fields to Develop Learning Organisations. The <strong>Journal</strong><br />
<strong>of</strong> Management Development 13,8: 16-25.<br />
Thiagarajan, S 2003. Design your Own Games and Activities: Thiagi’s<br />
Templates for Performance Improvement. San Francisco: John Wiley &<br />
Sons.<br />
Wenzler, I & D Chartier 1999. Why do we Bother with Games and<br />
Simulations: An Organisational Learning Perspective. Simulation &<br />
Gaming 30,3: 375-384.<br />
Zantow, K, DS Knowlton & DC Sharp 2005. More than Fun and Games:<br />
Reconsidering the Virtues <strong>of</strong> Strategic Management Simulations.<br />
Academy <strong>of</strong> Management Learning & Education 4,4:451-458.<br />
46<br />
Cecile Gerwel<br />
Leadership Centre<br />
Faculty <strong>of</strong> Management Studies<br />
<strong>University</strong> <strong>of</strong> <strong>KwaZulu</strong>-<strong>Natal</strong><br />
Durban, South Africa<br />
Gerwel@ukzn.ac.za
An Orientation and Roadmap to Simulation and Gaming<br />
47<br />
Shamim Bodhanya<br />
Leadership Centre<br />
Faculty <strong>of</strong> Management Studies<br />
<strong>University</strong> <strong>of</strong> <strong>KwaZulu</strong>-<strong>Natal</strong><br />
Durban, South Africa<br />
bodhanyas1@ukzn.ac.za
A Comparison <strong>of</strong> Staff and<br />
Student Expectations <strong>of</strong> Service Quality in the<br />
UKZN Foundation Programme:<br />
Management Implications<br />
Yvette Chetty<br />
Debbie Vigar-Ellis<br />
Abstract<br />
Higher Education institutions have been called upon by Government and<br />
other stakeholders to address the injustices <strong>of</strong> the apartheid past through the<br />
implementation <strong>of</strong> access programmes. This, together with the need to<br />
increase science graduates, has resulted in access or foundation programmes<br />
operating in a more competitive environment. To achieve customer<br />
satisfaction in a foundation programme, which is an educational service,<br />
managers need to be aware <strong>of</strong> the beliefs staff have about what is needed for<br />
service delivery. What staff believe is important to customers (students in<br />
this case) will impact how they behave in the service delivery process. This<br />
will ultimately affect the service quality delivered by the <strong>University</strong> to<br />
access students. This research focuses on the Science Foundation<br />
Programme (SFP) at <strong>University</strong> <strong>of</strong> <strong>KwaZulu</strong>-<strong>Natal</strong> (UKZN) and takes a<br />
services marketing approach.<br />
Staff involved in the service delivery at the point <strong>of</strong> entry and the<br />
SFP students were asked to complete the SERVQUAL questionnaire. The<br />
results were compared and showed that while overall the staff expectations<br />
met or exceeded those <strong>of</strong> students, there were 5 statements where the staff<br />
expectations <strong>of</strong> service quality were lower than those <strong>of</strong> the students. These<br />
statements were in the SERVQUAL dimensions <strong>of</strong> responsiveness,<br />
assurance and tangibles.<br />
<strong>Alternation</strong> Special Edition 4 (2011) 48 – 68<br />
ISSN 1023-1757<br />
48
… Service Quality in the UKZN Foundation Programme …<br />
Overall the lower expectations <strong>of</strong> the staff indicate that they<br />
perceive these factors to be less important than customers do, and are likely<br />
to behave accordingly. This will affect perceived service quality on the part<br />
<strong>of</strong> students. There is thus a need to look at ways <strong>of</strong> addressing these gaps.<br />
This can be incorporated into staff training which should also include<br />
knowledge <strong>of</strong> student needs and expectations. Recommendations in the<br />
services context are made to the management <strong>of</strong> SFP at UKZN to ensure<br />
student needs are met.<br />
Keywords: Service quality, staff and student expectations, foundation<br />
programme, university science access programme, services marketing,<br />
SERVQUAL.<br />
Problem Statement, Objectives and Research Questions<br />
De Jager and Du Plooy (2006: 11) state that traditionally, technikons and<br />
universities have competed indirectly, whereas they now compete directly,<br />
ostensibly for the same market. A number <strong>of</strong> tertiary educational institutions<br />
in South Africa, such as the UKZN, the <strong>University</strong> <strong>of</strong> Cape Town, the<br />
<strong>University</strong> <strong>of</strong> Witwatersrand, and the <strong>University</strong> <strong>of</strong> the North <strong>of</strong>fer a variety<br />
<strong>of</strong> programmes to address the call to provide access to previously<br />
disadvantaged students. This increased level <strong>of</strong> competition in the tertiary<br />
education environment has led to institutions <strong>of</strong> higher education employing<br />
managerial techniques to improve the efficiency and quality <strong>of</strong> their<br />
provisions and switching from a passive, to a more active marketing<br />
approach (De Jager & Du Plooy 2006: 11).<br />
The Science Foundation Programme (SFP) which is part <strong>of</strong> the<br />
Centre for Science Access (CSA) at the UKZN aims to address the needs <strong>of</strong><br />
disadvantaged learners and provide access for them into science degrees. As<br />
a consequence <strong>of</strong> South Africa’s past, these learners are faced with unique<br />
socio-economic difficulties. In ensuring customer satisfaction, especially at<br />
the point <strong>of</strong> entry to university which is when students are the most<br />
vulnerable, the CSA needs to be aware <strong>of</strong> the expectations <strong>of</strong> staff involved<br />
in the service delivery at this point and how these compare with their<br />
customers, i.e. the students.<br />
The research objectives for this study were thus:<br />
49
Yvette Chetty & Debbie Vigar-Ellis<br />
1. To determine the expectations <strong>of</strong> students in terms <strong>of</strong> service<br />
quality at the point <strong>of</strong> entry into the UKZN Foundation<br />
Programme<br />
2. To determine staff expectations <strong>of</strong> what the students require for<br />
service quality at the point <strong>of</strong> entry into the UKZN Foundation<br />
Programme<br />
3. To determine whether gaps exist between staff and student<br />
expectations.<br />
Literature Survey<br />
Service Quality<br />
Cateora (2007: 338) states that the focus on quality globally, is driven by<br />
increasing competition and more choices which ultimately places the power<br />
in the hands <strong>of</strong> consumers rather than producers. He goes on to state that<br />
‘the reason <strong>of</strong>ten given for preferring one brand over another is better quality<br />
at a competitive price’ (339). One <strong>of</strong> the major ways to differentiate a<br />
service firm is to deliver consistently higher-quality service than competitors<br />
(Walker & Mullins 2008: 228). Service quality is defined by customers, and<br />
relates to the organisation’s ability to satisfy customers’ needs (Palmer 2005:<br />
261). Service quality dimensions include reliability, responsiveness,<br />
empathy, assurance and tangibles (Mullins & Walker 2010: 444). According<br />
to Walker, Mullins and Larreche (2008: 231) ‘the results <strong>of</strong> a number <strong>of</strong><br />
surveys suggest that customers perceive all five dimensions <strong>of</strong> service<br />
quality to be very important regardless <strong>of</strong> the kind <strong>of</strong> service’.<br />
Measuring Service Quality<br />
According to Zeithaml and Bitner (2003: 135) a sound measure <strong>of</strong> service<br />
quality is necessary for identifying the aspects <strong>of</strong> service needing<br />
performance improvement, assessing how much improvement is needed on<br />
each aspect, and evaluating the impact <strong>of</strong> improvement efforts.<br />
One <strong>of</strong> the first measures to be developed specifically to measure<br />
service quality was the SERVQUAL survey (Zeithaml & Bitner 2003: 135).<br />
McColl, Callaghan and Palmer (1998: 155) and Palmer (2005: 269) state<br />
that the SERVQUAL technique can be used by companies to understand the<br />
50
… Service Quality in the UKZN Foundation Programme …<br />
expectations and perceptions <strong>of</strong> their customers better. ‘It is applicable<br />
across a broad range <strong>of</strong> service industries and can be easily modified to take<br />
account <strong>of</strong> the specific requirements <strong>of</strong> a company. In effect it provides a<br />
skeleton for an investigatory instrument that can be adapted or added to as<br />
needed’ (Palmer 2005: 269).<br />
SERVQUAL is based upon a 22-item questionnaire covering the<br />
five dimensions <strong>of</strong> service quality (Palmer 2005: 269). The five dimensions<br />
covered are:<br />
Table 1: Five Dimensions <strong>of</strong> SERVQUAL<br />
Statements Dimension Description <strong>of</strong> dimension<br />
1 to 5 Reliability dependability, accurate performance<br />
6 to 9 Responsiveness<br />
promptness and helpfulness<br />
10 to 13 Assurance<br />
14 to 17 Empathy<br />
18 to 22 Tangibles<br />
competence, courtesy, credibility &<br />
security<br />
easy access, good communications &<br />
customer understanding<br />
appearance <strong>of</strong> physical elements<br />
(McColl et al. 1998: 155; and Ziethaml & Bitner 2003: 136)<br />
Zeithaml and Bitner (2003: 95) and Zeithaml et al. (1990, cited in<br />
Lovelock & Wirtz 2007: 421) say that reliability means that the company<br />
delivers on its promises, i.e. promises about service provision, problem<br />
resolution, delivery and pricing. Customers want to do business with<br />
companies that keep their promises, particularly their promises about the<br />
service outcomes and core attributes.<br />
Responsiveness is the willingness to help customers and to provide<br />
prompt service (Zeithaml 1990 cited in Walker et al. 2008: 230). This<br />
dimension emphasises attentiveness and promptness in dealing with<br />
customer requests, questions, complaints and problems. Responsiveness is<br />
communicated to customers by the length <strong>of</strong> time they have to wait for<br />
51
Yvette Chetty & Debbie Vigar-Ellis<br />
assistance, answers to questions, or attention to problems. Responsiveness<br />
also captures the notion <strong>of</strong> flexibility and ability to customise the service to<br />
customer needs (Zeithaml & Bitner 2003: 97).<br />
Zeithaml et al. (1990 cited in Mullins et al. 2008: 433) define<br />
assurance as employees’ knowledge and courtesy and the ability <strong>of</strong> the firm<br />
and its employees to convey trust and confidence. Empathy is defined as the<br />
‘caring, individualised attention the firm provides its customers’ (Zeithaml<br />
et al. (1990 cited in Walker et al. 2008: 230). The essence <strong>of</strong> empathy is<br />
conveying, through personalised or customised service, that customers are<br />
unique and special. Customers want to feel understood by, and important to<br />
firms that provide service to them.<br />
Tangibles are defined as the ‘appearance <strong>of</strong> physical facilities,<br />
equipment, personnel and communication materials’ (Zeithaml & Bitner<br />
2003: 98). All <strong>of</strong> these provide physical representations or images <strong>of</strong> the<br />
service that customers, particularly new customers, will use to evaluate<br />
quality.<br />
Customers are asked to complete the 22 statements relating to their<br />
expectations and a perceptions section consisting <strong>of</strong> a matching set <strong>of</strong><br />
company-specific statements about service delivery (McColl et al. 1998:<br />
155). ‘They are typically asked to score in each instance, on a Likert scale<br />
from 1 (strongly disagree) to 7(strongly agree), whether or not they agree<br />
with each statement … the outcome from a one-<strong>of</strong>f study is a measure that<br />
tells the company whether its customers’ expectations are exceeded or not’<br />
(Palmer 2005: 269-270).<br />
The People Element <strong>of</strong> Services<br />
Services have characteristics <strong>of</strong> intangibility, inseparability, variability and<br />
perishability which distinguish them from products and require a different<br />
set <strong>of</strong> elements when marketing them (Palmer 2005: 16). In addition to the<br />
traditional marketing mix <strong>of</strong> product, price, promotion and place<br />
(distribution), the service marketing mix includes people, physical evidence<br />
and process (Doole & Lowe 2008: 265; and Palmer 2005: 11). To reduce the<br />
uncertainty associated with the intangible nature <strong>of</strong> services, buyers look for<br />
‘signals’ <strong>of</strong> service quality, i.e. they draw conclusions about the quality from<br />
the place, people, price, equipment and communications that they can see<br />
52
… Service Quality in the UKZN Foundation Programme …<br />
(Kotler & Armstrong 2004: 299). According to Parasuraman, Zeithaml and<br />
Berry (1985: 42) in most cases tangible evidence is limited to the service<br />
provider’s physical facilities, equipment and personnel.<br />
Thus ‘for most services, people are a vital element <strong>of</strong> the marketing<br />
mix’ (Palmer 2005: 13). Both provider <strong>of</strong> the service and the customer, who<br />
is present as the service is being produced, affect the service outcome<br />
(Kotler & Armstrong 2004: 299). The quality <strong>of</strong> service and customer<br />
satisfaction will be highly dependent on what happens in ‘real time’,<br />
including actions <strong>of</strong> employees and the interaction between employees and<br />
customers (Zeithaml & Bitner 2003: 22). With manufactured goods,<br />
‘management can usually take measures to reduce the direct effect <strong>of</strong> people<br />
on the final output as received by customers’ (Palmer 2005: 13). According<br />
to Palmer the buyer <strong>of</strong> a tangible product ‘is not concerned with whether the<br />
production worker dresses untidily, uses bad language at work or turns up<br />
for work late, so long as there are quality control measures which reject the<br />
results <strong>of</strong> lax behaviour before the product reaches the customer’ (Palmer<br />
2005:13). On the other hand, in service settings the contact person e.g. a<br />
lawyer, accountant, lecturer or faculty <strong>of</strong>ficer is the service, and thus plays a<br />
major role in influencing customers’ perceptions <strong>of</strong> the service (Du Plessis<br />
Jooste & Strydom 2005: 379). According to Zeithaml and Bitner (2003:<br />
318), service employees are the service, are the organisation in the<br />
customer’s eyes, are the brand and are the marketers.<br />
Front line employees and those supporting them from behind the<br />
scenes are thus critical to the success <strong>of</strong> any service organisation (Zeithaml<br />
& Bitner 2003: 318). Palmer (2005: 13) states that ‘while the importance<br />
attached to people management in improving quality within manufacturing<br />
companies is increasing, people planning assumes much greater importance<br />
within the service sector .... For this reason, it is essential that service<br />
organisations clearly specify what is expected from personnel in their<br />
interaction with customers. To achieve the specified standard, methods <strong>of</strong><br />
recruiting, training, motivating and rewarding staff cannot be regarded as<br />
purely personnel decisions – they are important marketing mix decisions’. In<br />
particular, front-line employees directly influence customer perceptions <strong>of</strong><br />
responsiveness through their personal willingness to help and their<br />
promptness in serving customers. Individual employees with whom the<br />
customer interacts confirm and build trust in the organisation or detract from<br />
53
Yvette Chetty & Debbie Vigar-Ellis<br />
its reputation and ultimately destroy trust (Zeithaml & Bitner 2003: 321).<br />
Zeithaml and Bitner (2003: 321) state that to build a customer-orientated,<br />
service-minded workforce, an organisation must hire the right people,<br />
develop people to deliver service quality, set appropriate service standards,<br />
provide the needed support systems, motivate and reward appropriate service<br />
behaviour and retain the best people.<br />
Education as a Service<br />
According to Shaik (2005, paragraph 6), education is a service and students<br />
are the prime focus <strong>of</strong> the institution. Shaik goes on to state that teaching<br />
and learning that occurs in the classroom are examples <strong>of</strong> the core service<br />
because it is critical to a successful learning experience. However for<br />
education, there are also a number <strong>of</strong> supporting services which include realtime<br />
information about courses, student advice, online registrations,<br />
orientation, student accounts, help-desk, complaint handling, and feedback<br />
in a friendly, trustworthy and timely manner (paragraph 6). Students<br />
regularly come into contact with the staff associated with these services<br />
during their stay at the institution. These services create added-value to the<br />
student and determine the quality <strong>of</strong> students' learning experience. The core<br />
education service is supplemented by the following categories <strong>of</strong> services,<br />
namely, applications, admissions, orientation, registration, finance, housing,<br />
counselling, security, educational resources and essential support services.<br />
In business, strategic planning and management have long been<br />
known as effective tools for creating a competitive edge, taking advantage <strong>of</strong><br />
particular market conditions and distinctive competencies, and forging a<br />
niche that a company can dominate (Rowley & Sherman 2001: 17).<br />
According to Rowley and Sherman (2001: 17) learners and other consumers<br />
<strong>of</strong> higher education’s products and services want to be assured <strong>of</strong> receiving<br />
higher levels <strong>of</strong> quality, timeliness and responsiveness. Similarly Shaik<br />
(2005, paragraph 14) states that students are demanding quality services and<br />
are less willing to make compromises in the quality <strong>of</strong> educational services.<br />
Should one campus refuse to meet these needs, learners and consumers<br />
simply go to the next campus, whether it is the college or university next<br />
door or the one in cyberspace. Farrington (1999 cited in Rowley & Sherman<br />
2001: 17) states that competition exists and campuses really have no choice<br />
54
… Service Quality in the UKZN Foundation Programme …<br />
but to confront it head-on. Universities thus need to ensure that they provide<br />
service quality as a basis for differentiating themselves from competitors.<br />
One <strong>of</strong> the primary stages where service quality is critical is at the<br />
point <strong>of</strong> entry into the university which is when students are most vulnerable<br />
and where they experience a major adjustment. Fisher (1994) states that the<br />
transition to university will be stressful for many, particularly if this involves<br />
leaving home, due to the requirement <strong>of</strong> taking on new responsibilities (cited<br />
in Robotham & Julian 2006: 112).<br />
In addressing the service quality at the point <strong>of</strong> entry it is important<br />
to look specifically at students in access programmes as their needs differ<br />
from other students because <strong>of</strong> their educational, economic and social<br />
background. Callender (2003) states that students from disadvantaged<br />
backgrounds are less likely to have parents who attended university (cited in<br />
Cooke, Barkham, Audin & Bradley 2004: 409). Grayson (1996: 993) also<br />
states that the gap between high school and university is wider for students<br />
coming out <strong>of</strong> black schools, where the problem has been compounded by<br />
issues such as severe lack <strong>of</strong> resources, overcrowded classrooms,<br />
underqualified teachers, and unstable and sometimes dangerous social<br />
environments.<br />
The focus <strong>of</strong> this particular research is the Science Foundation<br />
Programme at the UKZN. The UKZN rises to Government calls for<br />
transformation and redress, and for increased numbers <strong>of</strong> science graduates,<br />
by <strong>of</strong>fering such programmes as the Science Foundation Programme (SFP).<br />
The SFP is a one year, alternative access programme which provides an<br />
alternative route for underprepared students to enter the Faculty <strong>of</strong> Science<br />
and Agriculture. The programme is aimed at increasing the number <strong>of</strong> black<br />
graduates in science thereby addressing the inequalities <strong>of</strong> the past. ‘The<br />
aim <strong>of</strong> the SFP is to enable black students to overcome the gap between<br />
school and university and prepare them for entry into a science (or sciencerelated)<br />
degree programme’ (Grayson 1996: 993).<br />
The socio-economic background that SFP students come from is<br />
associated with a number <strong>of</strong> difficulties (SFP 1998: 6). Students come from<br />
fragmented families and societies; and they struggle with identity and family<br />
support, both personal and financial (SFP 1998: 6). They have <strong>of</strong>ten come<br />
from traumatised communities and some are personally the victims <strong>of</strong><br />
violence and abuse (SFP 1998: 7). Often the level <strong>of</strong> poverty is extremely<br />
55
Yvette Chetty & Debbie Vigar-Ellis<br />
high and shortages <strong>of</strong> resources like food, water, transport and housing are<br />
not unknown amongst these students. Many students experience high levels<br />
<strong>of</strong> anxiety about finance (SFP 1998: 7).<br />
In achieving its goals it is important for the <strong>University</strong> to understand<br />
the expectations <strong>of</strong> this specific target market for its access programmes i.e.<br />
previously disadvantaged scholars and to determine whether staff involved<br />
in such programmes understand their target market. Because the staff play<br />
such an important role in service delivery and thus service quality<br />
determination, it is critical that their perceptions <strong>of</strong> what customers expect<br />
match those <strong>of</strong> the students.<br />
Research Methodology<br />
An exploratory research approach was used in this study. Exploratory<br />
research was deemed appropriate by the researcher as the objective <strong>of</strong> this<br />
study was to gain insight and perspective into the research problem as<br />
advocated by Kinnear and Taylor (1996: 29). In other words the aim <strong>of</strong> this<br />
research was to identify problems and gain perspectives about the<br />
expectations <strong>of</strong> the staff and students on the service quality and the gaps<br />
between them. A census <strong>of</strong> students on the programme in 2006 (99 students)<br />
as well as the 10 staff who provide services to students at the point <strong>of</strong> entry<br />
which included the SFP Administration, SFP Counselling, Student Fees,<br />
Financial Aid Services and Student Housing.<br />
Data Collection<br />
The SERVQUAL questionnaire was used to obtain information from the<br />
students and staff. The SERVQUAL instrument is a 22 item questionnaire<br />
designed by Parasuraman, Zeithaml and Berry (Zeithaml et al. 2003: 137).<br />
The first part <strong>of</strong> the questionnaire asks customers to reflect on the level <strong>of</strong><br />
service they would expect from excellent companies in a sector. The second<br />
part <strong>of</strong> the questionnaire obtains the perceptions <strong>of</strong> customers <strong>of</strong> the service<br />
delivered by a specific company within that sector. For the purposes <strong>of</strong> this<br />
article, only the expectation scores were used as the study sought to compare<br />
the expectations <strong>of</strong> staff with those <strong>of</strong> students.<br />
56
… Service Quality in the UKZN Foundation Programme …<br />
Student Sample Pr<strong>of</strong>ile<br />
The full population <strong>of</strong> SFP students, which was 99 students, was used in this<br />
study. A 96% response rate was achieved. 71% <strong>of</strong> the sample was male and<br />
the majority, i.e. 86% <strong>of</strong> the students were between 17 and 20 years old. A<br />
large proportion <strong>of</strong> students (42%) came from a rural area where ‘Rural’ was<br />
defined as a village that is further than 50km from the nearest town or city<br />
and ‘Urban’ was defined as a town, city or township.<br />
Staff Sample Pr<strong>of</strong>ile<br />
9 <strong>of</strong> the 10 respondents completed the questionnaire thus giving a 90%<br />
response rate for this survey.<br />
Data Analysis<br />
Each item on the SERVQUAL questionnaire consists <strong>of</strong> a seven point Likert<br />
scale. A score was generated by the researcher as follows: for each item the<br />
average was calculated based on respondents’ scoring on the Likert scale.<br />
The gaps were defined to be the differences between the averages <strong>of</strong> the<br />
staff and students expectations on an item.<br />
Cronbach’s alpha was calculated to test the reliability <strong>of</strong> the<br />
findings. This is a measure <strong>of</strong> internal consistency <strong>of</strong> a measurement or test<br />
(Welman Kruger & Mitcell 2005: 147). A Cronbach’s alpha above 0.7 is<br />
deemed acceptable (Hair, Anderson, Tatham & Black 1998: 88). The results<br />
<strong>of</strong> the test were 0.916 for student expectations and 0.885 for staff. The<br />
results <strong>of</strong> the Cronbach’s alpha tests are above 0.7 which indicates that the<br />
measurement process is reliable.<br />
Validity testing for the SERVQUAL instrument has been carried out<br />
as stated in Parasuraman et al. (1985: 114) Therefore no validity testing was<br />
carried out for this study.<br />
Results<br />
Student Expectations<br />
The top 5 expectation scores <strong>of</strong> the students were:<br />
57
Yvette Chetty & Debbie Vigar-Ellis<br />
1. Statement 8: Employees <strong>of</strong> an excellent <strong>University</strong> will always be willing<br />
to help customers (from the Responsiveness dimension) scoring 6.30<br />
2. Statement 22: An excellent <strong>University</strong> will have operating hours<br />
convenient to all their customers (Tangibles) scoring 6.30<br />
3. Statement 6: Employees <strong>of</strong> an excellent <strong>University</strong> will tell customers<br />
exactly when services will be performed (Responsiveness) scoring 6.29<br />
4. Statement 13: Employees <strong>of</strong> an excellent <strong>University</strong> will have the<br />
knowledge to answer customer questions (Assurance) scoring 6.27; and<br />
5. Statement 18: An excellent <strong>University</strong> will have modern-looking<br />
equipment (Tangibles) which scored 6.13.<br />
Graph 1: Student and Staff Expectations <strong>of</strong> Service Quality<br />
Average Perceptions<br />
7.00<br />
6.50<br />
6.00<br />
5.50<br />
5.00<br />
4.50<br />
Comparison <strong>of</strong> Staff and Student expectations<br />
1 2 3 4 5 6 7 8 9 10 11<br />
Staff Expectations<br />
The highest expectation scores for the staff all scoring 6.67 were:<br />
1. Statements 1: When an excellent <strong>University</strong> promises to do something by<br />
a certain time, they will also do so (Reliability);<br />
58<br />
12 13 14<br />
Reliability Responsiveness Assurance<br />
Question<br />
Empathy<br />
Staff expectations Student expectations<br />
15 16 17 18<br />
19 20 21 22<br />
Tangibles
… Service Quality in the UKZN Foundation Programme …<br />
2. Statement 2: When customers have a problem, an excellent <strong>University</strong><br />
will show sincere interest in solving it (Reliability);<br />
3. Statement 4: An excellent <strong>University</strong> will provide their service at the<br />
time they promise to do so (Responsiveness); and<br />
4. Statement 7: Employees <strong>of</strong> an excellent <strong>University</strong> will give prompt<br />
service to customers (Responsiveness).<br />
Comparison <strong>of</strong> Staff versus Students’ Expectations<br />
When comparing the expectations <strong>of</strong> staff with those <strong>of</strong> students, several<br />
levels <strong>of</strong> analysis could be conducted.<br />
1. A comparison <strong>of</strong> the most important dimension as determined by<br />
dimension averages reveals that the most important dimension to<br />
students is Responsiveness (average 6.04) whereas Reliability is seen to<br />
be most important by staff (6.51). The highest expectations for the<br />
students included the Responsiveness (statements 6 & 8), followed by<br />
Assurance (statement 13) and Tangibles (statement 18 & 22)<br />
dimensions. In contrast, the highest expectations for the staff included<br />
the Reliability (statements 1, 2, 3 & 4), Responsiveness (statements 6 &<br />
7) and Empathy (statement 17) dimensions.<br />
2. Still comparing dimension averages, it was only in the Tangible<br />
dimension where the average score <strong>of</strong> the student expectations exceeded<br />
that <strong>of</strong> the staff. Thus in all dimensions other than Tangibles, staff<br />
perceived the dimensions to be more important to students than the<br />
students themselves did.<br />
3. The comparison <strong>of</strong> the staff expectations with the students’ expectations<br />
<strong>of</strong> service quality in Graph 2, showed that staff expectations <strong>of</strong> an<br />
excellent university were generally higher than those <strong>of</strong> students (in 17<br />
<strong>of</strong> the 22 items). In other words, staff had higher expectations <strong>of</strong> what<br />
was required for excellent service quality than students did.<br />
59
Yvette Chetty & Debbie Vigar-Ellis<br />
Graph 2: Gaps between Staff and Student Expectations <strong>of</strong> Service<br />
Quality<br />
Average Perceptions<br />
1.00<br />
0.80<br />
0.60<br />
0.40<br />
0.20<br />
0.00<br />
-0.20<br />
-0.40<br />
-0.60<br />
0.69<br />
0.64<br />
Gaps between Staff and Student expectations<br />
0.57<br />
0.60<br />
0.53<br />
0.15<br />
0.79<br />
0.52<br />
0.38<br />
-0.08 -0.46 0.04<br />
-0.16<br />
-0.20 -0.41<br />
60<br />
0.26<br />
1 2 3 4 5 6 7 8 9 10 11 12 13 14 15 16 17 18 19 20 21 22<br />
Reliability Responsiveness Assurance Empathy Tangibles<br />
0.82<br />
Question<br />
Staff Expectations Higher than Student Expectations<br />
The dimensions where the expectations <strong>of</strong> the staff exceeded those <strong>of</strong> the<br />
students in all the statements were the Reliability and Empathy dimensions.<br />
This may indicate that staff are placing more emphasis on these areas than is<br />
necessary to meet student expectations. As can be seen in Graph 2,<br />
statements 7 (Responsiveness), 12 (Assurance) and 14 (Empathy) had the<br />
biggest gaps between the student and staff expectations:<br />
1. Statement 7: Employees <strong>of</strong> an excellent <strong>University</strong> will give prompt<br />
service to customers;<br />
2. Statement 12: Employees <strong>of</strong> an excellent <strong>University</strong> will be consistently<br />
courteous to customers; and<br />
Gaps<br />
0.74<br />
0.35<br />
0.51<br />
0.40<br />
0.37
… Service Quality in the UKZN Foundation Programme …<br />
3. Statement 14: An excellent <strong>University</strong> will give customers individual<br />
attention<br />
Staff focus on delivering high levels <strong>of</strong> service related to these<br />
activities will require considerable time, perhaps taking time away from<br />
activities considered more important to the students ie where negative gaps<br />
exist.<br />
Student Expectations Exceed Staff Expectations<br />
Staff expectations were lower than the students in three dimensions:<br />
Responsiveness (statement 8), Assurance (statement 13) and Tangibles<br />
(statements 18, 20 & 22).<br />
1. Statement 8: Employees <strong>of</strong> an excellent <strong>University</strong> will always be willing<br />
to help customers.<br />
2. Statement 13: Employees <strong>of</strong> an excellent <strong>University</strong> will have the<br />
knowledge to answer customer questions.<br />
3. Statement 18: An excellent <strong>University</strong> will have modern-looking<br />
equipment;<br />
4. Statement 20: Employees <strong>of</strong> an excellent <strong>University</strong> will be neat in<br />
appearance.<br />
5. Statement 22: An excellent <strong>University</strong> will have operating hours<br />
convenient to all their customers.<br />
Discussion and Recommendations to SFP Management<br />
The aim <strong>of</strong> this study was to compare the expectations <strong>of</strong> staff and SFP<br />
students <strong>of</strong> the service quality at the point <strong>of</strong> entry to the university. Service<br />
personnel ‘involved in the process <strong>of</strong> service delivery can be crucial in<br />
defining that service and customer’s perceptions <strong>of</strong> it’ (Palmer 2005: 48).<br />
Thus the staff expectations <strong>of</strong> what is required for excellent service quality<br />
61
Yvette Chetty & Debbie Vigar-Ellis<br />
are critical to assess as these will affect their behaviour in the service<br />
encounter.<br />
From the results, overall staff expectations exceeded those <strong>of</strong> the<br />
students and this indicates that overall, their performance in service delivery<br />
should match or exceed that required by SFP students. This is commendable<br />
and SFP management should acknowledge this and provide positive<br />
reinforcement to staff. Meeting and exceeding customer expectations is a<br />
goal <strong>of</strong> many organisations but it is important to ensure that minimum<br />
requirements are met across all dimensions first rather than expectations<br />
being exceeded for some dimensions and not met for others. Thus, in terms<br />
<strong>of</strong> having limited resources, as most university programmes do, it is<br />
necessary to prioritise resources, i.e. time and money, especially in areas that<br />
are important to customers. The results showed that the expectations <strong>of</strong> the<br />
staff far exceeded those <strong>of</strong> the students in statements 7, 12 and 14.Activities<br />
assessed in statements 7 (providing prompt service) and 14 (giving student<br />
individual attention) in particular, draw on the resource <strong>of</strong> time <strong>of</strong> the staff<br />
member and money because it impacts the number <strong>of</strong> employees required to<br />
be able to provide this level <strong>of</strong> service. These resources could be used better<br />
towards statements 8, 13 and 22 which were the negative gaps, i.e. where<br />
staff expectations were lower than those <strong>of</strong> the students. One could then<br />
expect that service delivery in these areas might not meet student<br />
expectations. The dimensions needing attention would thus be as follows.<br />
Responsiveness<br />
The Responsiveness dimension had the highest average score for the<br />
students which indicates that the students see this a very important aspect <strong>of</strong><br />
the service quality. Statement 8 (Employee willingness to help) in<br />
particular, had a negative gap score.<br />
This is an important area <strong>of</strong> customer service as it reflects the care<br />
and importance <strong>of</strong> the customer to staff and the institution as a whole.<br />
Concerns about the level <strong>of</strong> caring may be exacerbated by the student’s<br />
added anxiety about this new environment. For example, it has been found<br />
that these students come from fragmented families and societies and they<br />
struggle with family support, both personal and financial (SFP 1998: 6).<br />
This lack <strong>of</strong> support structure and increased anxiety about how they will<br />
62
… Service Quality in the UKZN Foundation Programme …<br />
live, pay for tuition, food etc. may increase their expectations <strong>of</strong> staff in the<br />
university system to be able to alleviate these fears. Thus their expectations<br />
are high in terms <strong>of</strong> staff willingness to help them. This needs to be<br />
communicated to staff so that they can empathise with the students and show<br />
a genuine willingness to help them.<br />
For this statement staff expectation scores were only marginally less<br />
(0.08) and thus staff appear to be almost in line with student expectations i.e.<br />
they appear to recognise this expectation <strong>of</strong> these students. This gap would<br />
however, need to be monitored to ensure that it does not widen.<br />
Assurance<br />
Statement 13 (employee knowledge to answer questions): It appears as<br />
though staff do not perceive the level <strong>of</strong> importance students attach to this<br />
dimension because they do not perceive the student expectations to be as<br />
high as they are. The importance <strong>of</strong> knowledgeable staff to these students<br />
may stem again from their backgrounds in that the university environment is<br />
very different to their school environment and thus questions they have may<br />
be far more varied than those <strong>of</strong> advantaged students entering the university<br />
system. For example, these students <strong>of</strong>ten come from extremely poor areas<br />
and experience high levels <strong>of</strong> anxiety about finance (SFP 1998:7). Callender<br />
(2003) states that students from disadvantaged backgrounds are less likely to<br />
have parents who attended university (cited in Cooke et al. 2004: 409) and<br />
thus cannot get answers to basic questions from their parents. Grayson<br />
(1996: 993) also states that the gap between high school and university is<br />
wider for students coming out <strong>of</strong> black schools and therefore they may have<br />
many more questions than other students. Their questions may also relate to<br />
basic survival in a new environment and may thus be deemed more<br />
important to these students. Thus staff ability to answer questions may have<br />
a greater than usual impact <strong>of</strong> student perceptions <strong>of</strong> Assurance and<br />
Assurance, as a service quality dimension, may be perceived as being more<br />
important to these students than staff realise.<br />
Employees need to be empowered to provide this service to their<br />
students. They must be made aware <strong>of</strong> the information needs <strong>of</strong> SFP students<br />
and be provided with the answers to their questions. Having staff who have<br />
the knowledge to answer the typical questions asked by SFP students<br />
63
Yvette Chetty & Debbie Vigar-Ellis<br />
without having to refer them to a host <strong>of</strong> other people will reduce the anxiety<br />
levels <strong>of</strong> these students, make their transition into the university smoother<br />
and ultimately improve their perceptions <strong>of</strong> the service quality <strong>of</strong>fered. Thus<br />
a system is needed to monitor whether staff feel that they are able to perform<br />
their duties and provide a platform to make their training needs known so<br />
that knowledge levels can be improved.<br />
Tangibles<br />
Because <strong>of</strong> the nature <strong>of</strong> services, the tangibles associated with the service in<br />
terms <strong>of</strong> the equipment, staff and operating hours become important in<br />
evaluating the level <strong>of</strong> quality they are receiving. The tangibles dimension<br />
was the only dimension where the average dimension score for students<br />
exceeded that <strong>of</strong> staff. In other words, this is the only dimension as a whole<br />
where student expectations were higher than staff. However it should also be<br />
noted that the Tangible dimension average was also the lowest overall. This<br />
means that Tangibles are the least important in terms <strong>of</strong> overall service<br />
quality. Nevertheless, three statements in this dimension showed negative<br />
gap scores where students had higher expectations than staff. Thus if SFP<br />
management wish to increase overall service quality, they should look at<br />
these aspects <strong>of</strong> service quality. The statements were 18 (modern-looking<br />
equipment), 20 (neat employee appearance) and 22 (convenient operating<br />
hours).<br />
The lower expectations <strong>of</strong> staff in statement 18 (equipment) could<br />
mean that they are more aware <strong>of</strong> the budget limitations that universities<br />
might be experiencing. They may also feel that the equipment merely<br />
provides support to their roles in terms <strong>of</strong> service delivery and thus are less<br />
important in terms <strong>of</strong> ultimate service delivery. Students on the other hand,<br />
may have the expectation that universities should have modern equipment.<br />
This may stem from the fact that their school environment was likely to lack<br />
such facilities as indicated by Grayson (1996: 993) and as they perceive the<br />
university to be part <strong>of</strong> an ‘advantaged society’ they expect to see up-to-date<br />
equipment. While staff does not impact this element <strong>of</strong> service, the<br />
university could consider emphasising in communication with these<br />
students, the state-<strong>of</strong>-the-art equipment the university does has. It could also<br />
ensure that teaching facilities are up-to-date and that staff use the various<br />
modern teaching tools available to them.<br />
64
… Service Quality in the UKZN Foundation Programme …<br />
In terms <strong>of</strong> the gap in expectations for statement 20 (employee<br />
appearance) staff may be used to the more casual attire which is common in<br />
the corporate environment <strong>of</strong> a university. Universities have traditionally<br />
paid less attention to dress code conformity than even the school system.<br />
Staff may also be focusing more on what they do in terms <strong>of</strong> student<br />
administration, counselling etc. than their appearance. Students on the other<br />
hand, may be familiar with people <strong>of</strong> authority such as their school<br />
administrators dressing well and therefore have this expectation <strong>of</strong> staff at<br />
the university. SFP management may want to encouraged staff to dress<br />
neatly and make them aware <strong>of</strong> the impressions their appearances make on<br />
the customers. It is acknowledged that this recommendation may be difficult<br />
to implement in the university setting.<br />
The lower expectation <strong>of</strong> staff in statement 22 (convenient operating<br />
hours) could be because many <strong>of</strong> the staff involved with the SFP students are<br />
also involved with other students in the university and thus are unable to<br />
adapt their service times / accessibility to the needs <strong>of</strong> SFP students<br />
specifically. The university systems (e.g. opening / working hours) are<br />
generally fairly controlled by university policies and rules. However, this<br />
was one <strong>of</strong> the two highest scoring expectations <strong>of</strong> students, and thus<br />
represents an element <strong>of</strong> service quality that they feel strongly about. If<br />
programme management wish to address service quality, then this gap will<br />
need to be dealt this. SFP management and staff could look at their operating<br />
hours in relation to the students’ timetables. It might be necessary to have<br />
some restructuring <strong>of</strong> timetables to accommodate the needs <strong>of</strong> students.<br />
Conclusion<br />
In addressing the call from Government to address the injustices <strong>of</strong> the<br />
apartheid past through the implementation <strong>of</strong> access programmes and<br />
ensuring customer satisfaction in the service quality <strong>of</strong>fered to access<br />
students, it is necessary for managers to be aware <strong>of</strong> the expectations <strong>of</strong> staff<br />
involved in the service delivery. This study found that overall, the staff had<br />
higher expectations than students did and thus the staff appear to understand<br />
the needs and expectations <strong>of</strong> their students. There were however, some<br />
negative gaps i.e. where staff expectations were lower than those <strong>of</strong> students.<br />
These may be <strong>of</strong> concern to SFP management as these lower expectations<br />
65
Yvette Chetty & Debbie Vigar-Ellis<br />
indicate that the staff do not place the same level <strong>of</strong> importance on these<br />
factors and are thus not likely to meet student expectations in these service<br />
areas. Lower expectations were found in three <strong>of</strong> the SERVQUAL<br />
dimensions, i.e. responsiveness, assurance and tangibles. Recommendations<br />
were made to SFP management to align the staff and student expectations on<br />
these service elements. Such alignment should ultimately improve the<br />
service quality delivered by staff, and perceived by SFP students.<br />
This study was limited to students and staff in a particular year and<br />
thus to determine whether such deficiencies are long term problems, it is<br />
also recommended that the study be repeated. A further limitation is that the<br />
study focused only on the point <strong>of</strong> entry into the university and thus did not<br />
address service quality expectations <strong>of</strong> teaching staff, for example. Again, to<br />
get a fuller picture <strong>of</strong> the extent <strong>of</strong> service quality and the alignment <strong>of</strong> staff<br />
and student expectations, this study should be extended to other stages in the<br />
service encounter. Despite these limitations however, the transition from<br />
school to university is particularly stressful for SFP students due to their<br />
disadvantaged backgrounds and thus improving the service quality at the<br />
first point in the transition will go a long way to improving the chances <strong>of</strong><br />
successful integration <strong>of</strong> these students into the university environment.<br />
References<br />
Cateora, G 2007. International Marketing. 13 th Edition. New York:<br />
McGraw-Hill.<br />
Cooke, R, M Barkham, K Audin & M Bradley 2004. How Social Class<br />
Differences Affect Students’ Experience <strong>of</strong> <strong>University</strong>. <strong>Journal</strong> <strong>of</strong><br />
Further and Higher Education 28,4: 407-421.<br />
De Jager, JW & AT Du Plooy 2006. Student’s Expectations <strong>of</strong> Service<br />
Quality in Tertiary Education: A Comparison between Prospective and<br />
Current Students. Acta Commercii 6: 10-19.<br />
Doole, I & R Lowe 2008. International Marketing Strategy: Analysis,<br />
development and implementation. 5 th Edition. London: Centage Learning<br />
EMEA.<br />
Du Plessis, P, C Jooste & J Strydom 2005. Applied Strategic Marketing. 2 nd<br />
Edition. Sandton: Heinemann.<br />
Grayson, DJ 1996. A Holistic Approach to Preparing Disadvantaged Stu-<br />
66
… Service Quality in the UKZN Foundation Programme …<br />
dents to Succeed in Tertiary Science Studies. Part 1. Design <strong>of</strong> the<br />
Science Foundation Programme (SFP). International <strong>Journal</strong> <strong>of</strong> Science<br />
Education 18,8: 993-1013.<br />
Hair, JF, RE Anderson, RL Tatham & WC Black 1998. Multivariate Data<br />
Analysis. Englewood Cliffs: Prentice-Hall.<br />
Kinnear, TC & JR Taylor 1996. Marketing Research: An Applied Approach.<br />
5 th Edition. United States <strong>of</strong> America. McGraw-Hill, Inc.<br />
Kotler, P & G Armstrong 2004. Principals <strong>of</strong> Marketing. 10 th Edition. New<br />
Jersey: Pearson Education International.<br />
Lovelock, C & J Wirtz 2007. Services Marketing: People, Technology,<br />
Strategy. 6 th Edition. USA: Prentice Hall.<br />
McColl, R, B Callaghan & A Palmer 1998. Services Marketing: A<br />
Managerial Perspective. Australia: McGraw-Hill Companies.<br />
Mullins, J & O Walker 2010. Marketing Management: A Strategic Decision-<br />
Making Approach. 7 th Edition. New York: McGraw-Hill.<br />
Mullins, J, O Walker & H Boyd 2008. Marketing Management: A Strategic<br />
Decision-Making Approach. 6 th Edition. New York: McGraw-Hill.<br />
Palmer, A 2005. Principles <strong>of</strong> Services Marketing. 4 th Edition. New York:<br />
McGraw-Hill.<br />
Parasuraman, A, A Zeithaml & LL Berry 1985. A Conceptual Model <strong>of</strong><br />
Service Quality and Its Implications for Future Research. <strong>Journal</strong> <strong>of</strong><br />
Marketing 49,4: 41-50.<br />
Robotham, D & C Julian 2006. Stress and the Higher Education Student: A<br />
Critical Review <strong>of</strong> the Literature. <strong>Journal</strong> <strong>of</strong> Further and Higher<br />
Education 30,2: 107-117.<br />
Rowley, DJ & H Sherman 2001. From Strategy to Change: Implementing<br />
the Plan in Higher Education. California: Jossey-Bass Inc.<br />
SFP 1998. 1998 Report <strong>of</strong> the Billiton Science Foundation Programme at<br />
the <strong>University</strong> <strong>of</strong> <strong>Natal</strong>, Pietermaritzburg.<br />
Shaik, N 2005. Marketing Distance Learning Programs and Courses: A<br />
Relationship Marketing Strategy. Available at: http://www.westga.<br />
edu/~distance/ojdla/summer82/shaik82.htm. (Accessed February 2010.)<br />
Walker, O & J Mullins 2008. Marketing Strategy A Decision Focused<br />
Approach. 6 th Edition. New York: McGraw-Hill Irwin.<br />
Walker, O, J Mullins & J Larreche 2008. Marketing Strategy: A Decision<br />
Focused Approach. International Edition. New York: McGraw-Hill.<br />
67
Yvette Chetty & Debbie Vigar-Ellis<br />
Welman, C, F Kruger & B Mitchell 2005. Research Methodology. 3 rd<br />
Edition. Southern Africa: Oxford <strong>University</strong> Press.<br />
Zeithaml, VA & MJ Bitner 2003. Services Marketing: Integrating Customer<br />
Focus across the Firm. 3 rd Edition. New York: McGraw-Hill.<br />
68<br />
Yvette Chetty<br />
School <strong>of</strong> Management<br />
<strong>University</strong> <strong>of</strong> <strong>KwaZulu</strong>-<strong>Natal</strong><br />
South Africa<br />
Debbie Vigar-Ellis<br />
School <strong>of</strong> Management<br />
<strong>University</strong> <strong>of</strong> <strong>KwaZulu</strong>-<strong>Natal</strong><br />
South Africa<br />
VigarD@ukzn.ac.za
The Threshold, Burden and Usefulness <strong>of</strong><br />
Financial Reporting for Small and<br />
Medium-Sized Entities in<br />
<strong>KwaZulu</strong>-<strong>Natal</strong><br />
Lesley Stainbank<br />
Mercy Tafuh<br />
Abstract<br />
A subject <strong>of</strong> debate by standard setters is whether there should be one set <strong>of</strong><br />
standards for all entities or different standards for different entities (i.e.<br />
differential reporting). The aim <strong>of</strong> this exploratory study is to examine the<br />
impact <strong>of</strong> International Financial Reporting Standards (IFRSs) on Small and<br />
Medium-sized Entities (SMEs) by reporting the results <strong>of</strong> a questionnaire<br />
survey which ascertained the perspectives <strong>of</strong> users <strong>of</strong> SMEs’ financial<br />
statements and accounting practitioners in <strong>KwaZulu</strong>-<strong>Natal</strong> in three areas:<br />
firstly, the threshold (or cut-<strong>of</strong>f) used in the definition <strong>of</strong> an SME, secondly,<br />
whether compliance with IFRSs places a burden on SMEs, and thirdly, the<br />
usefulness <strong>of</strong> SMEs’ financial statements to their users.<br />
This study provides evidence that the respondents to this survey<br />
were <strong>of</strong> the opinion that quantitative size criteria are an appropriate element<br />
in determining the threshold for differential reporting, that the costs <strong>of</strong><br />
preparing financial statements by SMEs using IFRSs outweigh any benefits<br />
and that users are <strong>of</strong> the opinion that the financial statements <strong>of</strong> SMEs are<br />
useful mainly to the South African Revenue Service, followed by financial<br />
institutions.<br />
Keywords: Differential reporting, SMEs, IFRSs, cost/ benefit constraint.<br />
<strong>Alternation</strong> Special Edition 4 (2011) 69 – 102<br />
ISSN 1023-1757<br />
69
Lesley Stainbank & Mercy Tafuh<br />
Introduction<br />
Prior to the enactment <strong>of</strong> the Corporate Laws Amendment Act (DTI 2006)<br />
on 14 December 2007, all private and public companies in South Africa<br />
were required to comply with South African Generally Accepted Accounting<br />
Practice (SA GAAP) or International Financial Reporting Standards<br />
(IFRSs). The International Accounting Standard Board (IASB) developed<br />
IFRSs for listed and multinational companies and did not initially consider<br />
the possible impact <strong>of</strong> IFRSs on small and medium-size enterprises (SMEs)<br />
(McBride & Fearnley 1999:71). The objective <strong>of</strong> IFRSs is to ensure<br />
comparability, reliability and the full disclosure <strong>of</strong> all relevant information<br />
to users and more recently, to prevent accounting abuse. However, this has<br />
placed a burden on SMEs’ financial reporting obligations due to the<br />
complex and voluminous nature <strong>of</strong> these standards. South Africa had been<br />
seeking a solution to the increasing complexities <strong>of</strong> IFRSs on SMEs for<br />
some time and in 2007, in anticipation <strong>of</strong> the enactment <strong>of</strong> the Corporate<br />
Laws Amendment Act which effectively introduced differential corporate<br />
reporting, the South African Institute <strong>of</strong> Chartered Accountants (SAICA)<br />
early adopted the Exposure Draft (ED) <strong>of</strong> an IFRS for SMEs (IASB 2007a)<br />
developed by the IASB (SAICA 2007).<br />
Problem Statement and Research Questions<br />
SMEs or unlisted entities represent the majority <strong>of</strong> entities preparing<br />
financial statements in all countries (Schiebel 2008:1). Despite the<br />
importance <strong>of</strong> SMEs in a country’s economy, SMEs face a number <strong>of</strong><br />
problems such as access to capital (Luetkenhorst 2004) and compliance with<br />
IFRSs. William (2004:16) comments that traditionally standard setters have<br />
concentrated on getting it right for listed companies who represent less than<br />
1% <strong>of</strong> all enterprises while full IFRSs may not be entirely applicable to<br />
SMEs.<br />
While studies (Holmes, Kent & Downey 1991; Hattingh 2002; Van<br />
Wyk 2005; Wells 2005; Maingot & Zeghal 2006) support the need for<br />
differential reporting, there is little consistency in the recommendations as to<br />
the appropriate threshold (or cut-<strong>of</strong>f) to be used in the definition <strong>of</strong> an SME.<br />
There is also increasing concern with regards to the high cost <strong>of</strong> compliance<br />
with IFRSs by SMEs (Van Wyk 2005:4; Warren 2004:47; Eurochambres<br />
70
Financial Reporting for Small and Medium-Sized Entities …<br />
2004:2; Sealy-Fisher 2005:14). Furthermore, users <strong>of</strong> SMEs’s financial<br />
statements are seldom consulted as to the kind <strong>of</strong> information they require<br />
(Schiebel 2008).<br />
This study thus seeks to answer the following research questions:<br />
• What are the perceptions <strong>of</strong> users <strong>of</strong> SMEs’ financial statements and<br />
accounting practitioners on the threshold (or cut <strong>of</strong>f) to be used in<br />
the definition <strong>of</strong> an SME?<br />
• What are the perceptions <strong>of</strong> users <strong>of</strong> SMEs’ financial statements and<br />
accounting practitioners regarding the burden that full IFRSs places<br />
on SMEs with emphasis on the cost <strong>of</strong> complying with IFRSs?<br />
• What are the perceptions <strong>of</strong> users <strong>of</strong> SMEs’ financial statements and<br />
accounting practitioners regarding the usefulness <strong>of</strong> SMEs’ financial<br />
statements to certain user groups?<br />
To answer the research questions, the IASB and South African<br />
differential corporate reporting requirements are discussed next followed by<br />
significant prior research regarding the threshold to be used for differential<br />
reporting, the burden <strong>of</strong> IFRSs on SMEs and the usefulness <strong>of</strong> SMEs’<br />
financial statements to various user groups. The research methodology is<br />
then presented followed by the results <strong>of</strong> the study. Finally, the conclusions,<br />
limitations and recommendations for further research are presented.<br />
Differential Reporting Requirements <strong>of</strong> the IASB and SAICA<br />
The objective <strong>of</strong> general-purpose financial statements is ‘to provide<br />
information about the financial position, performance and the changes in<br />
financial position <strong>of</strong> an entity that is useful to a wide range <strong>of</strong> users in<br />
making economic decisions’ (IASCF 1989:12). Thus ‘IFRSs are designed to<br />
apply to the general purpose financial statements and other financial<br />
reporting <strong>of</strong> all pr<strong>of</strong>it-orientated entities. Pr<strong>of</strong>it-orientated entities include<br />
those engaged in commercial, industrial, financial and similar activities,<br />
whether organised in corporate or in other forms’ (IASB 2007b:para 9).<br />
Although the IASB has the preliminary view that the objectives <strong>of</strong> generalpurpose<br />
financial statements are the same for all entities, it acknowledges<br />
that the types and needs <strong>of</strong> users <strong>of</strong> SMEs’ financial statements may be<br />
71
Lesley Stainbank & Mercy Tafuh<br />
different to those <strong>of</strong> users <strong>of</strong> financial statements <strong>of</strong> larger entities (IASB<br />
2004:15).<br />
The preliminary view <strong>of</strong> the IASB was that the objectives <strong>of</strong> a set <strong>of</strong><br />
financial reporting standards for SMEs should:<br />
(a) Provide high quality, understandable and enforceable accounting<br />
standards suitable for SMEs globally;<br />
(b) Focus on meeting the needs <strong>of</strong> users <strong>of</strong> SME financial statements;<br />
(c) Be built on the same conceptual framework as IFRSs;<br />
(d) Reduce the financial reporting burden on SMEs that want to use<br />
global standards; and<br />
(e) Allow easy transition to full IFRSs for those SMEs that become<br />
publicly accountable or choose to switch to full IFRSs (IASB<br />
2004:5).<br />
While the IASB did not prescribe a quantitative size test, and rather<br />
focused on public accountability, preferring that national jurisdictions would<br />
determine which entities would be required or allowed to use IFRSs for<br />
SMEs (IASB 2004:21), the IASB focused on a typical entity with about 50<br />
employees. This was not used as a quantitative size test for defining SMEs<br />
but rather to help the IASB decide on the kinds <strong>of</strong> transactions, events and<br />
conditions that should be explicitly addressed in the proposed IFRS for<br />
SMEs.<br />
The South African Department <strong>of</strong> Trade and Industry (DTI)<br />
addressed the issue <strong>of</strong> differential reporting in its corporate law reform<br />
program, which began in 2004 (DTI 2004a). The Corporate Laws<br />
Amendment Act, No. 24 <strong>of</strong> 2006 (DTI 2006) which represents Phase 1 <strong>of</strong> a<br />
two-phase process in reforming corporate law in South Africa provided<br />
interim amendments to the current Companies Act and introduced two types<br />
<strong>of</strong> companies for purposes <strong>of</strong> financial reporting, the widely held company<br />
and the limited interest company. As part <strong>of</strong> Phase 2 <strong>of</strong> the corporate law<br />
process in South Africa, the DTI subsequently issued the Companies Bill,<br />
2007 (DTI 2007). This was superseded by the Companies Bill 2008 (DTI<br />
2008), which has now been issued as the Companies Act, No. 71 <strong>of</strong> 2008<br />
(DTI 2009).<br />
72
Financial Reporting for Small and Medium-Sized Entities …<br />
The Corporate Laws Amendment Act distinguished between widely<br />
held and limited interest companies and introduced differential reporting by<br />
requiring compliance with different financial reporting standards for the two<br />
different types <strong>of</strong> companies. Because accounting standards had not yet been<br />
developed for limited interest companies, section 56(3)(a) <strong>of</strong> the Corporate<br />
Laws Amendment Act provided a transitional provision which, according to<br />
SAICA, meant that limited interest companies without public accountability<br />
could, in the interim period, either continue to comply with IFRSs, or early<br />
adopt the IASB’s Exposure Draft (ED) <strong>of</strong> a proposed IFRS for SMEs which<br />
SAICA adopted in 2007 as Statement <strong>of</strong> Generally Accepted Accounting<br />
Practice for SMEs (SAICA 2007).<br />
The Companies Bill, 2007 (DTI 2007) proposed the following cut<strong>of</strong>f<br />
totals to differentiate between closely held versus widely held for pr<strong>of</strong>it<br />
companies.<br />
Criteria threshold Closely held for pr<strong>of</strong>it companies<br />
Asset value < R25 000 000<br />
Annual turnover
Lesley Stainbank & Mercy Tafuh<br />
Companies which do not meet these criteria would not have to be<br />
audited and the financial reporting framework would be less onerous.<br />
These quantitative size tests are not in the subsequent Companies<br />
Bill, 2008 (DTI 2008) nor in the Companies Act, No. 71 <strong>of</strong> 2008 which<br />
superseded the Companies Bill 2008. Instead two types <strong>of</strong> companies are<br />
identified, namely pr<strong>of</strong>it companies and non-pr<strong>of</strong>it companies. Pr<strong>of</strong>it<br />
companies can be a state-owned company, a private company or a public<br />
company (DTI 2009: Section 8). Section 29 (5) (c) (ii) allows the Minister,<br />
after consulting with the Financial Reporting Standards Council, to establish<br />
different standards applicable to different categories <strong>of</strong> pr<strong>of</strong>it companies.<br />
However, the Companies Act, No. 71 <strong>of</strong> 2008 does allow some exemption<br />
from the audit requirement for companies based on their annual turnover, the<br />
size <strong>of</strong> its workforce or the nature and extent <strong>of</strong> its activities (DTI 2009:<br />
Sec 30(2)(b)(i)). This may indicate that quantitative size criteria are<br />
important.<br />
Literature Review<br />
This literature review discusses three areas relevant to this study: the<br />
threshold for differential reporting; the burden <strong>of</strong> IFRSs on SMEs (i.e. the<br />
cost/benefit constraint), and the usefulness <strong>of</strong> SMEs’ financial statements to<br />
the users <strong>of</strong> those financial statements.<br />
The Threshold for Differential Reporting<br />
A number <strong>of</strong> countries define an SME using quantitative size criteria. For<br />
example, the European Commission (2003:2) used a combination <strong>of</strong> staff<br />
head count, turnover, and total assets to determine whether an entity is large,<br />
medium, small or micro. These are shown in Table 2.<br />
There are considerable differences in opinion regarding the relevant<br />
quantitative cut-<strong>of</strong>f points. While the Czech Republic, Germany, Hungary<br />
and Poland agree with the EU recommendations <strong>of</strong> quantitative size criteria<br />
for micro entities, Denmark uses lower cut-<strong>of</strong>f points with 10m DKK<br />
(€1,270,000) for turnover, but only 4m DKK (€526,000) for total assets.<br />
Estonia uses even lower cut-<strong>of</strong>fs <strong>of</strong> €639,000 and €319,500 for turnover and<br />
balance sheet total respectively (IFAC 2006:25). New Zealand, Australia<br />
74
Enterprise<br />
category<br />
Financial Reporting for Small and Medium-Sized Entities …<br />
Head count Turnover Balance sheet<br />
total<br />
Large < 250 < €50million 250 > €50million > €43million<br />
Small > 50 > €10million > €10million<br />
Micro > 10 > €2million > €2million<br />
Source: European Commission (2003:2)<br />
Legend: < greater than/ more than; > less than/ fewer than<br />
Table 2: European Commission classification <strong>of</strong> SMEs<br />
and China also use size criteria in the definition <strong>of</strong> SMEs. These cut-<strong>of</strong>f<br />
points could also be compared to the criteria referred to in the National<br />
Small Business Amendment Act, No. 15 <strong>of</strong> 2004 (DTI 2004b) (and<br />
contained in the National Small Business Amendment Act, No. 26 <strong>of</strong> 2003)<br />
(DTI 2003) which uses the full-time equivalent <strong>of</strong> paid employees, total<br />
turnover, and total gross asset value excluding fixed property to determine<br />
whether the size <strong>of</strong> an enterprise is micro, very small, small or medium.<br />
These criteria differ according to the sector or subsectors in accordance with<br />
the Standard Industrial Classification.<br />
The disadvantages <strong>of</strong> using quantitative criteria are that firstly, there<br />
is no uniformity because turnover or balance sheet cut-<strong>of</strong>f totals vary<br />
between countries rendering comparability difficult. Secondly, there is a<br />
need to constantly revise the amounts to meet the growing pace <strong>of</strong> the<br />
economy. Curran and Blackburn (2001:22) also comment that the number <strong>of</strong><br />
employees can be distorted by the increasing use <strong>of</strong> part-time employees,<br />
casual workers and outsourcing, while balance sheet figures depend upon the<br />
specific rules used.<br />
The advantage <strong>of</strong> using quantitative criteria is that standards may be<br />
set for larger and more complex entities, and do not have to take into<br />
consideration small entities. These small entities will have their own<br />
standards such as IFRS for SMEs.<br />
What should be the threshold for differential corporate reporting has<br />
been a continuous debate in many countries (Martin 2005:4).<br />
75
Lesley Stainbank & Mercy Tafuh<br />
According to Heymans (2000:para 2), the threshold is an issue not<br />
only in South Africa but also in leading countries such as the United<br />
Kingdom (UK), Australia, New Zealand and Hong Kong. These countries<br />
have addressed differential reporting using size criteria (Martin 2005:1).<br />
Size has been described by many as a moving target which is not a measure<br />
for differentiation. Wells (2005:106) and Holmes et al. (1991:128) identify<br />
size criteria and also legal structure as an important element in the definition<br />
<strong>of</strong> differential reporting. Wells (2005) concludes that SA GAAP is<br />
appropriate for big entities with users with the rate <strong>of</strong> acceptability being<br />
lower where big entities have a narrow user base or a less regulated entity<br />
form. Barker and Noonan (1996) use size and ownership structure as<br />
elements to be used for the differentiation <strong>of</strong> big and small entities. A<br />
distinction should be made between the ‘small entities staying small’ and<br />
‘small companies growing’. Entities that have ambition to grow are more<br />
willing to accept regulations. These entities see the financial statements as a<br />
means <strong>of</strong> attracting investors. Growing companies always look for outside<br />
investors and they would continue to prepare their financial statements in<br />
accordance with IFRSs.<br />
An alternative to using quantitative size tests is to define SMEs by<br />
identifying who are the users <strong>of</strong> the financial statements.<br />
The Burden <strong>of</strong> IFRSs on SMEs<br />
The benefits derived from information should exceed the costs <strong>of</strong> providing<br />
the information. SAICA (2003:Par18) concluded that benefits usually<br />
decrease with a decrease in the number and diversity <strong>of</strong> users and their<br />
information needs.<br />
Small companies with limited staff and resources might incur<br />
significant incremental costs when required to comply with accounting<br />
standards. These full standards place a burden on all companies but the cost<br />
for large companies with the advantages <strong>of</strong> economies <strong>of</strong> scale may not be<br />
significant (Upton & Ostergaard 1985:96). Crains, Hosp and Martins<br />
(2006:24) comment that it was probably very complex for listed companies<br />
too, but they had the necessary resources to bear the costs. According to<br />
Crains et al. (2006), the three main areas <strong>of</strong> cost are audit cost at 40%,<br />
increased technology cost at 56% and personnel cost at 4%.<br />
76
Financial Reporting for Small and Medium-Sized Entities …<br />
Carsberg, Page, Sindall and Waring (1985:18) outline the different<br />
types <strong>of</strong> costs incurred as a result <strong>of</strong> compliance as follows:<br />
(a) Direct costs paid to auditors and external accountants.<br />
(b) The cost <strong>of</strong> disclosure <strong>of</strong> sensitive information to competitors where<br />
larger organizations can usually conceal such details in group<br />
financial statements.<br />
(c) Opportunity costs. Companies might miss other pr<strong>of</strong>itable<br />
opportunities because <strong>of</strong> the extra work required to comply with<br />
standards.<br />
(d) The cost <strong>of</strong> credibility with clients and fee write-<strong>of</strong>f. This is when<br />
accountants are required to produce pages <strong>of</strong> reports which require<br />
explanation and for which the clients are reluctant to pay.<br />
(e) The costs <strong>of</strong> complying with legal requirements.<br />
Cleminson and Rabin (2002) conclude that SA GAAP is a<br />
significant problem for SMEs due to complexity <strong>of</strong> standards and the costs<br />
<strong>of</strong> compliance. Research conducted by Kruger in 2004 as reported by Van<br />
Wyk (2005:11) indicates that compliance with SA GAAP is the price to be<br />
paid for limited liability and that small entities should have a separate set <strong>of</strong><br />
accounting standards in order to release these entities from the burden <strong>of</strong><br />
complying with the SA GAAP.<br />
Carsberg et al. (1985) provide some evidence on the burden <strong>of</strong><br />
GAAP on SMEs from a study on small company financial reporting in the<br />
UK. The sampled population comprised directors <strong>of</strong> SMEs and partners in<br />
accounting firms where interviews were done based on questionnaires. They<br />
found that small entity directors have little knowledge <strong>of</strong> the impact <strong>of</strong><br />
financial reporting on SMEs. Only 4% <strong>of</strong> these directors thought <strong>of</strong> financial<br />
reporting as a main problem. This was because their financial statements<br />
were mostly prepared by the accounting practitioners. Auditors, on the other<br />
hand, viewed the burden <strong>of</strong> financial reporting as serious. Costs identified<br />
include:<br />
77
Lesley Stainbank & Mercy Tafuh<br />
• the cost <strong>of</strong> producing financial accounting information, including the<br />
direct costs <strong>of</strong> preparing the information (either from within the<br />
business or by hiring an accountant), printing and publishing the<br />
information and possibly auditing the information;<br />
• the direct cost, that is the fee paid to the auditors/external<br />
accountants;<br />
• opportunity costs which are the loss <strong>of</strong> pr<strong>of</strong>itable opportunities<br />
through the burden <strong>of</strong> compliance; and<br />
• the potential cost <strong>of</strong> disclosing information to a competitor.<br />
Despite the different costs mentioned in Carsberg et al.’s (1985)<br />
study as a result <strong>of</strong> compliance with GAAP by small entities, very little<br />
evidence exists to suggest that there is a high burden imposed by the<br />
standards on SMEs because a high percentage <strong>of</strong> the respondents seemed to<br />
be unaware <strong>of</strong> any compliance burden with financial reporting by SMEs.<br />
Eleven years later, Barker and Noonan (1996:13) concluded that the<br />
costs <strong>of</strong> preparing financial statements and audit fees were the most<br />
expensive elements <strong>of</strong> accounting. Practitioners therefore, chose to comply<br />
with standards only when these standards are material. Eighty-three percent<br />
<strong>of</strong> the respondents acknowledged that there is a great burden in complying<br />
with full GAAP.<br />
Providing a different point <strong>of</strong> view are Joshi and Ramadhan<br />
(2002:438) who examined the relevance <strong>of</strong> the International Accounting<br />
Standards (IASs) (i.e. IFRSs) to small and closely held companies in<br />
Bahrain. Joshi and Ramadhan’s study examined the attitudes <strong>of</strong> pr<strong>of</strong>essional<br />
accountants working in these companies. Many <strong>of</strong> the selected companies<br />
had limited liability. The results <strong>of</strong> the study revealed that 86% <strong>of</strong> the<br />
pr<strong>of</strong>essional accountants acknowledged that their staff are capable <strong>of</strong><br />
preparing financial statements based on IASs. Eighty-five percent <strong>of</strong> the<br />
respondents had no difficulties in interpreting these standards. Eighty-five<br />
percent <strong>of</strong> the respondents said IASs are not costly to apply and 86%<br />
confirmed that adopting these standards improves the efficiency and<br />
effectiveness <strong>of</strong> financial reporting. It was therefore concluded that IASs<br />
78
Financial Reporting for Small and Medium-Sized Entities …<br />
were not costly to adopt by SMEs and that these standards help to achieve<br />
the objectives and improve the effectiveness <strong>of</strong> financial reporting.<br />
In 2005, the American Institute <strong>of</strong> Certified Public Accountants<br />
(AICPA) (2005:18) issued the Private Company Financial Reporting Task<br />
Force Report in the United States <strong>of</strong> America (USA). This study targeted<br />
external stakeholders, business owners, financial managers and accounting<br />
practitioners. All groups, especially the practitioners, perceived it extremely<br />
challenging to keep current and up-to-date with GAAP. Most <strong>of</strong> the external<br />
stakeholders rated GAAP as complex in terms <strong>of</strong> understanding and usage.<br />
The majority <strong>of</strong> the entities surveyed hired external accountants to prepare<br />
their accounts due to the complex nature <strong>of</strong> GAAP. Comparing the benefits<br />
<strong>of</strong> using GAAP with its cost, all respondent groups, especially the<br />
practitioners, rated the benefits <strong>of</strong> preparing or using the standards compared<br />
to the cost as being low.<br />
A survey conducted in Canada by Maingot and Zeghal (2006:522)<br />
analysed the responses <strong>of</strong> 162 CAs and Certified General Accountants<br />
(CGA) concerning financial reporting <strong>of</strong> Small Business Entities (SBEs) in<br />
Canada. Respondents were asked to rank the weaknesses <strong>of</strong> GAAP. ‘Time<br />
consuming’ was ranked as the main burden encountered by SBEs as a result<br />
<strong>of</strong> compliance with full GAAP. ‘Too complex’, ‘too costly’ and ‘lack <strong>of</strong><br />
relevance’ were equally ranked as reporting problems suffered by SBEs. To<br />
reduce the burden <strong>of</strong> reporting by SBEs, computerization <strong>of</strong> the accounting<br />
system was ranked highest. Several recommendations were made such as the<br />
setting <strong>of</strong> special standards and the reduction <strong>of</strong> regulations and accounting<br />
standards. There was very little support for the complete exemption <strong>of</strong><br />
accounting standards by the respondents.<br />
The Users <strong>of</strong> SMEs’ Financial Statements and their Information<br />
Needs<br />
In Australia, the ‘the users <strong>of</strong> financial statements’ is an important<br />
characteristic in defining an SME (SAICA 2002:3). SAICA (2001) identifies<br />
small entities as those entities with a limited number <strong>of</strong> users and whose<br />
users do not rely solely on the financial statements for financial information.<br />
Studies have concluded that the users <strong>of</strong> small entities’ financial statements<br />
are financial institutions, creditors and the revenue collection service (Van<br />
79
Lesley Stainbank & Mercy Tafuh<br />
Wyk 2005:7; Hepp & McRae 1982:56; Anderson 1999; Maingot & Zeghal<br />
2006:525).<br />
The IASB’s conceptual framework identifies the key users <strong>of</strong><br />
financial statements as investors, lenders, suppliers and other trade creditors,<br />
employees, customers, government (and their agencies) and the public<br />
(IASCF 1989). The main problem faced by the preparers <strong>of</strong> financial<br />
statements is the identification <strong>of</strong> the needs <strong>of</strong> users <strong>of</strong> both private and<br />
public companies. Therefore, for financial statements to be useful, it must<br />
meet the needs <strong>of</strong> different users. The information provided should (SAICA<br />
2003:3):<br />
• fulfil the needs <strong>of</strong> the users;<br />
• be presented in an easy to understand manner to the users;<br />
• enhance comparability over time and also between entities; and<br />
• enable an assessment <strong>of</strong> the balance between benefit and cost.<br />
SAICA (2003:para14) identifies the users <strong>of</strong> Limited Purpose<br />
Financial Statements (LPFS) as owners, the South African Revenue Service<br />
(SARS) and anyone else entitled to receive the financial statements and who<br />
has the right to demand extra information if desired.<br />
Riahi-Belkaoui (2004:50) differentiates between the primary users<br />
<strong>of</strong> financial statements <strong>of</strong> public companies who are financial analysts and<br />
public shareholders as opposed to private companies whose primary users<br />
are the owner managers and creditors. These different groups <strong>of</strong> users are<br />
perceived to have different information needs. However, in the conceptual<br />
framework, investors are the defining class <strong>of</strong> users since it is thought that if<br />
the contents <strong>of</strong> financial statements are drawn up with the needs <strong>of</strong> investors<br />
in mind, the various needs <strong>of</strong> other potential and current users will also be<br />
satisfied (IASCF 1989).<br />
Crains et al. (2006) analysed the differences between investors in<br />
large listed companies and small entities. Investors in large companies need<br />
relevant information to buy, hold or sell shares and also to make future<br />
decisions over their holdings while investors in SMEs do not have the ability<br />
to increase or dispose <strong>of</strong> their holdings except in the long run.<br />
Although the IASB’s preliminary view is that full IFRSs are suitable<br />
for all entities, the IASB noted that the users <strong>of</strong> SMEs’ financial statements<br />
80
Financial Reporting for Small and Medium-Sized Entities …<br />
may have less interest in some information in financial statements compared<br />
to the users <strong>of</strong> financial statements <strong>of</strong> entities that have public accountability<br />
(IASB 2004:14). For example, the IASB considers that users <strong>of</strong> SMEs’<br />
financial statements may have more interest in short-term cash flows rather<br />
than long-term cash flows. The IASB conclude that any differences in full<br />
IFRSs and IFRS for SMEs will thus be determined on the basis <strong>of</strong> user needs<br />
and cost-benefit analyses. This has led to some criticism <strong>of</strong> the IASB as it<br />
has been contended that the IASB has not considered two vital questions:<br />
1. Who are the external users <strong>of</strong> SMEs’ general purpose financial<br />
statements worldwide?<br />
2. What kind <strong>of</strong> information do those external users need from SMEs?<br />
(Schiebel 2008:17).<br />
The AICPA found that there are few users <strong>of</strong> small company<br />
financial statements (Mosso 1983:18). Sixty five percent <strong>of</strong> small private<br />
companies studied by the AICPA have eight or fewer owners and many were<br />
owner managers. This was in contrast to large companies which <strong>of</strong>ten had<br />
more than 300 shareholders. The number <strong>of</strong> creditors for small entities is<br />
also very small when compared to large companies (Mosso 1983:18). Users<br />
<strong>of</strong> small entities’ financial reports are predominantly different kinds <strong>of</strong><br />
people with different kinds <strong>of</strong> needs from the users <strong>of</strong> large companies’<br />
financial reports, and consequently no practical need exists for<br />
comparability.<br />
Unlike public companies, private companies’ financial statements<br />
are not public documents. They are used only by the managers, tax<br />
authorities and creditors. These users have the right to demand additional<br />
information.<br />
There has been little research into identifying who are the users <strong>of</strong><br />
SMEs’ financial statements and what their information needs are (Schiebel<br />
2008). Schiebel is <strong>of</strong> the opinion that this should be the starting point for<br />
developing accounting standards for SMEs. To substantiate his position,<br />
Schiebel (2008:11) examines the literature on common information needs <strong>of</strong><br />
external users <strong>of</strong> SMEs’ financial statements and concludes that the research<br />
so far has focused on ‘one group <strong>of</strong> external users and one region or country<br />
at a time’, and that ‘[n]o information is available about the common<br />
81
Lesley Stainbank & Mercy Tafuh<br />
information needs <strong>of</strong> various external groups on a national or international<br />
level.’ He argues furthermore that the IASB failed to determine the<br />
information needs <strong>of</strong> external users <strong>of</strong> SMEs financial statements and the<br />
kind <strong>of</strong> information those external users require from SMEs, and instead has<br />
relied on the responses by the accounting regulators, pr<strong>of</strong>ession and<br />
academics when the IASB should have focused on the users and preparers <strong>of</strong><br />
SMEs’ financial statements (2008:18). Literature quoted by Schiebel (2008)<br />
includes Evans, Gebhardt, Hoogendoorn, Marton, di Pietra, Mora,<br />
Thinggård, Vehmanen, and Wagenh<strong>of</strong>er (2005) who identified significant<br />
gaps in the research literature on SMEs findings and concluded that<br />
relatively little is known about the actual views and needs <strong>of</strong> ownermanagers<br />
and other users, and Anacoreta and Silva (2005) who note that<br />
12% <strong>of</strong> the commentators to the IASB’s Discussion Paper request the IASB<br />
to do detailed research into the common information needs <strong>of</strong> external users<br />
<strong>of</strong> SMEs’ financial statements. Evans et al. (2005) recommend that the<br />
IASB initiate in-depth research to determine to what extent the needs <strong>of</strong><br />
owner-managers and other users <strong>of</strong> SME financial statements differ between<br />
larger versus the smaller SMEs, and to what extent they may differ internationally.<br />
Schiebel (2008) also referred to Sinnett and de Mesa Graziano<br />
whose study for the Financial Executives Research Foundation (FERF) in<br />
2006 identified that commercial and investment bankers and equity investors<br />
want audited annual US GAAP financial statements, and in fact want more<br />
information from unlisted entities than is provided under US GAAP.<br />
The literature survey <strong>of</strong> Botosan, Ashbaugh-Skaife, Beatty, Davis-<br />
Friday, Hopkins, Nelson, Ramesh, Uhl, Venkatachalam, and Vrana (2006)<br />
concludes that the major users <strong>of</strong> unlisted entities’ financial statements do<br />
not see a need for differential financial reporting and prefer US GAAP. They<br />
recommend the IASB to respond cautiously to requests for GAAP<br />
exceptions supported primarily by complexity arguments.<br />
Research Methodology<br />
This exploratory study, which provides descriptive data only, examines the<br />
perceptions <strong>of</strong> users <strong>of</strong> SMEs’ financial statements and accounting<br />
practitioners (as the preparers <strong>of</strong> SMEs’ financial statements) towards the<br />
threshold (or cut-<strong>of</strong>f) to be used for differential reporting, the costs<br />
82
Financial Reporting for Small and Medium-Sized Entities …<br />
associated with complying with IFRSs and the usefulness <strong>of</strong> SMEs’<br />
financials statements to its user groups.<br />
To represent the target group <strong>of</strong> users <strong>of</strong> SMEs’ financial<br />
statements, Masters in Business Administration (MBA) students were<br />
chosen. This group was characterized by all respondents having a minimum<br />
<strong>of</strong> five years work experience <strong>of</strong> which three years were either at a<br />
supervisory or management level. This respondent group had all completed a<br />
module in financial accounting and were all aware <strong>of</strong> differential reporting.<br />
Further-more, they were either employees or owner-managers. As such, this<br />
target group was used as a surrogate for the users <strong>of</strong> SMEs’ financial<br />
statements.<br />
Liyanarachchi (2007) reviews and syntheses research in this area<br />
and finds that accounting students may be adequate surrogates for<br />
practitioners in many decision-making experiments. Elliot, Hodge, Kennedy<br />
and Pronk’s (2009) results indicate that MBA students can be used as<br />
proxies for non-pr<strong>of</strong>essional investors (i.e. users <strong>of</strong> information) provided<br />
that the task is aligned to their appropriate level. In the current study the<br />
research task involved answering a questionnaire on a topic <strong>of</strong> which they<br />
had some knowledge and experience. The MBA students were therefore<br />
considered suitable to express an opinion on the impact <strong>of</strong> IFRSs on SMEs.<br />
The choice <strong>of</strong> the accounting practitioners stems from the fact that<br />
they are all chartered accountants (CAs) and thus more knowledgeable or<br />
better informed on IFRSs. A background question revealed that 44% <strong>of</strong> the<br />
practitioners had less than four years experience, 22% <strong>of</strong> the practitioners<br />
had between four and twelve years experience and 26% <strong>of</strong> the respondents<br />
had more than twelve years experience. Two practitioners (8%) did not<br />
answer this question. Although the respondents had a range <strong>of</strong> years <strong>of</strong><br />
experience, the prevalence <strong>of</strong> more respondents with less experience has<br />
also been documented in other South African studies. For example, in the<br />
Wells’ (2005) study, 30% <strong>of</strong> his target group had less than 10 years<br />
experience.<br />
With regards to size <strong>of</strong> practice, 15% <strong>of</strong> the respondents indicated<br />
that they belonged to a large practice; 37% belonged to a medium-sized<br />
practice and 37% belonged to a small practice. Three respondents (11%) did<br />
not answer this question. This analysis shows that the respondents had<br />
varying amounts <strong>of</strong> experience and belonged to different sizes <strong>of</strong> practices.<br />
83
Lesley Stainbank & Mercy Tafuh<br />
However, because the number <strong>of</strong> respondents in each background<br />
demographic is low, experience and size <strong>of</strong> practice was not used in the<br />
analysis <strong>of</strong> the results which follow.<br />
The target groups were not chosen by statistical sampling but<br />
conveniently from the MBA class at the <strong>University</strong> <strong>of</strong> <strong>KwaZulu</strong>-<strong>Natal</strong><br />
(UKZN) and the population <strong>of</strong> chartered accountants in KZN. A total <strong>of</strong> 45<br />
questionnaires were handed out to the MBA students and only 14 (31%)<br />
completed questionnaires were returned.<br />
To distribute the questionnaires to the accounting practitioners’<br />
target group, three visits and three meetings were held with the Regional<br />
Director <strong>of</strong> SAICA in KZN. As an attempt to e-mail the questionnaire to<br />
sixty accounting firms resulted in few replies, accounting firms in Durban<br />
were visited and copies <strong>of</strong> the questionnaire were left for later collection.<br />
Out <strong>of</strong> 161 questionnaires that were administered to the accounting<br />
practitioners, only 31 (19%) were returned.<br />
To ensure the reliability and validity <strong>of</strong> the data, methods <strong>of</strong><br />
measuring reliability were not used as the target groups were sophisticated<br />
sub-populations <strong>of</strong> all MBA students at UKZN or all chartered accountants<br />
at selected accounting firms in Durban. Therefore, reliability was expected.<br />
With regards to validity, in view <strong>of</strong> the straightforwardness <strong>of</strong> the<br />
questionnaire, and the reasonableness <strong>of</strong> the responses, it was concluded that<br />
the questionnaire possessed validity and other methods <strong>of</strong> approaching<br />
validity were not pursued.<br />
Discussion <strong>of</strong> the Results<br />
Although the theoretical justification <strong>of</strong> differential reporting lies in the<br />
consideration <strong>of</strong> the cost/benefit constraint and the objective <strong>of</strong> financial<br />
statements, the questionnaire first set out to establish from the respondents<br />
whether IFRSs are suitable for all entities irrespective <strong>of</strong> size, type and<br />
nature <strong>of</strong> the entity. The reason for this question is to establish whether or<br />
not the respondent groups are <strong>of</strong> the opinion that different entities may<br />
require different reporting standards and if so, they would then have an<br />
opinion on the various matters which were being investigated in this study.<br />
The results <strong>of</strong> this question are shown in Table 3.<br />
84
Financial Reporting for Small and Medium-Sized Entities …<br />
Users Practitioners Total<br />
No. % No. % No. %<br />
Agree 7 50 4 15 11 24<br />
Disagree 7 50 23 85 30 76<br />
Total 14 100 27 100 41 100<br />
Table 3: Are full IFRSs suitable for all entities irrespective <strong>of</strong> size, type<br />
and nature?<br />
An inspection <strong>of</strong> the total responses presented in Table 3 suggests<br />
that full IFRSs should not be considered suitable for all entities. However,<br />
the users were split evenly on this issue. This is not true <strong>of</strong> the practitioners<br />
since 85% <strong>of</strong> the practitioners disagree with this assertion. The support for<br />
full IFRSs by users <strong>of</strong> SMEs may be because their annual financial<br />
statements are prepared by experts or CAs hired by their entities or, the<br />
MBA students as surrogates for the user group, are not as aware as the<br />
practitioners <strong>of</strong> the issues surrounding the use <strong>of</strong> full IFRSs. Practitioners<br />
may be in a better position to assess the burden <strong>of</strong> IFRSs on SMEs, hence<br />
their lower support.<br />
Reasons given by those respondents who consider full IFRSs<br />
suitable for SMEs are that it enhances comparability within entities and<br />
countries; that all entities should apply the same standards; that these<br />
standards are important enough to be maintained; that small businesses will<br />
have the opportunity to do business with large companies and obtain loans<br />
from banks; that there should be common standards which all entities should<br />
follow irrespective <strong>of</strong> their size; and that financial statements will be reliable<br />
as a result <strong>of</strong> using full IFRSs. They also perceived that the global<br />
application <strong>of</strong> a one-tier system will lead to harmonization <strong>of</strong> accounting<br />
standards.<br />
On the other hand, respondents who did not perceive full IFRSs to<br />
be suitable for SMEs stated that it is too costly; that the standards lack<br />
relevance; that much time is needed in the preparation <strong>of</strong> the financial<br />
statements; that the standards are constantly being revised; and that they are<br />
very complex. Some other arguments against full IFRSs are that IFRSs are<br />
designed for large listed entities; certain aspects <strong>of</strong> IFRSs provides no value<br />
85
Lesley Stainbank & Mercy Tafuh<br />
to small entities; certain aspects <strong>of</strong> IFRSs are not applicable to small entities<br />
and should be discarded; clients resist the high fee which arises as a result <strong>of</strong><br />
lengthy reports; and there is the need to keep records simple for small<br />
entities because detailed disclosures add little value to the entity.<br />
Overall, these results confirm the findings by Holmes et al. (1991),<br />
Hattingh (2002) and Wells (2005) that there is support for differential<br />
reporting, although in this current study, the users are neutral in their<br />
response.<br />
The Threshold for Differential Reporting<br />
One <strong>of</strong> the key issues to be addressed in the context <strong>of</strong> differential reporting<br />
is the use <strong>of</strong> quantitative size criteria in the definition <strong>of</strong> SMEs. Respondents<br />
were first asked whether size is considered an appropriate element in the<br />
definition <strong>of</strong> SMEs. The results <strong>of</strong> this question are shown in Table 4.<br />
Users Practitioners Total<br />
No. % No. % No. %<br />
Yes 11 79 17 63 28 68<br />
No 3 21 10 37 13 32<br />
Total 14 100 27 100 41 100<br />
Table 4: Are quantitative size criteria an appropriate element in the<br />
definition <strong>of</strong> SMEs?<br />
The aggregate responses presented in Table 4 suggest that a<br />
quantitative size criterion is considered to be a suitable element in the<br />
definition <strong>of</strong> SMEs with 68% <strong>of</strong> all respondents in agreement. Size is<br />
considered an appropriate criterion in the definition <strong>of</strong> SMEs by 79% <strong>of</strong> the<br />
users. Only 63% <strong>of</strong> the practitioners perceived size as being important. This<br />
result supports the current situation in the UK, Australia and New Zealand<br />
where quantitative size criteria are used as a distinguishing factor for small<br />
and large entities.<br />
In order to identify the cut-<strong>of</strong>f values for a suitable size threshold in<br />
the definition <strong>of</strong> SMEs, respondents were asked to suggest suitable amounts<br />
for total assets, turnover and number <strong>of</strong> employers. This question was<br />
86
Financial Reporting for Small and Medium-Sized Entities …<br />
directed only to those who perceived quantitative size criterion to be an<br />
important element in the definition <strong>of</strong> SMEs. These results are shown in<br />
Table 5.<br />
Table 5 shows that all the respondents who considered size to be an<br />
appropriate criterion in the definition <strong>of</strong> SME proposed an amount for the<br />
three elements. Users prefer total assets up to R5 million, revenue up to R5<br />
million and total employees <strong>of</strong> between 20 and 30. The practitioners, on the<br />
Total assets<br />
Revenue<br />
Number <strong>of</strong><br />
employees<br />
Users Practitioners Total<br />
No. % No. % No. %<br />
R0-R5m 7 64 5 29 12 43<br />
R5m-R10m 0 0 3 18 3 11<br />
R10m-R15m 0 0 3 18 3 11<br />
R15m-R20m 3 27 1 6 4 13<br />
R20m-R25m 1 9 2 12 3 11<br />
R25m and > 0 0 3 17 3 11<br />
Total 11 100 17 100 28 100<br />
R0 -R5m 7 64 1 6 8 29<br />
R5 m– 10m 0 0 3 18 3 11<br />
R15m-R20m 2 18 0 0 2 7<br />
R20m-R25m 2 18 0 0 2 7<br />
R25m and > 0 0 13 76 13 46<br />
Total 11 100 17 100 28 100<br />
1-10 2 18 0 0 2 7<br />
10-20 0 0 0 0 0 0<br />
20-30 5 46 1 6 6 21<br />
30-40 1 9 7 41 8 29<br />
40-50 3 27 1 6 4 14<br />
50 and > 0 0 8 47 8 29<br />
Total 11 100 17 100 28 100<br />
Note: Total responses correspond to ‘yes’ in Table 4.<br />
Table 5: Amounts considered suitable in the definition <strong>of</strong> SMEs<br />
87
Lesley Stainbank & Mercy Tafuh<br />
other hand, showed no clear preference with respect to total assets, but<br />
preferred revenue <strong>of</strong> more than R25 million and total employees <strong>of</strong> more<br />
than 50 (with the majority <strong>of</strong> the practitioners preferring total employees<br />
exceeding 30). Table 5 indicates that even though a majority <strong>of</strong> the<br />
respondents support size as an appropriate element in the definition <strong>of</strong><br />
SMEs, choosing the value <strong>of</strong> total assets, revenue and number <strong>of</strong> employees<br />
to be used for the threshold <strong>of</strong> differential reporting is a debatable issue<br />
especially for the user group, with the practitioners applying much higher<br />
parameters than the user group.<br />
Apart from size, all respondents were asked to identify any other<br />
elements that should be taken into account in the definition <strong>of</strong> SMEs. Table<br />
6 shows the perceptions <strong>of</strong> respondents concerning other elements that<br />
should be used in the definition <strong>of</strong> SMEs.<br />
Users Practitioners<br />
Total Rank<br />
(n=14) (n=27) (n=41)<br />
No. % No. % N<br />
o.<br />
%<br />
Users <strong>of</strong> financial statements<br />
Public versus non-public<br />
10 71 22 81 32 71 =1<br />
accountability<br />
Reliance on registered<br />
5 36 19 70 24 53 =2<br />
accountants and auditors 10 71 14 52 24 53 =2<br />
Lack <strong>of</strong> board structure 9 64 8 30 17 38 3<br />
Owner-managed business 9 64 23 85 32 71 =1<br />
Number <strong>of</strong><br />
owners/shareholders<br />
0 0 16 59 16 36 4<br />
Table 6: Other elements that could be used in the definition <strong>of</strong> SMEs<br />
Overall, the respondents consider the users <strong>of</strong> financial statements<br />
and whether the SME is an owner-managed business as the most important<br />
elements in the definition <strong>of</strong> SMEs. Accounting versus non-accounting<br />
accountability and reliance on registered accountants and auditors was<br />
ranked second overall. Lack <strong>of</strong> board structure, although poorly rated by<br />
88
Financial Reporting for Small and Medium-Sized Entities …<br />
practitioners, was considered important by the users. The number <strong>of</strong><br />
owners/shareholders was rated higher by the practitioners. These results<br />
show some support for the IASB where public versus non-public<br />
accountability is considered an important element in the definition <strong>of</strong> SMEs.<br />
Table 6 also shows that users find reliance on registered accountants<br />
and auditors to be an important element to be used in the definition <strong>of</strong><br />
SMEs. A possible reason for support for reliance on registered accountants<br />
and auditors as an element to be used in the definition by users could be that<br />
most <strong>of</strong> these respondents rely highly on the registered accountants and<br />
auditors for the preparation <strong>of</strong> their financial statements.<br />
The preference <strong>of</strong> public versus non-public accountability by<br />
practitioners may stem from the fact that practitioners are probably more upto-date<br />
with the deliberations <strong>of</strong> the IASB which may have influenced their<br />
perceptions. However, owner-managed business is ranked first by<br />
practitioners (85%). This may be because most owner-managed businesses<br />
are usually small in size and the owners are the primary users <strong>of</strong> the<br />
financial statements.<br />
The results in Table 6 may indicate that more than one element<br />
could be used in the definition <strong>of</strong> SMEs.<br />
The Burden <strong>of</strong> IFRSs on SMEs<br />
Respondents were asked to evaluate IFRSs in terms <strong>of</strong> the cost <strong>of</strong> complying<br />
with IFRSs, and its volume and complexity. These results are shown in<br />
Table 7.<br />
The results presented in Table 7 indicate that IFRSs are perceived by<br />
the respondents to be costly, voluminous and complex. This result confirms<br />
the findings in Table 5 that full IFRSs are not suitable for all entities.<br />
‘Costly’ is ranked highest (80%) by the total respondents and ‘complex’ and<br />
‘voluminous’ are ranked equal second (78%).<br />
The users considered IFRSs less costly, less complex and less<br />
voluminous than the practitioner group. As users <strong>of</strong> SMEs’ financial statements,<br />
they are unaware <strong>of</strong> the complex and voluminous nature <strong>of</strong> IFRSs.<br />
The practitioners perceive that full IFRS is very costly, too<br />
voluminous and too complex for SMEs. As the practitioners are also CAs,<br />
89
Lesley Stainbank & Mercy Tafuh<br />
Very<br />
Costly<br />
Costly<br />
Less<br />
Costly<br />
Moderate<br />
90<br />
Total<br />
Very costly<br />
and costly<br />
No. 1<br />
1 2 3 4 5 6 7 8 9 10<br />
EvaluaCom- 17 16 3 5 41 33 80 2<br />
tion <strong>of</strong> bined<br />
IFRS in Users 1 7 2 4 14 8 57 1<br />
terms <strong>of</strong><br />
cost<br />
Pracs. 16 9 1 1 27 25 93 1<br />
Evaluation<br />
<strong>of</strong><br />
IFRS in<br />
terms <strong>of</strong><br />
volume<br />
Evaluation<br />
<strong>of</strong><br />
IFRS in<br />
terms <strong>of</strong><br />
complexity <br />
Combined<br />
Users<br />
Pracs.<br />
Combined<br />
Users<br />
Pracs.<br />
Too<br />
voluminous<br />
17<br />
3<br />
14<br />
Too<br />
complex<br />
20<br />
3<br />
17<br />
Voluminous<br />
15<br />
4<br />
11<br />
Complex<br />
11<br />
4<br />
7<br />
Less<br />
voluminous<br />
4<br />
3<br />
1<br />
Less<br />
complex<br />
Moderate<br />
5<br />
4<br />
1<br />
Moderate<br />
Total<br />
41<br />
14<br />
27<br />
Total<br />
Too<br />
voluminous<br />
32<br />
7<br />
25<br />
Too<br />
complex<br />
and<br />
1<br />
The numbers in column 8 are derived from the summation <strong>of</strong> the first two<br />
columns.<br />
6<br />
4<br />
2<br />
Table 7: Evaluation <strong>of</strong> IFRSs in terms <strong>of</strong> cost, volume and complexity<br />
3<br />
2<br />
1<br />
40<br />
13<br />
27<br />
31<br />
7<br />
24<br />
%<br />
%<br />
8<br />
0<br />
93<br />
%<br />
78<br />
50<br />
89<br />
Rank<br />
Rank<br />
2<br />
2<br />
1<br />
Rank<br />
2<br />
2<br />
2
Financial Reporting for Small and Medium-Sized Entities …<br />
they are in a better position to assess the burden <strong>of</strong> IFRSs since they use<br />
these standards to prepare financial statements.<br />
Respondents were asked to list the different ways through which<br />
costs are incurred by SMEs as a result <strong>of</strong> complying with full IFRSs. The<br />
majority <strong>of</strong> the practitioners listed audit fees and accounting fees. Other<br />
costs incurred as a result <strong>of</strong> complying with IFRSs were perceived to be<br />
revaluation costs, increased personnel expenses, the possibility <strong>of</strong><br />
misinterpreting information by employees due to their limited knowledge <strong>of</strong><br />
IFRSs, payments to IT specialists for a system change, s<strong>of</strong>tware costs, cost<br />
<strong>of</strong> extra time, additional costs <strong>of</strong> disclosure, outsourcing <strong>of</strong> services, the lack<br />
<strong>of</strong> pr<strong>of</strong>essionals to assist in compliance with IFRSs by SMEs, costs <strong>of</strong><br />
keeping up-to-date with changing standards, and the cost <strong>of</strong> hiring experts to<br />
provide reliable information.<br />
Many <strong>of</strong> the users <strong>of</strong> SMEs did not answer this question possibly<br />
because they consider complying with IFRSs suitable for all entities (see<br />
Table 3).<br />
Apart from cost, respondents were asked to identify other factors<br />
considered to be a burden on SMEs as a result <strong>of</strong> complying with IFRSs.<br />
The factors indicated by the respondents include that IFRSs requires<br />
technically complex record keeping, requires constant revision <strong>of</strong> standards,<br />
is too complex for users and preparers to understand, is too complex for a<br />
layman to understand, is time consuming, is too voluminous, involves<br />
accounting standards that are unnecessarily onerous, and brings about<br />
employees’ dissatisfaction due to increased workload.<br />
Table 8 shows the results <strong>of</strong> a question which asked respondents to<br />
rank the difficulties faced by SMEs.<br />
An examination <strong>of</strong> the combined results shows that the problem <strong>of</strong><br />
obtaining finance is perceived to be the main difficulty faced by SMEs<br />
(68%), followed by compliance with legislation (62%). There is limited<br />
support for the burden <strong>of</strong> preparing financial statements and competition<br />
(51%), high audit fee (36%) and black economic empowerment (34%).<br />
The break down <strong>of</strong> the results indicates a difference in the responses <strong>of</strong> the<br />
users and the practitioners. Users see the burden <strong>of</strong> preparing financial<br />
statements and audit fees to be the most significant problem (71%), followed<br />
by compliance with legislation (64%) and then the problem <strong>of</strong> obtaining<br />
finance (57%).<br />
91
Lesley Stainbank & Mercy Tafuh<br />
Too heavy<br />
Heavy<br />
Neutral<br />
92<br />
Less heavy<br />
Not heavy<br />
Total<br />
Too heavy<br />
and heavy<br />
No No No No No No No 1 %<br />
1 2 3 4 5 6 7 8 9 10 11<br />
Compliance Com-<br />
with bined 11 14 4 6 6 41 25 62 2<br />
legislation Users 5 4 0 3 2 14 9 64 2<br />
Pracs. 6 10 4 3 4 27 16 59 2<br />
Black Com-<br />
economic bined 6 8 3 14 10 41 14 34 6<br />
empowerment<br />
(BEE)<br />
Users<br />
Pracs.<br />
2<br />
4<br />
3<br />
5<br />
0<br />
3<br />
4<br />
10<br />
5<br />
5<br />
14<br />
27<br />
5<br />
9<br />
36<br />
33<br />
4<br />
5<br />
Problem <strong>of</strong> Com-<br />
obtaining bined 19 9 4 3 6 41 28 68 1<br />
finance Users 5 3 1 2 3 14 8 57 3<br />
Pracs. 14 6 3 1 3 27 20 74 1<br />
Burden <strong>of</strong> Com-<br />
preparing bined 12 9 2 7 11 41 21 51 3<br />
financial<br />
statements<br />
Users<br />
Pracs.<br />
6<br />
6<br />
4<br />
5<br />
0<br />
2<br />
3<br />
4<br />
1<br />
10<br />
14<br />
27<br />
10<br />
11<br />
71<br />
40<br />
1<br />
4<br />
High audit Com-<br />
fee<br />
bined 4 12 1 5 19 41 16 36 5<br />
Users 2 8 0 2 2 14 10 71 1<br />
Pracs. 2 4 1 3 17 27 6 22 6<br />
CompetiComtionbined 10 10 2 7 11 41 20 50 4<br />
Users 3 0 0 4 6 14 3 21 5<br />
Pracs. 7 10 2 3 5 27 17 63 3<br />
1 The numbers below are derived from the summation <strong>of</strong> the first two columns.<br />
Table 8: Ranking <strong>of</strong> difficulties faced by SMEs<br />
Rank
Financial Reporting for Small and Medium-Sized Entities …<br />
Practitioners on the other hand identify the problem <strong>of</strong> obtaining<br />
finance as the main significant difficulty faced by SMEs. The burden <strong>of</strong><br />
preparing financial statements by SMEs does not seem to be a prime issue<br />
especially to the practitioners because only 40% <strong>of</strong> the practitioners rated it<br />
as a difficulty faced by SMEs. Although difficulties such as raising finance,<br />
legislation, competition and BEE might be a problem to most small entities,<br />
the use <strong>of</strong> IFRSs by SMEs has led to a heavier burden due to the increase in<br />
the audit fees, and the complex nature <strong>of</strong> preparing financial statements.<br />
Due to the complex standards developed by the IASB, SMEs rely on<br />
external accountants or accounting experts in the preparation <strong>of</strong> their annual<br />
financial statements (Carsberg et al. 1985:33). Table 9 summarises the<br />
results <strong>of</strong> the question asking who mostly prepares the annual financial<br />
statements <strong>of</strong> SMEs.<br />
The aggregate responses in Table 9 suggest that external accountants<br />
or experts mostly prepare the financial statements <strong>of</strong> SMEs. This may be<br />
because IFRSs are too complex and technical for the directors and account-<br />
Accountants<br />
employed by<br />
SMEs<br />
External<br />
accountants<br />
or experts<br />
Users Practitioners Total<br />
No % Rank No % Rank No % Rank<br />
4<br />
5<br />
28<br />
36<br />
3<br />
1<br />
The director<br />
and the<br />
accountants<br />
4 29 2 1 4 3 5 12 3<br />
Managers<br />
only<br />
0 0 5 1 4 3 1 3 5<br />
Did<br />
respond<br />
not 1 7 4 1 4 3 2 5 4<br />
TOTAL 14 100 27 100 41 100<br />
Table 9: Preparation <strong>of</strong> the annual financial statements <strong>of</strong> SMEs<br />
93<br />
6<br />
18<br />
22<br />
66<br />
2<br />
1<br />
10<br />
23<br />
24<br />
56<br />
2<br />
1
Lesley Stainbank & Mercy Tafuh<br />
ants <strong>of</strong> SMEs. By implication, extra money is required to hire external<br />
accountants or experts to prepare the financial statements <strong>of</strong> SMEs which<br />
leads to increased costs. This result shows little support for accountants<br />
employed by SMEs, the directors and the accountants <strong>of</strong> SMEs and<br />
managers as preparers <strong>of</strong> the annual financial statements.<br />
The result <strong>of</strong> the current study is similar to Carsberg et al. (1985:33)<br />
as both respondent groups rank external accountants or experts highest.<br />
The Usefulness <strong>of</strong> Financial Statements to Users<br />
The results <strong>of</strong> the question asking respondents for their opinion on the<br />
usefulness <strong>of</strong> SMEs’ financial statements to certain users are summarized in<br />
Table 10.<br />
The aggregate responses presented in Table 10 indicate high overall<br />
support for the usefulness <strong>of</strong> the financial statements <strong>of</strong> SMEs to SARS<br />
(98%) and financial institutions (95%). The degree <strong>of</strong> support is lower for<br />
shareholders, analysts and managers. This overall response is consistent with<br />
those <strong>of</strong> the individual respondent groups since both users and practitioners<br />
favour SARS and financial institutions as important users <strong>of</strong> financial<br />
statements <strong>of</strong> SMEs. According to the users <strong>of</strong> SMEs, all five categories <strong>of</strong><br />
users <strong>of</strong> financial statements <strong>of</strong> SMEs are considered important although<br />
SARS and financial institutions are ranked highest. Practitioners did not<br />
consider analysts, managers and shareholders/owners as the main users <strong>of</strong><br />
the financial statements <strong>of</strong> SMEs. The low ranking <strong>of</strong> analysts could be<br />
justified by the fact that they are mostly concerned with public companies.<br />
The poor support for shareholders is surprising because prior research<br />
indicates strong support for shareholders/owners since the financial<br />
statements are used in decision making by this user group.<br />
The results <strong>of</strong> this study are slightly different from those conducted<br />
by Barker and Noonan (1996:19) in which there was majority support for<br />
directors/owners, financial institutions and revenue (tax) respectively.<br />
Suppliers, customers and employees were perceived to be less important<br />
users.<br />
94
Financial Reporting for Small and Medium-Sized Entities …<br />
Very useful<br />
Useful<br />
Neutral<br />
Less useful<br />
95<br />
Not useful<br />
Total<br />
Very useful<br />
plus useful No 1<br />
1 2 3 4 5 6 7 8 9 10 11<br />
Financial<br />
institutions<br />
South<br />
African<br />
Revenue<br />
Service<br />
(SARS)<br />
Managers<br />
Shareholde<br />
rs/<br />
owners<br />
Analysts<br />
%<br />
Rank<br />
Combined<br />
27 12 1 1 0 41 39 95 2<br />
Users 11 1 1 1 0 14 12 86 2<br />
Pracs.<br />
Com-<br />
16 11 0 0 0 27 27 100 1<br />
bined 29 11 1 0 0 41 40 98 1<br />
Users 11 2 1 0 0 14 13 93 1<br />
Pracs.<br />
18 9 0 0 0 27 27 100 1<br />
Combi<br />
ned 14 9 5 9 4 41 23 56 4<br />
Users 8 4 1 0 1 14 12 86 2<br />
Pracs.<br />
Combi<br />
6 5 4 9 3 27 11 41 3<br />
ned 16 9 3 12 1 41 25 61 3<br />
Users 10 3 0 1 0 14 13 93 1<br />
Pracs.<br />
Combi<br />
6 6 3 11 1 27 12 44 2<br />
ned 14 9 7 7 4 41 23 56 4<br />
Users 8 3 0 2 1 14 11 79 3<br />
Pracs. 6 6 7 5 3 27 12 44 2<br />
1 The numbers in column 9 are derived from the summation <strong>of</strong> the first two<br />
columns.<br />
Table 10: The usefulness <strong>of</strong> SMEs’ financial statements to certain user<br />
groups
Lesley Stainbank & Mercy Tafuh<br />
Conclusions, Limitations and Recommendations for Further<br />
Research<br />
This study provides evidence that there is support for differential reporting<br />
as overall the respondents did not consider IFRSs suitable for all entities<br />
irrespective <strong>of</strong> size, type and nature.<br />
This study provides evidence that there is support for the use <strong>of</strong><br />
quantitative size criteria as an appropriate element in the definition <strong>of</strong> SMEs.<br />
However, there was no clear preference on the appropriate value for total<br />
assets, revenue and number <strong>of</strong> employees to be used in the definition <strong>of</strong><br />
SMEs. It is interesting to note that the Companies Act, No. 71 <strong>of</strong> 2008<br />
indicates that quantitative thresholds may be used to determine whether or<br />
not a non-public company is audited.<br />
The users <strong>of</strong> financial statements and whether it was an ownermanaged<br />
business were identified as important elements in the definition <strong>of</strong><br />
SMEs. Public versus non-public accountability and the reliance on registered<br />
accountants and auditors were other important variables considered relevant<br />
in the definition <strong>of</strong> SMEs.<br />
With regards to the evaluation <strong>of</strong> IFRSs in terms <strong>of</strong> cost, volume and<br />
complexity, the practitioners were more in agreement than the users that<br />
IFRSs were costly, voluminous and complex (see Table 7). A reason<br />
advanced for this is that the practitioners are in a better position than the<br />
users to have an informed opinion on this matter. The difficulties faced by<br />
SMEs are not only financial statement preparation, but also such matters as<br />
obtaining finance and complying with legislation. External accountants or<br />
experts were found to be the preparers <strong>of</strong> the financial statements, and with<br />
respect to the users, SMEs’ financial statements were seen as most useful to<br />
SARS.<br />
While this study also provides support for the theoretical<br />
justification for differential reporting with respect to the cost/benefits <strong>of</strong><br />
complying with IFRSs, less clear is whether financial statements prepared<br />
using IFRS for SMEs will indeed satisfy the needs <strong>of</strong> the users. All the users<br />
listed in the question on the usefulness <strong>of</strong> SMEs’ financial statements, with<br />
the exception <strong>of</strong> the analysts, can demand additional information from the<br />
SMEs (see Table 10). The main user, SARS, may prefer the financial<br />
statements prepared on a tax basis.<br />
96
Financial Reporting for Small and Medium-Sized Entities …<br />
This study does have some limitations. Firstly, the choice <strong>of</strong><br />
<strong>KwaZulu</strong>-<strong>Natal</strong> for both target groups means that the results cannot be<br />
generalized to different target groups or to the rest <strong>of</strong> South Africa.<br />
Secondly, the response rate was low with a consequent low level <strong>of</strong><br />
statistical tests. However, despite these limitations, this exploratory study<br />
provides useful and relevant information and extends the research in this<br />
area.<br />
Future studies could focus on different user groups such as actual<br />
SME owners and provide a better understanding <strong>of</strong> who are the users <strong>of</strong><br />
SMEs’ financial statements and what are their needs for information and<br />
whether IFRS for SMEs satisfies this need. This could be done through<br />
structured interviews to solve the problem <strong>of</strong> low response rates. This would<br />
provide confirmatory evidence for SAICA and the IASB that IFRS for SMEs<br />
does meet the different needs for information by the users <strong>of</strong> SMEs’<br />
financial statements.<br />
97
Lesley Stainbank & Mercy Tafuh<br />
References<br />
Anderson, T 1999. Tailor-made or One-size Fits All? CA Magazine April:<br />
132.<br />
American Institute <strong>of</strong> Certified Accounting Accountants (AICPA) 2005.<br />
Private Company Financial Reporting Task Force Report. Available at:<br />
http://www.aicpa.org/members/div/acctstd/pvtco_fincl_reprt/index.<br />
(Accessed on July 17, 2006.)<br />
Anacoreta, L & PD Silva 2005. International Accounting Standards for<br />
SMEs: An Exploratory Study. Unpublished paper. Available at:<br />
http://www.porto.ucp.pt/feg/links/papers/IASB_on_SME_Luisa_Anacor<br />
etae_Duarte_Silva.pdf. (Accessed on December 13, 2009.)<br />
Barker, P & C Noonan 1996. Small Company Compliance with Accounting<br />
Standards. Irish Situation. Available at: www.dcu.ie/dcubs/research_<br />
papers/no10.html#contents. (Accessed on July 17, 2006.)<br />
Botosan, CA, H Ashbaugh-Skaife, AL Beatty, PY Davis-Friday, PE<br />
Hopkins, KK Nelson, K Ramesh, R Uhl, M Venkatachalam & G Vrana<br />
2006. Financial Accounting and Reporting Standards for Private<br />
Entities. Accounting Horizons 20,2: 179-194.<br />
Carsberg, BV, MJ Page, AJ Sindall & ID Waring 1985. Small Company<br />
Financial Reporting. London: Prentice Hall. (The Institute <strong>of</strong> Chartered<br />
Accountants in England and Wales.)<br />
Cleminson, J & E Rabin 2002. The Reporting Problems Faced by Small<br />
Businesses in South Africa. Paper presented at the Southern African<br />
Association biennial conference, Port Elizabeth.<br />
Crains, D, P Hosp & R Martins 2006. Is IFRS up to Standard? The Insider<br />
Business Club March: 24.<br />
Curran, JA & RA Blackburn 2001. Researching the Small Enterprise.<br />
London: Sage.<br />
Department <strong>of</strong> Trade and Industry (DTI) 2003. National Small Business<br />
Amendment Act, No. 26 <strong>of</strong> 2003. Pretoria: DTI.<br />
Department <strong>of</strong> Trade and Industry (DTI) 2004a. South African Company<br />
Law for the 21 st Century. Guidelines for Corporate Law Reform.<br />
Pretoria: DTI.<br />
Department <strong>of</strong> Trade and Industry (DTI) 2004b. National Small Business<br />
Amendment Act, No. 15 <strong>of</strong> 2004. Pretoria: DTI.<br />
98
Financial Reporting for Small and Medium-Sized Entities …<br />
Department <strong>of</strong> Trade and Industry (DTI) 2006. Corporate Laws Amendment<br />
Act, No. 24 <strong>of</strong> 2006. Pretoria: DTI.<br />
Department <strong>of</strong> Trade and Industry (DTI) 2007. Companies Bill 2007.<br />
Available at: http://www.opsi.gov.uk/acts/acts 2006/pdf. (Accessed on<br />
March 13, 2007.)<br />
Department <strong>of</strong> Trade and Industry (DTI) 2008. Companies Bill 2008.<br />
Pretoria: DTI.<br />
Department <strong>of</strong> Trade and Industry (DTI) 2009. Companies Act No. 71 <strong>of</strong><br />
2008. Pretoria: DTI.<br />
Elliot, WB, F Hodge, JJ Kennedy & M Pronk 2009. Are MBA Students a<br />
Good Proxy for Non-pr<strong>of</strong>essional Investors? Available at: http://papers.<br />
ssrn.com/sol3/papers.cfm?abstract_ id=5689521. (Accessed on March<br />
25, 2009.)<br />
Eurochambres 2004. Position Paper on the IASB’s Discussion Paper<br />
Regarding the Development <strong>of</strong> IASs for SMEs. Available at: http://<br />
www.eurochambres.be. (Accessed on May 12, 2006.)<br />
European Commission 2003. Definition <strong>of</strong> SMEs. Official <strong>Journal</strong> <strong>of</strong><br />
European Union May: 37.<br />
Evans L, G Gebhardt, M Hoogendoorn, J Marton, R di Pietra, A Mora, F<br />
Thinggård, P Vehmanen & A Wagenh<strong>of</strong>er 2005. Problems and<br />
Opportunities <strong>of</strong> an International Financial Reporting Standard for Small<br />
and Medium-sized Entities. The EAA FRSC’s comment on the IASB’s<br />
discussion paper. Accounting in Europe 2: 23-45.<br />
Financial Executives Research Foundation (FERF) 2006. What Do Users <strong>of</strong><br />
Private Companies Financial Statements Want? Research Series Private<br />
Companies. Financial Executives Research Foundation, New Jersey,<br />
USA. Available at: http://www.pcfr.org/downloas/05_07_Meet_<br />
Materials/FERFPrivate_Co_User_Survey. pdf. (Accessed on December,<br />
12 2009.)<br />
Hattingh, C 2002. Straight Talking – The Final Word on Differential<br />
Reporting. Accountancy SA March: 23 – 24.<br />
Heymans, H 2000. Differential Reporting Standards. Accountancy SA<br />
July:1-4.<br />
Hepp, GW & TW McRae 1982. Accounting Standards Overload: Relief is<br />
Needed. <strong>Journal</strong> <strong>of</strong> Accountancy May:52-62.<br />
99
Lesley Stainbank & Mercy Tafuh<br />
Holmes, C, P Kent, & G Downey 1991. The Australian Differential<br />
Reporting Debate: A Survey <strong>of</strong> Practitioners. Accounting and Business<br />
Research 21, 82:125- 132.<br />
International Accounting Standards Committee Foundation (IASCF) 1989.<br />
The Preparation and Presentation <strong>of</strong> Financial Statements. London:<br />
IASCF.<br />
International Accounting Standards Board (IASB) 2004. Discussion Paper -<br />
Preliminary Views on Accounting Standards for Small and Mediumsized<br />
Entities. London: IASB.<br />
International Accounting Standard Board (IASB) 2007a. Exposure Draft <strong>of</strong> a<br />
Proposed IFRS for Small and Medium-sized Entities. Available at:<br />
http://www.iasb.org/NR/rdonlyres. (Accessed on April 16, 2007.)<br />
International Accounting Standards Board (IASB) 2007b. Preface to<br />
International Financial Reporting Standards. London: IASB.<br />
International Federation <strong>of</strong> Accountants (IFAC) 2006. Micro-entity<br />
Financial Reporting: Perspectives <strong>of</strong> Preparers and Users. New York:<br />
IFAC.<br />
Joshi, PL & S Ramadhan 2002. The Adoption <strong>of</strong> International Accounting<br />
Standards by Small and Closely Held Companies in Bahrain.<br />
International <strong>Journal</strong> <strong>of</strong> Accounting 37:429-440.<br />
Kruger, R 2004. Harmonising User Needs with Reporting Requirements <strong>of</strong><br />
Close Corporations. Unpublished MCom Dissertation, <strong>University</strong> <strong>of</strong><br />
Free State, Bloemfontein.<br />
Liyanarachchi, GA 2007. Feasibility <strong>of</strong> Using Student Subjects in<br />
Accounting Experiments: A Review. Public Accounting Review 19,1:<br />
47-67.<br />
Agenda: The Case for Actively Involving Small and Medium Enterprises.<br />
Intereconomics May/June: 157-166.<br />
Maingot, M & D Zeghal 2006. Financial Reporting <strong>of</strong> Small Business<br />
Entities in Canada. <strong>Journal</strong> <strong>of</strong> Small Business Management 44,4: 513-<br />
530.<br />
Martin, R 2005. Financial Reporting by Small and Medium Sized<br />
Enterprises. Available at: http://www.accaglobal.com/databases/events/<br />
centraleurope. (Accessed on June 13, 2006.)<br />
McBride, K & S Fearnley 1999. International Harmonization is Still Offkey.<br />
Accountancy International March: 71.<br />
100
Financial Reporting for Small and Medium-Sized Entities …<br />
Mosso, D 1983. Standard Overload. No Simple Solution. The CPA <strong>Journal</strong><br />
October: 12-22.<br />
Riahi-Belkaoui, AR 2004. Accounting Theory. 5 th Edition. London:<br />
Thomson.<br />
Schiebel, A 2008. Is there Solid Empirical Evidence for the IASB’s Draft<br />
IFRS for SMEs? Paper presented at the 31 st Annual Congress <strong>of</strong> the<br />
European Accounting Association, Rotterdam, The Netherlands.<br />
Sealy-Fisher, V 2005. Differential Reporting and Financial Reporting by<br />
SMEs. Chartered Accountants’ <strong>Journal</strong> July: 14-16.<br />
South African Institute <strong>of</strong> Chartered Accountants (SAICA) 2001. Small/<br />
Large Enterprise Distinction. Johannesburg: SAICA.<br />
South African Institute <strong>of</strong> Chartered Accountants (SAICA) 2002. Revised<br />
Proposed Financial Reporting Bill, Draft Three. Johannesburg: SAICA.<br />
South African Institute <strong>of</strong> Chartered Accountants (SAICA) 2003. ED 163 –<br />
Limited Purpose Financial Reporting Standards. Johannesburg: SAICA.<br />
South African Institute <strong>of</strong> Chartered Accountants (SAICA) 2007. Statement<br />
<strong>of</strong> Generally Accepted Accounting Practice for Small and Medium-sized<br />
Entities. Johannesburg: SAICA.<br />
Upton, S & L Ostergaard 1985. The FASB Response to Small Business.<br />
<strong>Journal</strong> <strong>of</strong> Accounting May: 94-100.<br />
Van Wyk, HA 2005. Do Small Entities Require more Relaxed Differential<br />
Reporting in South Africa? Paper presented at the International<br />
Association for Accounting Education and Research’s conference for<br />
accounting educators, Bordeaux, France.<br />
Warren, K 2004. Differential Reporting. Chartered Accountants’ <strong>Journal</strong><br />
December: 48-49.<br />
Wells, MJ 2005. A Survey <strong>of</strong> South African Registered Accountants’ and<br />
Auditors’ Attitudes towards Differential Corporate Reporting.<br />
Unpublished MAcc Dissertation. <strong>University</strong> <strong>of</strong> <strong>KwaZulu</strong>-<strong>Natal</strong>.<br />
William, P 2004. Do SMEs Really Need to Follow IFRSs to the Letter?<br />
Accounting and Business September: 16.<br />
Lesley Stainbank<br />
Faculty <strong>of</strong> Management Studies<br />
<strong>University</strong> <strong>of</strong> <strong>KwaZulu</strong>-<strong>Natal</strong><br />
Durban, South Africa<br />
Stainbankl@ukzn.ac.za<br />
101
Lesley Stainbank & Mercy Tafuh<br />
102<br />
Mercy Tafuh<br />
Faculty <strong>of</strong> Management Studies<br />
<strong>University</strong> <strong>of</strong> <strong>KwaZulu</strong>-<strong>Natal</strong><br />
Durban, South Africa<br />
Mtafuh@yahoo.com
The Suitability <strong>of</strong> International Financial<br />
Reporting Standards for Small and<br />
Medium-sized Entities<br />
Lesley Stainbank<br />
Abstract<br />
South Africa adopted the International Accounting Standards Board’s<br />
(IASB) draft International Financial Reporting Standard for Small and<br />
Medium-sized Entities (IFRS for SMEs) in 2007 as Statement <strong>of</strong> Generally<br />
Accepted Accounting Practice for Small and Medium-sized Entities<br />
(Statement <strong>of</strong> GAAP for SMEs). In 2009, the final IFRS for SMEs was<br />
approved for use in South Africa and the Statement <strong>of</strong> GAAP for SMEs was<br />
withdrawn. This study provides evidence, using exploratory research in<br />
<strong>KwaZulu</strong>-<strong>Natal</strong>, as to the perceptions <strong>of</strong> users and accounting practitioners<br />
regarding the preferred form and content <strong>of</strong> IFRS for SMEs.<br />
The results indicate that financial statements based on a simplified<br />
version <strong>of</strong> IFRSs are the preferred form for financial reporting for SMEs.<br />
With regards to the content <strong>of</strong> differential reporting, the study found that the<br />
while certain standards were considered essential for SMEs (IAS 7, IAS 8,<br />
IAS 19 and IAS 20) and others were considered not essential for SMEs (IAS<br />
27, IFRS 3 and IFRS 5), overall there was support for recognition and<br />
measurement concessions. This research thus provides some support for the<br />
IASB’s IFRS for SMEs.<br />
Keywords: Differential reporting, Small and medium-sized entities, IFRS<br />
for SMEs.<br />
<strong>Alternation</strong> Special Edition 4 (2011) 103 – 127<br />
ISSN 1023-1757<br />
103
Lesley Stainbank<br />
Introduction<br />
According to the conceptual framework <strong>of</strong> the International Accounting<br />
Standards Board (IASB) (IASCF 1989:2), the main objective <strong>of</strong> financial<br />
statements is to provide information by reporting enterprises which is useful<br />
to a wide range <strong>of</strong> users for making economic decisions. While this objective<br />
can be justified for public entities on the grounds <strong>of</strong> public accountability<br />
and users such as financial analysts, this is not true for smaller entities<br />
whose primary users are perceived to have different information needs<br />
(IASB 2004:14). The desirability <strong>of</strong>, and justification for, different reporting<br />
standards for small and medium-sized entities (i.e. differential reporting) has<br />
been documented by many research studies (Upton & Ostergaard 1985;<br />
Holmes, Kent & Downey 1991; Barker & Noonan 1996; Cleminson & Rabin<br />
2002; Hattingh 2002; AICPA 2005; Van Wyk 2005; Wells 2005; Chand,<br />
Patel & Cummings 2006:13; Crains, Hosp & Martins 2006; Maingot &<br />
Zeghal 2006).<br />
In South Africa, differential reporting was introduced when the<br />
Accounting Practices Board (APB), the <strong>of</strong>ficial standard setter, approved the<br />
IASB’s draft International Financial Reporting Standard for Small and<br />
Medium-sized Entities (IFRS for SMEs) for use in South Africa as Statement<br />
<strong>of</strong> Generally Accepted Accounting Practice for Small and Medium-sized<br />
Entities (Statement <strong>of</strong> GAAP for SMEs) (SAICA 2007). In 2009, the APB<br />
approved the final IFRS for SMEs for use as a statement <strong>of</strong> generally<br />
accepted accounting practice with an issue date <strong>of</strong> 13 August 2009 and<br />
withdrew the Statement <strong>of</strong> GAAP for SMEs (APB 2009).<br />
Problem Statement and Research Questions<br />
Research into differential reporting has focused on the desirability <strong>of</strong><br />
differential reporting (Holmes et al. 1991; Wells 2005), the threshold for<br />
differential reporting (Holmes et al. 1991; Wells 2005), the burden <strong>of</strong><br />
International Financial Reporting Standards (IFRSs) on SMEs (Carsberg,<br />
Page, Sindall & Waring 1985; Barker & Noonan 1996; Cleminson & Rabin<br />
2002), the due process <strong>of</strong> the IASB (Anacoreta & Silva 2005; Schiebel<br />
2008) and the reporting needs <strong>of</strong> users (Mosso 1983; Joshi & Ramadhan<br />
2002; AICPA 2005; Van Wyk & Rossouw 2009). The form for differential<br />
reporting and what its content should be are areas requiring further research.<br />
104
The Suitability <strong>of</strong> International Financial Reporting Standards for SMEs<br />
This study thus seeks to answer the following research questions:<br />
• What are the perceptions <strong>of</strong> users <strong>of</strong> SMEs’ financial statements and<br />
accounting practitioners on the form that IFRS for SMEs should<br />
take?<br />
• What are the perceptions <strong>of</strong> users <strong>of</strong> SMEs’ financial statements and<br />
accounting practitioners on the content <strong>of</strong> IFRS for SMEs?<br />
The importance <strong>of</strong> this exploratory research is that it provides<br />
support for the suitability <strong>of</strong> the IASB’s IFRS for SMEs (IASB 2009a),<br />
particularly as the IASB has been criticized for not consulting users <strong>of</strong><br />
SMEs’ financial statements (Schiebel 2008). It furthermore provides support<br />
for the APB (2007) in adopting the draft, and subsequently the final IFRS for<br />
SMEs.<br />
The following section <strong>of</strong> this article discusses the relevant literature<br />
in this area. The research methodology and the results <strong>of</strong> the research are<br />
presented next. The article then discusses the conclusions, limitations <strong>of</strong> the<br />
study and areas for further research.<br />
Literature Survey<br />
The literature review discusses research in the two areas, which are the focus<br />
<strong>of</strong> this article: research on the appropriate form for differential reporting and<br />
research on what its content should be.<br />
Research on the Appropriate Form for Differential Reporting<br />
The issue <strong>of</strong> which form financial reporting by SMEs should take has been<br />
addressed in many countries and by many standard setting bodies (Maingot<br />
& Zeghal 2006:513). Different forms proposed in the literature for<br />
differential reporting are the cash basis, the income tax basis, limited<br />
purpose financial statements (LPFS), full compliance with IFRSs or the<br />
complete separation from IFRSs (Wells 2005).<br />
Maingot and Zeghal (2006) argue that the two main purposes <strong>of</strong><br />
financial statements <strong>of</strong> SMEs are for tax authorities and financial institutions<br />
and therefore complying with full GAAP is irrelevant. In the United States<br />
<strong>of</strong> America (USA), its Other comprehensive basis <strong>of</strong> accounting (OCBOA)<br />
105
Lesley Stainbank<br />
is in many cases a tax basis (Martin 2005:48) Wells’ (2005:100) found that<br />
limited deviations from South African GAAP to be the preferred option for<br />
differential reporting, followed by a completely separate set <strong>of</strong> South<br />
African GAAP (second), the income tax basis (third), unlimited deviations<br />
from GAAP (fourth), and in fifth place, the cash basis. Lötter’s (2006) study<br />
indicated that the accrual basis, as opposed to the cash basis, is the preferred<br />
form for differential reporting by accounting practitioners. In contrast, Van<br />
Wyk (2005:9) reported that in Kruger’s (2004) study it was found that with<br />
regards to the form differential reporting should take, 74% <strong>of</strong> the<br />
respondents preferred the tax basis, followed by the managerial basis and the<br />
accrual basis.<br />
The IASB (2009b: BC50,51) argue that while tax authorities use the<br />
financial statements as a reference for the taxable income calculation, an<br />
accounting standard that is intended to be used globally cannot incorporate<br />
national jurisdictions’ tax rules, and that therefore IFRS for SMEs could<br />
serve as a logical starting point for calculating taxable income. The IASB<br />
therefore rejected the tax basis as a form for IFRS for SMEs.<br />
According to Mosso (1983:19,21), the exemption <strong>of</strong> SMEs from a<br />
few standards is not enough to solve the many problems since several<br />
solutions need to be considered, some <strong>of</strong> which are:<br />
a) GAAP needs to be simplified and new standards when feasible need<br />
to be avoided,<br />
b) Differential GAAP including disclosure and measurement is needed<br />
whenever a legitimate cost-benefit argument can be made for it,<br />
c) One or more comprehensive alternative bases with standardised<br />
disclosure requirements need to be revisited, and<br />
d) GAAP departures with qualified opinions are needed. The auditors’<br />
report should note GAAP departures without conveying undue alarm<br />
to the users.<br />
A further argument is that Africa does not have the necessary<br />
resources to follow the United Kingdom (UK) approach <strong>of</strong> developing<br />
completely new standards. Hattingh (2006) suggested that standards should<br />
be developed using existing IASB standards but that the complexities should<br />
be simplified.<br />
106
The Suitability <strong>of</strong> International Financial Reporting Standards for SMEs<br />
Hong Kong, New Zealand and the IASB (Martin 2005: Par 1) have<br />
attempted to reduce the financial reporting burden for SMEs. Other<br />
countries have made a concession in terms <strong>of</strong> the exclusion from some part<br />
<strong>of</strong> a ‘full’ set <strong>of</strong> rules like Canada because these standards were designed for<br />
listed companies (Martin 2005: Par 1).<br />
The IASB developed IFRS for SMEs by first taking full IFRSs and<br />
then extracting the fundamental concepts from the Framework for the<br />
Preparation and Presentation <strong>of</strong> Financial Statements (IASCF 1989) and<br />
the principles from full IFRSs and made modifications thereto in light <strong>of</strong> the<br />
cost-benefit constraint and users’ needs (IASB 2009b: BC95). In this way a<br />
separate standard for SMEs was developed. IFRS for SMEs is thus a standalone<br />
standard, separate from full IFRSs.<br />
The Content <strong>of</strong> Differential Reporting<br />
Another important issue is which standards from full IFRSs are considered<br />
suitable for SMEs. While the findings <strong>of</strong> some researchers supported the<br />
relaxation <strong>of</strong> some disclosure and presentation requirements, others<br />
preferred some disclosure and presentation requirements as well as<br />
measurement and recognition principles to be relaxed when developing<br />
standards for SMEs (Hattingh 2006). A list <strong>of</strong> the standards discussed in this<br />
article is shown in Appendix 1.<br />
Barker and Noonan (1996:26) investigated the applicability <strong>of</strong><br />
specific standards in their study in Ireland. Forty-three percent (43%) <strong>of</strong> the<br />
respondents said all standards should apply to all companies provided they<br />
are applicable and if the issue is material. However, Barker and Noonan<br />
concluded that the responses were skewed in favour <strong>of</strong> the earlier standards,<br />
with the later standards attracting a smaller percentage <strong>of</strong> applicability. Most<br />
<strong>of</strong> the respondents admitted that they were not fully up-to-date with the<br />
standards which could have biased their choice.<br />
The American Institute <strong>of</strong> Certified Public Accountants (AICPA)<br />
(2006) investigated whether financial reporting standards should be different<br />
for private companies. They concluded that significant differences in<br />
recognition, measurement, or disclosure and presentation should not be<br />
solely based on whether a company is privately or publicly held. This is<br />
because:<br />
107
Lesley Stainbank<br />
a) Similar economic transactions and events should be reported<br />
consistently regardless <strong>of</strong> the size or ownership characteristics <strong>of</strong> the<br />
reporting enterprise, and<br />
b) Different financial reporting standards for private companies could<br />
result in additional costs to preparers, accountants, auditors,<br />
advisors, and others in the areas <strong>of</strong> continuing education,<br />
authoritative resources, and quality control systems.<br />
Zanzig and Flesher (2006:Par 14) reported on the AICPA’s Private<br />
company financial reporting task force report. The AICPA study, which<br />
began in 2004, considered whether the general purpose financial reporting <strong>of</strong><br />
private companies, prepared in accordance with GAAP, meets the financial<br />
reporting needs <strong>of</strong> the constituents <strong>of</strong> that reporting, as well as whether the<br />
cost <strong>of</strong> providing GAAP financial statements is justified when compared<br />
with the benefits they provide to private company constituents.<br />
The results <strong>of</strong> one <strong>of</strong> the surveyed questions on the 12 GAAP<br />
requirements indicated that the accrual basis, the cash flow statement, and<br />
the classification <strong>of</strong> liabilities and equity are perceived to be important to<br />
decision usefulness. The AICPA (2006) task force concluded that most <strong>of</strong><br />
the respondents in the study were <strong>of</strong> the opinion that the underlying<br />
accounting for public versus non-public (private) companies was different. It<br />
concluded that some <strong>of</strong> the GAAP requirements for the public companies<br />
lack relevance or decision usefulness for private companies. The task force<br />
therefore recommended that a recognized set <strong>of</strong> standards be established as<br />
GAAP for private companies.<br />
In South Africa, Wells (2005:110) supported the principle <strong>of</strong><br />
granting recognition and measurement as well as presentation and disclosure<br />
concessions to entities with fewer users. In the Wells’ (2005) study only<br />
twelve standards (IAS 2, IAS 12, IAS 16, IAS 17, IAS 19, IAS 21, IAS 32<br />
(including IAS 39), IAS 36, IAS 37, IAS 38, IAS 40 and IAS 41) were listed<br />
in the questionnaire and the respondents were asked to indicate whether the<br />
recognition and measurement, and the presentation and disclosure<br />
requirements were appropriate to twelve hypothetical entities varied by size,<br />
legal structure and user base. IAS 7, IAS 24 and IAS 27 were also included<br />
as separate items. For these three standards the respondents were asked<br />
whether the presentation requirements <strong>of</strong> the three standards were<br />
108
The Suitability <strong>of</strong> International Financial Reporting Standards for SMEs<br />
appropriate for the twelve hypothetical entities. The study found significant<br />
differences in the perceived applicability <strong>of</strong> the standards to public<br />
companies when compared to private companies and close corporations.<br />
This is similar to the New Zealand (ICANZ 2002) and Canadian differential<br />
reporting requirements (CICA 2002). Wells’ (2005) results show a<br />
significant difference between big private entities with many users and big<br />
private entities with fewer users. This was because the respondents<br />
(auditors) perceived that all entities with many users irrespective <strong>of</strong> their<br />
size do not require relaxed standards. The relaxation <strong>of</strong> measurement and<br />
recognition principles as well as presentation and disclosure requirements is<br />
only essential for big private entities with no users and small entities with no<br />
users.<br />
The aggregate responses in the Wells’ (2005) study also revealed<br />
that the majority <strong>of</strong> the respondents perceived Related party disclosures<br />
(IAS 24) to be appropriate only to security exchange listed entities, public<br />
and big private entities with users and big close corporations with users.<br />
With regards to Consolidated and separate financial statements (IAS 27),<br />
the majority <strong>of</strong> respondents perceived consolidated financial statements not<br />
to be appropriate for all close corporations and for all private companies<br />
with a limited user base. With regards to the Statement <strong>of</strong> cash flows (IAS<br />
7), the overall results found that the majority <strong>of</strong> the respondents perceived<br />
the statement <strong>of</strong> cash flows to be appropriate and that all companies, except<br />
small private companies with a limited user base, should be required to<br />
present a statement <strong>of</strong> cash flows.<br />
Van Wyk (2005:14) in his report <strong>of</strong> Kruger’s (2004) results noted<br />
that more than 50% <strong>of</strong> the respondents rated only thirteen standards (The<br />
conceptual framework, IAS 1, IAS 2, IAS 10, IAS 12, IAS 16, IAS 17, IAS<br />
18, IAS 23, IAS 36, IAS 38, IAS 40 and IAS 41) to be the most crucial in the<br />
preparation <strong>of</strong> financial statements for close corporations. (The Kruger study<br />
did not consider other entity forms.)<br />
Van Wyk and Rossouw (2009:110) found that 12 standards (IAS 1,<br />
IAS 2, IAS 7, IAS 8, IAS 10, IAS 12, IAS 16, IAS 17, IAS 18, IAS 23, IAS<br />
37 and IAS 40) can be considered crucial for SMEs and that the topics <strong>of</strong><br />
Consolidated and separate financial statements (IAS 27), Investments in<br />
associates (IAS 28), Business combinations (IFRS 3) and Interests in joint<br />
ventures (IAS 31) were found to be mainly not applicable to SMEs.<br />
109
Lesley Stainbank<br />
Complex and voluminous standards impose a high burden on SMEs<br />
when compared to simplified standards. Reducing the presentation and<br />
disclosure requirements for SMEs by standard setters does not entirely solve<br />
the problem but it does reduce the volume <strong>of</strong> these standards to a limited<br />
extent.<br />
In IFRS for SMEs (IASB 2009a) (which has sections as opposed to<br />
the separate standards found in full IFRSs), many <strong>of</strong> the principles found in<br />
the full IFRSs have been simplified. Some <strong>of</strong> the differences to be found in<br />
IFRS for SMEs upon comparison to full IFRSs are as follows:<br />
Table 1: IFRS for SMEs upon comparison to full IFRSs<br />
IAS 8 Accounting policies,<br />
estimates and errors -<br />
IAS 16 Property, plant and<br />
equipment -<br />
IAS 23<br />
Management may consider the<br />
requirement <strong>of</strong> full IFRSs in<br />
determining an appropriate accounting<br />
policy, however, management is not<br />
required to do so.<br />
Subsequent to acquisition, the entity<br />
shall measure its property, plant and<br />
equipment at cost less accumulated<br />
depreciation and accumulated<br />
impairment losses.<br />
Borrowing costs - All borrowing costs are expensed.<br />
IAS 28 Investments in<br />
associates -<br />
An entity may elect to account for all<br />
its associates:<br />
• at cost less impairment provided<br />
there is no published price for the<br />
investment,<br />
• using the equity method, or<br />
• at fair value with changes in fair<br />
value being recognised in pr<strong>of</strong>it or<br />
loss.<br />
110
The Suitability <strong>of</strong> International Financial Reporting Standards for SMEs<br />
IAS 38 Intangible assets other<br />
than goodwill -<br />
All research and development<br />
expenditures are recognised as an<br />
expense when incurred unless it forms<br />
part <strong>of</strong> the cost <strong>of</strong> another asset which<br />
meets the recognition criteria in terms<br />
<strong>of</strong> IFRS for SMEs.<br />
After recognition, intangible assets are<br />
measured at cost less any accumulated<br />
amortization and any accumulated<br />
impairment losses.<br />
All intangible assets are considered to<br />
have a finite useful life.<br />
IAS 39 Financial instruments - The recognition model for basic<br />
financial instruments is the amortised<br />
cost model.<br />
The recognition model for other<br />
financial instruments is the fair value<br />
model, which is normally the<br />
transaction price. This is exclusive <strong>of</strong><br />
transaction costs.<br />
IAS 40 Investment property - Measurement is initially at cost and<br />
includes costs to bring it into use.<br />
Subsequently investment property must<br />
be measured at fair value unless a<br />
reliable fair value cannot be obtained<br />
without undue cost or effort.<br />
If fair value cannot be determined, the<br />
investment property is treated as<br />
property, plant and equipment.<br />
IFRS 3 Business combinations<br />
and goodwill -<br />
All business combinations are<br />
accounted for using the purchase<br />
method.<br />
Goodwill is amortized over a period<br />
not exceeding 10 years.<br />
111
Lesley Stainbank<br />
IFRS for SMEs does not cover segment information, earnings per<br />
share or interim reporting. Should an SME disclose such information, it<br />
would need to disclose the basis it used for preparing and presenting such<br />
information. The topics Consolidated and separate financial statements<br />
(IAS 27), Investments in associates (IAS 28), Business combinations (IFRS<br />
3) and Interests in joint ventures (IAS 31) which were found to be mainly<br />
not applicable to SMEs by Van Wyk and Rossouw (2009:110) are included<br />
in IFRS for SMEs but with measurement simplifications.<br />
Research Methodology<br />
This exploratory study, which provides descriptive data only, was carried<br />
out at the time the draft IFRS for SMEs was under discussion in South Africa<br />
(Tafuh 2008). Its purpose was to determine the perceptions <strong>of</strong> users <strong>of</strong><br />
SMEs’ financial statements and accounting practitioners (as preparers <strong>of</strong><br />
SMEs’ financial statements) towards the form and content <strong>of</strong> financial<br />
standards for SMEs. The methodology is based on survey research which<br />
involved the use <strong>of</strong> a questionnaire. This process included pre-testing and<br />
administering the questionnaire, after which the data was captured and<br />
analysed.<br />
Out <strong>of</strong> the 156 questionnaires that were administered to the<br />
accounting practitioners, only 27 (17%) were returned. For the users <strong>of</strong><br />
SMEs’ financial statements, a total <strong>of</strong> 45 questionnaires were administered<br />
to MBA students, who were used as surrogates for the user group<br />
(Liyanarachchi 2007; Elliot, Hodge, Kennedy & Pronk 2009), and only 14<br />
(31%) were returned. Many <strong>of</strong> the latter respondents complained that the<br />
questionnaire was too technical and that they were unfamiliar with the<br />
content <strong>of</strong> IFRSs.<br />
Discussion <strong>of</strong> the Results<br />
Form for Differential Reporting<br />
One <strong>of</strong> the main issues <strong>of</strong> reporting by SMEs has been the possible form that<br />
differential reporting could take. The different forms proposed in this study<br />
are the cash basis, the income tax basis, limited purpose financial statements<br />
112
The Suitability <strong>of</strong> International Financial Reporting Standards for SMEs<br />
(LPFS), full compliance with IFRSs or the complete separation from IFRSs.<br />
The covering page to the questionnaire defined LPFS as the financial<br />
reporting statement <strong>of</strong> an entity which has a limited range <strong>of</strong> users who have<br />
an interest in the affairs <strong>of</strong> the entity or business and are thus in the position<br />
to call for further information should they wish to do so. The questionnaire<br />
further explained that LPFS were prepared using simplified statements <strong>of</strong><br />
IFRSs.<br />
Respondents were asked to rank the suitability <strong>of</strong> the different forms<br />
for differential reporting ranging from most suitable (=1) to least suitable<br />
(=5). The results <strong>of</strong> this question are shown in table 2. This table shows both<br />
the combined and separate results for users and practitioners.<br />
When considering the overall responses, the most favoured form is a LPFS<br />
with 28 (68%) respondents in agreement that this form is suitable for SMEs.<br />
This is followed jointly by the income tax basis and for the complete<br />
separation from IFRSs with 17 respondents (41%) in agreement that these<br />
forms would be suitable. The least favoured form for differential reporting is<br />
the cash basis with only seven respondents (17%) choosing this basis. The<br />
overall results thus show support for the IFRS for SMEs issued by the IASB<br />
(2009a) in that differential reporting should be based on a simplified version<br />
<strong>of</strong> IFRSs.<br />
An analysis <strong>of</strong> the responses <strong>of</strong> both target groups shows that users<br />
considered the income tax basis the most suitable form for financial<br />
reporting by SMEs with 10 <strong>of</strong> the 14 respondents (71%) selecting that basis.<br />
Table 2 also indicates that there is limited support for the complete<br />
separation from IFRSs by this group <strong>of</strong> respondents. This may be because<br />
they are not up-to-date with the IASB’s developments on differential<br />
reporting.<br />
Eighty-nine percent (89%) <strong>of</strong> the practitioners perceived the LPFS<br />
as the most suitable form for differential reporting.<br />
The results indicate some interest in the complete separation from<br />
IFRSs for financial reporting for SMEs by both practitioners and users.<br />
Since the LPFS <strong>of</strong> South Africa has been described by researchers as a<br />
cosmetic change, a move away from this system to a better form (complete<br />
or partial exemption <strong>of</strong> both recognition and measurement and presentation<br />
and disclosure) may be appreciated (Everingham & Watson 2003:11).<br />
However, it must be acknowledged that the complete separation from IFRSs<br />
113
Lesley Stainbank<br />
would be too costly and time consuming especially for developing countries<br />
where resources are limited (Hattingh 2006: par 7).<br />
Table 2: Suitability <strong>of</strong> the possible forms for differential reporting<br />
Cash<br />
basis<br />
Income<br />
tax basis<br />
LPFS –<br />
simplified<br />
IFRSs<br />
Full<br />
compliance<br />
with<br />
IFRSs<br />
Completeseparation<br />
from<br />
IFRSs<br />
Very suitable<br />
Suitable<br />
114<br />
Neutral<br />
Less suitable<br />
Not suitable<br />
Very suitable<br />
and suitable<br />
No. No. No. No. No. No. %<br />
Combined 5 2 11 15 8 7 17 5<br />
Users 3 0 4 5 2 3 21 4<br />
Practitioners 2 2 7 10 6 4 15 4<br />
Combined 6 11 11 7 6 17 41 =2<br />
Users 5 5 2 1 1 10 71 1<br />
Practitioners 1 6 9 6 5 7 26 3<br />
Combined 20 8 5 8 0 28 68 1<br />
Users 2 2 4 6 0 4 29 3<br />
Practitioners 18 6 1 2 0 24 89 1<br />
Combined 4 7 7 8 15 11 27 4<br />
Users 1 3 1 3 6 4 29 3<br />
Users (n=14)<br />
Practitioners (n= 27)<br />
Practitioners 3 4 6 5 9 7 26 3<br />
Combined 4 13 9 5 10 17 41 =2<br />
Users 1 5 3 1 4 6 43 2<br />
Practitioners 3 8 6 4 6 11 41 2<br />
Rank
The Suitability <strong>of</strong> International Financial Reporting Standards for SMEs<br />
Since prior research has indicated that developing standards for<br />
SMEs based on full IFRSs is not appropriate (Martin 2005:2), a separate<br />
question asked the respondents if they were in agreement with an approach<br />
where standards for SMEs are built on IFRSs, but simplified.<br />
Table 3 shows the perceptions <strong>of</strong> the respondents concerning the<br />
suitability <strong>of</strong> this approach.<br />
Table 3: An approach where standards are built on IFRSs but<br />
simplified<br />
Users Practitioners Total<br />
(n=14) (n=27)<br />
(n=41)<br />
No. % No. % No. %<br />
Very appropriate 1 7 6 22 7 17<br />
Appropriate 8 57 17 63 25 61<br />
Neutral 2 14 3 11 5 12<br />
Less appropriate 3 22 0 0 3 8<br />
Not appropriate 0 0 1 4 1 2<br />
Total 14 100 27 100 41 100<br />
Table 3 indicates that 78% <strong>of</strong> the total respondents perceive that a<br />
very appropriate or appropriate approach would be one where standards for<br />
SMEs are built on IFRSs but simplified. A higher percentage <strong>of</strong> practitioners<br />
(85%) favour this approach as opposed to only 64% <strong>of</strong> users. The<br />
perceptions regarding the development <strong>of</strong> standards based on IFRSs but<br />
simplified are possibly an indication that South Africa lacks the resources<br />
and time to develop a completely separate set <strong>of</strong> standards.<br />
As South Africa had issued a discussion paper on the draft IFRS for<br />
SMEs at the time the questionnaire was administered, a question was asked<br />
whether the initiative <strong>of</strong> South Africa and the Eastern, Central and Southern<br />
African Federation <strong>of</strong> Accountants (ECSAFA) (2005) in developing<br />
temporary standards, which will later be substituted with IFRS for SMEs, is<br />
appropriate. The results <strong>of</strong> this question are shown in table 4.<br />
115
Lesley Stainbank<br />
Table 4: Appropriateness <strong>of</strong> the initiative <strong>of</strong> South Africa and ECSAFA<br />
in setting temporary standards for SMEs<br />
Users Practitioners Total<br />
(n=14) (n=27) (n=41)<br />
No. % No. % No. %<br />
Very<br />
appropriate<br />
0 0 9 34 9 22<br />
Appropriate 4 28 8 30 12 29<br />
Neutral 4 28 8 30 12 29<br />
Less appropriate 5 36 1 3 6 16<br />
Not appropriate 0 0 1 3 1 2<br />
Did not respond 1 8 0 0 1 2<br />
Total 14 100 27 100 41 100<br />
Fifty-one percent (51%) <strong>of</strong> the total respondents perceive that setting<br />
temporary standards for SMEs, which will later be substituted by IFRS for<br />
SMEs to be appropriate or very appropriate. The limited support for setting<br />
temporary standards by users may be because this group <strong>of</strong> respondents<br />
consider it a waste <strong>of</strong> resources. This respondent group also preferred the<br />
income tax basis (see table 2) and this may be a reason why they do not see<br />
the need for temporary standards for SMEs.<br />
The early adoption <strong>of</strong> the draft IFRS for SMEs may have solved<br />
some <strong>of</strong> the problems faced by SMEs as a result <strong>of</strong> compliance with IFRSs.<br />
Based on the above findings, it can be concluded that an approach where<br />
standards for SMEs are built on IFRSs is appropriate especially for emerging<br />
economies like that <strong>of</strong> South Africa.<br />
The Content <strong>of</strong> Differential Reporting for SMEs<br />
The questionnaire then attempted to identify which accounting standards<br />
ought to be fully excluded from, partially excluded from or fully<br />
incorporated into differential reporting for SMEs. The partially excluded<br />
option was further divided into recognition and measurement exemptions as<br />
well as presentation and disclosure exemptions. Respondents were given a<br />
list <strong>of</strong> 25 IFRSs (see Appendix 1). As differential reporting is effectively in<br />
existence in respect <strong>of</strong> those statements <strong>of</strong> IFRSs with which unlisted<br />
116
The Suitability <strong>of</strong> International Financial Reporting Standards for SMEs<br />
entities are not required to comply, such statements <strong>of</strong> IFRSs were omitted.<br />
Furthermore, IFRSs which are industry specific were also excluded except<br />
for IAS 41 - Agriculture which is considered important in South Africa.<br />
These results are shown in tables 5 and 6.<br />
Table 5 shows the overall results, which indicate whether certain<br />
accounting standards should be fully excluded, partially excluded or fully<br />
incorporated when developing differential reporting for SMEs, and table 6<br />
shows the separate responses for each target group.<br />
The non-response rate in tables 5 and 6 is very high with an average<br />
non-response rate <strong>of</strong> 31% for users and 16% for practitioners. Because <strong>of</strong> the<br />
high non-response rate, a rating <strong>of</strong> above 40% is considered significant.<br />
Table 5: The content for differential reporting (all respondents n= 41)<br />
Partially exempt<br />
Standards<br />
Fully exempt<br />
Recognition<br />
and<br />
measurement<br />
Presentation<br />
and disclosure<br />
117<br />
Fully incorporated<br />
Did not respond<br />
% % % % % %<br />
IAS 2 2 24 12 37 25 100<br />
IAS 7 24 10 7 46 13 100<br />
IAS 8 12 10 5 54 19 100<br />
IAS 10 24 10 12 32 22 100<br />
IAS 12 7 36 17 17 23 100<br />
IAS 16 0 41 17 22 20 100<br />
IAS 17 29 10 10 32 19 100<br />
IAS 18 0 39 5 32 24 100<br />
IAS 19 15 15 7 41 22 100<br />
IAS 20 5 10 22 44 19 100<br />
IAS 21 7 32 24 20 17 100<br />
IAS 23 12 29 2 37 20 100<br />
IAS 24 34 17 10 15 24 100<br />
IAS 27 51 17 5 10 17 100<br />
Total
Lesley Stainbank<br />
IAS 28 32 12 17 15 24 100<br />
IAS 31 34 22 10 12 22 100<br />
IAS 32 15 12 41 12 20 100<br />
IAS 36 7 32 7 34 20 100<br />
IAS 37 10 32 5 32 21 100<br />
IAS 38 10 29 17 27 17 100<br />
IAS 39 10 41 15 17 17 100<br />
IAS 40 7 32 10 29 22 100<br />
IAS 41 20 24 2 29 25 100<br />
IFRS 3 46 20 5 7 22 100<br />
IFRS 5 56 15 2 7 20 100<br />
Table 6: The content for differential reporting (showing the results<br />
separately for each respondent group)<br />
Partially exempt<br />
Standards<br />
Users<br />
1<br />
Fully exempt<br />
Prac 2<br />
Recognition<br />
and<br />
measurement<br />
Users 1<br />
Prac 2<br />
Presentation<br />
and<br />
disclosure<br />
118<br />
Fully<br />
incorporated<br />
% % % % % % % % % %<br />
IAS 2 - 4 29 22 21 7 21 45 29 22<br />
IAS 7 14 30 7 - 14 4 28 56 37 10<br />
IAS 8 7 15 7 11 - 7 57 52 29 15<br />
IAS 10 21 26 21 4 7 15 21 37 30 18<br />
IAS 12 - 11 36 37 7 22 29 11 28 19<br />
IAS 16 - - 43 41 14 19 14 26 29 14<br />
IAS 17 7 41 21 4 7 11 36 30 29 14<br />
IAS18 - - 43 37 - 7 29 33 28 23<br />
IAS 19 - 22 7 19 14 4 50 37 29 18<br />
Users 1<br />
Prac 2<br />
Users 1<br />
Prac 2<br />
Users 1<br />
Did not respond<br />
Prac 2
The Suitability <strong>of</strong> International Financial Reporting Standards for SMEs<br />
IAS 20 - 7 7 11 14 26 50 41 29 15<br />
IAS 21 - 11 21 37 21 26 29 15 29 11<br />
IAS 23 - 19 43 22 - 4 29 41 28 14<br />
IAS 24 21 41 21 15 7 11 7 19 44 14<br />
IAS 27 36 59 21 15 - 7 14 7 29 12<br />
IAS 28 36 30 7 15 15 19 - 22 42 14<br />
IAS 31 36 33 29 19 15 7 7 15 13 26<br />
IAS 32 - 22 - 19 57 33 7 15 36 11<br />
IAS 36 - 11 43 26 7 7 21 41 29 15<br />
IAS 37 - 15 43 26 - 7 29 33 28 19<br />
IAS 38 14 7 21 33 29 11 21 30 15 19<br />
IAS 39 7 11 36 44 21 11 7 22 29 12<br />
IAS 40 - 11 36 30 14 7 21 33 29 19<br />
IAS 41 7 26 7 33 - 4 43 22 43 15<br />
IFRS 3 21 59 29 15 7 4 7 7 36 15<br />
IFRS 5 63 52 7 19 - 4 - 11 30 14<br />
1<br />
Users (n = 14)<br />
2<br />
Practitioners (n = 27)<br />
From table 5 it can be seen that overall there was support for SMEs<br />
to be fully excluded from the following standards:<br />
• IAS 27 - Consolidated and separate financial statements (51%),<br />
• IFRS 3 - Business combinations (46%), and<br />
• IFRS 5 - Non-current assets held for sale and discontinued<br />
operations (56%).<br />
Table 6 shows that there was less support by the users for SMEs to<br />
be fully excluded from IAS 27 and IFRS 3. Table 6 also shows some support<br />
by the practitioners for exemption from IAS 17 – Leases (41%) and IAS 24<br />
– Related party disclosures (41%).<br />
Table 5 shows that the total respondents perceived a number <strong>of</strong><br />
standards to be appropriate for SMEs and should be fully incorporated in<br />
SMEs’ financial reporting standards. These standards are:<br />
119
Lesley Stainbank<br />
• IAS 7 – Statement <strong>of</strong> cash flows (46%),<br />
• IAS 8 - Accounting policies, changes in accounting estimates and<br />
errors (54%),<br />
• IAS 19 - Employee benefits (41%), and<br />
• IAS 20 - Accounting for government grants and disclosure <strong>of</strong><br />
government assistance (44%).<br />
Table 5 also shows some support for IAS 2 Inventories (37%) to be<br />
fully incorporated into the financial statements <strong>of</strong> SMEs.<br />
Table 6 shows that the support for IAS 2 and IAS 7 to be fully<br />
incorporated into SMEs’ financial standards was stronger for the<br />
practitioners compared to the users. However, support for the full<br />
incorporation <strong>of</strong> IAS 8, IAS 19 and IAS 20 was stronger for the users. IAS<br />
23 Borrowing costs and IAS 36 Impairment <strong>of</strong> assets were both more<br />
supported at 41% by the practitioners as compared to the users, whereas IAS<br />
41 Agriculture was more supported by the users at 43% when compared to<br />
the practitioners.<br />
With regards to recognition and measurement concessions, there<br />
was support for IAS 16 Property, plant and equipment (41%) and IAS 39<br />
Financial instruments: recognition and measurement (41%) (see table 5)<br />
with table 6 showing, in respect <strong>of</strong> IAS 16 that the degree <strong>of</strong> support was<br />
similar for both respondent groups but that, with respect to IAS 39, the<br />
concession was more strongly supported by the practitioners. Table 6 also<br />
indicates that the users supported recognition and measurement exemptions<br />
from IAS 18 Revenue, IAS 23 Borrowing costs, IAS 36 Impairment <strong>of</strong> assets<br />
and IAS 37 Provisions, contingent liabilities and contingent assets.<br />
With regards to presentation and disclosure concessions, there was<br />
overall support for concessions in respect <strong>of</strong> IAS 32 Financial instruments:<br />
presentation (see table 5) with table 6 showing that this was more strongly<br />
supported by the users than by the practitioners.<br />
Table 5 also shows that there is less support for presentation and<br />
disclosure exemptions when compared to recognition and measurement<br />
exemptions, which may suggest that more recognition and measurement<br />
exemptions are required.<br />
Table 6 clearly shows that the non-response rate for this question<br />
was higher for the user group when compared to the practitioner group. As<br />
120
The Suitability <strong>of</strong> International Financial Reporting Standards for SMEs<br />
indicated previously, the user group indicated that they found this question<br />
too technical. A perusal <strong>of</strong> table 6 indicates that the practitioners saw the<br />
need for SMEs to be exempt from more standards when compared to the<br />
users.<br />
These findings support the principle <strong>of</strong> granting recognition and<br />
measurement concessions found in Canada’s (CICA 2002) and New<br />
Zealand’s (ICANZ 2002) differential reporting requirements. However,<br />
these findings indicate support for more extensive recognition and<br />
measurement concessions. The results <strong>of</strong> this study can be compared to the<br />
Wells’ (2005) study where there was strong support for the principle <strong>of</strong><br />
granting recognition and measurement as well as presentation and disclosure<br />
exemptions even though this study shows little support for presentation and<br />
disclosure exemptions.<br />
Although close corporations, sole proprietorship and partnerships<br />
are not required to prepare a statement <strong>of</strong> cash flows, 46% <strong>of</strong> the<br />
respondents support that the statement <strong>of</strong> cash flows should be fully<br />
incorporated into the financial statements <strong>of</strong> SMEs. Arguments for not<br />
disclosing the statement <strong>of</strong> cash flows include that it is not always<br />
understandable, that its cost <strong>of</strong> preparation far exceeds its benefits and that<br />
cash flow information is provided too late to be used by managers <strong>of</strong><br />
qualifying entities (SAICA 2003:7). However, the statement <strong>of</strong> cash flows is<br />
important for decision making since it monitors cash flow movements. The<br />
Wells’ (2005) study also indicated that the majority <strong>of</strong> the respondents in his<br />
study perceived the statement <strong>of</strong> cash flows to be appropriate for all close<br />
corporations and all private companies with a limited user base.<br />
Conclusion<br />
This study investigated users’ and practitioners’ perspectives on the<br />
appropriate form for differential reporting and what its content should be.<br />
With regards to the appropriate form for differential reporting, the study<br />
found that limited purpose financial statements were overall the most<br />
favoured form for differential reporting. As this is the direction taken by the<br />
IASB in issuing IFRS for SMEs (IASB 2009a), this result provides evidence<br />
that this form is supported. The users showed a preference for the income<br />
tax basis, but this may be because they are able to access additional<br />
information about the SME should they so require.<br />
121
Lesley Stainbank<br />
With regards to the content <strong>of</strong> differential reporting for SMEs, the<br />
study found support for recognition and measurement concessions with<br />
regards to the accounting standards that formed part <strong>of</strong> this study. However,<br />
IAS 2 – Inventories, IAS 7 – Statement <strong>of</strong> cash flows, IAS 8 – Accounting<br />
policies, changes in accounting estimates and errors, and IAS 20 –<br />
Accounting for government grants and disclosure <strong>of</strong> government assistance<br />
were considered to be important for SMEs.<br />
The standards, which the respondents considered SMEs should be<br />
fully exempt from, were IFRS 3 – Business combinations, IFRS 5 – Noncurrent<br />
assets held for sale and discontinued operations, and IAS 27 –<br />
Consolidated and separate financial statements.<br />
This study does have some limitations. Firstly, the choice <strong>of</strong><br />
<strong>KwaZulu</strong>-<strong>Natal</strong> for both target groups means that the results cannot be<br />
generalized to different target groups or to the rest <strong>of</strong> South Africa.<br />
Secondly, the response rate was low with a consequent low level <strong>of</strong><br />
statistical tests. However, despite these limitations the study provides useful<br />
and relevant information and extends the research in this area.<br />
Future, research could investigate whether users’ needs are satisfied<br />
with the information that will be provided by SMEs using IFRS for SMEs.<br />
This study also found that the more technical questions in the questionnaire<br />
were not always answered by the respondents. Future research could be<br />
conducted using interviews or focus groups to get a better understanding <strong>of</strong><br />
the usefulness <strong>of</strong> IFRS for SMEs.<br />
Acknowledgment: I would like to acknowledge the contribution <strong>of</strong> Mercy<br />
Bih Tafuh to this article.<br />
References<br />
Accounting Practices Board (APB) 2007. Minutes <strong>of</strong> the Meeting <strong>of</strong> the<br />
Accounting Practices Board held on the 7 August 2007. Available at:<br />
https://www.saica.co.za/documents/APB_agenda_ 8Feb2008_Att1.pdf.<br />
(Accessed on March, 01 2010.)<br />
Accounting Practices Board (APB) 2009. Minutes <strong>of</strong> the Meeting <strong>of</strong> the<br />
Accounting Practices Board held on the 13 August 2009. Available at:<br />
https://www.saica.co.za/tabid/782/itemid/1735/language/en-US/13-<br />
August-2009.aspx. (Accessed on March 01, 2010.)<br />
122
The Suitability <strong>of</strong> International Financial Reporting Standards for SMEs<br />
American Institute <strong>of</strong> Certified Public Accountants (AICPA) 2005. Private<br />
Company Financial Reporting Task Force Report. Available at:<br />
http://www.aicpa.org/members/div/acctstd/pvtco_ fincl_reprt/index.<br />
(Accessed on July 17, 2006.)<br />
American Institute <strong>of</strong> Certified Public Accountants (AICPA) 2006.<br />
Enhancing the Financial Accounting and Reporting Standard-setting<br />
Process for Private Companies. Available at: http://www.pcfr.org/<br />
downloads/ITC_private_company_financial_reporting.pdf. (Accessed<br />
on December 17, 2006.)<br />
Anacoreta, L & PD Silva 2005. International Accounting Standards for<br />
SMEs: an exploratory study, Unpublished paper. Available at: http://<br />
www.porto.ucp.pt/feg/links/papers/IASB_onSME_Luisa_Anacoreta_e_<br />
Duarte_Silva.pdf. (Accessed on February 13, 2009.)<br />
Barker, P & C Noonan 1996. Small Company Compliance with Accounting<br />
Standards. Irish Situation. Available at: http://www.dcu.ie/<br />
dcubs/research_papers/no10.html#contents. (Accessed on July 17,<br />
2006.)<br />
Carsberg, BV, MJ Page, AJ Sindall & ID Waring 1985. Small Company<br />
Financial Reporting. London: Prentice Hall; The Institute <strong>of</strong> Chartered<br />
Accountants in England and Wales.<br />
Canadian Institute <strong>of</strong> Certified Accountants (CICA) 2002. Section 1300,<br />
Differential Reporting. Toronto: CICA.<br />
Chand, P, C Patel, & L Cummings 2006. Relevant Standards for Small and<br />
Medium Size Entities (SMEs): The Case for South Pacific Region.<br />
Available at: http://www.unisa.edu.au/ commerce/events/docs/2006.<br />
(Accessed on September 21, 2006.)<br />
Cleminson, J & E Rabin 2002. The Reporting Problems Faced by Small<br />
Businesses in South Africa. Paper presented at the Southern African<br />
Accounting Association biennial conference, Port Elizabeth.<br />
Crains, D, P Hosp & R Martins 2006. Is IFRS up to Standard? The Insider<br />
Business Club March:24.<br />
Eastern, Central and Southern African Federation <strong>of</strong> Accountants<br />
(ECSAFA) 2005. ECSAFA Guidance on Financial Reporting for Small<br />
and Medium-sized Entities. Available at: http://www.saica.co.za/<br />
documents/ECSAFA_Guideline_on_Financial_Reporting SMEs.pdf.<br />
(Accessed on July 15, 2006.)<br />
123
Lesley Stainbank<br />
Elliot, WB, F Hodge, JJ Kennedy & M Pronk 2009. Are MBA Students a<br />
Good Proxy for Non-pr<strong>of</strong>essional Investors? Available at: http://papers.<br />
ssrn.com/sol3/papers.cfm?abstract_id= 5689521. (Accessed on March<br />
25, 2009.)<br />
Everingham, GK & A Watson 2003. Limited Purpose Financial Statements<br />
(LPFS). GAAP Newsletter. September. Cape Town: Juta and Co Ltd.<br />
Hattingh, C 2002. Lessons from a Neighbour. Available at:<br />
http://www.mafiabuzz.co.za/downloads/Straight. (Accessed on July 20,<br />
2006.)<br />
Hattingh, C 2006. Differential Accounting in Malawi. Available at:<br />
http://www.mafiabuzz.co.za/downloads/Straight. (Accessed on July 20,<br />
2006.)<br />
Holmes, C, P Kent, & G Downey 1991. The Australian Differential<br />
Reporting Debate: Survey <strong>of</strong> Practitioners. Accounting and Business<br />
Research 21,82: 125-132.<br />
Institute <strong>of</strong> Chartered Accountants <strong>of</strong> New Zealand (ICANZ) 2002.<br />
Framework for Differential Reporting. Wellington: ICANZ.<br />
International Accounting Standards Board (IASB) 2004. Discussion Paper,<br />
Preliminary View on Accounting Standards for Small and Medium-<br />
sized Entities. London: IASCF.<br />
International Accounting Standards Board (IASB) 2009a. IFRS for SMEs.<br />
London: IASCF.<br />
International Accounting Standards Board (IASB) 2009b. IFRS for SMEs<br />
Basis for Conclusions. London: IASCF.<br />
International Accounting Standards Committee Foundation (IASCF) 1989.<br />
Framework for the Preparation and Presentation <strong>of</strong> Financial<br />
Statements. London: IASCF.<br />
Joshi, PL & S Ramadhan 2002. The Adoption <strong>of</strong> International Accounting<br />
Standards by Small and Closely Held Companies in Bahrain.<br />
International <strong>Journal</strong> <strong>of</strong> Accounting 37: 429-440.<br />
Kruger, R 2004. Harmonising User Needs with Reporting Requirements <strong>of</strong><br />
Close Corporations. Unpublished MCom Dissertation, <strong>University</strong> <strong>of</strong><br />
Free State, Bloemfontein.<br />
Liyanarachchi, GA 2007. Feasibility <strong>of</strong> Using Student Subjects in<br />
Accounting Experiments: A Review. Public Accounting Review 19,1:<br />
47-67.<br />
124
The Suitability <strong>of</strong> International Financial Reporting Standards for SMEs<br />
Lőtter, WA 2006. The Role <strong>of</strong> Cash Bases in Differential Corporate<br />
Reporting. Paper presented at the Southern African Accounting<br />
Association’s biennial conference at Sun City.<br />
Maingot, M & D Zeghal 2006. Financial Reporting <strong>of</strong> Small Entities in<br />
Canada. <strong>Journal</strong> <strong>of</strong> Small Business Management 44,4:513-530.<br />
Martin, R 2005. Financial Reporting by Small and Medium Sized<br />
Enterprises. Available at: http://www.accaglobal.com/databases/events/<br />
centraleurope. (Accessed on June 13, 2006.)<br />
Mosso, D 1983. Standard Overload. No simple Solution. The CPA <strong>Journal</strong><br />
October: 12-22.<br />
Schiebel, A 2008. Is There Solid Empirical Evidence <strong>of</strong> the IASB’s Draft<br />
IFRS for SMEs? Paper Presented at the 31 st Annual Congress <strong>of</strong> the<br />
European Accounting Association, Rotterdam, The Netherlands.<br />
South African Institute <strong>of</strong> Chartered Accountants (SAICA) 2003. Exposure<br />
Draft (ED) 163, Limited Purpose Financial Reporting Standards.<br />
Johannesburg: SAICA.<br />
South African Institute <strong>of</strong> Chartered Accountants (SAICA) 2007. Statement<br />
<strong>of</strong> Generally Accepted Accounting Practice for Small and Medium-sized<br />
Entities. Johannesburg: SAICA.<br />
Tafuh, MB 2008. A Survey <strong>of</strong> the Impact <strong>of</strong> International Financial<br />
Reporting Standards on Small and Medium-sized Entities. Unpublished<br />
MAcc Dissertation, <strong>University</strong> <strong>of</strong> <strong>KwaZulu</strong>-<strong>Natal</strong>, Durban.<br />
Upton, S & L Ostergaard 1985. The FASB Response to Small Business.<br />
<strong>Journal</strong> <strong>of</strong> Accounting May: 94-100.<br />
Van Wyk, HA 2005. Do Small Entities Require More Relaxed Differential<br />
Reporting in South Africa? Paper presented at the international research<br />
conference for accounting educators, Bordeaux, France.<br />
Van Wyk, HA & J Rossouw 2009. IFRS for SMEs in South Africa: A Giant<br />
Leap for Accounting, But too Big for Smaller Entities in General.<br />
Meditari Accountancy Research 17,1: 99-116.<br />
Wells, MJC 2005. A Survey <strong>of</strong> South African Registered Accountants’ and<br />
Auditors’ Attitudes towards Differential Corporate Reporting.<br />
Unpublished MAcc Dissertation, <strong>University</strong> <strong>of</strong> <strong>KwaZulu</strong>-<strong>Natal</strong>, Durban.<br />
Zanzig, JS & DL Flesher 2006. GAAP Requirements for Non-public<br />
Companies. Available at: http://www.nysscpa.org/cpajournal/2006/<br />
506/essentials/p40.ht. (Accessed on May 29, 2006.)<br />
125
Lesley Stainbank<br />
Appendix 1<br />
Selected International Financial Reporting Standards<br />
AC 000 Framework for the preparation and presentation <strong>of</strong> financial<br />
statements<br />
IAS 1 Presentation <strong>of</strong> financial statements<br />
IAS 2* Inventories<br />
IAS 7* Statement <strong>of</strong> cash flows<br />
IAS 8* Accounting policies, changes in accounting estimates and errors<br />
IAS 10* Events after the reporting period<br />
IAS 12* Income taxes<br />
IAS 16* Property, plant and equipment<br />
IAS 17* Leases<br />
IAS 18* Revenue<br />
IAS 19* Employee benefits<br />
IAS 20* Accounting for government grants and disclosure <strong>of</strong> government<br />
assistance<br />
IAS 21* The effects <strong>of</strong> changes in foreign exchange rates<br />
IAS 23* Borrowing costs<br />
IAS 24* Related party disclosures<br />
IAS 27* Consolidated and separate financial statements<br />
IAS 28* Investments in associates<br />
IAS 31* Interests in joint ventures<br />
IAS 32* Financial instruments: presentation<br />
IAS 36* Impairment <strong>of</strong> assets<br />
IAS 37* Provisions, contingent liabilities and contingent assets<br />
IAS 38* Intangible assets<br />
IAS 39* Financial instruments: recognition and measurement<br />
IAS 40* Investment property<br />
IAS 41* Agriculture<br />
IFRS 3* Business Combinations<br />
IFRS 5* Non-current assets held for sale and discontinued operations<br />
* - included in questionnaire<br />
126
The Suitability <strong>of</strong> International Financial Reporting Standards for SMEs<br />
127<br />
Lesley Stainbank<br />
Faculty <strong>of</strong> Management Studies<br />
<strong>University</strong> <strong>of</strong> <strong>KwaZulu</strong>-<strong>Natal</strong><br />
Durban, South Africa<br />
Stainbankl@ukzn.ac.za
Reevaluation <strong>of</strong> an Experimental Model to<br />
Determine the Impact <strong>of</strong><br />
Entrepreneurial Networking on<br />
Small Business Success<br />
Charles O’Neill<br />
Sanjay Soni<br />
Abstract<br />
Previous studies by the authors (O’Neill, Soni, Coldwell & Edmonds 2007;<br />
and O’Neill & Soni 2009) laid the foundation for the development <strong>of</strong> an<br />
experimental model to measure the impact <strong>of</strong> entrepreneurial networks on<br />
the success <strong>of</strong> businesses and consequently empirically tested this model<br />
among 38 small businesses belonging to networking groups within the<br />
Chambers <strong>of</strong> Business in Pietermaritzburg and Durban. In this article the<br />
theoretical background to the development <strong>of</strong> the experimental model is<br />
revisited and the model is empirically tested among a further 34 small<br />
businesses belonging to a small enterprise development agency in<br />
Pietermaritzburg. The findings <strong>of</strong> this group are consequently compared to<br />
the previous study in order to determine whether the same trends could be<br />
observed among diverse samples. Although both empirical studies<br />
researched only 72 small businesses selected through convenience sampling,<br />
which can be argued is by no means adequate to make any generalisations<br />
from, it is nevertheless potentially beneficial from an exploratory point <strong>of</strong><br />
view to determine whether the experimental model <strong>of</strong> networking and its<br />
components have any value as potential contributors to small business<br />
success or not.<br />
Keywords: Business success, competitive advantage, critical success<br />
factors, entrepreneur, entrepreneurial firm, entrepreneurial networking, small<br />
business, testable model.<br />
<strong>Alternation</strong> Special Edition 4 (2011) 128 – 147<br />
ISSN 1023-1757<br />
128
… Impact <strong>of</strong> Entrepreneurial Networking on Small Business Success<br />
1.0 Introduction<br />
Businesses do not operate in isolation and it can therefore be argued that all<br />
businesses need some kind <strong>of</strong> networking. The need for external assistance<br />
to strengthen an <strong>of</strong>ten-weak base <strong>of</strong> resources is even more crucial in the<br />
case <strong>of</strong> the small business sector that <strong>of</strong>ten cannot survive or grow without<br />
the networks that facilitate such external assistance. As there is still much<br />
uncertainty on the requirements <strong>of</strong> effective and efficient networking, this<br />
paper will explore the nature and characteristics <strong>of</strong> networking as well as the<br />
factors that determine business success in the literature.<br />
In this paper a review <strong>of</strong> the literature on entrepreneurial networking<br />
largely based on the previous study <strong>of</strong> (O’Neill et al. 2007) will be<br />
conducted, followed by the presentation and discussion <strong>of</strong> the experimental<br />
model to determine the impact <strong>of</strong> entrepreneurial networking on small<br />
business success. The research methodology to empirically test the<br />
experimental model will then be dealt with, followed by the discussion <strong>of</strong><br />
the findings, summary, caveats and suggestions for further research.<br />
2.0 Literature Review<br />
Networks can be defined as reciprocal patterns <strong>of</strong> communication and<br />
exchange (Powell 1990). Networks refer to ‘the coming together’ <strong>of</strong> a group<br />
<strong>of</strong> enterprises or people to use their combined talents and resources in order<br />
to achieve results which would not have been possible if they operated<br />
individually (Dean, Holmes & Smith 1997). Premaratne (2002) defined<br />
networks as personal relationships between an entrepreneur and his/her<br />
external actors. These external actors (or outsiders) can be individuals or<br />
organisations and are not directly employed by the entrepreneur. Networks<br />
have the potential to facilitate collective action for mutual benefit (Taylor,<br />
Jones & Boles 2004). A network can be regarded as a series <strong>of</strong> reciprocal<br />
relationships that have the potential to generate customer value and build<br />
sustainable competitive advantage for the entrepreneur. Competitive<br />
advantage can be seen as an advantage gained over competitors that enables<br />
the business to <strong>of</strong>fer greater value to customers at lower prices or by<br />
providing more benefits that justify higher prices (Kotler, Armstrong,<br />
Saunders & Wong 2002). A network is a structure where a number <strong>of</strong> nodes<br />
(entities) are related to each other by specific threads (links). Both threads<br />
129
Charles O’Neill & Sanjay Soni<br />
and nodes are loaded with regard to resources, knowledge and understanding<br />
as a result <strong>of</strong> complex interactions, adaptions and investments within and<br />
among firms over time. Networking is then a social construction that exists<br />
only as a result <strong>of</strong> the individual’s understanding and use <strong>of</strong> the network<br />
(Goudis & Skuras 2000). Networking is important to develop<br />
entrepreneurship as it enables entrepreneurs to develop relationships with<br />
the outside world. These relationships in turn help the entrepreneurs to<br />
achieve their goals and may provide special assistance to entrepreneurs in<br />
small businesses despite the fact that they usually have limited resources<br />
relative to larger businesses (Premaratne 2002).<br />
Although a universally accepted definition <strong>of</strong> entrepreneurship does<br />
not exist (Republic <strong>of</strong> South Africa, National Strategy for Fostering<br />
Entrepreneurship Study 2001), the following definition <strong>of</strong> an entrepreneur<br />
will be used as a guideline for this article: ‘an entrepreneur is a person who<br />
generates change through innovation, finds new combinations <strong>of</strong> resources,<br />
takes calculated risks, reorganises and improves existing operations and<br />
leads economic activity in times <strong>of</strong> uncertainty in order to realise a pr<strong>of</strong>it’.<br />
Based on the definitions <strong>of</strong> networking and entrepreneurship, entrepreneurial<br />
networking refers to the connection or relationship with other entrepreneurs<br />
or parties such as organisations or individuals which would result in a<br />
reciprocal pattern <strong>of</strong> communication with the underlying objective <strong>of</strong><br />
improving the position <strong>of</strong> both the entrepreneur and the party with whom<br />
he/she is networking. Implicit in this objective <strong>of</strong> entrepreneurial networks is<br />
the notion that entrepreneurial networking takes place for a reason. This<br />
would further imply that entrepreneurial networking is characterised by a<br />
specific goal. The absence <strong>of</strong> a specific goal would result in aimless<br />
networking and consequently disqualify the networking in question from<br />
being entrepreneurial networking.<br />
Although prescriptive parameters with regard to the optimum level<br />
is provided in the literature, entrepreneurial networking could be<br />
characterised by:<br />
• the network size (depth and width);<br />
• extent <strong>of</strong> network activity (for example frequency <strong>of</strong> contacts);<br />
• network diversity; and<br />
• success / failure <strong>of</strong> the networking with regard to achieving its<br />
130
… Impact <strong>of</strong> Entrepreneurial Networking on Small Business Success<br />
preconceived goals to add value to the enterprise (Edmonds 2005:<br />
63).<br />
According to Jenssen and Greve (2002) a large body <strong>of</strong> literature has<br />
shown a positive association between networking and entrepreneurship or<br />
small business performance. The effects <strong>of</strong> networking may, however, not<br />
always be positive and will depend on the size, type and developmental<br />
stage <strong>of</strong> the firm as well as its competitive strategy (Ostgaard & Birley<br />
1994). According to Sandberg and Logan (1997) research, which examined<br />
the composition and size <strong>of</strong> entrepreneurs’ networks found that neither could<br />
be conclusively linked to performance. As entrepreneurs are likely to<br />
implement multiple networks (Sandberg & Logan 1997), research should go<br />
beyond examining the composition and size <strong>of</strong> an entrepreneur’s networks<br />
and pay ample attention to differentiating among the uses, purposes and the<br />
value <strong>of</strong> the resources they provide in order to underscore the importance <strong>of</strong><br />
focused networking. The researcher should rather interpret the<br />
entrepreneur’s networking as ‘the consequences <strong>of</strong> strategic decisions’<br />
concerning targeted markets and the resources needed to compete in them<br />
(Sandberg & Logan 1997). Shane and Venkataraman (2000) suggested in<br />
this regard that the important question for the researcher is: ‘why, when and<br />
how some people and not others discover and exploit opportunities?’<br />
Burt (2002) argued that a well-structured network will obtain higher<br />
rates <strong>of</strong> return for the entrepreneur than badly structured networks. In this<br />
regard the ‘structural hole argument’ holds that the structural hole is an<br />
opportunity to facilitate the flow <strong>of</strong> information between people and control<br />
the form <strong>of</strong> projects that connect people from the opposite sides <strong>of</strong> the hole<br />
(Burt 1998). Structural holes are gaps between non-redundant contacts.<br />
Unless the hole is spanned, it will act as a buffer in similar fashion than an<br />
insulator in an electric circuit. The entrepreneur who identifies and spans the<br />
hole, creates a bridge between otherwise disconnected networks and<br />
determines whose interests are served by the bridge.<br />
Networks rich in the entrepreneurial opportunities <strong>of</strong>fered by<br />
structural holes, could be regarded as entrepreneurial networks as they<br />
present the opportunity for entrepreneurs who are skilled in building<br />
interpersonal bridges to span structural holes (Burt 1998). In this regard<br />
Aldrich (1999) asserted that successful entrepreneurs are not necessarily<br />
131
Charles O’Neill & Sanjay Soni<br />
those who create structural holes but rather those who know how to use the<br />
structural holes they find. A variant <strong>of</strong> the structural hole argument attributes<br />
advantage to the occupation <strong>of</strong> a bridging position within a network. In this<br />
regard Mc Evily and Zaheer (1999) surveyed 227 job shop manufacturers in<br />
Midwest USA and found that lower density networks were associated with<br />
greater acquisition and deployment <strong>of</strong> capabilities necessary for<br />
competitiveness in the metalworking segment <strong>of</strong> the automotive industry.<br />
The benefits <strong>of</strong> the structural hole argument were also supported by the<br />
research findings <strong>of</strong> Baum, Calabrese and Silverman (2000) in Canada<br />
during the six year period (1991-1996) when comparing 142 start-up<br />
biotechnology firms with 471 firms founded prior to 1991. The research<br />
showed that alliance partner heterogeneity had a positive effect on<br />
subsequent financial performance and innovative capability.<br />
Singh, Hills and Lumpkin (1999) surveyed 256 consulting<br />
entrepreneurs in the information technology industry and found that in the<br />
early stage <strong>of</strong> the entrepreneurial process, entrepreneurs appear to benefit<br />
from diverse information flows. This could most probably be attributed to<br />
the diverse needs during the start-up process. Davidsson and Honig (2003)<br />
conducted a study among nascent entrepreneurs (n=380) and a control group<br />
(n=608) in Sweden and followed the development process for 18 months.<br />
The study found that being a member <strong>of</strong> a business network had a<br />
statistically significant positive effect on the business in general. Human and<br />
Provan (1997) in a comparative qualitative study <strong>of</strong> two networks <strong>of</strong> small<br />
and medium sized manufacturing enterprises in the USA’s wood product<br />
industry found that network exchanges appeared to add more value with<br />
regard to learning about your own organizational capabilities than about<br />
market exchanges. It further enhanced knowledge with regard to awareness<br />
<strong>of</strong> who their real competitors were (Human & Provan 1997).<br />
The research <strong>of</strong> Hoang and Antocic (2003) with regard to previous<br />
publications on entrepreneurship, sociology and the role <strong>of</strong> networks in the<br />
entrepreneurial context, suggested that current research work seeking to<br />
explain entrepreneurial success is limited by considerable conceptual<br />
vagueness with regard to both the resources required for success and how we<br />
measure the networks that help to promote those measures. Mapping<br />
networks <strong>of</strong> general information flows may be too far removed from<br />
resource flows and more closely linked to an outcome such as business<br />
132
… Impact <strong>of</strong> Entrepreneurial Networking on Small Business Success<br />
performance (Hoang & Antocic 2003). Network data derived from detailed<br />
lists <strong>of</strong> relevant business resources may have more predictive power<br />
especially if more attention is paid to how network data is elicited in order to<br />
verify the reliability <strong>of</strong> the source. The uniqueness <strong>of</strong> the industry researched<br />
should, however, be borne in mind and generalizing <strong>of</strong> findings done with<br />
caution (Human & Provan 1997). Entrepreneurial successes and failures are<br />
an important contingency that may shape network activity and structure<br />
(Hoang & Antoncic 2003). Network research can assist practitioners to meet<br />
organizational objectives and help to proactively change networks to<br />
improve the performance and effectiveness <strong>of</strong> their organizations (Nobria &<br />
Eccles 1992).<br />
In order to link the potential effect <strong>of</strong> entrepreneurial networking to<br />
business success and the eventual development <strong>of</strong> a testable model to<br />
measure business success, some perspectives on both business success and<br />
critical success factors as found in the literature, are consequently<br />
considered. Business success can be defined as a clear indication that the<br />
business has progressed with regard to a sustained level <strong>of</strong> growth,<br />
continued increase in net pr<strong>of</strong>it, continued increase in its asset base while<br />
additional factors such as increase in market share, increase in number <strong>of</strong><br />
employees and age <strong>of</strong> the business may also be used as indicators <strong>of</strong> success.<br />
The perspective taken by the person determining critical success factors in a<br />
business will determine the nature <strong>of</strong> the critical success factors themselves<br />
as each person may have his/her own perception <strong>of</strong> success and each<br />
business will have its own unique critical success factors. These could be<br />
some <strong>of</strong> the major reasons why there is no agreement with regard to a<br />
universally accepted list <strong>of</strong> critical success factors in a business. A generic<br />
approach would link critical success factors to issues such as:<br />
• the ability to select the correct target market<br />
• the superior ability to select a target market that has long term<br />
growth potential (Davidsson & Honig 2003)<br />
• the sustainability <strong>of</strong> the business<br />
• appropriate planning for start-up requirements regarding the factors<br />
<strong>of</strong> production (capital, labour, natural resources and<br />
entrepreneurship)<br />
• a healthy balance between owners’ equity and loan capital<br />
133
Charles O’Neill & Sanjay Soni<br />
• a clear and realistic vision and mission<br />
• a sustainable competitive advantage (Scarborough & Zimmerer<br />
2003)<br />
• a market-orientated approach<br />
• a feasible business idea<br />
• a realistic strategic or business plan based on solid market research<br />
• core competencies such as superior quality, service, flexibility,<br />
innovation and responsiveness(Scarborough & Zimmerer 2003)<br />
• growth potential<br />
• alertness to ensure a continuous flow <strong>of</strong> new innovations in the<br />
market (Nieman et al. 2003)<br />
• ample environmental scanning techniques with regard to<br />
competition and relevant stakeholders and<br />
• unique knowledge in the field <strong>of</strong> operation (Hitt et al. 2001).<br />
Apart from the above-mentioned generic critical success factors, the<br />
business owner needs to continuously ensure that the unique critical success<br />
factors pertinent to his/her specific business are identified and responded to<br />
in order to survive and grow. In this regard, effective networking could be<br />
most beneficial, especially in areas where the small business, in particular,<br />
does not avail <strong>of</strong> the same resources as large businesses (Starr and<br />
MacMillan, 1990; Ramachandran & Ramanarayan 1993). Brown and Butler<br />
(1995) further emphasised the point by arguing that smaller firms involved<br />
in networks that result in gaining superior information would improve their<br />
ability to identify opportunities on which to focus their limited resources.<br />
This in turn could lead to the establishment <strong>of</strong> a competitive advantage.<br />
Testable Model<br />
Based on the literature review and previous research, an experimental<br />
testable model was developed to measure the impact <strong>of</strong> entrepreneurial<br />
networking on business success. A testable model can be defined as an<br />
instrument that will enable the researcher to measure a specific<br />
phenomenon, trend or variable. The testable model based on the conceptual<br />
framework should contain the following aspects.<br />
134
… Impact <strong>of</strong> Entrepreneurial Networking on Small Business Success<br />
A. Pr<strong>of</strong>ile <strong>of</strong> the entrepreneur and his/her ability to understand business &<br />
resource needs<br />
▼<br />
B. Identification <strong>of</strong> ‘structural holes’ based on business & resource needs in<br />
(A)<br />
▼<br />
C. Identification <strong>of</strong> potential network contacts to bridge ‘structural holes’<br />
identified in (B)<br />
▼<br />
D. Establish networking contacts as required in (C)<br />
▼<br />
E. Establish a networking structure based on anchorage, density,<br />
accessibility & range<br />
▼<br />
F. Interaction with network members based on intensity, frequency,<br />
durability & direction<br />
▼<br />
G. Determine whether network provides support with regard to emotional,<br />
tangible, companionship and informational domains<br />
▼<br />
H. Continuous monitoring and assessment <strong>of</strong> network base to ensure<br />
efficiency<br />
3.0 Research Methodology<br />
The main research question that this study addresses is the following:<br />
What is the perceived impact <strong>of</strong> the experimental model developed for<br />
entrepreneurial networking on the success <strong>of</strong> selected small businesses in<br />
Pietermaritzburg and Durban?<br />
Overall Purpose<br />
To determine from owners/managers/<strong>of</strong>ficers <strong>of</strong> the businesses in the study,<br />
through the use <strong>of</strong> a semi-structured questionnaire, the perceived impact <strong>of</strong><br />
the experimental model <strong>of</strong> networking developed in a previous study on<br />
small business success <strong>of</strong> a select group <strong>of</strong> businesses in Pietermaritzburg<br />
135
Charles O’Neill & Sanjay Soni<br />
and Durban and compare it with the responses <strong>of</strong> two developmental groups<br />
<strong>of</strong> small enterprises.<br />
Research Design<br />
The study employs both an exploratory and a descriptive research design.<br />
This was considered necessary as an exploratory design helps to provide the<br />
theoretical insight and knowledge base on the subject that in turn would be<br />
useful in helping to describe findings arising from the empirical research. A<br />
descriptive design would normally address the question <strong>of</strong> ‘what is’ which is<br />
appropriate in this study as it seeks to answer the question <strong>of</strong> ‘What is the<br />
perceived impact <strong>of</strong> the experimental model <strong>of</strong> networking on the success <strong>of</strong><br />
select small businesses in Pietermaritzburg and Durban?’<br />
Sampling<br />
Permission to participate was sought and obtained from respondents who<br />
were members <strong>of</strong> a networking group <strong>of</strong> both the Pietermaritzburg and<br />
Durban Chambers <strong>of</strong> Commerce. The participation <strong>of</strong> each group was<br />
obtained at their monthly meeting venues. Each group was briefed on the<br />
purpose <strong>of</strong> the study and given the opportunity <strong>of</strong> either participating in the<br />
study or not. In addition to these two groups, a further two groups <strong>of</strong><br />
entrepreneurs were invited by ABSA Small Enterprise Development Agency<br />
in Pietermaritzburg to attend lectures on entrepreneurial networking and<br />
participated in the survey as well. Those who agreed to participate<br />
completed an informed consent form.<br />
Essentially, the study employed a convenience non-probability<br />
sample. The main reasons for using a convenience sample were to obtain<br />
information quickly and cost-effectively. Consequently, the study makes no<br />
claims <strong>of</strong> generalisability <strong>of</strong> the findings and should be considered an<br />
exploratory study.<br />
Data Collection<br />
Data was collected through a semi-structured questionnaire (for which<br />
ethical clearance was obtained from the UKZN Research Office) that was to<br />
be completed by the respondents at the respective Chamber’s monthly<br />
meeting venue and the mentioned lecture. Content validity is claimed for the<br />
136
… Impact <strong>of</strong> Entrepreneurial Networking on Small Business Success<br />
questionnaire as the questions were primarily based on a thorough review <strong>of</strong><br />
the relevant literature (O’Neill et al. 2007).<br />
Questions were developed for all the components <strong>of</strong> the<br />
experimental model developed in the previous study by O’Neill et al.<br />
(2007). The questions were mainly <strong>of</strong> a dichotomous and Likert scale type,<br />
which helped in reducing the time spent by respondents and the response<br />
rate in completing the questionnaire.<br />
4.0 Findings<br />
Study Population<br />
A total <strong>of</strong> 72 businesses were studied in the Pietermaritzburg and Durban<br />
areas. As this was a basic descriptive study <strong>of</strong> an exploratory nature where a<br />
convenience sample was used, no attempt will be made to generalise the<br />
results to the population as a whole. A notable difference in the response<br />
rate <strong>of</strong> the two studies, was that while all the members <strong>of</strong> the network groups<br />
responded, only 34 out <strong>of</strong> 42 usable questionnaires were completed by the<br />
members <strong>of</strong> the ABSA Enterprise Development Agency. This could be<br />
attributed to a few possibilities, such as less business experience than the<br />
former group, a lower level <strong>of</strong> networking-orientation or the nature <strong>of</strong> the<br />
measuring instrument. A more positive result could, for example, have been<br />
achieved if personal interviews have been conducted or if the questionnaire<br />
had been translated into Zulu as the ABSA group predominantly consisted <strong>of</strong><br />
Zulu-speaking people.<br />
Section 1: Pr<strong>of</strong>ile <strong>of</strong> the Respondents<br />
72% <strong>of</strong> the respondents had passed matric. The majority <strong>of</strong> the respondents<br />
in this study are within the age group 25-36 years. Male respondents in the<br />
study were more than twice as many as the female respondents which is in<br />
line with the national proportions <strong>of</strong> business ownership. Respondents spent<br />
an average <strong>of</strong> 5 hours per week on developing and maintaining contacts.<br />
Section 2: Networking and Business Success<br />
A 5-point Likert scale was used to obtain this information. It should be noted<br />
137
Charles O’Neill & Sanjay Soni<br />
that a median or modal score <strong>of</strong> 4 and above represents agreement that<br />
networking has contributed to the respondent’s business success and that a<br />
median or modal score <strong>of</strong> 4 and above was obtained with regard to all the<br />
questions regarding the positive effect <strong>of</strong> networking on business success.<br />
An interesting finding, however, was that the older the business, the stronger<br />
the perceived contribution <strong>of</strong> networking has been to the success <strong>of</strong> the<br />
business with a median or modal score <strong>of</strong> 5.<br />
It is therefore evident that the majority <strong>of</strong> the respondents (and<br />
especially the older businesses) have a positive perception <strong>of</strong> the<br />
contribution <strong>of</strong> networking to their businesses’ success and perceive that<br />
networking has contributed positively to their businesses establishing a<br />
competitive advantage.<br />
Perceptions <strong>of</strong> Networking<br />
Regarding the general perceptions <strong>of</strong> networking in relation to their<br />
businesses, median and modal values <strong>of</strong> 4 and above represent positive<br />
perceptions. It is clear from the statements in the table below, that<br />
respondents are generally in agreement that networking has been helpful to<br />
their businesses.<br />
Perceptions <strong>of</strong> Networking’s Contribution To Business Success<br />
Median Mode Valid N<br />
Q3.5.1- Networking helped to select<br />
correct target market<br />
Q3.5.2 - Networking helped provide<br />
4.00 4.00 N=68<br />
superior ability in selecting growth target 4.00<br />
market<br />
4.00 N=68<br />
Q3.5.3 - Networking<br />
sustainability <strong>of</strong> the business<br />
increased<br />
4.00 4.00 N=68<br />
Q3.5.4 - Networking has assisted business<br />
in appropriate planning<br />
4.00 4.00 N=67<br />
138
… Impact <strong>of</strong> Entrepreneurial Networking on Small Business Success<br />
Q3.5.5 - Networking has helped provide a<br />
healthy balance between owners' capital<br />
and loan capital<br />
Q3.5.6 - Networking has given the<br />
business a clear and realistic vision and<br />
mission.<br />
Q3.5.7 - Networking has created a<br />
sustainable competitive advantage for the<br />
business<br />
Q3.5.8 - Networking has helped the<br />
business create a market-oriented<br />
approach<br />
Q3.5.9 - Networking has assisted in<br />
making the business feasible<br />
Q3.5.10 - Networking has helped my<br />
business create a realistic business plan<br />
Q3.5.11A - Networking has developed my<br />
core business competencies regarding -<br />
Service<br />
Q3.5.11B - Networking has developed my<br />
core business competencies regarding -<br />
Flexibility<br />
Q3.5.11C - Networking has developed my<br />
core business competencies regarding -<br />
Innovation<br />
Q3.5.11D - Networking has developed my<br />
core business competencies regarding -<br />
Responsiveness<br />
Q3.5.11E - Networking has developed my<br />
core business competencies regarding -<br />
Growth Potential<br />
Q3.5.12 - Networking has made me more<br />
alert to ensure a continuous flow <strong>of</strong><br />
innovations<br />
139<br />
3.00 4.00 N=65<br />
4.00 4.00 N=66<br />
4.00 4.00 N=62<br />
4.00 4.00 N=66<br />
4.00 4.00 N=65<br />
4.00 4.00 N=63<br />
4.00 4.00 N=64<br />
4.00 4.00 N=60<br />
4.00 4.00 N=58<br />
4.00 4.00 N=58<br />
4.00 4.00 N=64<br />
4.00 4.00 N=65
Charles O’Neill & Sanjay Soni<br />
Q3.5.13 - Networking has helped me<br />
implement environmental scanning<br />
techniques more efficiently<br />
Q3.5.14 - Networking has given me<br />
unique knowledge in the field <strong>of</strong> operation<br />
140<br />
4.00 4.00 N=65<br />
4.00 4.00 N=66<br />
All the levels <strong>of</strong> the testable model were perceived to be important to<br />
business and networking success. However, certain aspects <strong>of</strong> levels A, F<br />
and G <strong>of</strong> the experimental model, although perceived to be important, were<br />
comparatively regarded not as important as the other levels <strong>of</strong> the model.<br />
These were issues pertaining to anchorage, range, emotional support,<br />
material support and tangible support.<br />
Level <strong>of</strong> Importance/ Unimportance to Business Success<br />
Respondents completed a 5-point Likert scale question depicting level <strong>of</strong><br />
importance <strong>of</strong> a number <strong>of</strong> networking-related issues to the success <strong>of</strong> their<br />
businesses. For this question, a low median or modal score <strong>of</strong> 2 or less<br />
shows a higher level <strong>of</strong> importance! On the basis <strong>of</strong> this information, it is<br />
clear from the table below that with the exception <strong>of</strong> a few statements, in<br />
general respondents from all three areas regard as being at least important to<br />
the success <strong>of</strong> their businesses the networking-related issues in the table<br />
below as depicted by the median and modal values <strong>of</strong> 2 and very important<br />
as depicted by the median and modal values <strong>of</strong> 1.<br />
Perceived Importance <strong>of</strong> Networking<br />
Median<br />
Q3.6A - Importance <strong>of</strong> correctly<br />
Mode Valid N<br />
identifying resource requirements for 1.00 1.00 N=65<br />
business success<br />
Q3.6B1 - Importance <strong>of</strong> ability to<br />
broker connections between otherwise<br />
disconnected segments <strong>of</strong> business<br />
contacts.<br />
2.00 1.00 N=65
… Impact <strong>of</strong> Entrepreneurial Networking on Small Business Success<br />
Q3.6B2 - Importance <strong>of</strong> correctly<br />
identifying opportunities for success 1.00 1.00 N=65<br />
Q3.6C1 - Importance <strong>of</strong> effectively<br />
linking people both inside and outside<br />
the business to take advantage <strong>of</strong><br />
opportunities<br />
Q3.6C2 - Importance <strong>of</strong> your ability<br />
to link people both inside and outside<br />
the organisation together<br />
Q3.6C3 - Importance <strong>of</strong> your ability<br />
to identify contacts both inside and<br />
outside who can pursue opportunities<br />
by working together<br />
Q3.6D - Importance <strong>of</strong> establishing a<br />
networking group<br />
Q3.6E - Importance <strong>of</strong> being able to<br />
establish a networking structure based<br />
on Anchorage (ultimate goal <strong>of</strong><br />
network)<br />
Q3.6E - Importance <strong>of</strong> being able to<br />
establish a networking structure based<br />
on Range (differences in background<br />
between network members)<br />
Q3.6E - Importance <strong>of</strong> being able to<br />
establish a networking structure based<br />
on Reachability (ease <strong>of</strong> contact<br />
between members)<br />
Q3.6E - Importance <strong>of</strong> being able to<br />
establish a networking structure based<br />
on Density (greater diversity amongst<br />
network contacts/members)<br />
Q3.6F - Importance <strong>of</strong> being able to<br />
address network interaction based on -<br />
Intensity (honouring obligations)<br />
141<br />
1.00 1.00 N=66<br />
1.00 1.00 N=67<br />
1.00 1.00 N=66<br />
1.00 1.00 N=65<br />
2.00 2.00 N=65<br />
2.00 2.00 N=62<br />
1.00 1.00 N=64<br />
2.00 1.00 N=64<br />
1.00 1.00 N=61
Charles O’Neill & Sanjay Soni<br />
Q3.6F - Importance <strong>of</strong> being able to<br />
address network interaction based on -<br />
Frequency (regular contacts between<br />
members)<br />
Q3.6F - Importance <strong>of</strong> being able to<br />
address network interaction based on -<br />
Durability (longstanding relationships<br />
between members)<br />
Q3.6F - Importance <strong>of</strong> being able to<br />
address network interaction based on -<br />
Direction (goal-oriented behaviour <strong>of</strong><br />
group)<br />
Q3.6F - Importance <strong>of</strong> being able to<br />
address network interaction based on -<br />
Direction (emotional support from<br />
network members)<br />
Q3.6G - Importance <strong>of</strong> addressing<br />
network content based on - Emotional<br />
support<br />
Q3.6G - Importance <strong>of</strong> addressing<br />
network content based on - Tangible<br />
support (Financial)<br />
Q3.6G - Importance <strong>of</strong> addressing<br />
network content based on - Tangible<br />
support (Material)<br />
Q3.6G - Importance <strong>of</strong> addressing<br />
network content based on -<br />
Companion support<br />
Q3.6G - Importance <strong>of</strong> addressing<br />
network content based on -<br />
Informational support<br />
142<br />
1.00 1.00 N=62<br />
1.00 1.00 N=62<br />
1.50 1.00 N=64<br />
2.00 2.00 N=65<br />
2.00 1.00 N=64<br />
2.00 1.00 N=65<br />
2.00 2.00 N=65<br />
2.00 2.00 N=66<br />
1.00 1.00 N=64<br />
5.0 Limitations <strong>of</strong> the Study<br />
The main limitation claimed by this study is that non-representative samples
… Impact <strong>of</strong> Entrepreneurial Networking on Small Business Success<br />
were chosen on a non-probability sampling basis. Consequently, this study<br />
can be considered an exploratory study and no claim is made as to the<br />
generalisability <strong>of</strong> the results. The use <strong>of</strong> a questionnaire-based measuring<br />
instrument instead <strong>of</strong> in-depth interviews could also be seen as a limitation<br />
as the exact nature <strong>of</strong> networking practices and its actual impact on business<br />
success were not investigated in sufficient detail. A translated questionnaire<br />
could also have resulted in an improved response rate from the ABSA<br />
groups as well.<br />
6.0 Conclusion<br />
Despite the limitations mentioned, all the respondents indicated that<br />
networking has played an important role in their businesses. In addition, all<br />
three groups surveyed perceived that there are many networking-related<br />
issues that play an important role in the success <strong>of</strong> their businesses. The<br />
trend with regard to the positive response on the impact <strong>of</strong> entrepreneurial<br />
networking on business success was largely similar for all groups. The<br />
impact <strong>of</strong> factors such as level <strong>of</strong> business experience, the need for an<br />
alternative measuring instrument, a translated questionnaire and a more<br />
representative sample and the impact <strong>of</strong> culture on networking practices<br />
should, however, be considered in future research.<br />
Note: A related version <strong>of</strong> this article was presented at the International<br />
Business Management Conference 2009, <strong>University</strong> <strong>of</strong> <strong>KwaZulu</strong>-<strong>Natal</strong>,<br />
Durban in November 2009.<br />
References<br />
Akizawa, H & K Kijiima 1997. Internet-based Entrepreneurial Networking<br />
to evolve the Japanese industrial structure. Available at: http://<br />
www.caravan.net/246c/ hikari/pac.pdf.<br />
Aldrich, H 1999. Organizations Evolving. London: Sage Publications.<br />
Baum, JAC, T Calabreses & BS Silverman 2000. Don’t go it Alone:<br />
Alliances Network Compositions and Start-ups Performance in<br />
Canadian Biotechnology. Strategic Management <strong>Journal</strong> 21,3: 267-294.<br />
143
Charles O’Neill & Sanjay Soni<br />
Birley, S, S Cromie & A Myers 1990. Entrepreneurial Networks: Their<br />
Creation and Development in Different Countries. Cranfield School <strong>of</strong><br />
Management Working Papers 24/90: 1-36.<br />
Brown, B & JE Butler 1995. Competitors as Allies: A Study <strong>of</strong> the<br />
Entrepreneurial Networks in the US Wine Industry. <strong>Journal</strong> <strong>of</strong> Small<br />
Business Management 32,4 July: 439-441.<br />
Burt, RS 1998. The Gender <strong>of</strong> Social Capital. Rationality and Society 10,1:<br />
5-46.<br />
Burt, RS 2002. The Social Capital <strong>of</strong> Structural Holes in New Directions in<br />
Economic Sociology. Guillen, MF, R Collins, P England & M Meyer<br />
(eds): The New Economic Sociology: Developments in an Emerging<br />
Field. New York: Russell Sage Foundation.<br />
Davidsson, P & B Honig 2003. The Role <strong>of</strong> Social and Human Capital<br />
among Nascent Entrepreneurs. <strong>Journal</strong> <strong>of</strong> Business Venturing 18,3: 301-<br />
331.<br />
De Heer, JA 2001. The Challenge <strong>of</strong> Networking in Small and Medium<br />
Dized Firms: Internationalisation on Terms <strong>of</strong> Social Capital. Paper<br />
presented at the Turku School <strong>of</strong> Economics and Business<br />
Administration, Department <strong>of</strong> Marketing, Turku, Finland, 29 May<br />
2001.<br />
Dean, JS, S Holmes & S Smith 1997. Understanding Business Networks:<br />
Evidence from the Manufacturing and Service Sectors in Australia.<br />
<strong>Journal</strong> <strong>of</strong> Small Business Management 35,1: 78-84.<br />
Edmonds, JJ 2005. The Potential Impact <strong>of</strong> Entrepreneurial Networks on the<br />
Success <strong>of</strong> SME’s: An Exploratory Study. Unpublished B. Com<br />
Honours Dissertation. <strong>University</strong> <strong>of</strong> <strong>KwaZulu</strong>-<strong>Natal</strong>, Pietermaritzburg<br />
Campus.<br />
Goudis, A & D Skuras 2000. Conceptual Paper: Business Networks.<br />
ASPIRE, Department <strong>of</strong> Economics, <strong>University</strong> <strong>of</strong> Patras, pages1-35.<br />
Hitt, MA, RD Ireland, SM Camp & DL Sexton (eds) 2002. Strategic<br />
Entrepreneurship: Integrating Entrepreneurial and Strategic<br />
Management Perspectives. Oxford, United Kingdom: Blackwell<br />
Publishers.<br />
Hoang, H & B Antocic 2003. Network-based Research in Entrepreneurship:<br />
A Critical Review. <strong>Journal</strong> <strong>of</strong> Business Venturing 18,2: 165-187.<br />
144
… Impact <strong>of</strong> Entrepreneurial Networking on Small Business Success<br />
Human, SE & KG Provan 1997. An Emergent Theory <strong>of</strong> Structure and<br />
Outcomes in Small Firm Strategic Networks. Academy <strong>of</strong> Management<br />
<strong>Journal</strong> 40,2: 368-403.<br />
Jenssen, JI & A Greve 2002. Does the Degree <strong>of</strong> Redundancy in Social<br />
Networks Influence the Success <strong>of</strong> Business Start-ups? International<br />
<strong>Journal</strong> <strong>of</strong> Entrepreneurial Behaviour and Research 8,5: 254-267.<br />
Kotler, P, G Armstrong, J Saunders & V Wong 2002. Principles <strong>of</strong><br />
Marketing. Third European Edition. Harlow, United Kingdom: FT<br />
Prentice Hall.<br />
Kristiansen, S 2004. Social Networks and Business Success: The Role <strong>of</strong><br />
Subcultures in an African Context. The American <strong>Journal</strong> <strong>of</strong> Economics<br />
and Sociology 63,5: 1149-1171.<br />
McEvily, B & A Zaheer 1999. Bridging Ties: A Source <strong>of</strong> Firm<br />
Heterogeneity in Competitive Capabilities. Strategic Management<br />
<strong>Journal</strong> 20,12: 1133-1156.<br />
Neergaard, H, AV Denmark, E Shaw & S Carter 2005. The Impact <strong>of</strong><br />
Gender, Social Capital and Networks on Business Ownership: A<br />
Research Agenda. International <strong>Journal</strong> <strong>of</strong> Entrepreneurial Behaviour<br />
and Research 11,5: 338-357.<br />
Nieman, G, J Hough & C Niewenhuizen 2003. Entrepreneurship: A South<br />
African Perspective. Pretoria: Van Schaik Publishers.<br />
Nobria, N & RG Eccles 1992. Networks and Organizations. New York:<br />
Harvard Business School Press.<br />
O’Neill,C, S Soni, D Coldwell & J Edmonds 2007. Towards a Testable<br />
Model <strong>of</strong> the Impact <strong>of</strong> Specific Entrepreneurial Networks on the<br />
Success <strong>of</strong> Businesses in the Pietermaritzburg Region. <strong>Alternation</strong> 14,1:<br />
8-33.<br />
Obiri, NM 2003. Is a Market-led Approach Crucial to Art and Craft Small<br />
and Micro Enterprises Growth and Sustainability in the <strong>KwaZulu</strong>-<strong>Natal</strong><br />
Midlands? Unpublished M. Com. Dissertation, <strong>University</strong> <strong>of</strong> <strong>Natal</strong>,<br />
Pietermaritzburg.<br />
Ostgaard, TA & S Birley 1994. Personal Networks and Firms’ Competitive<br />
Strategy- A Strategic or Coincidental Match? <strong>Journal</strong> <strong>of</strong> Business<br />
Venturing 9,4: 281-305.<br />
Powell, WW 1990. Neither Markets nor Hierarchy: Network Forms <strong>of</strong><br />
Organisation. Research in Organisational Behaviour 12: 295-336.<br />
145
Charles O’Neill & Sanjay Soni<br />
Premaratne, SP 2002. Entrepreneurial Networks and Small Business<br />
Development: The Case <strong>of</strong> Small Enterprises in Sri Lanka. Unpublished<br />
PhD Thesis.<br />
Ramachandran, K & S Ramanarayan 1993. Entrepreneurial Orientation and<br />
Networking: Some Indian Evidence. <strong>Journal</strong> <strong>of</strong> Business Venturing 8,6:<br />
513-524.<br />
Republic <strong>of</strong> South Africa. 2006. National Strategy for Fostering<br />
Entrepreneurship Study. Code A.1.005. Pretoria: Department <strong>of</strong> Trade<br />
and Development.<br />
Sandberg, W & J Logan 1997. Small Firms’ Competitive Strategies and<br />
Firms’ Reliance on Resources Acquired through Networks. Paper<br />
presented at the USASBE Annual National Entrepreneurship<br />
Conference: the engine <strong>of</strong> global economic development. San Francisco,<br />
California, 21-24 June 1997.<br />
Scarborough, NM & TW Zimmerer 2003. Effective Small Business<br />
Management: an Entrepreneurial Approach. 7 th Edition. Upper Saddle<br />
River: Prentice Hall.<br />
Shane, S & S Venkataraman 2000. The Promise <strong>of</strong> Entrepreneurship as a<br />
Field <strong>of</strong> Research. Academy <strong>of</strong> Management Review 26,1: 17-13.<br />
Singh, RP, GE Hills & GT Lumpkin 1999. New Venture Ideas and<br />
Entrepreneurial Opportunities: Understanding the Process <strong>of</strong><br />
Opportunity Recognition. 13th Annual Conference <strong>of</strong> the United States<br />
Association for Small Business and Entrepreneurship (USASBE), San<br />
Diego, California.<br />
Starr, JA & IC Mac Millan 1990. Resource Cooptation via Social<br />
Contracting: Resource Acquisition Strategies for New Ventures.<br />
Strategic Management <strong>Journal</strong> 11,1: 79-92.<br />
Taylor, DW, O Jones & K Boles 2004. Building Social Capital through<br />
Action Learning: An Insight into the Entrepreneur. Education and<br />
Training 46,5: 226-235.<br />
Tsai, W & S Ghoshal 1998. Social Capital and Value Creation. Academy <strong>of</strong><br />
Management <strong>Journal</strong> 41,4: 464-476.<br />
Zafirovski, M 1999. Economic Sociology in Retrospect and Prospect: In<br />
Search <strong>of</strong> its Identity within Economics and Sociology. American<br />
<strong>Journal</strong> <strong>of</strong> Economics and Sociology 58,4: 583-628.<br />
146
… Impact <strong>of</strong> Entrepreneurial Networking on Small Business Success<br />
147<br />
Charles O’Neill<br />
School <strong>of</strong> Management<br />
Faculty <strong>of</strong> Management Studies<br />
<strong>University</strong> <strong>of</strong> <strong>KwaZulu</strong>-<strong>Natal</strong><br />
charles.oneill@bue.edu.eg<br />
Sanjay Soni<br />
School <strong>of</strong> Management<br />
Faculty <strong>of</strong> Management Studies<br />
<strong>University</strong> <strong>of</strong> <strong>KwaZulu</strong>-<strong>Natal</strong><br />
Soni@ukzn.ac.za
The Effect <strong>of</strong> Transaction Characteristics on the<br />
Market Response to Black Economic<br />
Empowerment Transactions<br />
Barry Strydom<br />
Andrew Christison<br />
Joao Matias<br />
Abstract<br />
Previous studies have found that the announcement <strong>of</strong> Black Economic<br />
Empowerment (BEE) transactions elicits a positive market reaction but<br />
recently Strydom, Christison and Matias (2009) found that the positive<br />
reaction to the announcement <strong>of</strong> BEE transactions is not universal. This<br />
paper uses an event study approach to investigate the type <strong>of</strong> BEE<br />
transaction and the size <strong>of</strong> stake acquired as two possible explanations for<br />
differing market reactions to BEE transactions. Evidence <strong>of</strong> a positive<br />
reaction to the announcement <strong>of</strong> Joint Ventures is found but not to<br />
Acquisitions or Strategic Alliances. When Acquisitions are analysed by size<br />
<strong>of</strong> stake acquired, however, a positive response to the acquisition <strong>of</strong> a<br />
controlling interest is found but acquisitions <strong>of</strong> a 100% stake are found to<br />
elicit a negative market reaction. Transaction characteristics are thus found<br />
to have an impact on the market response to BEE transactions.<br />
Keywords: Black Economic Empowerment, Firm Valuation, Shareholder<br />
Wealth, Event Study, Abnormal Returns, Fisher’s Separation Theorem.<br />
Acknowledgements<br />
An earlier version <strong>of</strong> this paper was presented at the Business Management<br />
2009 Conference at the <strong>University</strong> <strong>of</strong> <strong>KwaZulu</strong>-<strong>Natal</strong>, Westville Campus.<br />
<strong>Alternation</strong> Special Edition 4 (2011) 148 – 165<br />
ISSN 1023-1757<br />
148
Transaction Characteristics, Market Response & BEE Transactions<br />
Introduction<br />
The social and political imperative <strong>of</strong> Black Economic Empowerment (BEE)<br />
has resulted in companies on the Johannesburg Stock Exchange (JSE)<br />
having to undertake major corporate restructuring in order to facilitate the<br />
transfer <strong>of</strong> sizable ownership proportions from existing shareholders to new<br />
black shareholders. In addition, especially in the initial wave <strong>of</strong> BEE<br />
transactions, firms had to adopt innovative financing arrangements to enable<br />
the purchase <strong>of</strong> shares by BEE role-players with little or no capital <strong>of</strong> their<br />
own <strong>of</strong>ten having to provide BEE partners with the capital to finance the<br />
purchase <strong>of</strong> their own shares (Ross, Westerfield, Jordan & Firer 2001:<br />
649).<br />
Financial theory holds that the goal <strong>of</strong> a firm is to maximize the<br />
wealth <strong>of</strong> the owners for whom it is being operated (Gitman 2009: 15). It<br />
follows, therefore, that the only financial justification for corporate<br />
restructuring is if it results in a higher share value (Ross, Westerfield & Jaffe<br />
2002: 815). However, Fisher’s Separation Theorem shows that the value <strong>of</strong> a<br />
firm is solely a product <strong>of</strong> its investment opportunities, how a firm is<br />
financed and who owns it should, therefore, have no impact on the value <strong>of</strong><br />
the firm (Copeland, Weston & Shastri 2005: 18-19).<br />
In general then, theory suggests that changing the ownership <strong>of</strong> a<br />
firm should have no impact on its value and as a result one should find that<br />
share prices do not respond to the announcement <strong>of</strong> BEE transactions.<br />
Further, if such a transaction is interpreted by the market as a signal that<br />
management are pursuing a costly strategy which will not result in greater<br />
revenues or lower risk then it may even result in a decrease in the share<br />
price. To date only three studies (Jackson, Alessandri & Black 2005;<br />
Wolmarans & Sartorius 2009; Strydom, Christison & Matias 2009) have<br />
attempted to empirically test the market reaction to the announcement <strong>of</strong><br />
BEE transactions. All three studies employed an event study methodology<br />
and all three found that BEE transactions were associated with a positive<br />
abnormal return indicating a favourable market reaction.<br />
Strydom et al. (2009: 75), however, also found that the positive<br />
reaction to announcements <strong>of</strong> BEE transactions is not universal and appears<br />
to be restricted to a relatively small portion <strong>of</strong> the overall sample. In<br />
addition, some <strong>of</strong> the individual firms exhibited negative reactions to BEE<br />
transactions suggesting that the nature <strong>of</strong> the market reaction to BEE<br />
149
Barry Strydom, Andrew Christison & Joao Matias<br />
transactions may be related to firm specific and/or transaction specific<br />
characteristics. The purpose <strong>of</strong> this paper, therefore, is to examine the<br />
relationship between the market reaction to the announcement <strong>of</strong> BEE<br />
transactions and the nature and size <strong>of</strong> the transaction. The paper is<br />
organized as follows. In the literature review the concept <strong>of</strong> Black Economic<br />
Empowerment and empirical evidence regarding stock market reactions to<br />
BEE transactions is examined. Following this, the research problem and<br />
objectives are developed and the methodology to be employed is described.<br />
The empirical results are then presented and in conclusion the results are<br />
interpreted and recommendations are made.<br />
Literature Survey<br />
Defining BEE<br />
The Black Empowerment Commission defined BEE 1<br />
as ‘An integrated and<br />
coherent socio-economic process within the context <strong>of</strong> the national<br />
transformation programme, which is aimed at redressing the imbalances <strong>of</strong><br />
the past by substantially and fairly transferring the ownership, management<br />
and control <strong>of</strong> South Africa’s financial and economic resources to the<br />
majority <strong>of</strong> its citizens’ (BEECom 2002: 4). Similarly, the South African<br />
government defined BEE as an integrated and coherent socio-economic<br />
process that directly contributes to the economic transformation <strong>of</strong> South<br />
Africa and brings about significant increases in the numbers <strong>of</strong> black people<br />
that manage, own and control the country’s economy, as well as significant<br />
decreases in income inequalities (DTI 2003: 12).<br />
It is evident from the above definitions that the concept <strong>of</strong> BEE is<br />
broad and refers to any economic activity that leads to the empowerment <strong>of</strong><br />
black South Africans. For the purpose <strong>of</strong> this study, therefore, the authors<br />
1 Since 2007 the term Broad-Based Black Economic Empowerment<br />
(BBBEE) has replaced that <strong>of</strong> BBE. BBBEE focuses on distributing wealth<br />
across a broad spectrum <strong>of</strong> black South Africans while BEE had a narrower<br />
focus on equity ownership and management representation regardless <strong>of</strong> the<br />
number <strong>of</strong> beneficiaries. Since the sample employed in this study covers<br />
transactions between 1996 and 2006 the term BEE more accurately<br />
describes the transactions involved and is thus retained.<br />
150
Transaction Characteristics, Market Response & BEE Transactions<br />
will focus on a narrower definition <strong>of</strong> BEE transactions that the government<br />
defined as:<br />
• All transactions for the acquisition, by black people, <strong>of</strong> direct<br />
ownership in an existing or new entity (other than a SME) in the<br />
financial or any other sectors <strong>of</strong> the economy; and<br />
• Joint ventures with debt financing or, or any other form <strong>of</strong> credit<br />
extension to, and equity investments in BEE companies (other than<br />
SMEs) (Republic <strong>of</strong> South Africa 2007: 5).<br />
Benefits <strong>of</strong> BEE Transactions<br />
As with any other form <strong>of</strong> corporate restructuring, a BEE transaction should<br />
only result in an increase in share value if it is perceived by the market to be<br />
a positive NPV undertaking; in other words it must either result in increased<br />
future cash flows to the firm (whose present value is greater than the cost <strong>of</strong><br />
the BEE transaction) or a lower cost <strong>of</strong> capital. In the case <strong>of</strong> joint ventures<br />
and strategic alliances the normal synergistic benefits normally associated<br />
with such an undertaking would potentially be on <strong>of</strong>fer. For BEE<br />
transactions, a specific potential benefit on <strong>of</strong>fer is that <strong>of</strong> revenue<br />
enhancement. Ross et al. (2001: 653) indicate that corporate combinations<br />
may result in strategic benefits that allow the combined firm to generate<br />
greater revenues.<br />
In the case <strong>of</strong> BEE legislation, being BEE compliant can result in<br />
preferential procurement, concessions, licenses and financial support from<br />
state owned enterprises (Marais & Coetzee 2006a: 121). BEE scorecards,<br />
critical in obtaining lucrative government contracts, reward firms for<br />
contracting with BEE firms and so there is also a direct financial incentive<br />
for firms not dealing directly with government to be BEE compliant if they<br />
want to do business with firms seeking government tenders. For this reason,<br />
any firms wanting to do business in South Africa should consider becoming<br />
BEE compliant (Araujo, Denenga & Milovanovic 2007: 41).<br />
Surprisingly, Sartorius and Botha (2008: 443), reporting on a survey<br />
<strong>of</strong> 72 JSE-listed companies regarding BEE, found that the foremost reason<br />
given for engaging in BEE transactions was that BEE is essential for South<br />
Africa to sustain its economic and democratic structures. This suggests that<br />
maximising shareholder wealth is not the prime motivation for BEE<br />
151
Barry Strydom, Andrew Christison & Joao Matias<br />
transactions. Examining the full range <strong>of</strong> responses contained in Table 1,<br />
however, shows a number <strong>of</strong> reasons given that relate to financial benefits.<br />
32 firms saw it as an opportunity to grow their business and market share, 23<br />
believed that they would lose market share if they did not implement BEE, 7<br />
saw an advantage in being the leading BEE firm in their industry, 7 reported<br />
that their customers required the company to have BEE credentials, 7 used it<br />
to raise finance and 5 companies indicated that they were required by<br />
Government procurement to comply with BEE requirements (Sartorius &<br />
Botha 2008: 443).<br />
Table 1: Reasons for implementing BEE ownership initiatives<br />
Source: Sartorius and Botha (2008: 443).<br />
Previous Studies<br />
Jackson, Alessandri and Black (2005)<br />
The first study to empirically test the market reaction <strong>of</strong> the JSE to BEE<br />
transactions was that <strong>of</strong> Jackson et al. (2005: 13) who used data from the<br />
BusinessMap Black Empowerment Database to identify BEE transactions.<br />
They identified a potential sample <strong>of</strong> 208 BEE deals between 1996 and 1998<br />
but after applying several data filters they were left with a sample <strong>of</strong> only 20<br />
transactions. They employed a standard event-study methodology using the<br />
152
Transaction Characteristics, Market Response & BEE Transactions<br />
market model to calculate abnormal return and found that on average the<br />
announcement <strong>of</strong> a BEE transaction resulted in a significant positive<br />
cumulative abnormal return (CAR) <strong>of</strong> 0.013 for the 3-day event window and<br />
a 0.018 CAR for the 5-day event window which were found, using a Z<br />
statistic, to be significantly different from zero at the five percent level<br />
(Jackson et al. 2005: 19). Jackson et al. (2005: 16) then conducted univariate<br />
regressions on the CARs against the percentage <strong>of</strong> equity purchased by the<br />
BEE group, a dummy variable indicating if the BEE group was a union, the<br />
size <strong>of</strong> the discount in the BEE transaction, the size <strong>of</strong> the transaction in<br />
Rand, and a dummy variable showing the industry <strong>of</strong> the firm. They found<br />
that there was a significant positive relationship between the size <strong>of</strong> the<br />
stake acquired and the CAR <strong>of</strong> the transaction. The other independent<br />
variables (namely UNION, DISCOUNT and VALUE), however, were found<br />
to not have significant coefficients associated with them (Jackson et al.<br />
2005: 19). In addition, Jackson et al. (2005: 20) found no relationship<br />
between CARs and the industries represented in their sample or with the<br />
financing method (debt or equity) used by the BEE group.<br />
Wolmarans and Sartorius (2009)<br />
Wolmarans and Sartorius (2009: 185) used a data set comprising 125 BEE<br />
transactions for 95 companies between January 2002 and July 2006. It is<br />
worth noting that their sample period does not overlap with that <strong>of</strong> the<br />
Jackson et al. study. Following Jackson et al. they calculated both a threeday<br />
CAR and a five-day CAR. They found a significant positive CAR for the<br />
three-day event window <strong>of</strong> 0.0115. The five-day CAR <strong>of</strong> 0.0091, however,<br />
was found to not be significant at the five percent level (Wolmarans &<br />
Sartorius 2009: 187).<br />
Wolmarans and Sartorius (2009: 187) then employed an analysis <strong>of</strong><br />
variance to test whether or not the year <strong>of</strong> the transaction and the type <strong>of</strong><br />
transaction were significant in determining the CARs. Types <strong>of</strong> transaction<br />
investigated were: a) the selling <strong>of</strong> equity to a BEE company; b) the<br />
acquisition <strong>of</strong> a stake in a BEE firm; c) other BEE transactions such as<br />
partnerships or joint ventures. The year <strong>of</strong> announcement was found to have<br />
a significant positive relationship with the three-day CAR but further<br />
investigation found that only 2006 had a significant positive CAR indicating<br />
153
Barry Strydom, Andrew Christison & Joao Matias<br />
that this effect was restricted to only the one year (Wolmarans & Sartorius<br />
2009: 188). Wolmarans and Sartorius (2009: 187) also found that the type <strong>of</strong><br />
transaction had no impact on the CARs observed.<br />
Strydom, Christison and Matias (2009)<br />
Similarly to the previous two studies, Strydom et al. (2009: 70, 73)<br />
employed an event study approach to evaluate the CAR associated with BEE<br />
transactions for the period 1996 to 2006, totalling 254 transactions. This<br />
study thus employed both the longest sample period <strong>of</strong> the three studies (the<br />
period examined includes both the early study <strong>of</strong> Jackson et al. and the later<br />
study <strong>of</strong> Wolmarans and Sartorius) and the largest sample size. Strydom et<br />
al. (2009: 73) found a cumulative average abnormal return (CAAR) <strong>of</strong><br />
0.0159 for the sample but this result was not significant at the five percent<br />
level. The average abnormal return (AAR) on the announcement day,<br />
however, was 0.00836 and was significant at the five percent level indicating<br />
that positive same-day abnormal returns are associated with the<br />
announcement <strong>of</strong> BEE transactions.<br />
Of the 254 transactions included in the sample, however, only 25<br />
resulted in statistically significant CARs and only 15 <strong>of</strong> these were positive<br />
with the remaining 10 being negative. Similarly, only 33 transactions led to<br />
statistically significant announcement-day abnormal returns (AR), 22 <strong>of</strong><br />
which were positive and the other 11 were positive. Further, only 9<br />
transactions were found to have both statistically significant CARs and ARs<br />
(Strydom et al. 2009: 74).<br />
Data and Methodology<br />
Research Problem and Objectives<br />
Whilst all three studies discussed above found a positive reaction to the<br />
announcement <strong>of</strong> BEE transactions it was also evident that the positive<br />
market response was not universal, in fact in the Strydom et al. (2009) study<br />
a number <strong>of</strong> transactions were found to display a negative market reaction!<br />
Little is understood as yet, however, regarding what the determinants might<br />
be that affect the size and nature <strong>of</strong> the market’s reaction to the<br />
announcement <strong>of</strong> a BEE transaction. The question that this paper seeks to<br />
154
Transaction Characteristics, Market Response & BEE Transactions<br />
address, therefore, is to what extent the size and nature <strong>of</strong> a BEE transaction<br />
are related to positive returns to shareholders. Specifically the authors<br />
investigate the following questions:<br />
a) Is there a relationship between the type <strong>of</strong> transaction and the<br />
magnitude and direction <strong>of</strong> abnormal returns surrounding the<br />
announcement <strong>of</strong> a BEE transaction?<br />
b) In the case <strong>of</strong> acquisitions, does the size <strong>of</strong> the stake acquired affect<br />
the magnitude and direction <strong>of</strong> abnormal returns surrounding the<br />
announcement <strong>of</strong> the transaction?<br />
Research Methodology<br />
This study extends the previous work <strong>of</strong> Strydom et al. (2009) and employs<br />
the same data set and event study methodology to generate the abnormal<br />
returns. The method involves measuring the difference between the actual<br />
returns on a share during a relevant time period (the ‘event window’), and<br />
the ‘normal’ returns expected based on some pricing model (Campbell, Lo &<br />
MacKinlay 1997: 149-152). For a given event, the presence <strong>of</strong> statistically<br />
significant cumulative average abnormal returns (CAAR) across all firms,<br />
for a given event window, would then signify that the event studied has a<br />
significant impact on share price. It is also possible to test for the<br />
abnormality <strong>of</strong> returns in respect <strong>of</strong> a particular day in the event window,<br />
either in respect <strong>of</strong> the sample as a whole (one-day average abnormal return<br />
(AAR) or a particular sub-sample.<br />
In order to address research question (a), the authors construct three<br />
different samples <strong>of</strong> firms undertaking the following types <strong>of</strong> BEE<br />
transaction: acquisitions; joint ventures and strategic alliances. They also<br />
examine both the CAARs over the event window and the announcement day<br />
AARs for the different types <strong>of</strong> transaction, and test the statistical<br />
significance <strong>of</strong> these measures.<br />
Similarly, in order to address research question (b), the authors<br />
classify firms that undertook BEE acquisitions into different samples based<br />
on the size <strong>of</strong> the ownership stake acquired. The following categories were<br />
used:<br />
155
Barry Strydom, Andrew Christison & Joao Matias<br />
Table 2: Classification <strong>of</strong> BEE Acquisitions by size <strong>of</strong> stake<br />
Category Size <strong>of</strong> ownership stake acquired<br />
Minor Below 10%<br />
Substantial 10% to less than 35%<br />
Controlling 2<br />
35% to 50%<br />
Majority More than 50% to less than 100%<br />
Outright 100%<br />
We then calculate and test the statistical significance <strong>of</strong> the CAARs<br />
and announcement day AARs for each category.<br />
Return Estimation<br />
The study employs the market model to estimate the expected or normal<br />
returns for each share. The market model was preferred to other economic<br />
models such as the Capital Asset Pricing Model and Arbitrage Pricing<br />
Model because <strong>of</strong> their reliance on assumptions that may influence the<br />
results <strong>of</strong> the event study (MacKinlay 1997: 19). The market model assumes<br />
a stable linear relationship between the market return and the security return<br />
(Dasgupta, Laplante & Mamingi 1997: 12):<br />
Rit = β1i + β2iRmt + uit (1)<br />
Here, Rit is the return on security i during period t; β1i is the<br />
intercept; β2i is the slope coefficient; Rmt is the return on the market portfolio<br />
proxy (JSE All Share Index) during period t and uit is the error term for<br />
security i, representing the random component <strong>of</strong> Rit not explained by<br />
movements in Rmt. By assumption, E(uit) = 0 and Var (uit) = σ 2 ui. Therefore,<br />
the authors estimate the model Rit(β) over an estimation window <strong>of</strong> 205<br />
days, and calculate the normal return, Rit * , as:<br />
2 In terms <strong>of</strong> the Takeover Code introduced under the Companies Act 61 <strong>of</strong><br />
1973, the acquisition <strong>of</strong> a 35% ownership stake is deemed to be the<br />
acquisition <strong>of</strong> a controlling interest.<br />
156
Transaction Characteristics, Market Response & BEE Transactions<br />
Rit * = β1i + β2iRmt (2)<br />
Abnormal returns are measured using an event window that covers<br />
the period from 5 days prior to the announcement to 5 days after the<br />
announcement – a total <strong>of</strong> 11 days. The abnormal return, ARit, is the actual<br />
return (Rit) <strong>of</strong> the security for some day t in the event window minus the<br />
predicted normal return (Rit * ):<br />
ARit = Rit –Rit * = Rit – β1i – β2i Rmt (3)<br />
The average abnormal return for some day t (AARt) is the average <strong>of</strong><br />
all the abnormal returns <strong>of</strong> the securities in the sample for that day:<br />
AARt = Σ Ν ARit / N (4)<br />
The cumulative average abnormal return is the sum <strong>of</strong> the average<br />
abnormal returns <strong>of</strong> all securities in the sample over the course <strong>of</strong> the event<br />
window, which as stated above, lasts 11 days – that is, defining t = T as the<br />
announcement date, from t = T-5 to t = T+5:<br />
CAAR = Σt AARt for t = T-5, …, T+5 (5)<br />
Constructing Test Statistics<br />
To test the statistical significance <strong>of</strong> the CAARs and announcement day<br />
AARs estimated for each sample, the authors use a z-statistic defined:<br />
z = r / s(r), (6)<br />
where s(r) is the sample standard deviation <strong>of</strong> the estimated return r.<br />
Although the use <strong>of</strong> a sample standard deviation would suggest use<br />
<strong>of</strong> t-statistics, the measurement window used to calculate the sample<br />
standard deviation has a large number <strong>of</strong> observations (205 days). This has<br />
the result that t-statistics would approximately follow the standard normal<br />
distribution, or more precisely, follow a t-distribution with such a large<br />
number <strong>of</strong> degrees <strong>of</strong> freedom that it converges with the standard normal<br />
distribution. Therefore, it makes sense to use a z-statistic.<br />
157
Barry Strydom, Andrew Christison & Joao Matias<br />
In respect <strong>of</strong> the average abnormal return across the sample for some<br />
day, t, in the event window, the test statistic is defined as:<br />
zAAR = AARt / s(AAR) (7)<br />
In this case, s(AARt) requires the estimation <strong>of</strong> average abnormal<br />
returns for each day in the estimation window, to give a sense <strong>of</strong> the level <strong>of</strong><br />
non-systematic variation in the sample’s average returns under normal<br />
trading conditions:<br />
s(AAR) = [(1/204)Σt (AARt – E(AAR)) 2 ] 1/2 , (8)<br />
E(AAR) = (1/205)Σt AARt, (9)<br />
t = 1, …, 205<br />
The test statistic for the cumulative average abnormal return for the<br />
sample is defined as:<br />
where<br />
zCAAR = CAAR / s(CAAR) (10)<br />
s(CAAR) = s(AAR)(11 1/2 )<br />
The standard deviation <strong>of</strong> the cumulative abnormal return is simply<br />
the standard deviation <strong>of</strong> a security’s one-day abnormal return, scaled up for<br />
the length <strong>of</strong> the event window, which in this study is 11 days (Weston,<br />
Mitchell & Mulherin 2004: 167):<br />
To determine whether an abnormal return is statistically<br />
significantly different from zero, the test statistic is compared against the<br />
five and ten per cent significance level two-tailed critical values from the<br />
standard normal distribution, ± 1.96 and ± 1.64 respectively.<br />
Data and Sample Selection<br />
This paper employs the same data set as the Strydom et al. (2009) paper.<br />
The data concerning BEE transactions for this study were obtained from the<br />
BusinessMap Foundation and the Ernst & Young annual reviews <strong>of</strong> Merger<br />
and Acquisition Activity. The data included all the BEE transactions for the<br />
period 1996 to 2006, as well as the details for each transaction including the<br />
parties involved, the announcement date, and payment terms. Daily share<br />
price data was obtained from the McGregors BFA database. The initial data<br />
158
Transaction Characteristics, Market Response & BEE Transactions<br />
set contained information on 1,195 BEE transactions. After applying several<br />
restrictions (see Strydom et al. 2009: 73) a final sample <strong>of</strong> 249 BEE<br />
transactions was left for research question (a) and 160 BEE acquisitions for<br />
research question (b).<br />
Empirical Results<br />
For research question (a) the difference in market reaction between types <strong>of</strong><br />
BEE transactions was examined. It is evident from Table 3 that acquisitions<br />
dominated the sample <strong>of</strong> BEE transactions. The announcement day AAR<br />
was 0.00698 indicating a positive reaction to the announcement <strong>of</strong><br />
acquisitions but the result was not statistically significant at either the five<br />
percent or ten percent levels. The CAAR over the event window was also<br />
positive at 0.01788 but again this result was not statistically significant.<br />
Joint Ventures, on the other hand, were found to have a statistically<br />
significant (at the five per cent level) positive AAR <strong>of</strong> 0.01579. The CAAR<br />
for Joint Ventures was 0.01846 but was not statistically significant. These<br />
results would seem to suggest that the market responded more positively to<br />
the announcement <strong>of</strong> Joint Ventures than <strong>of</strong> Acquisitions. Such a finding<br />
would be in keeping with Fisher’s Separation Theorem which holds that the<br />
value <strong>of</strong> a firm is not a function <strong>of</strong> who owns it. In contrast, if Joint Ventures<br />
involve the cooperation <strong>of</strong> two firms to exploit mutually beneficial<br />
opportunities then it follows that the market should react positively to the<br />
announcement <strong>of</strong> such a transaction.<br />
Table 3: Tests <strong>of</strong> significance for transactions by type <strong>of</strong> transaction<br />
Acquisition<br />
Joint<br />
Venture<br />
Strategic<br />
Alliance<br />
No. <strong>of</strong><br />
Transactions<br />
Announc.<br />
Day<br />
AAR<br />
σAAR z-stat. CAAR σCAAR z-stat.<br />
192 0.00698 0.00524 1.3319 0.01788 0.0174 1.0278<br />
48 0.01579 0.00647 2.4398 0.01846 0.02147 0.85997<br />
9 0.00285 0.01054 0.2704 -0.00713 0.03497 -0.2039<br />
Research question (b) involved testing whether or not the size <strong>of</strong> the<br />
stake taken in a BEE transaction had an impact on the market’s reaction to<br />
159
Barry Strydom, Andrew Christison & Joao Matias<br />
the announcement <strong>of</strong> the transaction. Table 4 presents the results and tests <strong>of</strong><br />
significance by size <strong>of</strong> stake.<br />
While the results for the full sample <strong>of</strong> acquisitions reported in Table<br />
3 indicates that acquisitions do not appear to impact on the acquiring firm’s<br />
value, when the market reaction to acquisitions is analysed by size <strong>of</strong> stake,<br />
it becomes apparent that BEE acquisitions do have implications for<br />
shareholder value.<br />
Table 4: Tests <strong>of</strong> significance for transactions by size <strong>of</strong> ownership stake<br />
acquired<br />
No. <strong>of</strong><br />
Transactions<br />
Below<br />
10% 8<br />
10% to<br />
35% 7<br />
35% to<br />
50% 7<br />
50.1% to<br />
Transaction Characteristics, Market Response & BEE Transactions<br />
overestimated by the management <strong>of</strong> the acquiring firm leading them to pay<br />
more for the target firm than it is worth as the promised benefits fail to<br />
materialise in reality (Damodaran 1997: 687).<br />
With respect to partial acquisitions, only acquired stakes ranging from<br />
35% to 50% exhibited a statistically significant announcement day AAR (at<br />
the five percent level) and CAAR (at the ten per cent level), in both cases<br />
positive. In addition, the announcement day AARs for other partial<br />
acquisitions were all positive and in two cases are almost statistically<br />
significant at the ten percent level. Ins<strong>of</strong>ar as the CAARs for the other partial<br />
acquisitions are concerned, none <strong>of</strong> these are statistically different from<br />
zero.<br />
Conclusion<br />
In a previous paper (reported in Strydom et al. 2009), the authors found<br />
some evidence for the period 1996 to 2006 <strong>of</strong> a positive market response to<br />
the announcement <strong>of</strong> BEE transactions, particularly on the announcement<br />
date. This finding is in line with the studies by Jackson et al. (2005) and<br />
Wolmarans and Sartorius (2009) who reported a statistically significant<br />
positive CAAR associated with the announcement <strong>of</strong> BEE transactions. The<br />
Strydom et al. (2009) study however, using a larger sample covering a<br />
longer time period, while reporting a positive CAAR across the sample did<br />
not find that the relationship was statistically significant. In addition, it was<br />
found that the positive reaction to announcements <strong>of</strong> BEE transactions was<br />
not universal, appears to be restricted to a relatively small portion <strong>of</strong> the<br />
overall sample, and in some instances is negative. The implication <strong>of</strong> these<br />
findings is that a positive market response to the announcement <strong>of</strong> a BEE<br />
transaction is not guaranteed but rather depends on specific characteristics <strong>of</strong><br />
the transaction or <strong>of</strong> the firms engaging in the transaction. In this study, we<br />
therefore set out to investigate the relationship between the market reaction<br />
to the announcement <strong>of</strong> BEE transactions and the type <strong>of</strong> BEE transaction<br />
and the size <strong>of</strong> the stake acquired in a BEE acquisition.<br />
The authors found that while it appears that acquisitions and strategic<br />
alliances do not impact on shareholder value, joint ventures appear to<br />
induce a positive market response on the day the transaction is announced.<br />
However, in keeping with the findings <strong>of</strong> Wolmarans and Sartorius (2009),<br />
161
Barry Strydom, Andrew Christison & Joao Matias<br />
there is no evidence that any type <strong>of</strong> BEE transaction returns a statistically<br />
significant CAAR. This finding is in keeping with Fisher’s Separation<br />
Theorem that states that the value <strong>of</strong> a firm is determined by its investment<br />
opportunities, not by whom owns it. If all a BEE transaction achieves is a<br />
change in ownership then it is entirely in keeping with financial theory that<br />
there should not be a significant market reaction to the announcement <strong>of</strong> a<br />
BEE transaction. Similarly, the finding that the market reacts more<br />
favourably to the announcement <strong>of</strong> Joint Ventures than to Acquisitions is not<br />
surprising. Assuming that the market is reasonably efficient and that share<br />
acquisitions do not occur at a substantial discount or premium then the Net<br />
Present Value <strong>of</strong> a share acquisition should be zero. If firms engaging in a<br />
BEE acquisition pay fair value for the stake that they are acquiring the<br />
transaction should not have a significant impact on the overall value <strong>of</strong><br />
either party.<br />
The above result, however, is based on measuring the CAAR across<br />
the entire sample <strong>of</strong> BEE transactions. When we look at the size <strong>of</strong> stakes<br />
acquired in BEE transactions, we find a more nuanced picture with some<br />
evidence <strong>of</strong> a market response depending on the size <strong>of</strong> the stake acquired.<br />
Most notably, while we find some evidence <strong>of</strong> a positive market reaction to<br />
the acquisition <strong>of</strong> a partial stake, this effect is most evident for the<br />
acquisition <strong>of</strong> a controlling interest between 35 to 50%, we find that the<br />
announcement <strong>of</strong> outright acquisitions is significantly associated with a<br />
negative market reaction. This result would suggest that in general the<br />
market believes that the potential benefits <strong>of</strong> an outright acquisition do not<br />
outweigh the greater costs associated with such a transaction.<br />
Unlike Jackson et al. (2005), we did not find evidence <strong>of</strong> a clearly<br />
positive relationship between abnormal returns and the size <strong>of</strong> ownership<br />
stake but this may partly be a result <strong>of</strong> the research design, which divided<br />
acquisitions into discrete categories based on the materiality <strong>of</strong> the<br />
acquisitions whilst they employed a univariate regression. This suggests that<br />
if this relationship is to be estimated econometrically, a non-linear<br />
specification might be more appropriate than the linear specification they<br />
used. This represents an opportunity for further investigation. In addition,<br />
our results indicate the danger <strong>of</strong> studying the effects <strong>of</strong> BEE transactions in<br />
a collective manner. It is evident from our results that the market responds<br />
differently to different types <strong>of</strong> BEE transactions, although at this stage there<br />
162
Transaction Characteristics, Market Response & BEE Transactions<br />
is still much that is not understood concerning the various factors that<br />
determine the nature and extent <strong>of</strong> the market reaction. Pursuing these<br />
interactions in greater detail remains a productive area for further<br />
research.<br />
While the evidence presented in this study does not produce<br />
unequivocal results regarding the statistical significance <strong>of</strong> the market<br />
reaction to different types <strong>of</strong> BEE transactions it is nevertheless important to<br />
observe that in general the market reaction is at least neutral. As suggested<br />
by financial theory then, BEE transactions are not associated with a negative<br />
market reaction and if one ascribes broader social benefits to BEE then these<br />
results indicate that if the financial effects are neutral then the net societal<br />
benefit <strong>of</strong> BEE transactions would be positive. Given that being BEE<br />
compliant may result in real economic benefits to firms, however, it is<br />
entirely plausible, as found by previous studies, that BEE transactions may<br />
result in a positive market reaction. The results <strong>of</strong> this study, however,<br />
indicate that caution should be exercised in assessing the returns to BEE<br />
transactions. As is to be expected in an efficient market, investors appear to<br />
be discerning in their response to BEE transactions. Positive market reaction<br />
is not general but rather seems to be limited to those transactions that <strong>of</strong>fer<br />
the greatest potential for securing real financial benefits to shareholders. The<br />
implication for management and policy makers is that in order to achieve<br />
real economic benefits through BEE requires that the specific characteristics<br />
<strong>of</strong> BEE transactions should be carefully considered.<br />
References<br />
Araujo, J, M Denenga & A Milovanovic 2007. Section 6: Broad-based Black<br />
Economic Empowerment. Investing in South Africa 40-44.<br />
BEECom 2002. Executive Summary Report <strong>of</strong> the BEECom 2001. Available<br />
at: http://www.bmfonline.co.za/bee_rep.html.<br />
Brown, SJ & JB Warner 1980. Measuring Security Price Performance.<br />
<strong>Journal</strong> <strong>of</strong> Financial Economics 8,1: 205-258.<br />
Campbell, J, A Lo, & AC MacKinlay 1997. The Econometrics <strong>of</strong> Financial<br />
Markets. Princeton, NJ: Princeton <strong>University</strong> Press.<br />
Copeland, T, JF Weston, & K Shastri 2005. Financial Theory and<br />
Corporate Policy. 4 th Edition. Boston, MA: Addison-Wesley.<br />
163
Barry Strydom, Andrew Christison & Joao Matias<br />
Damodaran, A. 1997. Corporate Finance: Theory and Practise. New York:<br />
John Wiley & Sons.<br />
Dasgupta, S, B Laplante & N Mamingi 1997. Capital Market Responses to<br />
Environmental Performance in Developing Countries. The World Bank<br />
Development Research Group: October.<br />
DTI. 2003. Department <strong>of</strong> Trade and Industry. Strategy for Broad-Based<br />
Black Economic Empowerment. Available at: http://www.dti.gov.za/<br />
bee/bee.html.<br />
Firer, C, S Ross, R Westerfield & B Jordan 2004. Fundamentals <strong>of</strong> Corporate<br />
Finance. 3 rd Edition. South African Edition. Berkshire: McGraw-Hill.<br />
Gitman, LJ 2009. Principles <strong>of</strong> Managerial Finance. 12 th Edition.<br />
Englewood Cliffs: Prentice Hall.<br />
Jackson, WE, TM Alessandri & SS Black 2005. The Price <strong>of</strong> Corporate<br />
Social Responsibility: The Case <strong>of</strong> Black Economic Empowerment<br />
Transactions in South Africa. Working Paper 2005-29, December,<br />
Federal Reserve Bank <strong>of</strong> Atlanta Working Paper Series.<br />
Mackinlay, C 1997. Event Studies in Economics and Finance. <strong>Journal</strong> <strong>of</strong><br />
Economic Literature XXXV, March: 13-39.<br />
Marais, F & L Coetzee 2006. The Determination <strong>of</strong> Black Ownership in<br />
Companies for the Purpose <strong>of</strong> Black Economic Empowerment (Part 2).<br />
Obiter 502-538.<br />
Ross, S, RW Westerfield & J Jaffe 2002. Corporate Finance. 6 th Edition.<br />
New York: McGraw-Hill.<br />
Ross, S, RW Westerfield, BD Jordan & C Firer 2001. Fundamentals <strong>of</strong><br />
Corporate Finance. 2 nd South African Edition. Roseville: Irwin/<br />
McGraw-Hill.<br />
Sartorius, K & G Botha 2008. Black Economic Empowerment Ownership<br />
Initiatives: A Johannesburg Stock Exchange Perspective. Development<br />
Southern Africa 25,4, October: 437-453.<br />
Soongswang, A 2007. An Investigation <strong>of</strong> Tender Offer Effects on Thai<br />
Target Firms During the Bid Period. International Research <strong>Journal</strong> <strong>of</strong><br />
Finance and Economics 9: 87-104.<br />
Strydom, B, A Christison & J Matias 2009. An Empirical Investigation <strong>of</strong><br />
the Effect <strong>of</strong> Black Economic Empowerment Transactions on Share<br />
Prices: 1996 to 2006. African <strong>Journal</strong> <strong>of</strong> Accounting, Economics,<br />
Finance and Banking Research 5,5: 67-76.<br />
164
Transaction Characteristics, Market Response & BEE Transactions<br />
Weston, JF, M Mitchell & JH Mulherin 2004. Takeovers, Restructuring and<br />
Corporate Governance. 4 th Edition. Upper Saddle River, NJ: Prentice-<br />
Hall.<br />
Wolmarans, H & K Sartorius 2009. Corporate Social Responsibility: The<br />
Financial Impact <strong>of</strong> Black Economic Empowerment Transactions in<br />
South Africa. South African <strong>Journal</strong> <strong>of</strong> Economic and Management<br />
Sciences 12,2: 180-193.<br />
Barry Strydom<br />
School <strong>of</strong> Economics and Finance<br />
<strong>University</strong> <strong>of</strong> <strong>KwaZulu</strong>-<strong>Natal</strong><br />
South Africa<br />
strydomb@ukzn.ac.za<br />
165<br />
Andrew Christison<br />
School <strong>of</strong> Economics and Finance<br />
<strong>University</strong> <strong>of</strong> <strong>KwaZulu</strong>-<strong>Natal</strong><br />
South Africa<br />
christison.a@gmail.com<br />
Joao Matias<br />
Barnard Jacobs Mellet Wealth (Pty.), Ltd.<br />
Durban, South Africa<br />
joaom@bjm.co.za
Inflation Impact <strong>of</strong> an Exchange Rate<br />
Adjustment: The Case <strong>of</strong> Zimbabwe<br />
1990 - 2006<br />
Mike Nyamazana Sikwila<br />
Abstract<br />
The author aims to econometrically estimate the impact <strong>of</strong> an exchange rate<br />
adjustment on consumer price inflation using Zimbabwe’s quarterly data<br />
from 1990-2006. The first round impact <strong>of</strong> devaluation on consumer prices<br />
is found to be low. The elasticity is 0.05. This means that, in the short-run,<br />
100 percent devaluation would increase inflation by only 5 percent. The long<br />
term elasticity is estimated at 0.51. That is, about half <strong>of</strong> an exchange rate<br />
adjustment would be passed on to domestic inflation and about 51 percent<br />
real devaluation would be achieved. This is consistent with the earlier<br />
studies on exchange rate pass-through to consumer prices. The author also<br />
reports that excess demand exerts strong pressure on domestic prices.<br />
Therefore, prudent fiscal and monetary policies are essential to moderate the<br />
impact <strong>of</strong> an exchange rate adjustment on domestic prices.<br />
Keywords: Exchange rate, devaluation, Inflation, Pass-through effect, speed<br />
<strong>of</strong> adjustment, elasticity.<br />
Problem Statement, Objectives and Research Questions<br />
Zimbabwe is generally an agricultural based economy with GDP per capita<br />
income <strong>of</strong> US432 in real terms and a population <strong>of</strong> 12 million people,<br />
(United Nations 1998; 2007). The agricultural sector significantly<br />
contributes to foreign earnings, with tobacco, cotton and horticulture being<br />
<strong>Alternation</strong> Special Edition 4 (2011) 166 – 180<br />
ISSN 1023-1757<br />
166
Inflation Impact <strong>of</strong> an Exchange Rate Adjustment in Zimbabwe<br />
the main contributors. The other sectors important in terms <strong>of</strong> foreign<br />
earnings are mining, manufacturing and tourism. In the post-independence<br />
period the government <strong>of</strong> Zimbabwe has followed import-substitution and<br />
export-oriented policies. Despite, these policies the country has experienced<br />
balance <strong>of</strong> payment problems and a critical shortage <strong>of</strong> foreign exchange.<br />
The macroeconomic imbalances led to problems <strong>of</strong> high inflation and<br />
instability <strong>of</strong> the exchange rate (CSO 2004; 2007). Thus, chronic high<br />
inflation characterized the Zimbabwe’s economy throughout the 1990s<br />
through to 2006 (a point stressed by Makuyana et al. 2011).<br />
Although inflation was steadily rising over the period 1990Q1 to<br />
1997Q3, the end <strong>of</strong> the last quarter <strong>of</strong> 1997Q4 experienced a crash <strong>of</strong> the<br />
Zimbabwe dollar and this led to a surge in inflation. The crash in Zimbabwe<br />
dollar was to a large extent due to increases in government expenditure<br />
requirements in the third quarter <strong>of</strong> 1997Q3 through to 2006Q4. The<br />
increase in government expenditure requirements eroded confidence in both<br />
domestic and foreign exchange rate markets; subsequently putting more<br />
pressure on the exchange rate, thereby inflation. Despite the disequilibrium<br />
in the exchange rate market, the authorities were reluctant to devalue in that<br />
devaluation implies increased inflation, and thereby paying more for debt<br />
servicing in local currency. Yet, exporters became less competitive if<br />
currency is overvalued or misaligned from its equilibrium level. In an effort<br />
to curtail inflation programmes such as the Economic Structural Adjustment<br />
Programme (ESAP), (1991-1995) and Zimbabwe Programme for Economic<br />
and Social Transformation (1996-2000) were implemented, but failed to<br />
achieve the desired level <strong>of</strong> inflation (GOZ 1991; 1996) 1<br />
.<br />
The problem statement simply stated is that exchange rate<br />
adjustments exerted adverse pressure on Zimbabwe’s consumer price<br />
inflation in the period 1990Q1 to 2006Q4.<br />
The objectives <strong>of</strong> the study are to explain the determinants <strong>of</strong><br />
inflation in Zimbabwe, with particular emphasis on the inflation impact <strong>of</strong><br />
an exchange rate adjustment. In addition, the author discusses the monetary,<br />
fiscal policies and point out the underlying dynamics <strong>of</strong> inflation in 1990s<br />
through to 2000s.<br />
1 The Government <strong>of</strong> Zimbabwe (GOZ).<br />
167
Mike Nyamazana Sikwila<br />
The author attempts to answer three questions: What is the<br />
responsiveness <strong>of</strong> prices to an adjustment <strong>of</strong> nominal exchange rate, it is<br />
how much <strong>of</strong> the devaluation pass-through to inflation? What are the speed<br />
<strong>of</strong> adjustment and the long run elasticity <strong>of</strong> inflation with respect to real<br />
devaluation <strong>of</strong> an exchange rate?<br />
The layout <strong>of</strong> the article is as follows: section one gives the problem<br />
statement, objectives, and research questions section two is the literature<br />
survey, section three presents the methodology, section four briefly deals<br />
with data collection, section five presents data analysis, section six gives<br />
answers to research questions and section seven is the conclusion.<br />
Literature Survey<br />
Most <strong>of</strong> studies on devaluation <strong>of</strong> the nominal exchange rate and passthrough<br />
to consumer price inflation have been carried out in developed<br />
economies (Neiman 2010; Gust et al. 2010; Burstein et al. 2007), among<br />
others. However, there is still a dearth <strong>of</strong> knowledge with regard to similar<br />
work in less developing economies. The question <strong>of</strong>ten asked is what causes<br />
an incomplete or low exchange rate pass-through to import and thereby to<br />
consumer prices (Gust et al. 2010; Neiman 2010; Burstein et al. 2007;<br />
Marazzi & Sheets 2007; Taylor 2000).<br />
Several studies using different methods and data to explain the<br />
exchange rate impact on inflation agree that in recent years the pass-through<br />
has declined implying that a depreciation <strong>of</strong> the nominal exchange rate led to<br />
less than 100 percent increase in consumer price inflation (Gust et al. 2010;<br />
Neiman 2010; Burstein et al. 2007; Marazzi & Sheets 2007; Taylor 2000;<br />
Mishkin 2008; Reyes 2007). But they differ in the explanation <strong>of</strong> the causes<br />
<strong>of</strong> the incomplete pass-through. As a consequence, various hypotheses have<br />
been put forward explaining reasons for low pass-through to imports or<br />
consumer price inflation. The general hypothesis reported by most studies is<br />
that the decline in the pass-through was due to competition in production <strong>of</strong><br />
products, and trade integration particularly with China (Gust et al. 2010;<br />
Marazzi & Sheets 2007)<br />
The author notes that several studies on exchange rate pass-through<br />
to inflation deal with import prices using aggregate, industry or firm data<br />
(Bodnar et al. 2002; Heghi 2003; Gust et al. 2010; Devereux & Engel 2002;<br />
168
Inflation Impact <strong>of</strong> an Exchange Rate Adjustment in Zimbabwe<br />
Neiman 2010; Burstein et al. 2007; Marazzi & Sheets 2007). However, other<br />
studies examine the broad effect <strong>of</strong> exchange rate pass-through to consumer<br />
price inflation (Taylor 2002; Corsetti et al. 2008; Mishkin 2008; Gust et al.<br />
2009). In addition, same studies have focused on export prices ‘price to<br />
market’ the exporter set prices using the currency <strong>of</strong> the country which<br />
goods are being exported (Vigfusson et al. 2009; Miljkovic et al. 2003).<br />
Study by Taylor (2000) show evidence that low inflation and<br />
prudent monetary policy led to incomplete or low exchange rate passthrough,<br />
which in turn, led to a positive effect on persistent price and cost<br />
increases. Gust et al. (2010) using 1980s data reported a pass-through<br />
coefficient <strong>of</strong> 55 percent for United States. Marazzi and Sheets (2007)<br />
observed that pass-through for the United States declined from 0.5 in the 70s<br />
and 80s to 0.2 in the last 10 years. These studies show that with improved<br />
trade integration and monetary policy the correlation between exchange rate<br />
pass-through and inflation is weak (Mishkin 2008; Taylor 2000).<br />
Although causes <strong>of</strong> inflation differ from country to country, Lim and<br />
Papi (1997) argue that studies have shown that inflation is influenced in<br />
three ways. First, the monetary way, this is through growth <strong>of</strong> money stock.<br />
Second, it is argued that inflation originates from high government spending<br />
that exceeds revenues at a given time. The increase in debt and short fall <strong>of</strong><br />
revenues lead governments to borrow from Central Banks, subsequently,<br />
increasing the money stock, and thereby inflation. Third, as previously<br />
mentioned, it is argued in the literature that inflation is as a result <strong>of</strong><br />
devaluation <strong>of</strong> exchange rate. Furthermore, the oligopolistic markets through<br />
price wars and collusions lead to inflation (Hegji 2003). In addition, labour<br />
unions create price-wage spiral, which lead to high inflation.<br />
Lim and papi (1997) carried out an empirical study for Turkey and<br />
examined the monetary, public finance and structural causes <strong>of</strong> inflation.<br />
Their results showed that the public finance variables had more influence on<br />
inflation process than other approaches. Moreover recent studies have<br />
emphasized the use <strong>of</strong> structural models to explain inflation and exchange<br />
rate pass-through (Corsetti et al. 2008) used structural equations to examine<br />
both short run and long run exchange rate pass-through using the United<br />
States data and concluded that the pass-through were incomplete.<br />
Rittenberg (1973) using the Granger causality tests showed that the<br />
causality is from price change to the exchange rate, rather than from the<br />
169
Mike Nyamazana Sikwila<br />
exchange rate to price level. Thus, the effect <strong>of</strong> devaluation on prices is<br />
inconclusive. They also assert that the expectations are largely due to<br />
inflation inertia. The current high level <strong>of</strong> inflation is expected to lead to<br />
further inflation in future.<br />
Studies have shown that one <strong>of</strong> the causes <strong>of</strong> inflation is increased<br />
government spending that lead to budget deficit (Rodriguez, 1978). The<br />
increase in the budget deficit, and its subsequent monetization by the Central<br />
Bank fuelled inflation. However, it is believed that devaluation leads and/or<br />
triggers inflation process, and subsequent high interest rates, through<br />
contraction in monetary policies.<br />
Rodriguez (1978) argues that albeit that devaluation leads to<br />
expensive imported goods in domestic prices, the balance <strong>of</strong> payments<br />
experiences a transitory improvement following devaluation. But this<br />
improvement could be eroded if government continues to spend on imports.<br />
Rodriguez, further argues that countries are not keen in cutting spending for<br />
political reasons and resort to small devaluations, which lead to devaluationinflation<br />
spiral.<br />
In spite <strong>of</strong> these analyses it is <strong>of</strong>ten argued that devaluation leads to<br />
high input costs, particularly when a country depends on imported<br />
intermediate goods for both domestic consumption and exports (Taylor<br />
2002). Rodriguez (1998) noted that the main factors that are responsible for<br />
inflation in many less developed countries are the monetization <strong>of</strong> the fiscal<br />
deficit and devaluation <strong>of</strong> the domestic currency. He argues that in a country<br />
that is experiencing shortage <strong>of</strong> foreign exchange, that is expected to <strong>of</strong>fset<br />
the deficit caused by high government spending, the way out would be to<br />
devalue the domestic currency, and trigger thereby inflation.<br />
The underlying problem that leads to devaluation and inflation is the<br />
macroeconomic imbalances that stem from high government spending and<br />
subsequent fiscal deficit. The real government deficit financed through<br />
domestic credit creation by Central Bank’s accommodation <strong>of</strong> government<br />
debt leads to increases in the monetary base or broad money and thereby<br />
inflation. Rodriguez concluded that an assertion that inflation is entirely<br />
caused by external factors is inappropriate, however, devaluation, in part,<br />
affects inflation, while the other part is attributed to various variables such<br />
as import prices or terms <strong>of</strong> trade.<br />
Ghi and Hinkle (1999: 539-549) assert that if a country needs to im-<br />
170
Inflation Impact <strong>of</strong> an Exchange Rate Adjustment in Zimbabwe<br />
prove its competitiveness and require a devaluation <strong>of</strong> its real exchange rate,<br />
it is necessary to devalue the nominal exchange rate, in order to effect<br />
changes in the relative prices. However, devaluation could be eroded by<br />
inflation if the accompanying fiscal and monetary policies are not adjusted<br />
simultaneously to achieve the desire goal. Ghei and Hinkle, further assert<br />
that before devaluation <strong>of</strong> the nominal exchange rate, it is necessary to know<br />
the degree <strong>of</strong> misalignment between the real exchange rate and its<br />
equilibrium level. Otherwise if they are already aligned devaluation could<br />
lead to undesirable adjustment in the real exchange rate, they further assert<br />
that empirical studies have shown that devaluation <strong>of</strong>ten leads to inflationary<br />
pressure. But, only part <strong>of</strong> devaluation is transmitted (pass-through) to<br />
increases in consumer price inflation (Gust, Leduc & Vigfusson 2010,<br />
Neiman 2010; Burstein, Eichenbaum & Rebelo 2007; Marazzi & Sheets<br />
2007) the other part affects the real exchange rate (Edwards 1989) 2<br />
.<br />
Research Methodology<br />
In the literature inflation is defined in many different ways. For the purpose<br />
<strong>of</strong> this study the author defines inflation as a persistent rise in general price<br />
level. The model the author adopts is a variant <strong>of</strong> Lim and Papi (1997)<br />
model <strong>of</strong> the determinants <strong>of</strong> inflation in Turkey and more recently studies<br />
by Taylor (2000); Mishkin (2008). However, the specification, <strong>of</strong> an eclectic<br />
model adopted in this study differs, in that it takes into account factors that<br />
have significantly influenced inflation process in Zimbabwe. Despite the<br />
focus on inflationary impact <strong>of</strong> an exchange rate adjustment, the author<br />
includes other variables that influence inflation.<br />
The model the author uses for Zimbabwe is based on demand and<br />
supply <strong>of</strong> traded and non-traded goods. 3<br />
A convenient starting point in the<br />
analysis <strong>of</strong> inflation process would be to discuss the determinants <strong>of</strong><br />
aggregate demand (Qd) and aggregate supply (Qs) functions. Any changes in<br />
the composition <strong>of</strong> (Qd) and (Qs) are expected to influence price level. For<br />
2<br />
Edwards 1989 ‘pass through coefficient’ and an ‘effectiveness index’ <strong>of</strong> a<br />
devaluation respectively.<br />
3<br />
The production function is assumed to be homogenous <strong>of</strong> degree one and<br />
exhibit constant returns to scale.<br />
171
Mike Nyamazana Sikwila<br />
example, borrowing from the Central Bank, an increase in government<br />
expenditures, monetary expansion and reduction in investment leads to shifts<br />
in aggregate demand, thereby increasing price level. Implicitly the resources<br />
do not adjust smoothly to changes in variables mentioned above. To<br />
encompass factors that influence demand, it is assumed that (Qd) depends on<br />
the real money balances and real income. The aggregate demand function is<br />
given as:<br />
( M / P,<br />
GNP / P,<br />
)<br />
d d<br />
= Q<br />
d<br />
(1)<br />
Q µ<br />
where M is broad money, P, is the domestic price level, GNP is the output,<br />
and µd the demand random shocks.<br />
On the other hand the price level could be affected by the factors that<br />
influence the aggregate supply (Q s ). For example, an increase in energy cost,<br />
food prices and devaluation/depreciation <strong>of</strong> the local currency are expected<br />
to shift the aggregate supply. Hence, the encompassing supply function is<br />
given as<br />
e ( NER,<br />
π , )<br />
s s<br />
= Q<br />
s<br />
(2)<br />
Q µ<br />
where: NER is nominal exchange rate, π e is expected inflation, and μs is the<br />
supply random shocks. The goods market is cleared when it is at equilibrium<br />
price given by<br />
d<br />
( M P,<br />
GNP / P,<br />
)<br />
s e<br />
/ = Q ( NER π , µ )<br />
Q µ<br />
d<br />
, (3)<br />
Solving equation (3) for ‘P’ The author obtains the (reduced form)<br />
long run equilibrium price equation.<br />
e<br />
P = M + NER + GNP + π + µ<br />
(4)<br />
Equation (4) is the long run price equation that states that in the long<br />
run the price level in the goods market is influenced by broad money,<br />
nominal exchange rate, Gross National Product and expected inflation.<br />
s<br />
172
Inflation Impact <strong>of</strong> an Exchange Rate Adjustment in Zimbabwe<br />
Equation (4) is estimated and residuals are used to test for co-integration 4<br />
and in the estimation <strong>of</strong> the short-ran equation (6) below.<br />
The Short-run Inflation Equation<br />
The short run model is expected to encompass cyclical movements, seasonal<br />
fluctuation, and irregular variations such as drought, elections and strikes. It<br />
is assumed in the model that change in the logarithm <strong>of</strong> inflation is a<br />
function <strong>of</strong> the logarithm <strong>of</strong>: a change in nominal exchange rate lagged two<br />
quarters, the change in money supply lagged two quarters, the change in<br />
Gross National Product (electricity consumption is used as a proxy for GNP)<br />
and change in expected inflation. The inflation equation is presented as:<br />
e<br />
( ∆ log(<br />
NER , M , GNP , π ) , Uhat µ )<br />
∆ π ,<br />
(5)<br />
log t = Φ<br />
t −2<br />
2t<br />
−2<br />
t t t −1<br />
where ∆ is the change, 5<br />
π is the inflation the dependent variable, Φ denotes<br />
a function and the logarithm <strong>of</strong> 6 : ∆NER, change in nominal exchange rate,<br />
∆M2 change in money supply, ∆GNP, change in gross national product, ∆π e ,<br />
change in expected inflation, that the error correction term are independent<br />
variables μ the random disturbance whose average value is expected to be<br />
zero, and‘t’ is the time 7<br />
.<br />
The lags included in the inflation equation, strongly influence the<br />
dynamics and character <strong>of</strong> inflation process. For example, in the case <strong>of</strong><br />
unionized labour force the assumed lags are not unreasonable in that<br />
collective bargain in most industries in Zimbabwe takes place once a year. In<br />
some cases negotiations drag on for a long time. This is the case with<br />
government workers. The lags are also justified in that the process <strong>of</strong><br />
transforming price change such as exchange adjustment into cost takes<br />
months. However, administered prices such as those <strong>of</strong> electricity, fuel and<br />
water, perhaps, are insensitive to changes in demand, thereby inflation. But<br />
if they are frequently adjusted as the situation under the study period, they<br />
4 ∆μt = - δμt + ξt<br />
5 ∆ϕ(t) = ϕ(t) - ϕ(t-1)<br />
6 π, implies changes in price level<br />
7 π e = φ(πt-1,πt-2,πt-3,πt-4)<br />
173<br />
t
Mike Nyamazana Sikwila<br />
impact adversely on inflation. Taking the log transformation <strong>of</strong> equation (5)<br />
the log-linear equation is given as:<br />
∆Logπ<br />
= a<br />
o<br />
+ β ∆ log NER<br />
e<br />
t<br />
1<br />
( + )<br />
t-<br />
2<br />
( t −1)<br />
+ µ t<br />
+ β ∆ log M<br />
2<br />
( + )<br />
174<br />
2t<br />
−2<br />
+ β ∆ log GNP + ..<br />
.. + β4∆<br />
logπ<br />
+ β5Uhat<br />
(6)<br />
( + )<br />
( −)<br />
where: βi are the parameters that give elasticities <strong>of</strong> respective variables with<br />
respect to inflation and ‘i’ equal to 1, 2, 3...n. The signs below the variable<br />
parameter indicate a priori sign <strong>of</strong> the variable. Equation (6) is the log linear<br />
inflation equation estimated using the OLS method for the period 1990Q1-<br />
2006Q4.<br />
Data Collection<br />
Having discussed the variable relations the author now turn to quantitative<br />
analysis <strong>of</strong> the inflation model. The quarterly time series data for 1990Q1 -<br />
2006Q4 is used to estimate an eclectic long run and short-run equations (4)<br />
and (6). The data is obtained from Central Statistical Office (CSO). The<br />
quarterly data is expected to track inflation process better than annual data.<br />
The consumer price index (CPI or P) is used to compute change in prices<br />
and it includes administrative prices. The author uses the geometric mean to<br />
average the monthly (CPI) in order to obtain the quarterly (CPI). The<br />
consumer price index was measured with1990 as base year.<br />
The choice <strong>of</strong> the sample series is determined by the date in which<br />
economic reforms were adopted and the fact that more recent developments<br />
are expected to have a bearing on the future policy management <strong>of</strong> the price<br />
level and the economy. The quarterly data used is measured in millions <strong>of</strong><br />
Zimbabwe dollars. The exchange rate used, is the nominal <strong>of</strong>ficial effective<br />
exchange rate.<br />
Data Analysis<br />
Before carrying out the ordinary Least Squares estimates for the long run<br />
model a test for stationarity <strong>of</strong> the variable series was carried out. The unit<br />
root test is employed to ascertain whether the series is stationary. For the<br />
3<br />
( −)<br />
t
Inflation Impact <strong>of</strong> an Exchange Rate Adjustment in Zimbabwe<br />
stationarity to be achieved the author tests the null hypothesis that the<br />
variables are non-stationary (Engle & Granger 1987; Dickey & Fuller 1979).<br />
The time series properties <strong>of</strong> the data indicate that all the variables<br />
exhibit unit roots, and implies that they are <strong>of</strong> I(1) series. The long-run price<br />
equation is estimated using quarterly data over the period 1990Q1 to<br />
2006Q4. A test for co-integration revealed that the residuals <strong>of</strong> the long run<br />
price equation are <strong>of</strong> I(0) series 8<br />
. In other words, inflation is co-integrated<br />
with money, exchange rate, GNP, and expected inflation. The results <strong>of</strong> the<br />
long run price equation suggest that in the long run there is not much<br />
significance difference in the effects <strong>of</strong> money and exchange rate adjustment<br />
on inflation; output (GNP) has a negative effect, while expected inflation<br />
has a positive effect on inflation.<br />
Having established the stationarity and co-integration <strong>of</strong> the series,<br />
the author estimates the short-run Error Correction Model (ECM) (equation<br />
6). Table 1 below reports the results.<br />
Table 1: An Error Correction Model <strong>of</strong> Inflation<br />
Dependent Variable Δlog(πt)<br />
Variable Coefficient SE t- ratio<br />
Constant<br />
Δlog(NERt<br />
Δlog(M2t-2)<br />
Δlog(GNPt)<br />
Δlog(π e 0.0030 0.0049 - 0.58<br />
0.0475 0.0189 2.51<br />
0.0746 0.0532 1.40<br />
- 0.0379 0.0157 - 2.41<br />
t)<br />
0.0215 0.0083 2.57<br />
- 0.1315 0.0216 - 6.07<br />
Uhtt-1<br />
R 2 = .71, R 2 → adj. = .663, S.E <strong>of</strong> regression = .00944<br />
F- stat. F (5, 35) = 16.7552 (.000), DW – stat. = 1.67<br />
RSS = 0.003124 for 6 variables and 41<br />
Observations, Akaike info, Criteria = 130.2<br />
Schwarz Bayesian criteria = 125.06<br />
S.E <strong>of</strong> Regression = 0.0094<br />
µ δµ + ξ<br />
8 ∆ t = − t −1<br />
t<br />
175
Mike Nyamazana Sikwila<br />
Table 2: The Long Run Price Equation 9<br />
Dependent Variable Log (Pt)<br />
Variable Coefficient SE t-ratio<br />
Constant 0.18116 0.13112 1.13112<br />
Log(NERt) 0.51088 0.14270 3.42300<br />
Log(M2t) 0.55215 0.12330 4.47500<br />
Log(GNPt) -0.2028 0.07465 -2.71700<br />
Log(EINFt) 0.12028 0.06204 1.939<br />
The estimated long run Coefficient <strong>of</strong> an Auto Regressive<br />
Distributed Lag model (ARDL) chosen by the Schwarz Bayesian Criterion is<br />
given in table 2 above. As previously mentioned, the residuals <strong>of</strong> the long<br />
run model is found to be I(0), which supported co-integration.<br />
Key to Variables<br />
INF = Inflation<br />
EINF= Expected Inflation<br />
NER = Nominal Exchange Rate<br />
M2 = Money Supply<br />
GNP = Electricity Consumption (Proxy for GNP)<br />
CPI = P: Consumer Price Index<br />
Qi = Quarterly<br />
Answer to Research Questions<br />
The results given in table 1 above indicate that the nominal exchange rate,<br />
Gross National Product, expected inflation are clearly significantly different<br />
from zero at the 5 percent level <strong>of</strong> significance in absolute terms. Their tratios<br />
are 2.51, -2.41, and 2.57 respectively. In the case <strong>of</strong> the money supply,<br />
there is no evidence <strong>of</strong> a significant relationship from the short run data as<br />
applied to the model. However, in the long run the relationship between the<br />
money supply and price level is strong. The error correction term Uhat (-1)<br />
is significant, and indicates a 13 percent speed <strong>of</strong> adjustment into the short<br />
run process from the previous period. The inflation elasticity with respect to<br />
9 EINFt = π e t .<br />
176
Inflation Impact <strong>of</strong> an Exchange Rate Adjustment in Zimbabwe<br />
exchange rate results is a less than proportionate change in inflation. The R-<br />
Bar-squared <strong>of</strong> 66.3 percent presents a good fit and variables have the<br />
correct signs. The results indicate an exchange rate pass-through <strong>of</strong> 0.05 in<br />
the short run and an inflation elasticity <strong>of</strong> 0.51 for long run. Implying that in<br />
the short run 100 percent devaluation would lead to a 5 percent increase in<br />
inflation, while only 51 percent pass-through to inflation is reported in the<br />
long run.<br />
The finding does not support a view that following a devaluation<br />
prices would rise by the same magnitude <strong>of</strong> devaluation. Governments are<br />
<strong>of</strong>ten opposed to devaluation or exchange rate adjustment in that devaluation<br />
implies increase in prices and paying more for debts servicing in local<br />
currencies. However, the exporters became less competitive if the currency<br />
is overvalued or misaligned from its equilibrium level. The results suggest<br />
that policies that favour exchange rate adjustment that achieve alignment are<br />
advantageous to the economy.<br />
The demand-pull factors are strong in the case <strong>of</strong> Zimbabwe. The<br />
significant Gross National Product variable is evidence <strong>of</strong> an excess demand<br />
in the economy. As output declines prices <strong>of</strong> goods and services increase.<br />
This evidence is supported by poor economic growth rates that Zimbabwe<br />
has experienced in the period 1990Q1 to 2006Q4. The result suggests that a<br />
decline in output is, in part, responsible for surge in prices in the early to<br />
mid 2000’s. The expected inflation influenced the supply side through high<br />
wages. Workers real wage variable was found to be inconsistent and thereby<br />
dropped in the estimated model. The results indicate that the exchange rate<br />
adjustment leads to a less than proportionate change in prices. Thus, our<br />
analysis suggests that only a proportion <strong>of</strong> devaluation impacts on consumer<br />
price inflation (Table 1). The long-term elasticity <strong>of</strong> inflation is<br />
approximately 0.51 with respect to nominal devaluation (Table 2).<br />
The findings in the present study have thrown some light on the<br />
effects <strong>of</strong> an exchange rate adjustment on prices. By contrast the findings<br />
and evidence obtained in this paper though different in approach and data<br />
used they are in line with other similar studies that have been undertaken in<br />
Developed and Less Developing Countries.<br />
Summary and Conclusion<br />
The author examines the inflation impact <strong>of</strong> an exchange rate adjustment,<br />
177
Mike Nyamazana Sikwila<br />
and has shown that the exchange rate pass-through to domestic price for<br />
Zimbabwe is incomplete and the findings and evidence obtained in this<br />
paper complement previous literature on the pass-through discourse. The<br />
aim <strong>of</strong> the author is to explain the determinants <strong>of</strong> inflation in Zimbabwe,<br />
with particular emphasis on the inflation impact <strong>of</strong> an exchange rate<br />
adjustment on prices. An attempt is made to analyze the effects <strong>of</strong><br />
devaluation/revaluation <strong>of</strong> an exchange rate on Zimbabwe’s inflation. The<br />
model employed is based on the aggregate demand and supply <strong>of</strong> goods and<br />
services. The co-integration regression equation is estimated using the<br />
quarterly data over the period 1990Q1-2006Q4. The residuals from the long<br />
run equation are included as a variable in the estimation <strong>of</strong> the short run<br />
error correction model. The findings in this paper indicate an incomplete<br />
exchange rate pass-through to consumer price inflation.<br />
The author notes that demand-pull inflation is strong in the case <strong>of</strong><br />
Zimbabwe’s economy. The results have shown that as output declines prices<br />
<strong>of</strong> goods and services increase. The results obtained in this study have shade<br />
some light on the effects <strong>of</strong> an exchange rate adjustment on consumer prices.<br />
By explaining the potential consequences <strong>of</strong> an exchange rate adjustment on<br />
inflation it is hoped that the findings might be useful to policy makers and<br />
other researchers. It is recommended that a simultaneous devaluation <strong>of</strong> an<br />
exchange rate and tax cuts should reduce the inflation impact <strong>of</strong> an exchange<br />
rate adjustment. The results in this paper are conclusive, though they depend<br />
on the specification <strong>of</strong> the model and quality <strong>of</strong> data used. Finally, further<br />
investigation on the subject <strong>of</strong> inflation and exchange rate adjustments,<br />
could deal with causes <strong>of</strong> incomplete exchange rate pass-through to<br />
consumer prices and remedies <strong>of</strong> demand pull inflation in Zimbabwe.<br />
References<br />
Atta, JK, K Jefferis, I Mannathoko & P Siwawa-Ndai 1999. Exchange Rate<br />
Policy and Price Determination in Botswana. AERC Research Paper 3,<br />
Africa Economic Research Consortium, Nairobi.<br />
Bodnar, GM, B Domas & RC Marston 2002. Pass-through and Exposure.<br />
The <strong>Journal</strong> <strong>of</strong> Finance LVII,1,February.<br />
Burstein, A, M Eichenbaum & S Rebelo 2007. Modelling Exchange Rate<br />
Pass-through after Large Devaluations. <strong>Journal</strong> <strong>of</strong> Monetary Economics<br />
54: 346-368.<br />
178
Inflation Impact <strong>of</strong> an Exchange Rate Adjustment in Zimbabwe<br />
Corsetti, G, L Dedola & S Leduc 2008. High Exchange-rate Volatility and<br />
Low Pass-through. <strong>Journal</strong> <strong>of</strong> Monetary Economics 55 : 1113 - 1128.<br />
Devereux, MB & C Engel 2002. Exchange Rate Pass-through, Exchange<br />
Rate Volatility, and Exchange Rate Disconnect. <strong>Journal</strong> <strong>of</strong> Monetary<br />
Economics 49: 913-940.<br />
Dickey, DA & WA Fuller 1979. Distribution <strong>of</strong> the Estimators for<br />
Autoregressive Time Series with a Unit Root. <strong>Journal</strong> <strong>of</strong> American<br />
Statistical Association 74: 427-471.<br />
Edwards, S 1989. Real Exchange Rate, Devaluation, and Adjustment.<br />
Cambridge, Mass: MIT Press.<br />
Engle, RF & CWJ Granger 1987. Cointegration and Error Correction:<br />
Representation, Estimation, and Testing. Econometrica 55,2: 151-276.<br />
Government <strong>of</strong> Zimbabwe: Central Statistical Office 2004.<br />
Gust, C, S Leduc & R Vigfusson 2010. Trade Integration, Competition, and<br />
the Decline in Exchange Rate. <strong>Journal</strong> <strong>of</strong> Monetary Economics 57: 309-<br />
324.<br />
Gust, C, S Leduc & N Sheets 2009. The Adjustment <strong>of</strong> Global External<br />
Balances: Does Partial Exchange Rate Pass-through to Trade Prices<br />
Matter. <strong>Journal</strong> <strong>of</strong> International Economics 79: 173-185.<br />
Hegji, CE 2003. A Note on Transfer Prices and Exchange Rate Passthrough.<br />
<strong>Journal</strong> <strong>of</strong> Economics and Finance 27,3,Fall: 396-403.<br />
Hinkle, LE & PJ Montiel 1999. Exchange Rate Misalignment: Concepts and<br />
Measurement for Developing Countries. Washington DC: World Bank.<br />
Lim, CH & L Papi 1997. Econometric Analysis <strong>of</strong> the Determinants <strong>of</strong><br />
Inflation in Turkey, International Monetary Fund: WP/97/170, Working<br />
Paper.<br />
Makuyana, G, S Munongo & J Zivanomoyo 2011. Does the Zimbabwe<br />
Exchange Rate Follow a Random Walk: January 2000-December 2008?<br />
<strong>Journal</strong> <strong>of</strong> Economics and International Finance 3,2: 121-124.<br />
Marazzi, M & N Sheets 2007. Declining Exchange Rate Pass-through to<br />
U.S. Import Prices: The Potential Role <strong>of</strong> Global Factors. <strong>Journal</strong> <strong>of</strong><br />
International Money and Finance 26: 924-947.<br />
Miljkovic, D, GW Brester & JM Marsh 2003. Exchange Rate Pass-through,<br />
Price Discrimination, and US Meat Export Prices. Applied Economics<br />
35: 641-650.<br />
Mishkin, FS 2008. Exchange Rate Pass-through and Monetary Policy.<br />
179
Mike Nyamazana Sikwila<br />
Available at: http://www.federalreserve.gov/newsevents/speech/mishkin<br />
20080307a.htm.<br />
Neiman, B 2010. Stickiness, Synchronization, and Pass-through in Intra-firm<br />
Trade Prices. <strong>Journal</strong> <strong>of</strong> Monetary Economics 57: 295-308.<br />
Republic <strong>of</strong> Zimbabwe 1991. A Framework for Economic Reforms 1991-95.<br />
Harare.<br />
Republic <strong>of</strong> Zimbabwe, 1996. Zimbabwe Programme for Economic and<br />
Social Transformation 1996-2000. Harare.<br />
Republic <strong>of</strong> Zimbabwe, 2004; 2007: Central Statistic Office (CSO).<br />
Reyes, J 2007. Exchange Rate Pass-through Effects and Inflation Targeting<br />
in Emerging Economies: What is the Relationship? Review <strong>of</strong><br />
International Economics 15,3: 538-559.<br />
Rodriguez, CA 1978. A Stylized Model <strong>of</strong> the Devaluation-Inflation Spiral,<br />
IMF. Staff Papers 25,1: 76-89.<br />
Taylor, JB 2000. Low Inflation, Pass-through, and the Pricing Power <strong>of</strong><br />
Firms. European Economic Review 44: 1389-1408.<br />
UNCTAD 1998, 2007. Handbook <strong>of</strong> Statistics. United Nations.<br />
Vigfusson, RJ, N Sheets, & J Gagnon 2009. Exchange Rate Pass-through to<br />
Export Prices: Assessing Cross-Country Evidence. Review <strong>of</strong><br />
International Economics 17,1: 17-33.<br />
180<br />
M.N. Sikwila<br />
North West <strong>University</strong><br />
Mafikeng<br />
South Africa<br />
Mike.sikwila@nwu.ac.za
Enhancement <strong>of</strong> Service Quality in the<br />
Intercity Bus Transport Industry<br />
Jeevarathnam P. Govender<br />
Qi Pan<br />
Abstract<br />
The South African intercity bus transport system plays a pivotal role in the<br />
movement <strong>of</strong> commuters across the country, including contributing to the<br />
reduction <strong>of</strong> traffic congestion. The intercity bus system appears to provide<br />
safe, comfortable and cost-effective transportation compared to some <strong>of</strong> the<br />
alternative means. However, there is potential to better serve the needs <strong>of</strong> its<br />
consumers. To this end, paying attention to service quality could prove<br />
useful in making this mode <strong>of</strong> travel the preferred choice to local as well as<br />
international travellers. This paper therefore aims to evaluate service quality<br />
in the intercity bus transport system and seeks to measure levels <strong>of</strong> service<br />
quality, determine the relationships among the dimensions <strong>of</strong> service quality<br />
and examine the relationship between selected biographical variables and<br />
expectations and perceptions <strong>of</strong> service quality. A literature survey was<br />
undertaken in order to determine the theoretical underpinnings <strong>of</strong> service<br />
quality. The empirical study was conducted using the SERVQUAL model.<br />
Service quality was measured on the basis <strong>of</strong> the 25 items that constitute the<br />
five dimensions <strong>of</strong> service quality. The study was conducted using<br />
purposive, convenience, and quota sampling among 400 intercity transport<br />
bus passengers, including international travellers. The results indicate gaps<br />
in four out <strong>of</strong> the five dimensions <strong>of</strong> service quality. Recommendations for<br />
improvement in service quality have been made.<br />
Keywords: Intercity bus transport industry, service quality, service quality<br />
gaps, dimensions <strong>of</strong> service quality, expectations <strong>of</strong> service quality,<br />
perceptions <strong>of</strong> service quality.<br />
<strong>Alternation</strong> Special Edition 4 (2011) 181 – 202<br />
ISSN 1023-1757<br />
181
Jeevarathnam P. Govender & Qi Pan<br />
Introduction<br />
The South African intercity bus transport industry plays a prominent role in<br />
the transportation sector, more specifically, in the passenger (commuter)<br />
segment. The industry, as part <strong>of</strong> the public transport network, contributes to<br />
the enhancement <strong>of</strong> social mobility in South Africa. At the same time, this<br />
industry helps solve traffic problems created by the excessive use <strong>of</strong> private<br />
motor vehicles in recent years, e.g. pollution and traffic jams (Ongkittikul &<br />
Geerlings 2006: 285). The most common difficulties for tourists and<br />
foreigners in unfamiliar areas are that public transport is still not accessible<br />
and safety is still <strong>of</strong> great concern. Moreover, South Africa is still<br />
considered as a country with an inadequate transport infrastructure (No<br />
financial worries about 2010, 2006). The major principles underlying public<br />
transport focus on the how to deliver effective public service. These include:<br />
• The promotion <strong>of</strong> the use <strong>of</strong> public transport over private transport,<br />
• Ensuring that public transport services address user needs,<br />
• Promoting and implementing a system <strong>of</strong> regulated competition, and<br />
• Promoting safe and secure, reliable, and sustainable public transport<br />
(National Department <strong>of</strong> Transport 2006).<br />
South Africa has the longest road network in Africa, consisting <strong>of</strong><br />
around 754 600 km <strong>of</strong> roads and streets. The national road network covers<br />
about 9 600 km. Toll roads, serviced by 32 mainline toll plazas, cover about<br />
2 400 km (South Africa Yearbook 2005/6, 611). In many countries around<br />
the world, public transport is considered a favoured alternative to private<br />
transport. Buses play a key role in the public transport system (National<br />
Department <strong>of</strong> Transport Strategic Plan 2006-2009, 2006). Intercity bus<br />
transport, as a means <strong>of</strong> bus passenger transport, is responsible for linking<br />
the major centres in South Africa, and also serves commuters in rural areas<br />
by a network <strong>of</strong> public and privately operated passenger bus services. The<br />
latest available data indicates that between 2002 and 2005, the number <strong>of</strong><br />
commuters travelling by bus increased by 9.5%, while for the same period,<br />
people travelling by train decreased by 3% (Transport crisis could hinder 6%<br />
economic growth 2006). Intercity bus transportation appears to provide<br />
reliable, safe, comfortable and better-integrated transport, hence proving to<br />
be more cost effective, compared to using a private car. However, in some<br />
182
… Service Quality in the Intercity Bus Transport Industry<br />
instances, the price <strong>of</strong> travel by air is similar to that <strong>of</strong> intercity bus travel<br />
(Getting you from A2B in South Africa 2006).<br />
It would therefore mean that the intercity bus transport industry has<br />
great potential to better serve the needs <strong>of</strong> its consumers. To this end, paying<br />
attention to service quality could prove very useful in making this mode <strong>of</strong><br />
travel the preferred choice to both local as well as international travellers.<br />
Statement <strong>of</strong> the Problem<br />
The National Department <strong>of</strong> Transport (2006) has acknowledged that the<br />
current public transportation system is not in a position to cater for the needs<br />
<strong>of</strong> the market and furthermore, that the culture <strong>of</strong> service provision needs to<br />
be improved. There is no documented evidence <strong>of</strong> research being conducted<br />
into service quality in the public transportation industry, more specifically,<br />
the intercity bus transport industry. This study therefore intends to analyse<br />
the elements impacting on the service quality <strong>of</strong> the intercity bus transport<br />
industry in South Africa. The subsidiary problems relate to:<br />
• Measuring the levels <strong>of</strong> service quality on the basis <strong>of</strong> the<br />
dimensions that constitute service quality in the intercity bus<br />
transport industry in South Africa<br />
• Determining the relationships among the dimensions <strong>of</strong> service<br />
quality<br />
• Examining the relationship between selected biographical variables<br />
and expectations and perceptions <strong>of</strong> service quality in the intercity<br />
bus transport industry in South Africa.<br />
Objectives <strong>of</strong> the Study<br />
The objectives <strong>of</strong> the study were:<br />
• To measure the levels <strong>of</strong> service quality on the basis <strong>of</strong> the<br />
dimensions that constitute service quality in the intercity bus<br />
transport industry in South Africa<br />
• Determine the relationships among the dimensions <strong>of</strong> service quality<br />
183
Jeevarathnam P. Govender & Qi Pan<br />
• To examine the relationship between selected biographical variables<br />
and expectations and perceptions <strong>of</strong> service quality in the intercity<br />
bus transport industry in South Africa<br />
Research Questions<br />
The key questions the study intended to answer were:<br />
• What are the levels <strong>of</strong> service quality on the basis <strong>of</strong> the dimensions<br />
that constitute service quality in the intercity bus transport industry<br />
in South Africa?<br />
• What are the relationships among the dimensions <strong>of</strong> service quality?<br />
• Are there significant relationships between selected biographical<br />
variables and expectations and perceptions <strong>of</strong> service quality in the<br />
intercity bus transport industry in South Africa?<br />
Literature Survey<br />
The Concept <strong>of</strong> ‘Service Quality’<br />
Service quality has been associated with the satisfaction <strong>of</strong> expectations.<br />
Gronroos (2001: 151) states that customer satisfaction and happiness are<br />
more strongly affected by their expectations. The term ‘expectations’ from a<br />
behavioural perspective is not as precise as the usage by mathematicians,<br />
who attempt to quantify what, on average, is likely to happen (Metters,<br />
King-Metters, Pullman & Walton 2006: 69). Marketing researchers,<br />
however, prefer to define service quality from an individual customer’s<br />
perspective, also referred to as ‘user-based’ (Fitzsimmons & Fitzsimmons<br />
2006: 128). The expectations are subjective and are based on imagination <strong>of</strong><br />
the service process and outcomes. Service value is reflected in the<br />
satisfaction <strong>of</strong> customer’s demands.<br />
Service quality is a function <strong>of</strong> the expectations-perceptions gap and<br />
pioneering studies into this were conducted in the early 1980s leading to the<br />
development <strong>of</strong> the SERVQUAL model. Today, the results extend into e-SQ<br />
or electronic service quality (Zeithaml, Parasuraman & Malhotra 2001: 2). A<br />
number <strong>of</strong> industries were studied to develop and refine SERVQUAL, which<br />
has been used to execute a gap analysis <strong>of</strong> an organisation’s service quality<br />
performance against customer service quality needs.<br />
184
… Service Quality in the Intercity Bus Transport Industry<br />
The Relationship between Service Quality and Customer<br />
Satisfaction<br />
Lovelock and Wright (2002: 87) define customer satisfaction as a form <strong>of</strong><br />
emotional reaction that arose from an actual experience. Metters et al.<br />
(2006: 110) indicate that satisfaction is the consumer’s fulfilment response.<br />
Satisfaction is the customer’s evaluation <strong>of</strong> a product or service in terms <strong>of</strong><br />
whether that product or service has met the customer’s needs and<br />
expectations (Bruhn & Georgi 2006: 443).<br />
According to Truong and Foster (2006: 843), customer satisfaction<br />
takes place in two situations. One is the result <strong>of</strong> a product or actual service<br />
meeting the customer’s expectations. The other is where the result exceeds<br />
the expectations. Dissatisfaction will occur where the actual service level is<br />
below the expected level. Therefore, satisfaction and dissatisfaction are the<br />
outcome <strong>of</strong> a subjective evaluative process by the consumer. The<br />
relationship between service quality and customer satisfaction still remains a<br />
mystery, from the point <strong>of</strong> view <strong>of</strong> whether customer satisfaction is an<br />
antecedent <strong>of</strong> service quality or vice versa. Some researchers suggest that<br />
customer satisfaction leads to service quality (Lee, Lee & Yoo 2000:219).<br />
A viewpoint most commonly adopted is that customer satisfaction<br />
with a service is related to the perceived discrepancy between actual and<br />
ideal levels <strong>of</strong> service delivery. If experience <strong>of</strong> the service greatly exceeds<br />
the expectations that clients had <strong>of</strong> the service, then satisfaction will be high<br />
and vice versa (MORI, 2002). This should, however, not be taken as a cue<br />
for service providers to drive down expectations in order to achieve surprise<br />
and concomitant customer satisfaction with moderate service quality.<br />
Service quality is seen as an antecedent <strong>of</strong> customer satisfaction (Brady,<br />
Cronin & Brand 2002: 18).<br />
According to Zeithaml, Bitner and Gremler (2006: 110), in order to<br />
measure customer satisfaction and examine the differences between the<br />
desired level <strong>of</strong> a service and actual service received, the related factors and<br />
their relative importance need to be taken into account, when considering<br />
areas for improvement as far as the service mix is concerned. Specific<br />
product or service features, perceptions <strong>of</strong> product and service quality, and<br />
price influence customer satisfaction, inter alia. In addition, personal factors<br />
such as the customer’s mood, emotional state and situational factors are<br />
likely to influence satisfaction.<br />
185
Jeevarathnam P. Govender & Qi Pan<br />
The Dimensions <strong>of</strong> Service Quality<br />
Parasuraman, Zeithaml and Berry originally identified ten dimensions that<br />
were used to assess service quality (Nowacki 2005: 236). As a result <strong>of</strong><br />
further interrogation, the ten dimensions were consolidated into five<br />
(Gronroos 2000: 74). These are tangibles, reliability, responsiveness,<br />
assurance and empathy, and are briefly explained:<br />
• Tangibles<br />
Tangibles are related to the appearance and evidence <strong>of</strong> physical facilities,<br />
equipment, personnel and communication materials (Robledo 2001: 26).<br />
Since the tangible and visual elements <strong>of</strong> the site will be critical to efficiency<br />
and overall impressions <strong>of</strong> the firm and the brand, service companies are<br />
likely to use tangibles to enhance their image and convey quality service to<br />
consumers (Zeithaml et. al. 2006: 120-22).<br />
• Reliability<br />
Bebco (2000: 11-12) defines reliability as ‘the ability to perform the<br />
promised service dependably and accurately’. Reliability is a key factor in<br />
helping customers evaluate the quality they experienced relative to the<br />
quality promised during the delivery process (e.g. service provision, problem<br />
resolution and pricing).<br />
• Responsiveness<br />
Zeithaml, et al. (2006: 17) believe that service providers should be active<br />
and voluntary to assist their customers and be prompt in the provision <strong>of</strong><br />
services. This dimension makes it necessary that the service provider be<br />
flexible in solving customers’ problems and handling requests and queries.<br />
This dimension also addresses the need for capacity to customise services to<br />
meet the special needs <strong>of</strong> certain customers.<br />
• Assurance<br />
Robelo (2001: 25) regards assurance as the knowledge possessed by<br />
employees, their courtesy and the ability <strong>of</strong> the organisation to inspire trust<br />
and confidence. This dimension constitutes four determinants viz.<br />
competence, courtesy, credibility and security.<br />
186
… Service Quality in the Intercity Bus Transport Industry<br />
• Empathy<br />
According to Curry and Sinclair (2002: 200), the empathy dimension refers<br />
to the caring, individualised attention that an organisation provides its<br />
customers. To this end, access, communication and understanding the<br />
customer are key elements. The basic idea behind this dimension is to<br />
provide appropriate and adequate facilities for current as well as potential<br />
customers.<br />
Research Methodology<br />
The study was cross-sectional, descriptive and quantitative in nature. The<br />
population for this study comprised passengers who made use <strong>of</strong> the<br />
intercity bus transport service. A sample size <strong>of</strong> 400 was considered<br />
appropriate, based on the recommendation <strong>of</strong> Leedy and Omrod (2005: 207)<br />
who believe that a sample size <strong>of</strong> 400 is adequate if the target population<br />
size exceeds 5 000.<br />
Three approaches to non-probability sampling were used. Firstly, on<br />
the basis <strong>of</strong> purposive sampling, the fieldwork was conducted at the Durban<br />
Bus Terminal as the sampling location for two main reasons viz. Durban is<br />
one <strong>of</strong> South Africa’s major tourist destinations and secondly, that the<br />
intercity bus transport network connects Durban with the other major cities<br />
and towns. Secondly, convenience sampling was used to select respondents.<br />
Thirdly, quota sampling was employed to achieve a balance between local<br />
and foreign travellers. 350 South Africans and 50 foreign residents were<br />
chosen, based on the attendance figures in the 2010 Soccer World Cup held<br />
in South Africa.<br />
The SERVQUAL instrument was used, consisting <strong>of</strong> 25 questions<br />
pertaining to the five dimensions on expectations and perceptions <strong>of</strong> service<br />
quality. In addition, biographic-type questions were included. After a pilottest,<br />
questionnaires were personally administered among respondents.<br />
Data Analysis<br />
The data analysis is presented in this section.<br />
187
Jeevarathnam P. Govender & Qi Pan<br />
Biographical Detail<br />
As indicated in Table 1, 66.8% <strong>of</strong> the respondents were male, with 33.2% <strong>of</strong><br />
respondents being female. It emerged that 26% <strong>of</strong> respondents were younger<br />
than 20 years old, 56.5% being between 20 to 39 years <strong>of</strong> age, 17% being<br />
between 40 and 59 years old, and 0.5% <strong>of</strong> respondents being over 60years<br />
old. 50.3% <strong>of</strong> respondents resided in Durban, 37.3% were South African, but<br />
did not reside in Durban, 4.8% <strong>of</strong> respondents were from African countries<br />
other than South Africa with 7.8% <strong>of</strong> respondents being overseas residents.<br />
Table 1: Biographical detail <strong>of</strong> Respondents<br />
Respondents n=400 Percentage<br />
Gender<br />
Male<br />
Female<br />
Total<br />
Age<br />
Under 20<br />
20-39<br />
40-59<br />
Over 60<br />
Total<br />
Regional distribution<br />
Durban area<br />
South African, but from outside Durban<br />
Other African countries<br />
Overseas<br />
Total<br />
188<br />
66.8<br />
33.2<br />
100<br />
26.0<br />
56.5<br />
17.0<br />
0.5<br />
100<br />
50.3<br />
37.3<br />
4.8<br />
7.8<br />
100<br />
The Tangibles Dimension<br />
As depicted in Table 2, the lowest expectation score applied to the<br />
attractiveness <strong>of</strong> the ticketing <strong>of</strong>fice (3.31) with the highest expectation<br />
scores applying to the bus companies having a pr<strong>of</strong>essional appearance as<br />
well as the staff dress being neat and smart (3.69). The lowest perception
… Service Quality in the Intercity Bus Transport Industry<br />
score related to the ticketing <strong>of</strong>fice not having adequate resources and<br />
capacity (2.96) and the highest perception score related to the bus companies<br />
having a pr<strong>of</strong>essional appearance (3.29). The lowest gap score (-0.33)<br />
pertained to the attractiveness <strong>of</strong> the ticket <strong>of</strong>fice, while the largest gap score<br />
(-0.51) was in respect <strong>of</strong> the ticketing <strong>of</strong>fice having adequate resources and<br />
capacity.<br />
Table 2: Tangibles<br />
Item Expectations Perceptions Gap<br />
Mean Mean<br />
The ticketing <strong>of</strong>fice<br />
being attractive<br />
3.31 2.98 -0.33<br />
Being equipped with<br />
modern technology<br />
3.48 3.09 -0.39<br />
Ticketing <strong>of</strong>fice<br />
having adequate<br />
resources and capacity<br />
3.47 2.96 -0.51<br />
Having a pr<strong>of</strong>essional<br />
appearance<br />
3.69 3.29 -0.40<br />
The dress <strong>of</strong> staff<br />
being neat and smart<br />
3.69 3.25 -0.44<br />
The Reliability Dimension<br />
As far as the reliability dimension was concerned, the ease with which a<br />
ticket can be booked had the highest expectation score (3.93) with the lowest<br />
expectation score pertaining to the bus arriving on time at the destination<br />
(3.32). The highest perception score pertained to the ease with which a ticket<br />
can be booked (3.38), with the timeous arrival <strong>of</strong> buses at the destination<br />
scoring the lowest perception score (2.59). The lowest gap score (-0.35)<br />
pertained to the bus never breaking down en route, while the largest gap<br />
score (-0.73) was in respect <strong>of</strong> the bus always arriving at the destination on<br />
time. The results are reflected in Table 3.<br />
189
Jeevarathnam P. Govender & Qi Pan<br />
Table 3: Reliability<br />
Item Expectations Perceptions Gap<br />
Mean Mean<br />
Buses always<br />
arriving at the<br />
destination on time<br />
3.32 2.59 -0.73<br />
The bus never<br />
breaking down<br />
3.30 2.95 -0.35<br />
Customers easily<br />
booking a ticket<br />
3.93 3.38 -0.55<br />
Staff satisfying<br />
customer’s requests<br />
right the first time<br />
3.67 3.21 -0.46<br />
The time table on the<br />
bus company’s<br />
website being error<br />
free<br />
3.33 2.84 -0.49<br />
The Responsiveness Dimension<br />
As indicated in Table 4, as far as expectations were concerned, the provision<br />
<strong>of</strong> timely and efficient service scored the highest (3.58), and always inform-<br />
Table 4: Responsiveness<br />
Items Expectations Perceptions Gap<br />
Mean Mean<br />
Informing passengers<br />
<strong>of</strong> change <strong>of</strong><br />
timetable and prices<br />
in advance<br />
3.36 2.67 -0.69<br />
Providing timely and<br />
efficient service<br />
3.58 3.05 -0.53<br />
Clear and helpful<br />
communication with<br />
customers<br />
3.55 3.32 -0.23<br />
190
… Service Quality in the Intercity Bus Transport Industry<br />
ming passengers <strong>of</strong> changes to timetables and prices in advance being scored<br />
the lowest (3.36). The highest perception score pertained to communication<br />
with customers being clear and helpful (3.32), while informing customers <strong>of</strong><br />
change in timetable and pricing in advance had the lowest perception score<br />
(2.67). The lowest gap score (-0.23) pertained to communication with<br />
customers being clear and helpful, while the largest gap score (-0.69) was in<br />
respect <strong>of</strong> bus companies always informing passengers <strong>of</strong> changes to<br />
timetables and prices in advance.<br />
The Assurance Dimension<br />
It emerged, as indicated in Table 5, that as far as the assurance dimension<br />
was concerned, customers feeling safe in their transactions with ticket <strong>of</strong>fice<br />
staff had the highest expectation score (3.88) with the lowest expectation<br />
score pertaining to two items, viz. staff having an in-depth knowledge <strong>of</strong><br />
their jobs, and the behaviour <strong>of</strong> staff instilling confidence in customers<br />
(3.56). The highest perception score pertained to customers feeling safe in<br />
their transactions with ticket <strong>of</strong>fice staff (3.68), with staff having an in-depth<br />
Table 5: Assurance<br />
Items Expectations Perceptions Gap<br />
Mean Mean<br />
Customers feeling safe<br />
in their transactions<br />
with ticketing <strong>of</strong>fice<br />
staff<br />
3.88 3.68 -0.20<br />
Customers feeling safe<br />
in their transactions<br />
with staff on the bus<br />
3.67 3.26 -0.41<br />
Politeness <strong>of</strong> staff 3.72 3.43 -0.29<br />
Staff having an indepth<br />
knowledge <strong>of</strong><br />
their jobs<br />
3.56 3.13 -0.43<br />
Behaviour <strong>of</strong> staff<br />
instilling confidence in<br />
customers<br />
3.56 3.14 -0.42<br />
191
Jeevarathnam P. Govender & Qi Pan<br />
knowledge <strong>of</strong> their jobs scoring the lowest perception score (3.13). The<br />
lowest gap score (-0.20) pertained to customers feeling safe in their<br />
transactions with ticket <strong>of</strong>fice staff while the largest gap score (-0.43) was in<br />
respect <strong>of</strong> staff having an in-depth knowledge <strong>of</strong> their jobs.<br />
The Empathy Dimension<br />
The findings, as indicated in Table 6, revealed that for the empathy<br />
dimension, the lowest expectation score applied to bus companies having<br />
operating hours convenient to all customers (3.39) with the highest<br />
expectation score applying to two items, viz. ease <strong>of</strong> accessing ticket <strong>of</strong>fice,<br />
and staff providing individualised attention to help customers (3.60). The<br />
lowest perception score related to getting information about the facilities and<br />
services easily (2.52) and the highest perception score related to staff<br />
providing individualised attention to help customers (3.08). The lowest gap<br />
score (-0.52) pertained to staff providing individualised attention to help<br />
Table 6: Empathy<br />
Items Expectations Perceptions Gap<br />
Mean Mean<br />
Looking after the<br />
best interests <strong>of</strong><br />
customers<br />
3.44 2.89 -0.55<br />
Having operating<br />
hours convenient to<br />
all customers<br />
3.39 2.61 -0.78<br />
Getting information<br />
about the facilities<br />
and services easily<br />
3.48 2.52 -0.96<br />
Ease <strong>of</strong> accessing<br />
ticket <strong>of</strong>fice<br />
3.60 2.83 -0.77<br />
Staff providing<br />
individualised<br />
attention to help<br />
customers<br />
3.60 3.08 -0.52<br />
192
… Service Quality in the Intercity Bus Transport Industry<br />
customers, while the largest gap score (-0.96) was in respect <strong>of</strong> getting<br />
information about the facilities and services easily.<br />
A Comparison <strong>of</strong> the Quality Dimensions<br />
Table 7 provides an indication <strong>of</strong> the mean expectation and perception<br />
values as well as the gaps with regard to the five service quality dimensions.<br />
As far as expectation was concerned, it emerged that assurance was rated as<br />
the highest (3.69), with empathy being scored the lowest (3.49). On the issue<br />
<strong>of</strong> perception, responsiveness was rated as highest (3.52), with empathy<br />
being scored the lowest (2.80). An analysis <strong>of</strong> the gap scores reveals that<br />
empathy was considered to have the smallest gap (-0.69) with<br />
responsiveness being considered as having the lowest ‘gap’. In fact, the<br />
indicated score (0.00) suggests that there was no perceived gap between<br />
expectation and perception as far as responsiveness was concerned.<br />
Table 7: Comparison <strong>of</strong> the quality dimensions<br />
Dimension Expectation Perception Gap (P-E)<br />
(Mean) (Mean)<br />
Tangibles 3.5125 3.1125 -0.4000<br />
Reliability 3.5075 2.9700 -0.5375<br />
Responsiveness 3.5200 3.5200 -0.0000<br />
Assurance 3.6925 3.3175 -0.3750<br />
Empathy 3.4900 2.8000 -0.6900<br />
Relationships among the Dimensions <strong>of</strong> Service Quality<br />
The results, as indicated in Table 8 suggest that as far as the expectation<br />
dimension was concerned, there was a strong correlation between tangibles<br />
and assurance (0.618), and a moderate correlation between tangibles and<br />
empathy (0.461). There was a moderate correlation between reliability and<br />
assurance (0.474) as well as between reliability and empathy (0.427).<br />
The correlation between responsiveness and assurance was strong<br />
(0.640) and that between responsiveness and empathy, moderate (0.587).<br />
193
Jeevarathnam P. Govender & Qi Pan<br />
Table 8: Intra-correlations <strong>of</strong> expectations<br />
Tangibles Pearson correlation<br />
Significance<br />
Reliability Pearson correlation<br />
Significance<br />
Responsiveness Pearson<br />
correlation<br />
Significance<br />
194<br />
Assurance Empathy<br />
0.618 0.461<br />
0.000 0.000<br />
0.474 0.427<br />
0.000 0.000<br />
0.640<br />
0.000<br />
0.587<br />
0.000<br />
All <strong>of</strong> the aforementioned correlations were significant at the 0.01 level and<br />
were positive.<br />
The results, as indicated in Table 9 suggest that as far as the<br />
perception dimension was concerned, there was a moderate correlation<br />
between tangibles and assurance (0.526), and a moderate correlation<br />
between tangibles and empathy (0.478). There was a moderate correlation<br />
between reliability and assurance (0.470) as well as between reliability and<br />
empathy (0.443). The correlation between responsiveness and assurance was<br />
moderate (0.428) and that between responsiveness and empathy, weak<br />
(0.239). All <strong>of</strong> the aforementioned correlations were significant at the 0.01<br />
level and positive.<br />
Table 9: Intra-correlations <strong>of</strong> perceptions<br />
Tangibles Pearson correlation<br />
Significance<br />
Reliability Pearson correlation<br />
Significance<br />
Responsiveness Pearson<br />
correlation<br />
Significance<br />
Assurance Empathy<br />
0.526 0.478<br />
0.000 0.000<br />
0.470 0.443<br />
0.000 0.000<br />
0.428<br />
0.000<br />
0.239<br />
0.000
… Service Quality in the Intercity Bus Transport Industry<br />
The Service Quality Dimensions and Biographic Variables<br />
The statistical data, as presented in Table 10, constitute a comparison <strong>of</strong><br />
means between the gender groups and expectation and perception <strong>of</strong> service<br />
quality. As far as expectation was concerned, it emerged that there was no<br />
significant difference between males and females with regard to<br />
responsiveness (p = 0.273) and assurance (p = 0.112). There was a<br />
significant difference between males and females on the dimensions <strong>of</strong><br />
tangibles (p = 0.000), reliability (p = 0.021) and empathy (p = 0.033).<br />
Table 10: Service quality dimensions and gender<br />
EXPECTATION PERCEPTION<br />
t Sig. t Sig.<br />
Tangibles 3.685 0.000 1.259 0.209<br />
Reliability 2.320 0.021 2.177 0.030<br />
Responsiveness 1.097 0.273 1.097 0.273<br />
Assurance 1.595 0.112 2.217 0.027<br />
Empathy 2.139 0.033 1.629 0.129<br />
As far as perception was concerned, the results suggest that there<br />
was no significant difference between males and females with regard to<br />
tangibles (p = 0.209), responsiveness (p = 0.273) and empathy (p = 0.129).<br />
There existed a significant difference between males and females on the<br />
dimension <strong>of</strong> reliability (p = 0.030) and assurance (p = 0.0129).<br />
Table 11 ANOVA: Service quality dimensions and age<br />
EXPECTATION PERCEPTION<br />
Mean Sig. Mean Sig.<br />
Square<br />
Square<br />
Tangibles 0.807 0.366 0.534 0.520<br />
Reliability 0.897 0.198 0.490 0.438<br />
Responsiveness 1.961 0.045 1.961 0.045<br />
Assurance 1.557 0.097 1.357 0.151<br />
Empathy 0.847 0.199 0.333 0.724<br />
195
Jeevarathnam P. Govender & Qi Pan<br />
As indicated in Table 11, the ANOVA test results reveal a<br />
significant difference among the different age groups only for the<br />
responsiveness dimension (p = 0.045 for expectation as well as perception).<br />
There were no significant differences between the age groups with regard to<br />
expectation and perception <strong>of</strong> service quality on the dimensions <strong>of</strong> tangibles,<br />
reliability, assurance and empathy.<br />
The ANOVA test results reveal that there were no significant<br />
differences among the regional groups with regard to expectation and<br />
perception <strong>of</strong> service quality on the dimensions <strong>of</strong> tangibles, reliability,<br />
responsiveness and assurance. There existed a significant difference among<br />
the regional groups only for the empathy dimension (p = 0.0387 for<br />
expectation and p = 0.035 for perception). The results are indicated in Table<br />
12.<br />
Table 12: Service quality dimensions and regional grouping<br />
EXPECTATION PERCEPTION<br />
Mean Sig. Mean Sig.<br />
Square<br />
Square<br />
Tangibles 1.290 0.166 0.309 0.727<br />
Reliability 1.231 0.093 1.197 0.084<br />
Responsiveness 0.837 0.330 0.837 0.330<br />
Assurance 0.303 0.748 0.505 0.580<br />
Empathy 1.527 0.038 2.149 0.035<br />
Reliability Analysis<br />
Cronbach’s Alpha was used as a test <strong>of</strong> internal consistency. According to<br />
Malhotra (2010: 319), in general, a coefficient <strong>of</strong> less than 0.6 suggests<br />
unsatisfactory internal consistency reliability. The results, as reflected in<br />
Table 13, suggest a high degree <strong>of</strong> internal consistency.<br />
Table 13: Cronbach Alpha Test<br />
N=400 Cronbach Alpha No. <strong>of</strong> items<br />
Expectation 0.930 25<br />
Perception 0.924 25<br />
196
… Service Quality in the Intercity Bus Transport Industry<br />
Answers to the Research Questions<br />
What are the levels <strong>of</strong> service quality on the basis <strong>of</strong> the dimensions that<br />
constitute service quality in the intercity bus transport industry in South<br />
Africa?<br />
It emerged that the largest quality gap score (-0.69) pertained to the empathy<br />
dimension, and <strong>of</strong> all the 25 items, the three items showing the largest gap<br />
score pertained to the empathy dimension. These were:<br />
• Getting information about the facilities and services easily (-0.96)<br />
• Bus companies having operating hours convenient to all customers<br />
(-0.78)<br />
• Ease <strong>of</strong> access to ticketing <strong>of</strong>fice (-0.77)<br />
The reliability dimension achieved the second largest gap score (-0.54), with<br />
the following three items showing significant gaps:<br />
• Buses arriving at the destination on time (-0.73)<br />
• Customers easily booking a ticket (-0.55)<br />
• The time table on the bus companies websites being error free<br />
(-0.49)<br />
The assurance dimension achieved the third largest gap score (-<br />
0.38), with no items under this dimension having scores that suggested a<br />
significant gap. This was followed by the tangibles dimension (gap score = -<br />
0.40), which had one item that warranted attention viz. the ticketing <strong>of</strong>fice<br />
having adequate resources and capacity (-0.51). Interestingly, although the<br />
responsiveness dimension showed no overall gap, two items had significant<br />
gap scores viz:<br />
• Informing passengers <strong>of</strong> changes in timetable and prices in advance<br />
(-0.69)<br />
• Providing timely and efficient service (-0.53)<br />
What are the relationships among the dimensions <strong>of</strong> service quality?<br />
With regards to the expectation dimension, there was a strong correlation<br />
between tangibles and assurance, and a moderate correlation between<br />
197
Jeevarathnam P. Govender & Qi Pan<br />
tangibles and empathy. There was a moderate correlation between reliability<br />
and assurance as well as between reliability and empathy. The correlation<br />
between responsiveness and assurance was strong and that between<br />
responsiveness and empathy, moderate.<br />
As far as the perception dimension was concerned, there was a<br />
moderate correlation between tangibles and assurance, and a moderate<br />
correlation between tangibles and empathy. There was a moderate<br />
correlation between reliability and assurance as well as between reliability<br />
and empathy. The correlation between responsiveness and assurance was<br />
moderate and that between responsiveness and empathy, weak.<br />
Are there significant relationships between selected demographic variables<br />
and expectations and perceptions <strong>of</strong> service quality in the intercity bus<br />
transport industry in South Africa?<br />
With regard to expectations, it emerged that there was no significant<br />
difference between males and females with regard to responsiveness and<br />
assurance. There was a significant difference between males and females on<br />
the dimensions <strong>of</strong> tangibles, reliability and empathy.<br />
As far as perception was concerned, there was no significant<br />
difference between males and females with regard to tangibles,<br />
responsiveness and empathy. There was a significant difference between<br />
males and females on the dimension <strong>of</strong> reliability and assurance.<br />
There was significant difference among the different age groups<br />
only for the responsiveness dimension for expectation as well as perception.<br />
There were no significant differences between the age groups with regard to<br />
expectation and perception <strong>of</strong> service quality on the dimensions <strong>of</strong> tangibles,<br />
reliability, assurance and empathy.<br />
There were no significant differences among the regional groups<br />
with regard to expectation and perception <strong>of</strong> service quality on the<br />
dimensions <strong>of</strong> tangibles, reliability, responsiveness and assurance. There<br />
existed a significant difference among the regional groups only for the<br />
empathy dimension.<br />
Recommendations<br />
Based on the research findings, the following recommendations are made:<br />
198
… Service Quality in the Intercity Bus Transport Industry<br />
• The intercity bus transportation system should use user-friendly<br />
printed material (e.g. area based timetables, posters and brochures)<br />
which customers can relate to. Electronic media should also be used<br />
to greater effect (e.g. electronic displays and a more comprehensively<br />
detailed website). This will address issues around empathy<br />
and tangibles in the industry.<br />
• The ticketing system should be more accessible in terms <strong>of</strong> location<br />
as well as operating hours. To this end, geographic information<br />
regarding ticketing <strong>of</strong>fices should be placed at strategic points (e.g.<br />
at tourism centres and in the media).<br />
• An online reservation system should be developed considering the<br />
cost saving associated with an electronic medium. The system<br />
should connect with strategic partners (e.g. main chain stores).<br />
• The reliability <strong>of</strong> the bus service should be improved in three ways:<br />
Firstly, a consistently aligned set <strong>of</strong> factors, processes and standards<br />
that can define timely routing should be developed. Secondly, there<br />
should be regular maintenance <strong>of</strong> the fleet as well as readily<br />
available spare equipment and parts. Thirdly, new technologies (e.g.<br />
Global Positioning) should be introduced to control routes and<br />
timings.<br />
• Changes in time and prices should be communicated quickly to<br />
customers. To this end rapid electronic media should be used. These<br />
media should take into account the needs <strong>of</strong> persons with<br />
impairments (e.g. hearing and visual).<br />
• There should be greater interaction with present as well as potential<br />
customers with a view to understanding their needs more clearly.<br />
Regular surveys should be conducted and customer complaints, fully<br />
analysed. Staff members need to be made aware <strong>of</strong> customer<br />
feedback as well as complaints so that the necessary actions can be<br />
taken.<br />
199
Jeevarathnam P. Govender & Qi Pan<br />
• Detailed policies and procedures should be developed so that the<br />
variability in customer treatment is reduced. There should be<br />
formalised training in the area <strong>of</strong> customer service. Recruitment and<br />
selection should take cognizance <strong>of</strong> the element <strong>of</strong> customer service.<br />
• There should be closer co-operation between the bus companies<br />
(operators) so that there can be a more synchronised approach to<br />
operations e.g. sharing passenger loads during conditions <strong>of</strong> undercapacity<br />
as well as excess capacity.<br />
Conclusion<br />
The study sought to assess the level <strong>of</strong> service quality in the intercity bus<br />
transport industry. A literature survey was undertaken in order to determine<br />
the theoretical underpinnings <strong>of</strong> service quality. The empirical study was<br />
conducted using the SERVQUAL model. Service quality was measured on<br />
the basis <strong>of</strong> the 25 items that constitute the five dimensions <strong>of</strong> service<br />
quality. The relationships among the dimensions <strong>of</strong> service quality were<br />
analysed. The relationship between selected biographical variables and<br />
expectations and perceptions <strong>of</strong> service quality was examined.<br />
Recommendations for improvement in service quality have been made.<br />
References<br />
Bebco CP 2000. Service Intangibility and its Impact on Customer<br />
Expectations <strong>of</strong> Service Quality. <strong>Journal</strong> <strong>of</strong> Services Marketing 14,1: 9-<br />
26.<br />
Brady MK, JJ Cronin & RR Brand 2002. Performance-only Measurement <strong>of</strong><br />
Service Quality: A Replication and Extension. <strong>Journal</strong> <strong>of</strong> Business<br />
Research 55,1: 17-31.<br />
Bruhn M and D Georgi 2006. Services Marketing: Managing the Service<br />
Value Chain. London: Pearson Education Limited.<br />
Curry A & E Sinclair 2002. Assessing the Quality <strong>of</strong> Physiotherapy Services<br />
Using Servqual. International <strong>Journal</strong> <strong>of</strong> Health Care Quality<br />
Assurance 15,5: 197- 205.<br />
200
… Service Quality in the Intercity Bus Transport Industry<br />
Fitzsimmons JA & MJ Fitzsimmons 2006. Service Management:<br />
Operations, Strategy, Information Technology. 5 th Edition. Singapore:<br />
McGraw-Hill.<br />
Getting you from A2B in South Africa 2006. Available at: http://<br />
www.visa.org.za/transport.htm.<br />
Gronroos C 2000. Service Management and Marketing: A Customer<br />
Relationship Management Approach. 2 nd Edition. Chichester: John<br />
Wiley & Sons.<br />
Gronroos C 2001. The Perceived Service Quality Concept – A Mistake?<br />
Managing Service Quality 11,3: 150-152.<br />
Le H, Y Lee & D Yoo 2000. The Determinants <strong>of</strong> Perceived Service Quality<br />
and its Relationship with Satisfaction. <strong>Journal</strong> <strong>of</strong> Services Marketing<br />
14,2: 217 – 231.<br />
Leedy PD & JE Omrod 2005. Practical Research: Planning and Design. 7 th<br />
Edition. Upper Saddle River, NJ.: Prentice Hall.<br />
Lovelock C & L Wright 2002. Principles <strong>of</strong> Service Marketing and<br />
Management. 2 nd Edition. Upper Saddle River, NJ.: Prentice Hall.<br />
Malhotra N 2010. Marketing Research – An Applied Orientation. New<br />
York: Pearson.<br />
Metters RK, M King-Metters, M Pullman & S Walton S 2006. Successful<br />
Service Operations Management. 2 nd Edition. Singapore: South<br />
Western.<br />
MORI 2002. Public Service Reform: Measuring and Understanding<br />
Customer Satisfaction. Available at: http://www.mori.com/pubinfo/<br />
rd/opsr.pdf.<br />
National Department <strong>of</strong> Transport. National Department <strong>of</strong> Transport<br />
Strategic Plan 2006-2009. 2006. Available at: http://www. transport.<br />
gov.za/library/plan-f.html.<br />
No financial Worries about 2010. 2006. Available at: http://www.capetown.org.<br />
Nowacki MM 2005. Evaluating a Museum as a Tourist Product Using the<br />
Servqual Method. Museum Management and Curatorship 20: 235 -<br />
250.<br />
Ongkittikul S & H Geerlings 2006. Opportunities for Innovation in Public<br />
Transport: Effects <strong>of</strong> Regulatory Reforms on Innovative Capabilities.<br />
Transport Policy 13: 283-293.<br />
201
Jeevarathnam P. Govender & Qi Pan<br />
Robledo MA 2001. Measuring and Managing Service Quality: Integrating<br />
Customer Expectations. Managing Service Quality 11,1: 22-31.<br />
South Africa Yearbook 2005/6. 2005. Pretoria: Government Printer<br />
Transport Crisis Could Hinder 6% Economic Growth. Available at:<br />
http://www.marketingweb.co.za.<br />
Truong T & D Foster 2006. Using Holstat to Evaluate Tourist Satisfaction at<br />
Destinations: The Case <strong>of</strong> Australian Holidaymakers in Vietnam.<br />
Tourism Management 27: 842-855.<br />
Zeithaml VA, MJ Bitner & DD Gremler 2006. Services Marketing:<br />
Integrating Customer Focus across the Firm. 4 th Edition. New York:<br />
McGraw-Hill.<br />
Zeithaml VA, A Parasuraman & A Malhotra 2001. A Conceptual<br />
Framework for Understanding e-Service Quality: Implications for Future<br />
Research and Managerial Practice. MSI Working Paper Series, No. 00-<br />
115: 1-9.<br />
Jeevarathnam P Govender<br />
Department <strong>of</strong> Marketing, Retail and Public Relations<br />
Durban <strong>University</strong> <strong>of</strong> Technology<br />
Durban, South Africa<br />
govendej@dut.ac.za<br />
Qi Pan<br />
Department <strong>of</strong> Marketing, Retail and Public Relations<br />
Durban <strong>University</strong> <strong>of</strong> Technology<br />
Durban, South Africa<br />
qpan@gmail.com<br />
202
Perceptions <strong>of</strong><br />
International Students on the<br />
Challenges <strong>of</strong> Diversity Management at a<br />
South African <strong>University</strong><br />
Preesha Maharaj<br />
Rubeshan Perumal<br />
Sadhasivan Perumal<br />
Abstract<br />
Between the years 2009 and 2010, an average <strong>of</strong> approximately 5400<br />
applications were received at the <strong>University</strong> <strong>of</strong> <strong>KwaZulu</strong>-<strong>Natal</strong> from<br />
international students (Division <strong>of</strong> Management Information 2010).<br />
Knowledge <strong>of</strong> international students is essential to higher education<br />
institutions. It can be said that international students have become a vibrant<br />
part <strong>of</strong> the diversity in South Africa’s education sector and provide immense<br />
benefits to our economy, educational institutions, local students and<br />
educators. However, there exists a paucity <strong>of</strong> research on the post-choice<br />
perceptions <strong>of</strong> international students. The purpose <strong>of</strong> the study was to assess<br />
the post-choice perceptions <strong>of</strong> international students at UKZN, with special<br />
references to diversity challenges. A cross-sectional/survey design using<br />
questionnaires, with both descriptive and analytical components was<br />
employed. The researcher randomly selected 300 students from an updated<br />
listing <strong>of</strong> the registered international students chosen by the generation <strong>of</strong><br />
random numbers to achieve the objectives <strong>of</strong> the study. The researcher<br />
surveyed the 300 students which were easiest to get a hold <strong>of</strong> who were<br />
contacted via email and invited to participate in the study. The responses <strong>of</strong><br />
280 international students were received and analysed. All data was<br />
processed and analysed using the SPSS version 15.0 (SPSS Inc., Chicago,<br />
<strong>Alternation</strong> Special Edition 4 (2011) 203 – 227<br />
ISSN 1023-1757<br />
203
Preesha Maharaj, Rubeshan Perumal & Sadhasivan Perumal<br />
Illinois, USA). For all statistical comparisons, the 5% significance level<br />
(two-tail) was used. Ethical clearance was obtained from the Human<br />
Research Ethics Committee (HREC) <strong>of</strong> the <strong>University</strong> <strong>of</strong> <strong>KwaZulu</strong>-<strong>Natal</strong>.<br />
The identified diversity challenges experienced by international students at<br />
higher education institutions were found to be: language and<br />
communication; social interaction across race/ethnicity; discrimination;<br />
Pedagogical approaches; finances; interracial conflict/tension; curriculum;<br />
assessment methods; lifestyle adjustment; campus services and facilities;<br />
classroom diversity; staff interaction and lastly, campus administration and<br />
policies. The results <strong>of</strong> this study established that financial issues<br />
(insufficient financial aid and part-time/casual jobs); a lack <strong>of</strong> platforms for<br />
social and interracial mixing; insufficient campus residency; and the<br />
unpreparedness <strong>of</strong> host families on arrival are the predominant diversity<br />
challenges experienced by international students at UKZN. Therefore, the<br />
writer attempted to provide recommendations from the results and findings<br />
to ensure a truly diverse and united university, some <strong>of</strong> which are prioritising<br />
racial cohesion and inter-racial activity at UKZN, and looking into providing<br />
opportunities/assistance to secure casual/part-time jobs at university for<br />
international students.<br />
Keywords: International students, Higher Education, <strong>University</strong>, Culture,<br />
Diversity.<br />
Introduction<br />
International students represent an increasing emerging group <strong>of</strong> students at<br />
all major higher education institutions around the world. This can be<br />
attributed, in part, to the rapid globalisation trends over the past decade, and<br />
the growing desire <strong>of</strong> students to maximise the experience <strong>of</strong> their higher<br />
education and training. The growing appeal <strong>of</strong> international study is a now<br />
well documented phenomenon, and South Africa’s place on the international<br />
map <strong>of</strong> possible destinations is still poorly understood. More importantly,<br />
there exists a paucity <strong>of</strong> information <strong>of</strong> the experiences and challenges <strong>of</strong><br />
international students who have studied here or who are currently studying<br />
here.<br />
Information on international students, their backgrounds,<br />
expectations, and perceptions is essential to higher education institutions.<br />
204
The Challenges <strong>of</strong> Diversity Management at a South African <strong>University</strong><br />
Their expectations and perceptions are constantly changing as the<br />
environment, the demands <strong>of</strong> society and the economy evolve. Therefore, it<br />
is important for universities to keep abreast with international students to<br />
ensure that all expectations <strong>of</strong> international students are being met and that<br />
all the universities’ goals relating to internationalization (i.e. redesigning the<br />
curricula, promoting internationalization and forging strategic partnerships)<br />
are achieved.<br />
On a global scale, people, technology and ideas are moving steadily<br />
across borders at increasing rates. One <strong>of</strong> the most important changes is that<br />
international students are becoming more interested in learning new<br />
languages, participating in cross-cultural interactions and adapting their<br />
skills to various situations. However, the challenge is for higher education<br />
institutions to meet the expectations <strong>of</strong> international students faced in a<br />
globalised education market (educational and non-educational services) and<br />
to coordinate these multiple efforts so they have a better impact on all<br />
students, as well as the institution.<br />
Being part <strong>of</strong> a widely diverse environment can assist international<br />
students’ personal development and influence their campus involvements<br />
and activities. It was stated by Milem, Chang and Antonio (2005:5) that high<br />
levels <strong>of</strong> interracial interaction between students can be linked to a set <strong>of</strong><br />
institutional practices and supportive campus climate which will in turn<br />
allow students to broaden their knowledge and acceptance <strong>of</strong> students from<br />
diverse cultures and backgrounds.<br />
Therefore, this study aims to assess the post-choice perceptions <strong>of</strong><br />
international students at UKZN, with special references to diversity<br />
challenges and to <strong>of</strong>fer recommendations for an improved learning<br />
institution. The information gathered will be useful to higher education<br />
institutions in <strong>of</strong>fering a conceptual plan <strong>of</strong> best practices that contribute to<br />
accommodating and maximizing benefits for international students with<br />
regards to diversity management.<br />
International Students<br />
The Institute <strong>of</strong> International Education (2004:7) suggests a possible<br />
definition <strong>of</strong> an international student is an individual who has relocated to<br />
another country mainly for study purposes- however it must be noted that<br />
205
Preesha Maharaj, Rubeshan Perumal & Sadhasivan Perumal<br />
there are various kinds <strong>of</strong> international students which may include students<br />
undertaking distance learning programmes by an institution in another<br />
country or students registered in branch programmes facilitated by faculty<br />
from another country. Sekuler and Blake (2002) as cited by Mohammed<br />
(2009:7) note that studying and analyzing the background <strong>of</strong> people, how<br />
they perceive diversity and what they expect in terms <strong>of</strong> diversity helps in<br />
exploring their viewpoints about the multiplicity <strong>of</strong> cultures as well as the<br />
gain <strong>of</strong> unity. They further mention that studying perception can enable<br />
leaders to create strategies that ensure optimal perceptual outcomes.<br />
South Africa is said to be emerging as one <strong>of</strong> the world's most<br />
popular study destinations. This is demonstrated in the rapidly increasing<br />
number <strong>of</strong> international students. According to the provisional Department<br />
<strong>of</strong> Education figures, as stated in the Higher Education South Africa booklet,<br />
since 1994, there has been a remarkable increase in international students<br />
from 12600 to over 64000 in 2008. This is almost 8% <strong>of</strong> a total <strong>of</strong> 800 000<br />
students at the country’s 23 public universities. Therefore, it is not<br />
unexpected that 71% <strong>of</strong> international students are from neighbouring SADC<br />
countries where English is commonly spoken – 45718 in 2008, along with<br />
15% from the rest <strong>of</strong> Africa, and 11% from other continents.<br />
Due to the use <strong>of</strong> English as the main language <strong>of</strong> instruction, the<br />
close proximity to most sub-Saharan African countries, reasonable fees and<br />
a lower cost <strong>of</strong> living, South Africa has become an exciting study<br />
destination. South Africa also boasts accessible and internationally<br />
recognized qualifications with a large higher education sector that is<br />
becoming a leader for high quality tertiary education relevant to the demands<br />
<strong>of</strong> a globalizing world (Yes-Asia Consultation 2001).<br />
According to the <strong>University</strong> <strong>of</strong> <strong>KwaZulu</strong>-<strong>Natal</strong> Strategic Plan (2007-<br />
2016: 7) the university mission is as follows, ‘A truly South African<br />
university that is academically excellent, innovative in research, and<br />
critically engaged with society’.<br />
According to the UKZN Division <strong>of</strong> Management Information<br />
(2010), the number <strong>of</strong> international students has been consistent over the<br />
past five years until 2010 when it dropped to 5%.<br />
206
The Challenges <strong>of</strong> Diversity Management at a South African <strong>University</strong><br />
Figure 1: International Student Enrolments at the <strong>University</strong> <strong>of</strong><br />
<strong>KwaZulu</strong>-<strong>Natal</strong> for 2006 – 2010 Source: Division <strong>of</strong> Management<br />
Information (2010)<br />
According to the Division <strong>of</strong> Management Information (2010),<br />
international students attending UKZN represent over 100 countries<br />
worldwide and currently, only 640 out <strong>of</strong> 1 920 have English as their home<br />
language.<br />
According to Arambewela and Hall (2009:12) some factors that affect<br />
the perceptions, choice <strong>of</strong> study destination and satisfaction <strong>of</strong> international<br />
students are:<br />
• Education: The education construct highlights the fact that feedback<br />
from lecturers, good access to lecturers and quality <strong>of</strong> teaching are<br />
perceived to be the most important variables influencing student<br />
satisfaction.<br />
• Social: The counselling services, social activities, close working<br />
relationships with other students and international orientation<br />
programs are considered most important variables within the social<br />
construct that influence student satisfaction.<br />
• Technology: High expectations are formed by students, given the<br />
promises made by universities through their promotional material<br />
207
Preesha Maharaj, Rubeshan Perumal & Sadhasivan Perumal<br />
and local agents or consultants in regard to the availability <strong>of</strong> basic<br />
facilities such as computer equipment.<br />
• Economic: Variables such as casual jobs, migration opportunities,<br />
fees and the cost <strong>of</strong> living are considered within the economic<br />
construct.<br />
• Accommodation: It was found that international students expect<br />
easily available student accommodation at a reasonable cost by<br />
universities or by private agencies which meet their minimum<br />
standards <strong>of</strong> comfort and conducive learning environments.<br />
• Safety: International students expect universities to take sufficient<br />
safety and security precautions as potential students and their<br />
families are becoming more critical when choosing their educational<br />
institutions and lastly,<br />
• Prestige and image: A high international image and the prestige <strong>of</strong> a<br />
university are attractive to students as it is expected that such image<br />
and prestige would create better career opportunities for them. These<br />
factors should be well addressed by a university as many challenges<br />
may arise for international students from these factors.<br />
The following findings have been noted as challenges experienced by<br />
international students at higher education institutions:<br />
• Language and Communication- Language limitations may make it<br />
difficult for international students to understand what is expected <strong>of</strong><br />
them by lecturers and to participate in class discussions (Trigwell &<br />
Shale 2004:13). They go on to say that it is expected for instructors<br />
to deliver content by using use suitable language as the medium. It<br />
was said by Cross (2004:86) that the workload burden <strong>of</strong> foreign<br />
students could be indirectly increased by language difficulties. A<br />
key issue with language is the challenges that may arise by lecturers’<br />
language types and genres i.e. unfamiliar concepts, acronyms (Errey<br />
1994 as cited in Ryan & Hellmundt 2003:11).<br />
• Social interaction across race/ethnicity- It was said when forming<br />
social networks in a foreign country with diverse races and cultures,<br />
international students may feel helpless (Krause 2005). Ryan et al.<br />
208
The Challenges <strong>of</strong> Diversity Management at a South African <strong>University</strong><br />
(2003:12) went on to say that establishing friendships in their new<br />
environment may be a challenge and that some tend to only socialize<br />
with other students from their home country.<br />
• Discrimination<br />
Kossek, Lobel and Brown (1996: 167) state that a common barrier to<br />
international students in a foreign institution is discrimination- this is<br />
another factor that may occur on various levels between students, staff,<br />
faculty etc i.e. gender, cultural, racial, sexual. Sadri and Tran (2002: 234)<br />
also state that this can cause high levels <strong>of</strong> alienation, dissatisfaction and<br />
exclusion.<br />
• Pedagogical Approaches<br />
According to the work <strong>of</strong> Errey (1994) as cited in Ryan et al. (2003:10)<br />
sources <strong>of</strong> difficulties posed for international students may be through the<br />
traditional question-answer conventions between teachers and students; the<br />
mismatch between the lecturer’s teaching style and the student’s learning<br />
style or the appropriateness <strong>of</strong> the curriculum to international students.<br />
Davis (1993:22) states that each individual looks at the world differently and<br />
the approaches in which each student learns may be influenced by the way<br />
their unique, individual personality perceives the world.<br />
• Finances<br />
Another major challenge facing international students is financial pressure,<br />
especially the students who do not receive financial aid and have costs such<br />
as living expenses, textbooks and tuitions (Veloutsou et al. 2004:27). They<br />
went on to state that the exchange rate between currencies could be high for<br />
certain international students coming from developing countries.<br />
• Interracial Conflict/Tension<br />
The racially and ethnically diverse institution can create tension, isolation,<br />
and negativity if not properly managed. By itself the diverse university<br />
cannot produce the positive results <strong>of</strong> which it is capable (Milem et al.<br />
2005:22). A study was conducted in USA by Hurtado (1992). She states that<br />
the research literature suggests that instances <strong>of</strong> overt racial conflict should<br />
not be seen as isolated incidents or an abnormality but should be viewed as<br />
209
Preesha Maharaj, Rubeshan Perumal & Sadhasivan Perumal<br />
an indicator <strong>of</strong> a more general difficulty <strong>of</strong> unsettled racial matters in<br />
universities and in society as a whole.<br />
• Curriculum<br />
Ryan et al. (2003:16) argues that a source <strong>of</strong> difficulty can be the<br />
appropriateness <strong>of</strong> the curriculum to international students. Schneider<br />
(1990:18) also states that in the presence <strong>of</strong> a diverse student body,<br />
disequilibrium as well as a climate <strong>of</strong> campus exclusion may be caused by a<br />
lack <strong>of</strong> diverse perspectives in the curriculum.<br />
• Assessment Methods<br />
Brown (2001:7) mentions that fairly assessing a diverse mix <strong>of</strong> students is<br />
integral in higher education. Feedback and assessment are both central<br />
components <strong>of</strong> learning and methods in both can pose problems for<br />
international students unfamiliar to the university system. Generally<br />
speaking, larger classes mean a more diverse and complex student mix.<br />
Spack (1997:9) states that, ‘It is useful where possible to develop student<br />
skills and understanding related to the assessment requirements prior to their<br />
undertaking assessment tasks in order to lessen the marking workload<br />
associated with poor quality submissions’.<br />
• Lifestyle Adjustment<br />
Existing research has highlighted that the adjustment <strong>of</strong> international<br />
students is influenced by their assimilation <strong>of</strong> a country’s culture which<br />
poses as a significant factor. Gordon (1964) as cited in Doble and Supriya<br />
(2011:27) asserts that, ‘an immigrant is assimilated as soon as he has shown<br />
that he can get on in the country; that is, the immigrant has adapted to the<br />
lifestyle and cultural conditions <strong>of</strong> the host country. This includes the<br />
development <strong>of</strong> a basic pr<strong>of</strong>iciency in the language <strong>of</strong> the host country as<br />
well as a basic level <strong>of</strong> knowledge <strong>of</strong> native customs and values’.<br />
• Campus Services and Facilities<br />
The expectations <strong>of</strong> international students change as the economy and<br />
globalised requirements change. They <strong>of</strong>ten have basic expectations <strong>of</strong><br />
facilities and campus services. A study done by Ward and Masgoret<br />
(2004:22) says that international students expect to have necessary services<br />
210
The Challenges <strong>of</strong> Diversity Management at a South African <strong>University</strong><br />
and facilities available to them i.e. computing services, counseling,<br />
accommodation services, library services, international student <strong>of</strong>fice,<br />
student orientation services, sports and recreational facilities, health<br />
services, clubs and societies, financial advice services and student<br />
association to name a few.<br />
• Classroom Diversity<br />
It can be said that a diverse classroom <strong>of</strong> international students provides<br />
opportunities for learning about other cultures, values and viewpoints, and<br />
leads to a better democratic education. However, Brown and Dobbins (2004:<br />
158) as cited in Morris (2004:31), find that ‘contexts in which stereotypes<br />
are salient may detrimentally affect the performance <strong>of</strong> students <strong>of</strong> colour as<br />
well as their expectations for their experience in the classroom’.<br />
• Staff Interaction<br />
In a tertiary institution, developing a suitable environment where students<br />
are able to interact with their lecturers is imperative. It is also useful to<br />
appoint volunteers from senior students to be hosts <strong>of</strong> the new international<br />
students who enter the university Hellsten and Prescot (2004:32). Gundara<br />
(2000:25) argues that lecturers are responsible for not only mentoring and<br />
teaching students from diverse cultural backgrounds but also have the<br />
responsibility to educate these students on how to live in a society <strong>of</strong> diverse<br />
cultures.<br />
• Campus Administration and Policies<br />
In the case <strong>of</strong> campus policies, Milem et al. (2005:17) said that an<br />
institution’s commitment to diversity should permeate policy in all areas <strong>of</strong><br />
institutional life.<br />
Campus administration should encompass well-organized processes<br />
and diversity enriched systems to assist the enrollment <strong>of</strong> international<br />
students as well as the transfer <strong>of</strong> course credits as it was states by Cubillo,<br />
Sanchez and Cervino (2006:11) that these processes are the first impression<br />
students acquire <strong>of</strong> the institution which <strong>of</strong>ten influences their expectations<br />
and attitude towards the institution upon arrival. A generic model for<br />
campus diversity has been used in this study and is presented.<br />
211
Preesha Maharaj, Rubeshan Perumal & Sadhasivan Perumal<br />
Figure 2: A Generic Campus Diversity Model for Universities. Source:<br />
Hurtado and colleagues (1998; 1999) as cited in Milem et al. (2005:16)<br />
Diversity Management<br />
South African universities are faced with a challenge <strong>of</strong> adapting educational<br />
and non-educational factors to the highly diverse population <strong>of</strong> international<br />
students. According to Cross (2004:392) in Higher Education settings<br />
diversity means, ‘Opening up the university to different people, all interested<br />
in studying at this university. It means that all staff should be able to meet<br />
the needs <strong>of</strong> each individual. It means accommodating as many people as<br />
possible with their differences. It means wishing to know about the other. It<br />
means different things to different institutions’.<br />
Purposes <strong>of</strong> Managing Diversity in Higher Education<br />
Managing diversity can be a multidimensional management approach<br />
achieved by understanding the perceptions <strong>of</strong> diversity. However, it is<br />
essential for the purpose <strong>of</strong> this study to understand why diversity is so<br />
important at university and what benefits it creates for the international<br />
student. Eight reasons are <strong>of</strong>fered by Thompson and Cuseo (2009:4):<br />
1. ‘Diversity expands worldliness’. It is said that campus may be the<br />
first time one has the opportunity to have proper interaction with a<br />
diverse group <strong>of</strong> people. In many cases, whether one tries or not,<br />
groups <strong>of</strong> people are <strong>of</strong>ten segregated from other groups, be it<br />
212
The Challenges <strong>of</strong> Diversity Management at a South African <strong>University</strong><br />
churches, schools, residential areas etc. However, campus <strong>of</strong>fers<br />
people the opportunity to connect with various groups <strong>of</strong> people<br />
2. ‘Diversity enhances social development’. In the event that an<br />
individual is given the chance to interact with various groups <strong>of</strong><br />
people, it <strong>of</strong>fers the opportunity to broaden one’s social horizons by<br />
expanding the pool <strong>of</strong> people with whom one can associate and<br />
develop relationships. This also <strong>of</strong>fers one stimulating and<br />
interesting conversations with people who are different to them<br />
3. ‘Diversity prepares students for future career success’. According<br />
to Jayakumar (2008:618), major American businesses have made<br />
clear that the skills needed in today’s increasingly global market<br />
place can only be developed from college through exposure to<br />
widely diverse people, cultures, ideas and viewpoints. In other<br />
words, the importance <strong>of</strong> managing diversity is crucial in higher<br />
education in such a way that it prepares students for the workplace.<br />
A study by Bikson and Law (1994:19) shows that colleges in the US<br />
are failing to develop students who can work effectively with<br />
individuals whose norms, preferences, beliefs, styles and values are<br />
different from their own.<br />
4. ‘Diversity prepares students for work in a global society’. It is a<br />
certainty that no matter what job one gets into, or what pr<strong>of</strong>ession<br />
one enters, they will encounter working with clients, customers,<br />
coworkers, employees and employers from diverse backgrounds-<br />
worldwide. Jayakumar (2008:620) stated that racial and ethnic<br />
diversity is associated with ‘active thinking skills, intellectual<br />
engagement and motivation, and variety <strong>of</strong> academic skills’. In<br />
addition, many students support the fact that managing cultural<br />
diversity has a positive impact on intellectual and social skills, racial<br />
and ethnic diversity is also associated with growth in leadership<br />
skills, cultural awareness and cross-racial understanding (Astin<br />
1993:189). Students believe that these benefits are gained when<br />
educated in a culturally diverse environment and promotes personal<br />
growth.<br />
213
Preesha Maharaj, Rubeshan Perumal & Sadhasivan Perumal<br />
5. ‘Interactions with people different from ourselves increase our<br />
knowledge base’. Experience and research have <strong>of</strong>ten indicated that<br />
people learn more from people who are different to them opposed to<br />
people who are similar. This can be thought <strong>of</strong> as- when a person<br />
encounters new knowledge or material, they ‘think harder’,<br />
therefore, they will do the same when they meet and interact with<br />
diverse people. Bikson and Law (1994:20) confirm this point by<br />
stating that the most is learnt from those whose experiences, beliefs,<br />
and perspectives are different from our own, and these lessons can<br />
be taught best in a richly diverse intellectual and social<br />
environment.<br />
6. ‘Diversity promotes creative thinking’. Having a multi-perspective<br />
mind has advantage. Diversity contributes to expanding one’s<br />
capacity for viewing problems or issues from multiple angles and<br />
vantage points. ‘These diverse vantage points work to your<br />
advantage when you encounter new problems in different contexts<br />
and situations. Rather than viewing the world through a single-focus<br />
lens, you are able to expand your views and consider multiple<br />
options when making decisions and weighing issues <strong>of</strong>, for example,<br />
morality and ethics’ (Thompson & Cuseo 2009:23).<br />
7. ‘Diversity enhances self-awareness’. People with different<br />
experiences and backgrounds <strong>of</strong>fer more to learn from and can<br />
sharpen one’s self-insight and self-knowledge by comparing and<br />
contrasting their backgrounds and life experiences with the<br />
experiences <strong>of</strong> others. When one is more self-aware, they are more<br />
capable <strong>of</strong> making well thought out and informed decisions about<br />
their pr<strong>of</strong>essional and academic future.<br />
8. ‘Diversity enriches the multiple perspectives developed by a liberal<br />
arts education’. It is known that people <strong>of</strong>ten become self-indulged<br />
and tend to move away from an afro-centric approach to life.<br />
However, the power <strong>of</strong> a general education is magnified by diversity<br />
by contributing to the liberation <strong>of</strong> people. When a person moves<br />
beyond themselves, they are able to gain a panoramic angle <strong>of</strong> the<br />
214
The Challenges <strong>of</strong> Diversity Management at a South African <strong>University</strong><br />
surrounding world and a more complete view <strong>of</strong> where and how they<br />
fit in.<br />
Diversity and Higher Education<br />
‘Over the course <strong>of</strong> three and a half decades, the concept <strong>of</strong> diversity and its<br />
educational agenda have evolved to encompass a broad set <strong>of</strong> purposes,<br />
issues, and initiatives on college campuses’ (Milem et al. 2005:23). Higher<br />
Education should uphold a multifocal approach that incorporates the success<br />
<strong>of</strong> underrepresented students, a platform for change and climate, research<br />
and educational requirements that teaching all students from a diverse<br />
society involves, and lastly institutional viability and vitality. Some <strong>of</strong> the<br />
challenges <strong>of</strong> Diversity in Higher Education are outlined below.<br />
Smith (1995:12) identified four distinct challenges <strong>of</strong> diversity in<br />
the context <strong>of</strong> Higher Education. Utilizing this framework, Table 1 depicts<br />
the problems and opportunities associated with each <strong>of</strong> the various<br />
challenges.<br />
Representation focuses on the presence or absence <strong>of</strong> particular<br />
groups in the college campus and seeks ways to increase their number. This<br />
challenge is the outcome <strong>of</strong> the accumulated distortions <strong>of</strong> the past.<br />
The second challenge, campus climate, identifies the fundamental<br />
connections between educational attainment and institutional environment,<br />
and aims to change those aspects <strong>of</strong> campus climate that prove inappropriate<br />
for a particular group <strong>of</strong> students. Here, the challenge is largely due to the<br />
common stereotypes and prejudices. Smith (1995:12) suggests that merely<br />
making provisions to accommodate disadvantaged students will not suffice<br />
and that diversity-positive initiatives should be considered for creating a<br />
supportive climate, giving disadvantaged students a feeling <strong>of</strong> empowerment<br />
and meaning.<br />
The third challenge, educational mission, conveys the disparity in<br />
the performances <strong>of</strong> students from disadvantaged backgrounds who are<br />
under- or unprepared specifically with deplorable schooling. It was said by<br />
Smith (1995:13) that a realization <strong>of</strong> all students benefiting from an<br />
education that promotes the understanding and capability for a multiperspective,<br />
multi-racial and multi-gendered world is a challenge.<br />
215
Preesha Maharaj, Rubeshan Perumal & Sadhasivan Perumal<br />
The fourth challenge as stated by Smith (1995:14) is transformation<br />
and joins all other dimensions <strong>of</strong> diversity in a primary review <strong>of</strong> the<br />
university/ educational institutions organizing conjectures- educational,<br />
intellectual, institutional and societal. The dilemma <strong>of</strong> discrimination and<br />
widespread inequality needs to be solved with involvement <strong>of</strong> the<br />
community and social sensitive community for improved integration.<br />
Table 1: A Framework for Management <strong>of</strong> Diversity Source: Smith<br />
(1995:14)<br />
PROBLEMS CHALLENGES OPPORTUNITIES<br />
Accumulated<br />
distortions <strong>of</strong><br />
the past<br />
Prejudice and<br />
Stereotype<br />
Disparity in<br />
performance<br />
Inequality and<br />
discrimination<br />
Representation Reservation<br />
Positive discrimination<br />
Quota<br />
Campus climate Diversity positive<br />
initiatives<br />
Warm and supportive<br />
Empowerment<br />
Educational<br />
mission<br />
216<br />
Reform curriculum<br />
Remedial education<br />
Provide life skills<br />
Transformation Social sensitivity<br />
Involvement <strong>of</strong> community<br />
Integration<br />
Diversity at the <strong>University</strong> <strong>of</strong> <strong>KwaZulu</strong>-<strong>Natal</strong><br />
South Africa has an extensive Higher Education sector <strong>of</strong> which UKZN is a<br />
member. It consists <strong>of</strong>, ‘21 Universities, l5 Universities <strong>of</strong> Technology, 50<br />
Teacher Training Colleges and scores <strong>of</strong> Agricultural and Nursing Colleges’<br />
(UKZNTOUCH 2010:5). In addition, there is a growing private tertiary<br />
sector, whose institutions range from Colleges to Universities. The research<br />
output generated by the 12 500 full time academics and a similar number <strong>of</strong>
The Challenges <strong>of</strong> Diversity Management at a South African <strong>University</strong><br />
researchers working for research councils, institutes and companies, is the<br />
biggest in Africa - competing with the best in many developed countries.<br />
UKZN is ranked as one <strong>of</strong> the top ten universities in South Africa.<br />
An independent project known as the Google College Rankings ranks<br />
universities and colleges around the world using Google. According to the<br />
Google College Rankings (2010), the <strong>University</strong> <strong>of</strong> <strong>KwaZulu</strong>-<strong>Natal</strong> ranks<br />
seventh in the country. According to the UKZN website, the university is<br />
committed to academic excellence and advances knowledge through globally<br />
competitive teaching, learning, scholarship, research, innovation and<br />
academic freedom. UKZN has nearly 400 000 students and is a truly South<br />
African university that reflects the diverse society in which it is situated.<br />
UKZN embraces internationalisation and diversity as a vital element <strong>of</strong> its<br />
goals and values.<br />
<strong>University</strong> Goals<br />
According to the <strong>University</strong> <strong>of</strong> <strong>KwaZulu</strong>-<strong>Natal</strong> Strategic Plan (2007-2016:<br />
12) the <strong>University</strong> will strive for African-Led Globalization by:<br />
• Redesigning the curricula<br />
‘Faculties and Schools will design their curricula to incorporate indigenous<br />
and local knowledge and knowledge systems as far as possible’.<br />
• Promoting internationalization<br />
‘The <strong>University</strong> will support carefully selected student exchange<br />
programmes that bring students from other countries to the <strong>University</strong> and<br />
further expand our students’ international opportunities, particularly<br />
exposure to Africa, to enrich the learning experience for all’.<br />
• Forging strategic partnerships<br />
‘Strategic partnerships at the continental and global levels are critical in<br />
placing UKZN’s African scholarship in the wider international arena and in<br />
taking on some <strong>of</strong> the challenges <strong>of</strong> producing African scholarship’.<br />
Research Methodology<br />
The objectives <strong>of</strong> this study is to identify the challenges regarding diversity<br />
experienced by international students at higher education institutions; assess<br />
217
Preesha Maharaj, Rubeshan Perumal & Sadhasivan Perumal<br />
the perceptions <strong>of</strong> international students regarding which <strong>of</strong> these challenges<br />
are the most predominant at UKZN and lastly, make recommendations<br />
accordingly to improve the perceptions and experiences <strong>of</strong> international<br />
students regarding diversity at UKZN.<br />
Study design and sampling: In this study, the questionnaire survey was<br />
used making it impractical to question all 1920 international students in the<br />
population. Therefore, it was necessary to draw a sample. The researcher<br />
distributed questionnaires to the International Students Office at each <strong>of</strong> the<br />
five campuses making up UKZN. The Division <strong>of</strong> Management Information<br />
provided the researcher with an updated listing <strong>of</strong> enrolled international<br />
students at UKZN. International students were randomly chosen by the<br />
generation <strong>of</strong> random numbers to achieve the objectives <strong>of</strong> the study. They<br />
were then emailed and invited to participate in the study by picking up and<br />
returning the questionnaire from the International Students Office.<br />
Statistical analysis: All statistical analysis has been conducted using SPSS<br />
version 15.0 (SPSS Inc., Chicago, Illinois, USA). For all statistical<br />
comparisons, the 5% significance level has been used.<br />
Results<br />
A total <strong>of</strong> 300 questionnaires were distributed, with 280 completed<br />
questionnaires returned. All questionnaires were unspoilt and adequate for<br />
analysis. The response rates were consistently high across all campuses <strong>of</strong><br />
the <strong>University</strong> (88 – 97%).<br />
Table 2: Dispatched Questionnaires by Campus and Received<br />
Responses<br />
Campus Number<br />
distributed<br />
Responses %<br />
Howard<br />
College<br />
110 105 95<br />
Edgewood 50 44 88<br />
218
The Challenges <strong>of</strong> Diversity Management at a South African <strong>University</strong><br />
Westville 65 63 97<br />
PMB 45 40 89<br />
Medical<br />
School<br />
30 28 93<br />
Total 300 280 93<br />
Table 3: Demographic pr<strong>of</strong>ile <strong>of</strong> respondents<br />
International Students<br />
Characteristics<br />
Gender:<br />
Count %<br />
Male<br />
152 54.3%<br />
Female<br />
Age in years:<br />
128 45.7%<br />
17-19<br />
40 14.3%<br />
20-25<br />
157 56.1%<br />
26-30<br />
52 18.6%<br />
31-35<br />
21 7.5%<br />
>35<br />
Race group:<br />
10 3.6%<br />
African<br />
156 55.7%<br />
Indian/Asian<br />
30 10.7%<br />
White<br />
70 25%<br />
Other<br />
Level <strong>of</strong> Study:<br />
24 8.6%<br />
Undergraduate<br />
130 46.4%<br />
Honours<br />
74 26.4%<br />
Masters<br />
53 18.9%<br />
Doctorate<br />
17 6.1%<br />
Post-doctorate<br />
Is English your native<br />
language?<br />
6<br />
2.1%<br />
Yes<br />
138 49.3%<br />
No<br />
142 50.7%<br />
219
Preesha Maharaj, Rubeshan Perumal & Sadhasivan Perumal<br />
The results reflect 54.3% <strong>of</strong> the respondents were male and 45.7%<br />
<strong>of</strong> the respondents were female. The majority <strong>of</strong> the respondents were under<br />
the age <strong>of</strong> 25 (70.4%). The majority <strong>of</strong> the respondents were African<br />
(55.7%) followed by White (25%) which was followed by Indian (10.7%).<br />
Lastly, the smallest number <strong>of</strong> respondents was <strong>of</strong> ‘other’ unspecified race<br />
groups (8.6%). Nearly half (46.4%) <strong>of</strong> the international students were<br />
pursuing their undergraduate education. Just over half (50.7%) <strong>of</strong> students<br />
were not first language English speakers.<br />
Table 4: Perceptions <strong>of</strong> international students on diversity<br />
challenges at UKZN (n=280).<br />
Item Disagree Undecided Agree<br />
Unfamiliar language is<br />
used by lecturers<br />
81.1% 1.4% 17.5%<br />
Insufficient language<br />
courses available<br />
61.8% 11.4% 26.8%<br />
Assessment methods are<br />
unsuitable<br />
64.3% 8.2% 27.5%<br />
Group work is difficult 66% 4.3% 29.7%<br />
Financial aid is not easily<br />
accessible<br />
16.4% 25.7% 57.9%<br />
<strong>University</strong> fees are less<br />
affordable than home<br />
59.2% 5.5% 35.3%<br />
Insufficient opportunities<br />
for casual work<br />
6.7% 37.9% 55.4%<br />
Hosts are inadequately<br />
prepared<br />
16.1% 12.5% 71.4%<br />
Insufficient<br />
accommodation available<br />
27.5% 11.4% 61.1%<br />
Residence is not a<br />
conducive learning<br />
environment<br />
19.6% 50% 30.4%<br />
Security in inadequate 69.7% 7.5% 22.8%<br />
Computer laboratories<br />
are inadequate<br />
75% 1.4% 23.6%<br />
220
The Challenges <strong>of</strong> Diversity Management at a South African <strong>University</strong><br />
Limited opportunities for<br />
inter-racial activities<br />
19% 10.3% 70.7%<br />
Discussion and Recommendations<br />
The first objective <strong>of</strong> the study was to identify the challenges regarding<br />
diversity experienced by international students at higher education<br />
institutions, which was achieved earlier in the paper. The findings <strong>of</strong> this<br />
study help identify the perceptions <strong>of</strong> key challenges that students face at<br />
one <strong>of</strong> the largest universities in the country, as well highlights where these<br />
students are not dissatisfied. The anonymity <strong>of</strong> this survey, and the large<br />
number <strong>of</strong> international students in this study assisted in providing an<br />
accurate reflection <strong>of</strong> their experience. The second objective <strong>of</strong> the study<br />
was to assess the perceptions <strong>of</strong> international students regarding which <strong>of</strong><br />
these challenges are the most predominant at UKZN. The predominant<br />
challenges identified by international students were:<br />
1) Poor accessibility <strong>of</strong> financial aid<br />
2) Difficulty in securing casual employment<br />
3) The perceived unpreparedness <strong>of</strong> host families<br />
4) Insufficiency <strong>of</strong> accommodation, and<br />
5) The limited opportunity for inter-racial activities<br />
Surprisingly, issues pertaining to language difficulties, teaching and<br />
assessment methods, and safety were not perceived as challenges by the<br />
majority <strong>of</strong> international students surveyed.<br />
International students’ debt can grow immensely due to increases in<br />
various education-related costs, higher tuition, and changes in the<br />
availability <strong>of</strong> financial aid. UKZN Central Students’ Representative<br />
Council President (2009) Ms Bavelile Hlongwa as cited in the<br />
UKZNTOUCH Magazine by Maharaj (2010:22) believes Government<br />
should look at the possibility <strong>of</strong> freeing up funding from other State<br />
departments and diverting it to Higher Education Institutions. This is<br />
convergent with the results which indicate the majority <strong>of</strong> respondents agree<br />
that as an international student at UKZN, financial aid is not easily<br />
accessible.<br />
221
Preesha Maharaj, Rubeshan Perumal & Sadhasivan Perumal<br />
Financial restrictions make it difficult for international students to<br />
earn money while studying and leave them with few feasible opportunities.<br />
According to Seow (2005:34) Australia allows international students to<br />
work up to 20 hours a week and almost all international students take<br />
advantage <strong>of</strong> this facility. Arambewela et al. (2009:11) found that a concern<br />
for students is the lack <strong>of</strong> opportunities to obtain a casual/ part-time job on<br />
campus. This study indicates a convergence as the majority <strong>of</strong> respondents<br />
agreed to there being insufficient opportunities to obtain part-time/casual<br />
jobs for international at UKZN.<br />
Ward and Masgoret (2004:22) state that international students<br />
expect to have necessary services and facilities available to them such as<br />
accommodation. They go on to say that a clear expectation regarding<br />
campus residence should be created for these students as arriving in a<br />
foreign country with no accommodation is unacceptable. Further to this,<br />
Seow (2005:45) states that host families should receive training and prepare<br />
for international students as they play a vital role and influence in their lives.<br />
Failure to do so may result in low confidence levels <strong>of</strong> international students<br />
and may create the feeling <strong>of</strong> an unsupportive environment for them. The<br />
majority <strong>of</strong> international students at UKZN indicated insufficient<br />
accommodation and unpreparedness <strong>of</strong> host families as challenges at UKZN.<br />
It was said when forming social networks in a foreign country with<br />
diverse races and cultures, international students may feel helpless (Kossek<br />
et al. 1996:123). Racial/ethnic student organizations provide students with<br />
opportunities for identity development, cross-cultural learning, and peer<br />
support. Social facilitates including unions and catering facilities, religious<br />
and sports clubs, and societies <strong>of</strong> special interest can accommodate<br />
international students from different cultures (Ward et al. 2004:12). It can be<br />
seen that 70.7% <strong>of</strong> respondents indicated limited opportunities for interracial<br />
interaction at UKZN.<br />
The last objective <strong>of</strong> the study was to make recommendations<br />
accordingly to improve the perceptions and experiences <strong>of</strong> international<br />
students regarding diversity at UKZN which will now be addressed. The<br />
study is able to recommend that:<br />
• Financial aid has been highlighted as a challenge to international<br />
students, especially to students from the SADC regions. While financial<br />
222
The Challenges <strong>of</strong> Diversity Management at a South African <strong>University</strong><br />
resources remain scarce for all students <strong>of</strong> higher education in South<br />
Africa, the increasing appeal <strong>of</strong> the country as a site for higher education<br />
necessitates some investigation into possible methods <strong>of</strong> assisting<br />
foreign students financially. Existing policies should also be clear on<br />
what kind <strong>of</strong> financial assistance foreign students can expect, and the<br />
minimum financial resources they should be required to have in order to<br />
live and study in South Africa.<br />
• The lack <strong>of</strong> opportunities for casual work may be viewed as<br />
symptomatic <strong>of</strong> the broader problem <strong>of</strong> unemployment and lack <strong>of</strong><br />
employment opportunities facing South Africa at large. However, the<br />
unique financial vulnerabilities <strong>of</strong> international students does require<br />
that opportunities be created or that assistance be available to secure<br />
such opportunities. The possibility <strong>of</strong> extending graduate assistant<br />
opportunities to international students and <strong>of</strong> broadening casual<br />
employment at the university in a directed effort to help support these<br />
students must be pursued.<br />
• One <strong>of</strong> the key reasons cited for the growing popularity <strong>of</strong> South Africa<br />
as an international student choice is the racial and cultural diversity <strong>of</strong><br />
the country. It is therefore unacceptable that international students report<br />
dissatisfaction with the limited opportunity for inter-racial activities. In<br />
response to this, and in keeping with a broader socio-ethical imperative,<br />
universities must prioritize racial cohesion and inter-racial activity.<br />
• Issues pertaining to the availability <strong>of</strong> sufficient accommodation may<br />
also allude to the general difficulty <strong>of</strong> provision <strong>of</strong> accommodation to<br />
university students. This can be addressed by advising international students<br />
on the availability <strong>of</strong> accommodation before they arrive in South<br />
Africa, or by clearly outlining a reasonable expectation regarding the<br />
provision or assistance in securing accommodation. In addition, where<br />
institutions are involved in the use <strong>of</strong> host families, there exists an obligetion<br />
on such institutions to ensure the adequate training and education<br />
<strong>of</strong> these households. The use <strong>of</strong> an objective measure for the acceptability<br />
and preparedness <strong>of</strong> such families must be in place, and exit<br />
interviews from hosted students may be used a feedback mechanism.<br />
223
Preesha Maharaj, Rubeshan Perumal & Sadhasivan Perumal<br />
While the study was limited to the <strong>University</strong> <strong>of</strong> <strong>KwaZulu</strong>-<strong>Natal</strong>,<br />
and findings may not be generalised to other institutions, the discussion and<br />
recommendations may serve to inform the international student <strong>of</strong>fices <strong>of</strong><br />
any higher education institution in the country. Further research could<br />
gainfully be directed towards exploring the perceptions <strong>of</strong> international<br />
students at other Higher Education Institutions around <strong>KwaZulu</strong>-<strong>Natal</strong> and<br />
in the rest <strong>of</strong> the country.<br />
Conclusion<br />
The investigation is exploratory and has attempted to identify the diversity<br />
challenges international students experience at higher education institutions,<br />
assess the perceptions <strong>of</strong> international students regarding which <strong>of</strong> these<br />
challenges are the most experienced at UKZN, and lastly, make<br />
recommendations accordingly to improve the perceptions and experiences <strong>of</strong><br />
international students. The findings <strong>of</strong> this study corroborate that diversity<br />
management is essential to international students in higher education<br />
institutions. The main diversity challenges identified in this higher education<br />
institution were social interaction across race/ethnicity; finances; and<br />
lifestyle adjustment.<br />
The information and recommendations <strong>of</strong> this study will be useful to<br />
UKZN on improving diversity management in certain areas that affect<br />
international students negatively. It will also be useful to all higher<br />
education institutions in accommodating and maximizing benefits for<br />
international students with regards to diversity management. The perceptions<br />
<strong>of</strong> international students at UKZN suggest that diversity is an important<br />
issue in contemporary management and that there is still much work to be<br />
done in the way <strong>of</strong> changing perceptions, attitudes and behaviours before<br />
diversity can be effectively managed.<br />
References<br />
Arambewela R & J Hall 2009. An Empirical Model <strong>of</strong> International Student<br />
Satisfaction. Asia Pacific <strong>Journal</strong> <strong>of</strong> Marketing and Logistics 21,4: 555 -<br />
569.<br />
224
The Challenges <strong>of</strong> Diversity Management at a South African <strong>University</strong><br />
Astin AW 1993. Diversity and Multiculturalism on Campus: How are<br />
Students Affected? Colorado: Harvard Education Publishing Group.<br />
Bikson TK & SA Law 1994. Global Preparedness and Human Resources.<br />
Santa Monica: C.A: Rand.<br />
Brown G 2001. Assessment: A Guide for Lecturers: Assessment Series 3.<br />
New York: LTSN Generic Centre.<br />
Cross M 2004. Institutionalizing Campus Diversity in South Africa Higher<br />
Education: Review <strong>of</strong> Diversity Scholarship and Diversity Education.<br />
Higher Education Publication 47,4: 387- 410.<br />
Cubillo JM, J Sanchez & J Cervino 2006. International Students’ Decisionmaking<br />
Process. International <strong>Journal</strong> <strong>of</strong> Educational Management.<br />
20,2: 101 - 115.<br />
Davis BG 1993. Collaborative Learning: Group Work and Study Teams. San<br />
Francisco: Jossey-Bass Publishers.<br />
Division <strong>of</strong> Management Information 2010. <strong>University</strong> <strong>of</strong> <strong>KwaZulu</strong>-<strong>Natal</strong>.<br />
Doble N & MV Supriya 2011. Student Life Balance: Myth or Reality?<br />
International <strong>Journal</strong> <strong>of</strong> Educational Management 25,3: 237 - 253.<br />
Google College Rankings 2010. South Africa’s Best Universities. Available<br />
at: www.googlecollegerankings.com.<br />
Gundara JS 2000. Interculturalism, Education and Inclusion. London:<br />
SAGE Publications Company.<br />
Hellsten M & A Prescott 2004. Learning at <strong>University</strong>: The International<br />
Student Experience. International Education <strong>Journal</strong> 5,3.<br />
Jayakumar UM 2008. Can Higher Education Meet the Needs <strong>of</strong> an<br />
Increasingly Diverse and Global Society? Campus Diversity and Cross-<br />
Cultural Workforce Competencies. Harvard Educational Review 78,4:<br />
213-232.<br />
Kossek EE, SA Lobel & J Brown 1996. Managing Diversity: Human<br />
Resource Strategies for Transforming the Workplace. Michigan:<br />
Blackwell Publishers Limited.<br />
Krause K 2005. Understanding and Promoting Student Engagement in<br />
<strong>University</strong> Learning Communities. Melbourne: Centre for the Study <strong>of</strong><br />
Higher Education.<br />
Milem JF, MJ Chang & AL Antonio 2005. Making Diversity Work on<br />
Campus: A Research-Based Perspective. Association American<br />
Colleges and Universities.<br />
225
Preesha Maharaj, Rubeshan Perumal & Sadhasivan Perumal<br />
Mohammed SK 2009. The Role <strong>of</strong> Perception in Fostering or Impeding the<br />
Unity through Diversity. The Euro-Mediterranean Student Research<br />
Multi-conference. Nablus, Palestine.<br />
Morris R 2006. The Impact <strong>of</strong> Racial and Ethnic Diversity on Faculty<br />
Perceptions <strong>of</strong> their Instructional Roles. Pittsburgh: <strong>University</strong> <strong>of</strong><br />
Pittsburgh.<br />
Ryan J & S Hellmundt 2003. Excellence through Diversity:<br />
Internationalisation <strong>of</strong> Curriculum and Pedagogy. Sydney: 17th IDP<br />
Australian International Education Conference.<br />
Sadri G & H Tran 2002. Managing your Diverse Workforce through<br />
Improved Communication. <strong>Journal</strong> <strong>of</strong> Management Development 21,3:<br />
227 - 237.<br />
Schneider B 1990. Organizational Climate and Culture. San Francisco:<br />
Jossey-Bass.<br />
Seow MA 2005. The Changing Pr<strong>of</strong>ile <strong>of</strong> the International Student –<br />
Understanding the Student with Status from Previous Study. <strong>University</strong><br />
<strong>of</strong> South Australia, International Student Advisory Services.<br />
Smith DG 1995. Organizational Implication for Diversity in Higher<br />
Education. California: SAGE Publications.<br />
Spack R 1997. The Acquisition <strong>of</strong> Academic Literacy in a Second<br />
Language: A Longitudinal Study. Written Communication 14,1: 3-34.<br />
The Institute <strong>of</strong> International Education 2004. Globalization and Higher<br />
Education: Eight Common Perceptions from <strong>University</strong> Leaders.<br />
IIENetwork.<br />
Thompson A & J Cuseo 2009. Why Does Diversity Matter at College<br />
Anyway? Richmond: Eastern Kentucky <strong>University</strong>.<br />
Trigwell K & S Shale 2004. Student Learning and the Scholarship <strong>of</strong><br />
<strong>University</strong> Teaching. Studies in Higher Education 29,4: 523 – 536.<br />
<strong>University</strong> <strong>of</strong> <strong>KwaZulu</strong>-<strong>Natal</strong> Strategic Plan 2007 – 2016. Durban.<br />
Government Press.<br />
UKZNTOUCH, a <strong>University</strong> <strong>of</strong> <strong>KwaZulu</strong>-<strong>Natal</strong> Alumni Magazine 2010.<br />
Issue 1.<br />
Veloutsou C, JW Lewis & RA Paton 2004. <strong>University</strong> Selection:<br />
Information Requirements and Importance. International <strong>Journal</strong> <strong>of</strong><br />
Educational Management 18,3: 160 – 171.<br />
Ward C & AM Masgoret 2004. The Experiences <strong>of</strong> International Students in<br />
226
The Challenges <strong>of</strong> Diversity Management at a South African <strong>University</strong><br />
New Zealand: Report on the Results <strong>of</strong> the National Survey. Victoria<br />
<strong>University</strong> <strong>of</strong> Wellington: Ministry <strong>of</strong> Education.<br />
Yes-Asia Consultation 2001. South Africa as a Study Destination. Available<br />
at: www.yesasia.com/south_africa/study_destination.shtm.<br />
227<br />
Preesha Maharaj<br />
M Comm (Management)<br />
UKZN South Africa<br />
Student Number- 205510894<br />
Cell: 083 248 0162<br />
preesham@gmail.com<br />
Rubeshan Perumal<br />
School <strong>of</strong> Public Health<br />
Centre for the AIDS programme <strong>of</strong> research in South Africa<br />
Nelson R Mandela School <strong>of</strong> Medicine<br />
UKZN, South Africa<br />
perumal@ukzn.ac.za<br />
Sadhasivan Perumal<br />
School <strong>of</strong> Management, Faculty <strong>of</strong> Management Studies<br />
UKZN (Westville) South Africa<br />
Tel: 031- 260 7554<br />
Cell: 082 331 1483<br />
perumals@ukzn.ac.za
The Postgraduate Service Experience, Service<br />
Satisfaction and Service Quality:<br />
A South African Case Study<br />
Krishna K. Govender<br />
Shaun Ramroop<br />
Abstract<br />
This paper presents the results <strong>of</strong> an exploratory study examining the<br />
relationship between the postgraduate (PG) students’ perception <strong>of</strong> PG<br />
service quality, their service experience and satisfaction with the PG service,<br />
by surveying the 2011 cohort (816) <strong>of</strong> graduating master’s and doctorate<br />
postgraduates <strong>of</strong> one <strong>of</strong> the top five research universities in South Africa<br />
using specially developed and validated PG service quality (PGSQUAL), PG<br />
service experience (SERVEXP), and a single item PG service satisfaction<br />
(SERVSAT) measuring instruments. By drawing heavily on the services<br />
marketing/quality literature, relationships were proposed among the<br />
aforementioned variables, which relationships were assessed using both<br />
correlation analysis and structural equation modeling. It became evident that<br />
there is a significant association between the students’ perception <strong>of</strong> the<br />
overall SERVEXP and overall PGSQUAL, as well as between their<br />
perception <strong>of</strong> their overall SERVEXP and overall SERVSAT.<br />
Keywords: postgraduate service encounter, postgraduate service quality,<br />
service experience, service satisfaction.<br />
Introduction<br />
Quality assurance <strong>of</strong> PG education is becoming increasingly important and<br />
worldwide there is a push to encourage universities to be more accountable<br />
for PG learning. Governments are also asking higher education institutions<br />
<strong>Alternation</strong> Special Edition 4 (2011) 228 – 250<br />
ISSN 1023-1757<br />
228
The Postgraduate Service Experience …<br />
(HEIs) to strengthen research, knowledge creation and uptake for our<br />
knowledge society, and to achieve this, universities need to ensure that they<br />
are providing high quality PG service. In addition to academic (external)<br />
audits, internal PG service experience and satisfaction surveys can serve as<br />
appropriate quality assurance processes.<br />
Student experience and satisfaction are closely linked, and student<br />
satisfaction, which is associated with their perceptions <strong>of</strong> service quality, has<br />
become an extremely important issue for universities and their management.<br />
Whilst service quality <strong>of</strong> undergraduates has been extensively measured,<br />
postgraduate–based (PG) research, especially in South Africa has been<br />
negligible. Furthermore, the instruments used to assess service quality in<br />
education are in a state <strong>of</strong> development.<br />
There has been considerable debate and discussion within the<br />
literature on the relationship between service quality and satisfaction. For<br />
instance, some researchers (Bolton & Drew 1991) argued that customer<br />
satisfaction is an antecedent <strong>of</strong> service quality, whilst others (Carillat,<br />
Jaramillo & Mulki 2009) assert that service quality leads to customer<br />
satisfaction and behavioural intentions. The service quality-service<br />
satisfaction-service performance relationship has also been the topic for<br />
many a research (Cronin & Taylor 1992). However, in addition to not<br />
recognizing the service experience, very little research has been conducted<br />
to examine the relationship among the aforementioned in the context <strong>of</strong> the<br />
PG research environment.<br />
Considering that education is essentially a service industry, and that<br />
the concept <strong>of</strong> ‘student as customer’ is not new (Craford 1991; Yorke 1999<br />
as cited by Douglas, McClelland & Davies 2008), its management practices<br />
are typically concerned with issues such as quality, which fall within the<br />
aegis or services marketing. Thus what is applicable to consumers<br />
(customers) generally should also, from this perspective, be applicable to PG<br />
students.<br />
According to Angell, Heffernan and Megicks (2008), given that<br />
education is a service and the PG education environment becoming<br />
increasingly competitive, and whilst service quality <strong>of</strong> undergraduates has<br />
been extensively measured, postgraduate–based research, has been<br />
negligible.<br />
229
Krishna K. Govender & Shaun Ramroop<br />
By drawing heavily on the service quality literature, this paper<br />
presents an attempt to address the shortcomings alluded to above by<br />
presenting the findings <strong>of</strong> a survey conducted among a cohort <strong>of</strong> masters and<br />
doctorate graduates at a large research university in South Africa to:<br />
• Determine the PG students’ perception <strong>of</strong> the overall postgraduate<br />
service quality (PGSQUAL) and their overall service experience<br />
(SERVEXP).<br />
• Ascertain the association between the PG students’ perception <strong>of</strong> the<br />
postgraduate service quality (PGSQUAL), their overall service<br />
experience (SERVEXP) and their overall satisfaction with their PG<br />
service experiences (SERVSAT).<br />
This paper is structured as follows: a discussion <strong>of</strong> the PG service<br />
encounter is followed by discussion <strong>of</strong> PG service and service quality as<br />
well as the measurement <strong>of</strong> higher education service quality. The research<br />
methodology, findings and discussion there<strong>of</strong> is followed by the conclusions<br />
and limitations <strong>of</strong> the study and future research possibilities.<br />
The Postgraduate Service Encounter, the Service Experience<br />
and Service Quality<br />
Service delivery and customer satisfaction in an education environment are<br />
dependent on the personal interaction between students and staff. The<br />
personal interaction and labour intensive nature <strong>of</strong> this service translates into<br />
a potentially highly heterogeneous quality service experience (de Jager &<br />
Gbadamosi 2010: 253). These interactions which are known as service<br />
encounters, are recognized within the service quality research field as a key<br />
concept (Zeithaml & Bitner 2000; Dale 2003), since what happens during<br />
the encounter is important in understanding what affects the customers’<br />
perception <strong>of</strong> service quality. It has also been well articulated in the service<br />
quality literature that each encounter impacts on the service consumer’s<br />
overall impression and evaluation <strong>of</strong> the service and ultimately on their<br />
perception <strong>of</strong> service quality.<br />
Dann (2008: 335) cites several researchers (Zeithaml, Bitner &<br />
Gremler 2006; Stodnick & Rogers 2008) who frequently cite higher<br />
230
The Postgraduate Service Experience …<br />
education as a key example <strong>of</strong> a service with limited tangible outputs.<br />
However, while it may be true that higher education is classified as a service<br />
product with the primary outputs being the mental development, knowledge,<br />
skills and graduate outcomes rather than the ownership <strong>of</strong> an object such as<br />
a degree certificate that represents tangible evidence <strong>of</strong> the education service<br />
encounter, this only encompasses the ‘technical’ aspects. The other side <strong>of</strong><br />
the story is the ‘psychological’ or subjective personal reactions and feelings<br />
experienced by consumers when they consume the service. This<br />
phenomenon has been called the service experience and has recently been<br />
found to be an important part <strong>of</strong> consumer evaluation <strong>of</strong> and satisfaction<br />
with services (Otto & Ritchie 1995: 167).<br />
Perhaps the most straightforward manner by which to apply the<br />
services marketing perspective is to borrow general marketing measurement<br />
instruments directly from the field and apply them to PG education. Indeed<br />
most research <strong>of</strong> this nature has focused on the evaluation <strong>of</strong> service quality<br />
and more on the technical and functional aspects <strong>of</strong> service delivery (Ritchie<br />
& Otto 1995: 167).<br />
According to Alridge and Rowley (1998: 198), work on approaches<br />
to the evaluation <strong>of</strong> the student experience can be divided into two loosely<br />
bound categories, namely, methods that focus on assessing teaching and<br />
learning and, methods that assess the total student experience. More recently<br />
there has been a wider acknowledgement that the totality <strong>of</strong> the student<br />
experience <strong>of</strong> an institution is a useful perspective to adopt in student<br />
satisfaction in marketing terms, since service quality is also connected to<br />
satisfaction with the overall performance <strong>of</strong> a service.<br />
In view <strong>of</strong> the above, the purpose <strong>of</strong> this paper is to enhance our<br />
understanding <strong>of</strong> the PG service experience and service quality so that<br />
policies and strategies could be developed to facilitate the quality and<br />
quantity <strong>of</strong> postgraduates.<br />
Service Experience, Service Satisfaction and Service Quality<br />
As became evident from the brief literature review, there has also been<br />
considerable debate and discussion within the literature on the relationship<br />
between service quality and satisfaction. Some researchers (Bolton & Drew<br />
1991) argued that customer satisfaction is an antecedent <strong>of</strong> service quality,<br />
231
Krishna K. Govender & Shaun Ramroop<br />
whilst others (Carillat, Jaramillo & Mulki 2009) assert that service quality<br />
leads to customer satisfaction and behavioural intentions.<br />
On the basis <strong>of</strong> the literature reviewed above, and in order to further<br />
explore the relationships among service quality, service experience and<br />
service satisfaction in the context <strong>of</strong> PG research education, it is proposed<br />
that:<br />
• P1: The SERVEXP as perceived by PG students is associated with<br />
their perception <strong>of</strong> PG service quality (PGSQUAL).<br />
• P2: The PGSQUAL as perceived by PG students is associated with<br />
their overall satisfaction (SERVSAT) with the PG service.<br />
• P3: The SERVEXP as perceived by PG students is associated with<br />
their SERVSAT.<br />
Assessing Service Quality in Higher Education<br />
While there has been sufficient consensus on the importance <strong>of</strong> service<br />
quality issues in HE, the identification and implementation <strong>of</strong> the right<br />
measurement instrument, however, remains a challenge that practitioners<br />
who aim to gain a better understanding <strong>of</strong> the quality issues with an impact<br />
on students’ experiences face (Oliveira-Brochado & Marques 2007, as cited<br />
by de Jager & Gbadamosi 2010: 251). Oldfield and Baron (2000: 85)<br />
suggest that there are three underlying factors <strong>of</strong> HE service quality namely,<br />
requisite elements (encounters which are essential to enable students to<br />
fulfill their study obligations), acceptable elements and functional elements.<br />
The conceptualization and measurement <strong>of</strong> service quality as a<br />
subject and service quality perceptions has been widespread (Brady 2001);<br />
however measuring service quality in HE has received limited attention<br />
(Firdaus 2006), and a review <strong>of</strong> the literature reveals that the most popular<br />
scale is SERVQUAL (Parasuraman Zeithaml & Berry 1988). Also known as<br />
the GAPS model since service quality is conceptualized as the gap between<br />
customer expectations and perceptions, the SERVQUAL instrument,<br />
presents the respondent with 22 service attributes grouped into five<br />
dimensions, namely tangibles, reliability, responsiveness, assurance and<br />
empathy, which they rate using a Likert-type scale response format (Ford<br />
Jospeh & Joseph 1999: 172). According to Parasuraman et al. (1988),<br />
232
The Postgraduate Service Experience …<br />
quality evaluations as perceived by customers stem from a comparison <strong>of</strong><br />
what customers feel that the organization should <strong>of</strong>fer (that is their<br />
expectations) and their perceptions <strong>of</strong> the organization providing the service.<br />
There has been a growing body <strong>of</strong> literature on the search for a<br />
general scale and instrument for the measurement <strong>of</strong> education service<br />
quality, and although there is substantial research evidence in the literature<br />
to support the use <strong>of</strong> the SERVQUAL, this instrument has not been without<br />
criticism (Cronin & Taylor 1992; Alridge & Rowley 1998: 200). Some <strong>of</strong><br />
the criticisms (Alridge & Rowley 1998: 200) include the need to ask the<br />
same questions twice, and the fact that the instrument captures a snapshot <strong>of</strong><br />
perceptions at one point in time. To overcome some <strong>of</strong> the criticisms,<br />
Alridge and Rowley (1998) opted to survey perceptions only and exclude<br />
expectations in their survey <strong>of</strong> student satisfaction. According to Hair (2006:<br />
11), the work carried out so far using SERVQUAL in a higher education<br />
context would seem to suggest that the instrument can be used successfully,<br />
as long as the modifications are kept to a minimum. However, the author<br />
goes on to state that there is little or no research specifically using<br />
SERVQUAL on PhD students or on supervisors.<br />
In their quest to develop better research instruments, which are also<br />
more appropriate to the nature <strong>of</strong> the service, some researchers (Drennan<br />
2008) report on the PREQ (Postgraduate Research Questionnaire), which<br />
was introduced in Australia in 2002 against a background <strong>of</strong> increased<br />
attention on quality and accountability in the Australian higher education<br />
sector. PREQ is a multidimensional measure <strong>of</strong> graduate students’<br />
experience <strong>of</strong> research and research supervision and is based on the principle<br />
that student’s perception <strong>of</strong> research supervision, infrastructural and other<br />
support, intellectual climate, goals and expectations will influence their<br />
evaluations <strong>of</strong> the outcomes achieved as a consequence <strong>of</strong> their research<br />
experience (ACER 2000 as cited by Drennan 2008: 490).<br />
Other researchers such as Ginns, Marsh, Behnia, Cheng and Scalas<br />
(2009) further adapted PREQ to develop the SREQ (Student Research<br />
Experience Questionnaire) to investigate the PhD students’ evaluations in<br />
which the focus was on the overall postgraduate experience at the broad<br />
level <strong>of</strong> university and disciplines (faculties and departments) within a<br />
university rather than at the effectiveness <strong>of</strong> the individual supervisor.<br />
Ginns, et al. (2009: 582) further emphasize that the SREQ’s design applies<br />
233
Krishna K. Govender & Shaun Ramroop<br />
theory derived from studies <strong>of</strong> teaching and learning in higher education to<br />
the experiences <strong>of</strong> postgraduate research students. The purpose <strong>of</strong> the 28item<br />
PREQ is to gather data concerning the experience <strong>of</strong> research degree<br />
(masters and doctorate) graduates with respect to broad aspects <strong>of</strong> their<br />
studies. The PREQ scale focuses on six areas <strong>of</strong> research higher degree<br />
experience, namely, supervision, climate, infrastructure, thesis/dissertation<br />
examination, goal clarity, and generic skill development. Ginns, et al. (2009:<br />
580) cite Marsh, et al. (2002) who indicated that PREQ had a clear factor<br />
structure, and the scales had acceptable internal consistency estimates <strong>of</strong><br />
reliability.<br />
For the purpose <strong>of</strong> this study, the PGSQUAL (postgraduate service<br />
quality) instrument (Table 1) was developed primarily by adapting the<br />
SERVQUAL instrument (Table 1) which encapsulates the perceptionsexpectations<br />
gap covering all five service quality dimensions (Parasuraman,<br />
et al. 1988), and incorporating certain elements from the PREQ and SREQ<br />
instruments, as was done in previous studies (Stodnick & Rogers 2008;<br />
Danny 2008; Drennan 2008). The final PGSQUAL instrument comprised 26<br />
items resulting from the adaptations, which entailed making minor changes<br />
to the SERVQUAL statements to fit the context, combining expectations and<br />
perceptions into a single score (Govender 1998), and incorporating certain<br />
elements <strong>of</strong> the PREQ and SREQ.<br />
With respect to the items reflected in Table 1, PG students were<br />
required, with respect to the overall service they received at the university,<br />
to indicate their rating to each item on the following continuum: 1= Worse<br />
than expected; 5= better than expected.<br />
Table 1: Postgraduate Service Quality (PGSQUAL) Instrument<br />
Items Labe<br />
l<br />
Criteria<br />
Accuracy <strong>of</strong> PG student records SQ1 Reliability<br />
Ability <strong>of</strong> staff to understand PG students’ needs SQ2 Empathy<br />
Willingness <strong>of</strong> staff to assist PG students SQ3 Responsiveness<br />
The courteousness <strong>of</strong> staff towards PG students SQ4 Responsiveness<br />
234
The Postgraduate Service Experience …<br />
The promptness <strong>of</strong> the service <strong>of</strong>fered to PG SQ5<br />
students<br />
Responsiveness<br />
The convenience <strong>of</strong> operating hours for PG SQ6<br />
students<br />
Responsiveness<br />
The personal attention given by staff to PG SQ7<br />
students<br />
Empathy<br />
The confidentiality with which staff deal with PG<br />
issues<br />
SQ8 Empathy<br />
The ability <strong>of</strong> staff to answer PG students’ queries SQ9 Reliability<br />
Delivering on promises to PG students do<br />
something by a certain time<br />
SQ10 Reliability<br />
Always having PG students’ best interest at heart SQ11 Empathy<br />
Sincerity <strong>of</strong> staff in solving PG students’<br />
problems<br />
SQ12 Responsiveness<br />
Performing the PG service right the first time SQ13 Reliability<br />
The personal attention PG students receive SQ14 Empathy<br />
Never being too busy to respond to PG students’<br />
requests<br />
SQ15 Responsiveness<br />
Telling PG students exactly when the services SQ16<br />
will be performed<br />
Reliability<br />
Financial support for PG research activities SQ17 Tangibility<br />
Honouring promises made to PG students SQ18 Reliability<br />
Research support services provided for PG<br />
students<br />
SQ19 Reliability<br />
Opportunities provided for social contact with SQ20<br />
other PG students<br />
Empathy<br />
Research ambience in the department/ school SQ21 Tangibility<br />
Modernness <strong>of</strong> library resources and services SQ22 Tangibility<br />
Efforts made to ensure that PG students develop<br />
an understanding <strong>of</strong> the standard <strong>of</strong> work<br />
expected<br />
235<br />
SQ23 Empathy
Krishna K. Govender & Shaun Ramroop<br />
Seminar programmes provided for PG students SQ24 Assurance<br />
Freedom allowed to PG students to discuss their<br />
research needs<br />
SQ25 Assurance<br />
Opportunities provided to PG students to become<br />
integrated into the broader department/school/<br />
university research culture<br />
SQ26 Assurance<br />
Postgraduate Students’ Overall Research Experience -<br />
SERVEXP<br />
Since the overall PG student experience is also a useful perspective to adopt<br />
in student satisfaction in marketing terms, based on principles underlying the<br />
SREQ instrument, the 6-item SERVEXP questionnaire was developed. PG<br />
students were requested to refer to their overall PG experience at the<br />
particular university and, indicate their level <strong>of</strong> agreement with each<br />
statement reflected in Table 2, where 1= Strongly Disagree; 2= Disagree; 3=<br />
Neutral; 4= Agree; 5= Strongly Agree.<br />
Table 2: SERVEXP Items<br />
OE1 I further developed my problem solving skills 1 2 3 4 5<br />
OE2 I shaped my analytical skills 1 2 3 4 5<br />
OE3 I feel confident to tackle unfamiliar problems 1 2 3 4 5<br />
OE4 I have learned how to write and confidently 1 2 3 4 5<br />
present a paper at a conference<br />
OE5 I have learned to develop my ideas and present 1 2 3 4 5<br />
them in a logical and scientific way<br />
OE6 I have learnt how to publish a paper in scientific<br />
journal<br />
236<br />
1 2 3 4 5<br />
Postgraduate Students’ Overall Satisfaction<br />
Considering that the intention was to get an overall (summary) measure <strong>of</strong><br />
the level <strong>of</strong> overall service satisfaction, a single item 5-point Likert type
The Postgraduate Service Experience …<br />
question was included, which required respondents to indicate their<br />
agreement with the following statement ‘Overall, I was satisfied with the<br />
quality <strong>of</strong> my PG experience,’ on a 5-point scale with the following points:<br />
Strongly Disagree, Disagree, Agree and Strongly Agree.<br />
Methodology<br />
816 masters and doctorates who graduated in 2011 comprised the population<br />
and the researchers targeted the entire population, rather than selecting a<br />
specific sample. The name list and e-mail contact details <strong>of</strong> the graduates<br />
was obtained from the graduation <strong>of</strong>fice. Two approaches were used to reach<br />
the sample. The electronic version <strong>of</strong> the questionnaire, using QuestionPro<br />
(www.QuestionPro.com 2010) was sent via e-mail to all graduates. This was<br />
supported by hardcopies <strong>of</strong> the questionnaire accompanied by an<br />
explanatory letter explaining the objectives <strong>of</strong> the survey and instructions on<br />
how to complete and return the questionnaire, which were distributed at the<br />
graduation venues in special envelopes together with the degree certificates.<br />
Graduates were asked to return the completed questionnaire or complete the<br />
survey within a month from the date <strong>of</strong> the graduation.<br />
Empirical Findings<br />
Response Rate<br />
The survey was conducted over a month (April-May 2011), during which<br />
period, weekly e-mail reminders were sent encouraging the graduates to<br />
participate by completing the on-line questionnaire. Although 221 graduates<br />
viewed the questionnaire, 117 completed the questionnaire representing a<br />
response rate <strong>of</strong> 53%. Thus the results, which will be inferred from this<br />
study will be based on a sample <strong>of</strong> 221, since only those who viewed the<br />
questionnaire had been ‘reached’ or unintentionally targeted out <strong>of</strong> a<br />
population <strong>of</strong> 816.<br />
Reliability and Validity <strong>of</strong> the Research Instruments<br />
Since the PGSQUAL and SERVEXP instruments were newly constructed<br />
multi-item instruments, their validity and reliability was ascertained to<br />
237
Krishna K. Govender & Shaun Ramroop<br />
control for measurement errors (Hair, Bush and Ortinau, 2000). SERVSAT<br />
was measured using a single item question, thus not necessitating validation.<br />
Postgraduate Service Quality: PGSQUAL<br />
Factor analysis was carried out using the Principal Components Analysis<br />
method with varimax rotation. The outcome <strong>of</strong> this process reveals that the<br />
cumulative variance, which two factors explained was 72.180%.<br />
Furthermore these factors have Eigen values over 1. The table <strong>of</strong> the initial<br />
eigenvalues and cumulative variations <strong>of</strong> the factors is available upon<br />
request.<br />
The rotated factor loadings table was examined to find out which<br />
questions were not loading at all on the factors and, could hence be<br />
eliminated from the data set and, then re-ran the factor analysis procedure.<br />
Although the literature suggests that a factor loading <strong>of</strong> 0.3 or greater can be<br />
considered to be significant (Kline 1994), given the large number <strong>of</strong> items in<br />
the PGSQUAL scale, it was advisable to adopt the principle that factor<br />
loadings <strong>of</strong> 0.4 or higher are considered to be significant, otherwise the<br />
number <strong>of</strong> items in the data set will not be reduced and the key<br />
reason/purpose <strong>of</strong> factor analysis, which is to reduce the number <strong>of</strong> items to<br />
a comprehensible set <strong>of</strong> items, will have been defeated.<br />
From Table 3 it is further evident that all the items loaded onto the<br />
two factors with loadings exceeding 0.4. Factor 1 which comprised items (18<br />
items) SQ1 – SQ16; SQ18; SQ23 was named SERVICE OFFERED TO<br />
STUDENTS and Factor 2 which comprised the remaining 8 items (SQ17;<br />
SQ19; SQ20-SQ22; SQ24-SQ26) was labelled as RESOURCES OFFERED<br />
TO STUDENTS.<br />
Coakes and Steed (2003:140) state that there are a number <strong>of</strong><br />
different reliability coefficients and one <strong>of</strong> the most commonly used is the<br />
Cronbach’s alpha, which is based on the average correlation <strong>of</strong> items within<br />
a test if the items are standardised. The alpha values <strong>of</strong> the two factor<br />
PGSQUAL instrument, namely, SERVICE OFFERED TO STUDENTS<br />
(0.978) and RESOURCES OFFERED TO STUDENTS (0.910), showed that<br />
the PGSQUAL instrument had good internal consistency amongst the<br />
factors, since alpha values <strong>of</strong> 0.7 and above are generally regarded as<br />
acceptable (Coakes & Steed 2003).<br />
238
The Postgraduate Service Experience …<br />
Table 3: Rotated Component Matrix<br />
The Overall PG Service Experience: SERVEXP<br />
The 6-item SERVEXP instrument produced a Cronbach’s alpha <strong>of</strong> 0.867,<br />
which asserts that the SERVEXP instrument is valid. This was further<br />
interrogated since a common practice in asserting the validity <strong>of</strong> an<br />
instrument is to check the individual contribution <strong>of</strong> each <strong>of</strong> the item’s<br />
reliability that make up an instrument (Cortina 1993). The procedure was<br />
conducted as follows; firstly the overall reliability <strong>of</strong> all the items was<br />
239
Krishna K. Govender & Shaun Ramroop<br />
calculated, and then if a question, which contributed towards the overall<br />
reliability is removed, then the overall reliability <strong>of</strong> the remaining items<br />
should decrease when compared to the overall reliability <strong>of</strong> all the items.<br />
However should the question not contribute to the overall reliability <strong>of</strong> the<br />
instrument and it is removed then the overall reliability <strong>of</strong> the remaining<br />
items will increase. From the results summarized in Table 5, which were<br />
developed on the basis <strong>of</strong> the aforementioned procedure, it can be inferred<br />
that the alpha values <strong>of</strong> all items decrease when compared to the overall<br />
reliability (0. 867), except for question OE 4 where there is a negligible<br />
increase in the alpha value (0.002). Hence we conclude that all the items are<br />
reliable, have good internal consistency and contribute towards the overall<br />
validity <strong>of</strong> the SERVEXP research instrument.<br />
TABLE 4: SERVEXP Cronbach’s Alpha– Post Sequential Item<br />
Deletion<br />
Scale<br />
Cronbach's<br />
Variance if Corrected Alpha if<br />
Scale Mean if Item Item-Total Item<br />
Item Deleted Deleted Correlation Deleted<br />
OE1 20.3878 14.941 .729 .834<br />
OE2 20.3367 14.968 .752 .831<br />
OE3 20.5000 15.242 .675 .843<br />
OE4 20.7347 15.310 .533 .869<br />
OE5 20.4388 15.465 .717 .838<br />
OE6 21.1224 13.263 .661 .852<br />
Factor analysis was not conducted to ascertain the validity <strong>of</strong> the<br />
SERVEXP instrument, since it comprised only 6 items, and any attempts to<br />
conduct this analysis would have been in violation <strong>of</strong> Coakes and Steed’s<br />
(2003) recommendation which states that for factor analysis a minimum <strong>of</strong><br />
10 items is required.<br />
Descriptive Statistics<br />
The sample comprised 58% black graduates, 23.2% white graduates<br />
followed by 16.1% <strong>of</strong> Indian graduates. The majority <strong>of</strong> the graduates<br />
240
The Postgraduate Service Experience …<br />
completed the course-work masters (35.1%) and a full research masters<br />
(37.7%) degree. The modal breakdown <strong>of</strong> the faculty from which the<br />
graduates were represented was HDSS (27.4%), Management Studies<br />
(17.1%) followed by Science and Agriculture (21.4%). The faculties that<br />
were least represented were Education (6%), Law (0.9%) and the Medical<br />
School (6.8%).<br />
Perceptions <strong>of</strong> Postgraduate Service Quality<br />
Postgraduate students were requested to indicate their assessment <strong>of</strong> the<br />
postgraduate service quality on a 5-point scale, where 1 = Worse than<br />
expected and 5= Better than expected. It is evident from Table 2 that with<br />
the exception to SQ17 and SQ20, for all other items, the respondents<br />
perceived the service quality as being neither worse nor better than expected.<br />
Table 2: Mean, Median, Mode and Standard Deviation<br />
PGSQUAL Mean Median Mode Std. Dev.<br />
SQ1 3.837 4 4 1.080<br />
SQ2 3.426 4 4 1.178<br />
SQ3 3.667 4 4 1.107<br />
SQ4 3.670 4 4 1.055<br />
SQ5 3.471 4 4 1.183<br />
SQ6 3.670 4 3 1.061<br />
SQ7 3.529 4 4 1.158<br />
SQ8 3.612 4 4 1.022<br />
SQ9 3.466 4 4 1.178<br />
SQ10 3.441 3.5 3 1.134<br />
SQ11 3.272 3 3 1.222<br />
SQ12 3.490 3.5 3 1.124<br />
SQ13 3.456 3 3 1.083<br />
SQ14 3.382 3 3 1.053<br />
SQ15 3.353 3 3 1.191<br />
241
Krishna K. Govender & Shaun Ramroop<br />
SQ16 3.208 3 3 1.227<br />
SQ17 2.789 3 3 1.327<br />
SQ18 3.220 3 3 1.203<br />
SQ19 3.029 3 3 1.246<br />
SQ20 2.961 3 3 1.266<br />
SQ21 3.294 3 3 1.182<br />
SQ22 3.626 4 4 1.174<br />
SQ23 3.641 4 4 1.083<br />
SQ24 3.350 3 3 1.186<br />
SQ25 3.392 3.5 4 1.212<br />
SQ26 3.019 3 3 1.283<br />
Considering the nature <strong>of</strong> the scale, the mean values for the<br />
PGSQUAL (above 3 and tending towards 4) show that for the majority <strong>of</strong><br />
the questions, the respondents perceived the PG service quality to be ‘better<br />
than expected’. The one sample t-test was applied to further verify whether<br />
the mean PGSQUAL score was less than or equal to 3, and it was<br />
ascertained that at the 5% significance level, this is not true since the p-value<br />
is 0.000. Hence we conclude that the perceptions <strong>of</strong> the students with respect<br />
to the overall PG service quality are tending towards ‘expected’ or ‘better<br />
than expected’.<br />
Perceptions <strong>of</strong> the Postgraduate Service Experience<br />
Postgraduate students were requested to indicate their assessment <strong>of</strong> the<br />
postgraduate service experience on a 5-point scale, 1= Strongly Disagree; 2=<br />
Disagree; 3= Neutral; 4= Agree; 5= Strongly Agree. Table 3 shows that the<br />
respondents agreed that they had further developed their problem solving<br />
skills, shaped their analytical skills, feel confident to tackle unfamiliar<br />
problems, write and confidently present a paper at a conference, present<br />
their ideas in a logical and scientific way and have learned how to publish a<br />
paper in a journal.<br />
242
The Postgraduate Service Experience …<br />
Table 3: Descriptive Results <strong>of</strong> SERVEXP<br />
SERVEXP Mean Median Mode Std.<br />
Deviation<br />
OE1 4.2804 4.0000 5.00 .92954<br />
OE2 4.3119 5.0000 5.00 .87873<br />
OE3 4.1961 4.0000 5.00 .90148<br />
OE4 3.9541 4.0000 4.00 a 1.03087<br />
OE5 4.2500 4.0000 5.00 .82173<br />
OE6 3.6389 4.0000 5.00 1.23393<br />
The one sample t-test was also conducted to ascertain whether the<br />
mean SERVEXP score was in fact less than or equal to ‘3=neutral’. It was<br />
ascertained that at the 5% significance level, this is not true, implying that<br />
the mean SERVEXP score is greater than or equal to 3 since the p-value is<br />
0.000. Hence it was concluded that the perceptions <strong>of</strong> the students with<br />
respect to their postgraduate service experience is positive since the<br />
responses are range from ‘agree’ to ‘strongly agree’.<br />
Perceptions <strong>of</strong> Overall Satisfaction<br />
Postgraduate students were requested to indicate their overall level <strong>of</strong><br />
satisfaction with the PG service on a 5-point scale, 1= Strongly Disagree; 2=<br />
Disagree; 3= Neutral; 4= Agree; 5= Strongly Agree. The results indicated<br />
that the respondents were neutral (mean score 3.0841), although the modal<br />
score <strong>of</strong> 4 revealed that the students were satisfied with the overall level <strong>of</strong><br />
PG service quality.<br />
The one sample t-test was also conducted to ascertain whether the<br />
mean SERVSAT score was in fact less than or equal to ‘3=neutral’. It was<br />
ascertained that at the 5% significance level, the mean SERVSAT score is<br />
less than or equal to 3 since the p-value is 0.496 which is greater than 0.05.<br />
The mean SERVSAT score <strong>of</strong> 3.0841 confirms this result.<br />
Hence we find a positive perception <strong>of</strong> students towards the<br />
PGSQUAL and SERVEXP whilst a neutral perception is prevalent<br />
towards the overall service satisfaction level, SEVRSAT.<br />
243
Krishna K. Govender & Shaun Ramroop<br />
The Relationship between SERVSAT, PGSQUAL and<br />
SERVEXP<br />
The relationship among the PGSQUAL, SERVEXP and SERVSAT was<br />
explored using Pearson’s correlation. The results are summarized in table 5<br />
show a significant relationship between PGSQUAL and SERVEXP at the<br />
5% level. The strength <strong>of</strong> the relationship is just below medium and this is a<br />
direct proportional relationship implying that, as the PG students’<br />
SERVEXP improves, so will the perceptions <strong>of</strong> the PGSQUAL.<br />
Table 5: Pearsons’ Correlation<br />
SERV-SAT SERV-EXP PGS-QUAL<br />
Pearson Correlation<br />
SERVSAT<br />
Sig. (2-tailed)<br />
1 -.028<br />
.779<br />
.151<br />
.120<br />
Pearson Correlation<br />
SERVEXP<br />
Sig. (2-tailed)<br />
-.028<br />
.779<br />
1 .428**<br />
.000<br />
PGSQUAL Pearson Correlation .151 .428** Sig. (2-tailed) .120 .000<br />
1<br />
The relationship between the SERVEXP, PGSQUAL and SERVS-<br />
AT was further explored using structural equation modelling to test the propositions<br />
(P1-P3). The proposed model was fitted to the data using AMOS<br />
Version 19 (2010) and the results are reflected in Table 6 and Figure 1.<br />
PGSQUAL
The Postgraduate Service Experience …<br />
Although it became apparent that the chi-square test statistic was<br />
19.143 with a p-value <strong>of</strong> 0.000, which implied that the data does not fit the<br />
model well (Schumacker Lomax 2004; Byrne 2010), the parameter estimates<br />
reflected in Table 6 were considered. It was evident that there is a significant<br />
association between SERVEXP and PGSQUAL as well as SERVEXP and<br />
SERVSAT. This result highlights the importance <strong>of</strong> the service experience<br />
<strong>of</strong> postgraduate students with respect to it influencing their overall<br />
satisfaction with the service quality. Thus P1 and P3 are supported and at the<br />
5% significance level.<br />
Figure 1: Results <strong>of</strong> Structural Equation Modelling<br />
Discussion <strong>of</strong> Significant Findings<br />
In addition to the development <strong>of</strong> two new reliable and valid research<br />
instruments, this study has confirmed the association between the PG service<br />
experience, PG service quality, and PG service satisfaction.<br />
These findings thus confirm what other researchers (Alridge &<br />
Rowley 1998; Carillat, Jaramillo & Mulki 2009) assert, but is in contrast<br />
with the view <strong>of</strong> Bolton and Drew (1991), who argued that customer<br />
satisfaction is an antecedent <strong>of</strong> service quality. On the basis <strong>of</strong> the present<br />
245
Krishna K. Govender & Shaun Ramroop<br />
study it may be possible to assert that with respect to PG students, the<br />
totality <strong>of</strong> the student experience is a useful perspective to adopt in student<br />
satisfaction in marketing terms.<br />
However, no relationship was ascertained between the PG service<br />
experience and PG service satisfaction, although service quality is connected<br />
with the service satisfaction.<br />
Conclusion<br />
In summing up the PG experience, we must guard against falling into what<br />
Schneider and Bowen (1993:39-56) refer to as the ‘human resources trap’,<br />
emphasizing only the personal contact relative to exclusion <strong>of</strong> the nonpersonal.<br />
We therefore need to embrace a broader definition <strong>of</strong> the service<br />
encounter to refer to anytime students come into contact with any aspect,<br />
and use that contact as one basis for judging quality. The institution has to<br />
therefore manage ‘all the evidence’ so as to ensure a seamless service<br />
experience for the PG student. It must be emphasized that one reason for<br />
conducting this and similar research is ‘improvement’, which is sometimes<br />
referred to as ‘closing the quality loop’ since although many tertiary<br />
institutions around the world collect student feedback, the interconnection<br />
between the student feedback and actual institutional change is not always<br />
evident or addressed. The mere collection <strong>of</strong> student feedback using<br />
questionnaires does not in itself lead to improvement in teaching and<br />
learning; there should be evidence that such feedback is factored into interalia,<br />
institutional postgraduate policies.<br />
Value <strong>of</strong> this Research<br />
This exploratory study represents but one attempt to address the concern<br />
about the extant research on postgraduate students, and represents a step<br />
towards closing the ‘gap’ mentioned in the introduction, in that it resulted in<br />
the development and validation <strong>of</strong> two research instruments, namely<br />
PGSQUAL and SERVEXP, both <strong>of</strong> which could be used by researchers<br />
interested in higher education quality matters.<br />
Furthermore, since student satisfaction and retention are closely<br />
linked, students’ perception <strong>of</strong> the service quality has become an extremely<br />
246
The Postgraduate Service Experience …<br />
important issue for universities and their management. This importance <strong>of</strong><br />
the association between PG student satisfaction and service quality was<br />
confirmed by this research. Managing this association is important since the<br />
aim is to try to maximize students’ satisfaction with their education<br />
experience whilst they are at university and minimize dissatisfaction not<br />
only to retain students, but also to improve the institution’s performance<br />
ratings and so aid recruitment <strong>of</strong> postgraduates.<br />
Limitations and Opportunities for Future Research<br />
Considering that the sample was 27% <strong>of</strong> the population and the response rate<br />
only 14% <strong>of</strong> the population, the results may need to be interpreted with some<br />
caution before generalizations can be made. Perhaps the findings could be<br />
treated as preliminary insights into the defined target population and future<br />
research should target a larger sample.<br />
A common problem in using surveys <strong>of</strong> graduates’ experience at the<br />
time <strong>of</strong> graduation as performance indicators is the lag between experience<br />
and report. This may be true for the current study as well. Research into the<br />
service experience should be as real and recent as possible: that is interviews<br />
should be done as close to consumption <strong>of</strong> an actual service as possible, so<br />
that evaluations remain fresh in the consumers’ minds and so that<br />
experiential benefits are not forgotten or replaced with more cognitively<br />
accessible functional benefits.<br />
While this research has enhanced our understanding <strong>of</strong> the PG<br />
service experience, it is somewhat static in nature and does not fully lend<br />
insights into the dynamics <strong>of</strong> the service encounter. For example it does not<br />
indicate how PG students might trade <strong>of</strong>f their evaluations <strong>of</strong> different<br />
aspects <strong>of</strong> the service experience in arriving at overall satisfaction.<br />
References<br />
Alridge, S & J Rowley 1998. Measuring Customer Satisfaction in Higher<br />
Education. Quality Assurance in Education 6,4:197-204.<br />
AMOS, 1999. User’s Guide 4.0. Chicago, IL.: Smallwaters Corp.<br />
247
Krishna K. Govender & Shaun Ramroop<br />
Angell, RJ, TW Hefferman & P Megicks 2008. Service Quality in<br />
Postgraduate Education. Quality Assurance in Higher Education 16,3:<br />
236-254.<br />
Bolton, RN & JH Drew 1991. A Multi-Stage Model <strong>of</strong> Customer’s<br />
Assessment <strong>of</strong> Service Quality and Value. <strong>Journal</strong> <strong>of</strong> Consumer<br />
Research 17,4: 375-384.<br />
Byrne, BM 2010. Structural Equation Modelling with AMOS: Basic<br />
Concepts, Applications and Programming. Mahwah, NJ: Routledge and<br />
Taylor and Francis Group.<br />
Carrilat, FA F Jaramillo & JP Mulki 2009. Examining the Impact <strong>of</strong> Service<br />
Quality: A Meta-analysis <strong>of</strong> Empirical Evidence. <strong>Journal</strong> <strong>of</strong> Marketing<br />
Theory and Practice 17,2:95-110.<br />
Coakes, S & l Steed 2003. SPSS Analysis without Anguish. Version 11.0 for<br />
Windows. Milton: Miley Press.<br />
Cortina JM 1993. What is Coefficient Alpha? An Examination <strong>of</strong> Theory<br />
and Applications. <strong>Journal</strong> <strong>of</strong> Applied Psychology 78,1:98-104.<br />
Cronin, JJJ & SA Taylor 1992. Measuring Service Quality: A Reexamination<br />
and Extension. <strong>Journal</strong> <strong>of</strong> Marketing 15,3:53-68.<br />
Dale BG 2003. Managing Quality. 4 th Edition. Oxford: Blackwell<br />
Publishing.<br />
Dann, S 2008. Applying Services Marketing Principles to Postgraduate<br />
Supervision. Quality Assurance in Education 16,4: 333-346.<br />
De Jager, J & G Gbadamosi 2010. Specific Remedy for Specific Problem:<br />
Measuring Service Quality in South African Higher Education. Higher<br />
Education 60: 251-267.<br />
Douglas, JR McClelland & J Davies 2008. The Development <strong>of</strong> a<br />
Conceptual Model <strong>of</strong> Student Satisfaction with their Experience in<br />
Higher Education. Quality Assurance in Education 16,1: 19-35.<br />
Drennan, J 2008. Postgraduate Research Experience Questionnaires:<br />
Reliability and Factor Structure with Master’s in Nursing Students. JAN<br />
Research Methodology 487-498.<br />
Ford, JB, M Joseph & B Joseph 1999. Importance-performance Analysis as<br />
a Strategic Tool for Service Marketers: The Case <strong>of</strong> Service Quality<br />
Perceptions <strong>of</strong> Business Students in New Zealand and USA. The <strong>Journal</strong><br />
<strong>of</strong> Services Marketing 3,2: 171-186.<br />
Fridaus, A 2006. Measuring Service Quality in Higher Education: Three<br />
248
The Postgraduate Service Experience …<br />
Instruments Compared. International <strong>Journal</strong> <strong>of</strong> Research & Methods in<br />
Education 29,1: 71-89.<br />
Govender, KK 1998. Managing Service Quality by Managing the Service<br />
Encounter: The Effects <strong>of</strong> Organizational Socialization Strategies.<br />
Unpublished PhD Thesis, <strong>University</strong> <strong>of</strong> Cape Town.<br />
Ginns, P, HW Marsh, M Behnia, JH Cheng & LF Scalas 2009. Using<br />
Postgraduate Students’ Evaluations <strong>of</strong> Research Experience to<br />
Benchmark Departments and Faculties: Issues and Challenges. British<br />
<strong>Journal</strong> <strong>of</strong> Educational Psychology 79: 577-598.<br />
Hair, JF. Jr., RP Bush. & DJ Ortinau 2000. Marketing Research: A Practical<br />
Approach for the New Millennium. Singapore: McGraw-Hill.<br />
Hair, M 2006. Superqual: A Tool to Explore the Initial Expectations <strong>of</strong> PhD<br />
Students and Supervisors. Active Learning in Higher Education 7,1: 9-<br />
23.<br />
Oldfield, B & S Baron 2000. Student Perceptions <strong>of</strong> Service Quality in a UK<br />
<strong>University</strong> Business and Management Faculty. Quality Assurance in<br />
Higher Education 8,2:85-95.<br />
Parasuraman, A, ZA Zeithaml & LL Berry 1988. SERVQUAL: A Multiple<br />
Item Scale for Measuring Customer Perceptions <strong>of</strong> Service Quality.<br />
<strong>Journal</strong> <strong>of</strong> Retailing 64,1: 12-40.<br />
Schumacker, RE & GL Lomax 2004. A Beginner’s Guide to Structural<br />
Equation Modelling. London: Lawerence Erlbaum Associates.<br />
Stodnick, M & P Rogers 2008. Using SERVQUAl to Measure the Quality <strong>of</strong><br />
the Classroom Experience. Decision Sciences <strong>Journal</strong> <strong>of</strong> Innovative<br />
Education 6,1:115-133.<br />
www. QuestionPro.com 2010.<br />
Zeithaml VA & MJ Bitner 2000. Services Marketing: Integrating Customer<br />
Focus across the Firm. 2 nd Edition. Boston, MA: McGraw-Hill.<br />
249<br />
Krishna K Govender<br />
Faculty <strong>of</strong> Management Studies<br />
<strong>University</strong> <strong>of</strong> <strong>KwaZulu</strong>-<strong>Natal</strong><br />
Pietermartizburg<br />
South Africa<br />
govenderkr@ukzn.ac.za
Krishna K. Govender & Shaun Ramroop<br />
250<br />
Shaun Ramroop<br />
Department <strong>of</strong> Statistics<br />
<strong>University</strong> <strong>of</strong> Kwazulu-<strong>Natal</strong><br />
Pietermaritzburg<br />
South Africa<br />
ramroops@ukzn.ac.za
The Social Impact <strong>of</strong><br />
Information Systems at a<br />
Tertiary Institution<br />
Sam Lubbe<br />
Maishe Bopape<br />
Abstract<br />
Tertiary educational institutes have had many Information Systems (IS)<br />
developed and implemented for the use <strong>of</strong> end-users. The problem is that<br />
more <strong>of</strong>ten than not, the impacts <strong>of</strong> IS on social communities <strong>of</strong><br />
organisations have not been taken into account. This research explores the<br />
issues <strong>of</strong> the interface between IS and society, and addresses the social<br />
impact <strong>of</strong> these systems. A thorough investigation <strong>of</strong> the IS and users <strong>of</strong><br />
those systems at the <strong>University</strong> <strong>of</strong> South Africa has been undertaken in this<br />
study. This research proposes a set <strong>of</strong> guidelines to help ensure that the<br />
social impacts <strong>of</strong> tertiary institutes’ IS are taken into account in the design<br />
and implementation <strong>of</strong> these systems, thereby increasing the chance <strong>of</strong><br />
success <strong>of</strong> those systems.<br />
Keywords:Social informatics, socio-technical systems, social context, user<br />
involvement, Information Systems, Information Technology, user acceptance<br />
and technology adoption.<br />
Introduction<br />
A serviceable working conception <strong>of</strong> social informatics is that it identifies a<br />
body <strong>of</strong> research that examines the social aspects <strong>of</strong> computerisation (Kling,<br />
2000). Kling notes that it is the interdisciplinary study <strong>of</strong> the design, uses<br />
and consequences <strong>of</strong> Information Systems (IS) that also takes into account<br />
their interaction with institutional and cultural contexts. Due to the IS<br />
implications <strong>of</strong> this study, this research is classified in the field <strong>of</strong> Social<br />
<strong>Alternation</strong> Special Edition 4 (2011) 251 – 287<br />
ISSN 1023-1757<br />
251
Sam Lubbe & Maishe Bopape<br />
Informatics. This research therefore explores the issue <strong>of</strong> the interface<br />
between IS and the community <strong>of</strong> users.<br />
Problem Statement<br />
The <strong>University</strong> <strong>of</strong> South Africa (UNISA) is one <strong>of</strong> the bigger distance<br />
learning universities in the world with over two hundred thousand (200 000)<br />
registered students for the 2007 academic year (UNISA 2007). This current<br />
and prospective community <strong>of</strong> users try to access information on the various<br />
websites <strong>of</strong> UNISA, struggling to find the relevant information. This may be<br />
because the system designed by the authorities, is not always user friendly.<br />
Also, to facilitate open distance learning, academics develop study material<br />
for students to access electronically on various UNISA sites (myUNISA,<br />
EDS & Osprey).<br />
Students and staff members accessing or utilising these listed<br />
systems expressed concern during a pre-study mini-survey by e-mail about<br />
navigating the sites to get information or accessing services. Based on<br />
various complaints and queries by students and staff members as well as<br />
informal discussions, this mini-survey was conducted by the researcher<br />
requesting the respondents (these include lecturers and students) to search<br />
three elementary items on the relevant sites. More than half <strong>of</strong> the<br />
respondents indicated that it was not easy to find the information. They<br />
argue that they spent time searching for the information jumping from one<br />
page to the other without getting the information.<br />
The observations made by the researchers were confirmed in the<br />
management meeting <strong>of</strong> the School <strong>of</strong> Computing held 23rd May 2007.<br />
Senior Pr<strong>of</strong>essors <strong>of</strong> Computer Science and IS complained about the<br />
difficulty in accessing information from UNISA systems, and also how and<br />
why these systems were implemented without them being socially involved<br />
(School <strong>of</strong> Computing 2007). Specific issues <strong>of</strong> concern, which require<br />
investigation and verification on the UNISA’s Information and<br />
Communication Technology (ICT) systems, were:<br />
• The influence <strong>of</strong> community <strong>of</strong> users’ involvement in the success <strong>of</strong><br />
systems;<br />
• Inclusion <strong>of</strong> all user requests; and<br />
• The development <strong>of</strong> systems without consulting and involving users.<br />
252
The Social Impact <strong>of</strong> Information Systems …<br />
Delimitation <strong>of</strong> the Study<br />
Only one institution <strong>of</strong> higher learning, UNISA, is investigated. The research<br />
study will however only focus on the social factors and specifically user<br />
perceptions and impact <strong>of</strong> UNISA systems. Figure 1 below defines the<br />
delineation <strong>of</strong> the study.<br />
Figure 1. Diagrammatic Representation <strong>of</strong> what the study will focus on<br />
Source: Lubbe and <strong>Klopper</strong> (2008)<br />
Foundation <strong>of</strong> the Study<br />
This study’s context is the field <strong>of</strong> Social Informatics. There is speculation<br />
about the social impact when new ICT are to be planned and developed<br />
(Kling 2000). Questions about the consequences <strong>of</strong> new technologies are<br />
<strong>of</strong>ten posed in a very black and white manner. People expect a<br />
straightforward ‘yes-or-no’ answer. However, life is not that simple, and<br />
usually there are no clear-cut answers (Kling 2000). Therefore, the social<br />
changes that might occur because <strong>of</strong> the implementation <strong>of</strong> new and complex<br />
ICT need to be analytically and empirically researched (Kling 2000). This<br />
research explores issues <strong>of</strong> the interface between IS and the community <strong>of</strong><br />
users at UNISA.<br />
253
Sam Lubbe & Maishe Bopape<br />
IS at Tertiary Institutes<br />
Tertiary education institutes around the globe have had many IS developed<br />
and implemented for the use <strong>of</strong> students and lecturers/academic personnel<br />
(Hall 2006). He continues that the problem is that more <strong>of</strong>ten than not, the<br />
impacts <strong>of</strong> IS on social communities <strong>of</strong> organisations are not taken into<br />
account, and/or insufficient attention is paid to them. He also argues that, the<br />
social impacts <strong>of</strong> IS are rarely taken into account when systems are being<br />
designed or implemented, and as a result leads to many IS failures. King and<br />
Zmud (1981) suggests that factors such as the organisation, the environment,<br />
the task, personal and interpersonal characteristics, as well as Management<br />
Information Systems (MIS), staff characteristics and policies can influence<br />
the success <strong>of</strong> system implementation.<br />
Technological innovations have allowed educational institutions the<br />
opportunity to expand enrolment and <strong>of</strong>fer courses beyond the traditional<br />
classroom setting (Clow 1999). Distance learning delivery systems include<br />
television, interactive television, online computers and the Internet (Clow<br />
1999). He argues that students are able to earn degrees without even setting<br />
a foot on an actual college campus. He argues that the impact <strong>of</strong><br />
technologies on students is a concern.<br />
Social Nature <strong>of</strong> IS<br />
For the purpose <strong>of</strong> this research IS is defined as the various technologies<br />
used in the creation, acquisition, storage, organisation, dissemination,<br />
retrieval, processing, manipulation, interpretation, transmission <strong>of</strong><br />
information to accumulate knowledge and expedite communication (Chan<br />
2002; Moll 1983).<br />
IS applications conceived from the perspective <strong>of</strong> rationalistic<br />
explanation <strong>of</strong> how IS used in an organisation exhibit Tayloristic work<br />
design. This work design focuses on the individual’s task productivity while<br />
under-estimating the importance <strong>of</strong> the social context. This, according to<br />
Roode (2003), <strong>of</strong>ten leads to inappropriate application designs, difficulty <strong>of</strong><br />
use and outright failure <strong>of</strong> many information technologies. Chaharbaghi and<br />
Willis (2000) argue that technology forms some sort <strong>of</strong> a paradox, which is<br />
that individual’s survival depends on the technology, but their problems also<br />
derive from it.<br />
Therefore, IS support and facilitate human and social processes and<br />
254
The Social Impact <strong>of</strong> Information Systems …<br />
contributes towards a meaningful work life for the users within an<br />
organisation. Roode (2003) concludes that IS are developed by people for<br />
people and are therefore, rooted within human nature, which is the social<br />
context.<br />
The ‘impact’ that the introduction and use <strong>of</strong> IT may have on the<br />
organisation, on work and on the users in an organisation can either be <strong>of</strong> a<br />
technology nature, that are <strong>of</strong>ten explicitly known; or <strong>of</strong> a social nature,<br />
which are those that are usually not easily identifiable (Kling 2000). Hall<br />
(2006) argues that it is important that the technological and social factors<br />
should be managed. The focus <strong>of</strong> this study is on the social factors <strong>of</strong> IS.<br />
Social Context<br />
According to Horton et al. (2005) the introduction and utilisation <strong>of</strong><br />
technology in organisational settings are more complex than technologically<br />
deterministic accounts. The social context in which IS function is<br />
specifically examined in social informatics research. This particular research<br />
can thus be considered as social informatics research. Kling (2000) describes<br />
social informatics as the body <strong>of</strong> research that examines the design, uses and<br />
consequences <strong>of</strong> ICT in ways that take into account their interaction<br />
institutional and cultural contexts. It can therefore be said that the IS social<br />
context is important when considering the areas <strong>of</strong> IS. Kling (1999) states<br />
that social context does not refer to some abstract ‘cloud’ that hovers above<br />
people and IS. Rather, it refers to a specific matrix <strong>of</strong> social relationships.<br />
According to Lamb and Kling (2003) several organisations have<br />
stressed the need for a larger environmental scope when dealing with ICT<br />
use. They noted that the individual ICT use is influenced by organisational,<br />
cultural, and global contexts, as well as by the social context within the<br />
environment. Wood-Harper and Wood (2005) inform that defining an IS in<br />
action can be construed as a paradigm <strong>of</strong> assumptions, which in turn is<br />
socially constructed. They, and Horton et al. (2005), conclude that<br />
technological and social practices <strong>of</strong> organisations are inseparable.<br />
Adoption, development and use <strong>of</strong> IS are shaped by the institutional<br />
environment that envelops the IS. Lamb and Kling (2003) argue that users <strong>of</strong><br />
IS in organisations utilise multiple ICT applications as part <strong>of</strong> their effort to<br />
produce goods and/or services while interacting with a variety <strong>of</strong> other<br />
255
Sam Lubbe & Maishe Bopape<br />
people, and <strong>of</strong>ten in multiple social contexts. This implies that the social<br />
context within which IS operates play a role and therefore must be<br />
considered when designing and implementing these systems.<br />
According to Rosenbaum and Sawyer (2000), IS take place within a<br />
social context and are influenced by a wide range <strong>of</strong> non-technical decisions<br />
and practices. These social issues are <strong>of</strong>ten overlooked even though they<br />
<strong>of</strong>ten bear directly on the success and failure <strong>of</strong> IS. Mansell (2005) states<br />
that the social context <strong>of</strong> IS is an important matter and is one <strong>of</strong> Rob Kling’s<br />
statements. Rosenbaum and Sawyer (2000) support this by stating that that<br />
ICT and IS do not exist in social or technical isolation. Lamb and Kling<br />
(2003) also argue that people together with their technologies comprise<br />
social networks. Therefore the technical and social issues are inseparable<br />
and must both be considered when viewing IS.<br />
Bostrom and Heinen (1977) categorise social systems analysis into<br />
four general areas as follows:<br />
• Individual needs, characteristics, and abilities <strong>of</strong> people in the work<br />
system;<br />
• Internal work system characteristics;<br />
• External environment <strong>of</strong> the work system; and<br />
• Support system for that work system.<br />
This categorisation is still relevant and used in modern times.<br />
Moreover, the various areas <strong>of</strong> analysis need to be broadened to fully<br />
account for the social context <strong>of</strong> IS. Rosenbaum and Sawyer (2000) state<br />
that the social context <strong>of</strong> IS development and use plays a significant role in<br />
influencing the ways people use IS. Thus, the social context <strong>of</strong> IS influences<br />
people’ consequences for work, organisations and other social relationships.<br />
The idea <strong>of</strong> social context is inherent when considering the social<br />
informatics research area. Social informatics research pertains to IS use and<br />
social change in any sort <strong>of</strong> social setting, which may include societies,<br />
individuals and organisations (Kling 1999). The idea behind social<br />
informatics is that the social context <strong>of</strong> IS development and use plays a<br />
significant role in influencing the ways that people use information and<br />
technologies. Social informatics focuses on the social consequences <strong>of</strong> the<br />
design, implementation and use <strong>of</strong> IS over a wide range <strong>of</strong> social and<br />
organisational settings.<br />
256
The Social Impact <strong>of</strong> Information Systems …<br />
Kling (1999) states that social repercussions <strong>of</strong> new technologies are<br />
usually taken into account. These repercussions include: sponsorship <strong>of</strong><br />
projects, training people to use new systems and controls over access to<br />
information. He goes on to suggest that these social repercussions are<br />
insufficient; and larger social context must be taken into account.<br />
According to Kling and Star (1998), the idea <strong>of</strong> human centred<br />
systems promises that the knowledge <strong>of</strong> human users and social context in<br />
which systems are expected to operate, become integrated into the design<br />
and implementation <strong>of</strong> systems. When using human centred analysis, one<br />
must take into account the various social units that structure work,<br />
information, organisations and teams, and communities and their distinctive<br />
social processes and practices.<br />
Amory (2003) suggests that the development or selection <strong>of</strong><br />
appropriate systems need to take into account institutional and current user<br />
needs. This can only be done by taking the social context <strong>of</strong> the IS into<br />
account and carrying out a thorough analysis there<strong>of</strong>.<br />
Impact <strong>of</strong> IS on the Social Community within Institutions<br />
In educational contexts, the changes brought by the introduction <strong>of</strong> IS have<br />
variously been perceived as either: a great good (Hill 1999), a virulent evil<br />
(Brabazon 2002), or neither (Shields 2000). Regardless <strong>of</strong> its relative value,<br />
all the above authors agree that IS has greatly impacted education activities,<br />
aims and aspirations. Yusuf (2005) also supported the above three in saying<br />
that the field <strong>of</strong> education has not been unaffected by the penetrating<br />
influence <strong>of</strong> ICT. Yusuf argues that ICT have impacted on the quality and<br />
quantity <strong>of</strong> teaching, learning, and research in traditional and distance<br />
education institutions.<br />
As IS developed, it provided increasing opportunities, options and<br />
strategies for education (Hill 1999). Kroeker (2000) argues that the<br />
prevalence <strong>of</strong> IS generated an expectation that all education institutions will<br />
have a virtual as well as a physical location, and that students can access <strong>of</strong><br />
the information they need via a web browser. This capacity <strong>of</strong> IS to modify<br />
traditional understanding <strong>of</strong> the location <strong>of</strong> education, suggests the need for<br />
a completely different set <strong>of</strong> social and institutional infrastructures with<br />
which learning can be facilitated (Shields 2000).<br />
Dertouzos (1998) argues that the current reformation <strong>of</strong> IS impacts<br />
257
Sam Lubbe & Maishe Bopape<br />
education, since it mediates the way information is stored and transmitted;<br />
while Watson (2001) notes that IS brings about change in the way<br />
information is also learnt and taught. These changes <strong>of</strong> access, learning and<br />
teaching have particular bearing on education and impact social community<br />
within institutions.<br />
While education has historically been centred on teaching and<br />
learning, Duderstat (1999) argues that IS has affected changes to the aims <strong>of</strong><br />
education. Education is therefore increasingly perceived as the process <strong>of</strong><br />
creating, preserving, integrating, transmitting and applying knowledge. IS<br />
particularly impacts course content and teaching methodology and the<br />
recruitment and training <strong>of</strong> teaching staff (Hill 1999).<br />
In considering the impact <strong>of</strong> IS, changes have been evident in the<br />
methods (Hill 1999; Shields 2000; Watson 2001), purpose (Dunderstat 1999;<br />
Hill & Shields 2000), and the perceived potential <strong>of</strong> education (Duderstat<br />
1999; Hill 1999; Kroeker 2000). While these authors have differed in their<br />
opinion <strong>of</strong> the degree, desirability and destiny <strong>of</strong> these changes, they all<br />
agree that change processes have certainly been underway which impact<br />
socially on the individual interacting with this technology.<br />
For people trying to use these various technologies in a domestic<br />
setting for educational purposes, there are a range <strong>of</strong> potential problems and<br />
possibilities that are not simply attributes <strong>of</strong> the technologies per se, but<br />
arise from the relationship <strong>of</strong> the technologies with the social environment<br />
(Kirkwood 2000). Kirkwood (2000) argued that research with students and<br />
all other community <strong>of</strong> users is necessary in order to reveal the significance<br />
<strong>of</strong> the diversity <strong>of</strong> learners’ experiences and contexts. This could mean their<br />
involvement in System Development and Planning.<br />
Through IS more people are able to network and thereby ensure they<br />
contribute to the impact they can have on the systems they use (Mao 2002).<br />
They are also able to appreciate one another even though there are cases<br />
where there may be breakdown <strong>of</strong> trust due to increased networking (Levy<br />
2005), which is another form <strong>of</strong> Social Impact. What one notes is that more<br />
people are able to understand where they can obtain specific types <strong>of</strong><br />
information. Those who want to collaborate in research can also find each<br />
other more easily (Levy 2005). Theory <strong>of</strong> Reasoned Action is thus enhanced<br />
through IS because causal relations can easily be identified. The increased<br />
networking <strong>of</strong>ten improves attitudes <strong>of</strong> people with common interests. As a<br />
258
The Social Impact <strong>of</strong> Information Systems …<br />
result their intentions tend to become more positive, and their behaviours<br />
can be easily improved.<br />
User Involvement and Participation Relation to IS Success<br />
The domestication theory was founded by Silverstone and Haddon (1996)<br />
who view technologies as social, cultural, political and economic products<br />
which play a symbolic and aesthetic as well as material and functional role.<br />
It entails having to consult users regarding issues <strong>of</strong> relevance in their work<br />
and obtaining buy-in for own ideas. Pedersen (2003) distinguish between the<br />
first system development and/or planning decision, which refers to decision,<br />
and post-start decisional behaviour. They recommend that system<br />
development and/or planning be seen as a transition between stages <strong>of</strong><br />
increasing consumer sophistication in the consumer life cycle rather than a<br />
specific event. Brown and Randell (2004) use the term ‘dwelling’ with<br />
technology to describe the study <strong>of</strong> technology system development and/or<br />
planning over a long period <strong>of</strong> time where the context in which technology is<br />
used may change.<br />
The concept <strong>of</strong> domestication was derived from the British studies<br />
on consumption. It refers to the taming <strong>of</strong> a system development and/or<br />
planning by the individual and focuses on the process that integrates<br />
technology into everyday domestic life (Pedersen 2003). The domestication<br />
approach considers the following phases in the adoption process (Silverstone<br />
& Haddon 1996; Ling 2001; Habib 2003): Commodification - The way a<br />
technology is designed to give it an image with a number <strong>of</strong> functional,<br />
aesthetic and symbolic claims; Imagination - The way in which a system<br />
development and/or planning enters our consciousness; Appropriation - The<br />
actual production <strong>of</strong> the technology; Objectification - The phase in which<br />
the technology system development and/or planning is acceptable and<br />
familiar in the daily life <strong>of</strong> the consumer; Incorporation - Integrating the<br />
technology with daily use; Conversion - The technology becomes fitted into<br />
routines and is seen by others as part <strong>of</strong> the individual’s identity.<br />
The domestication approach considers system development and/or<br />
planning rather than mere use, and views adoption as a process rather than a<br />
specific event (Ling 2001; Haddon 2003). The domestication approach aims<br />
to discern the interaction between the innovation and the context in which it<br />
259
Sam Lubbe & Maishe Bopape<br />
is being placed. Therefore contexts are <strong>of</strong>ten contrasted, for example work<br />
versus leisure, private versus public, and contrasts between users in different<br />
demographic groups (Ling 2001).<br />
Domestication studies do ex post facto examination <strong>of</strong> system<br />
development and/or planning to understand why a technology has been<br />
adopted and why not (Pedersen 2003). It is intended as a tool for observing<br />
adoption rather than a tool for the prognosis <strong>of</strong> an adoption (Ling 2001).<br />
This paper views users as social entities, which is in accordance<br />
with the domestication approach. The acknowledgement <strong>of</strong> the importance<br />
<strong>of</strong> context and the post-adoption focus make the domestication approach<br />
relevant to understanding the factors that influence system development.<br />
Critical Application <strong>of</strong> Literature<br />
The development and planning <strong>of</strong> IS is a complex process that entails a mix<br />
<strong>of</strong> technological, social and organisational interactions (Gal & Berente<br />
2008). It involves multiple stakeholder groups which have varying needs,<br />
interests and capabilities (Gal & Berente 2008). They suggest that different<br />
groups may have different interpretations and perceptions <strong>of</strong> the developed<br />
and planned technology and its purpose, hence their involvement in the<br />
initial stage <strong>of</strong> IS projects is necessary for the projects to be successful.<br />
The key to the successful diffusion <strong>of</strong> advanced IS is whether new<br />
applications are responsive to the social, economic and cultural conditions<br />
within which people work and live (Crede’ 1997). He argues that<br />
involvement <strong>of</strong> users at an early stage <strong>of</strong> development and planning allows<br />
early identification <strong>of</strong> key choices available to users and producers <strong>of</strong> IS.<br />
The improved understanding on the part <strong>of</strong> users <strong>of</strong> their own<br />
requirements and the changes in the environment in which they operate is<br />
needed if advanced applications are to be incorporated successfully within<br />
commercial and consumer lifestyle (Crede’ 1997).This suggests the need to<br />
move beyond awareness campaigns towards measures which enable users to<br />
learn and fully understand how IS can address their needs (Crede’ 1997).<br />
This might mean users need to be involved in the development and planning<br />
<strong>of</strong> IS. Lastly how the designed and implemented IS at impact socially on the<br />
community <strong>of</strong> users is not directly or specifically addressed by literature and<br />
this research attempts to address.<br />
260
The Social Impact <strong>of</strong> Information Systems …<br />
Research Questions<br />
The literature study addressed the history <strong>of</strong> the social impact <strong>of</strong> IS. Most <strong>of</strong><br />
the issues have been addressed but the following still remain an issue:<br />
• Does the social relationships <strong>of</strong> users during system development<br />
and/or planning impact on IS?<br />
• To what degree are the users <strong>of</strong> the UNISA IT involved and<br />
participate in the development and/or implementation <strong>of</strong> these<br />
systems?<br />
• How does user involvement and participation relate to IS success?<br />
• What social factors influence the development and/or planning <strong>of</strong><br />
IS?<br />
Conclusion<br />
IS are social systems rather than technical systems (Lamb & Kling 2003).<br />
Computer systems structure social relationships and not just information. It<br />
can therefore be said that IS’s affect more than just the way that users<br />
perform tasks (Kling 1999). The development and planning <strong>of</strong> an IS is a<br />
social process involving users and systems analysts, carried out in an<br />
organisational setting, and therefore as a social process have social<br />
consequences (Lamb & Kling 2003).<br />
Research Methodology<br />
Since this research study aims to answer the research questions developed by<br />
surveying the attitudes <strong>of</strong> students and staff on UNISA’s IS as well as to<br />
uncover the social impact <strong>of</strong> UNISA’s IS on the social community within the<br />
institution (this research is descriptive and explanatory in nature), the<br />
questionnaire has been chosen as the data-gathering tool. This will allow the<br />
collection <strong>of</strong> quantifiable data and allow for the quantitative analysis <strong>of</strong> this<br />
data to determine patterns and relationships.<br />
Developing the Questionnaire<br />
Research questions can be considered as critical questions which are based<br />
on the research problems under investigation. The following are details <strong>of</strong><br />
the research questions that formed the bases <strong>of</strong> this study and were used to<br />
261
Sam Lubbe & Maishe Bopape<br />
formulate the research tool, the questionnaire. The different questions <strong>of</strong> the<br />
questionnaire are specified under the research question/s that was used to<br />
formulate them:<br />
1. What is the impact <strong>of</strong> UNISA IS within the institution?<br />
o Questions 1 – 6 and 23 – 26 in the questionnaire<br />
2. In what ways does the social relationships <strong>of</strong> users during system<br />
development/or planning impact on IS?<br />
o Questions 18 – 20 and 23 – 26 in the questionnaire<br />
3. To what degree are the users <strong>of</strong> UNISA IS involved and participate<br />
in the development and/or planning <strong>of</strong> these systems?<br />
o Questions 7 – 17 in the questionnaire<br />
4. How does user involvement and participation relate to IS success?<br />
o Questions 7 – 17, 21 – 22 and 27 in the questionnaire<br />
5. What social factors influence the development and/or planning <strong>of</strong><br />
IS?<br />
o Questions 1 – 6 and 23 – 26 in the questionnaire<br />
Questionnaire Validation and Finalisation<br />
The questionnaire was tested by sending it to two friends and one academic<br />
person to read it and if their understanding is same <strong>of</strong> the authors. The<br />
people did not recommend any changes to the questionnaire. After receiving<br />
the responses and feedback from the pilot group, the questionnaire was<br />
updated. After discussing the second draft the questionnaire was finalised.<br />
The final questionnaire was then discussed with the supervisor. It was<br />
circulated through e-mail to the targeted population after necessary<br />
approvals from the Supervisor.<br />
Population and Sample Size<br />
The population consists <strong>of</strong> both academics and students who use the system<br />
for information. For classification purposes they will all be regarded as the<br />
same user for this study. In this study that subpopulation, or sample frame,<br />
consisted <strong>of</strong> staff and students who were around Pretoria during the time <strong>of</strong><br />
the study. The research sample was selected from the sample frame. A<br />
sample <strong>of</strong> size 384 was selected for the results to be statistically significant.<br />
262
The Social Impact <strong>of</strong> Information Systems …<br />
The population consists <strong>of</strong> both academics and students who use the<br />
systems for information. For classification purposes they will all be regarded<br />
as the same user for this study. The sample consists <strong>of</strong> users <strong>of</strong> myUNISA,<br />
EDS and Osprey, which is the UNISA’s principal IS. The sample size was<br />
384, which was the required size according to Krejcie and Morgan (1970)<br />
for the results to be statistically significant.<br />
Data Handling<br />
No permission is required to run the survey. The questionnaire was<br />
administered through e-mail. According to Witmer et al. (1999) cited by<br />
Saunders et al. (2003), e-mail <strong>of</strong>fers greater control as to who answers the<br />
questionnaire because most users read and respond to their own mail at their<br />
personal computer. Data analysis was done through Excel. A few minor<br />
consultations were made with statisticians in the <strong>University</strong>’s Department <strong>of</strong><br />
Statistics and the South African Revenue Services.<br />
Data Analysis and Interpretation<br />
Respondents Pr<strong>of</strong>iles<br />
A total <strong>of</strong> 384 respondents answered the questionnaire. Some respondents<br />
were also temporary or permanent staff members <strong>of</strong> UNISA. The<br />
respondents consisted <strong>of</strong> 233 (60.7%) respondents that are only students and<br />
151 (39.3%) who are also temporary or permanent staff members <strong>of</strong> the<br />
university. The respondents were all given an equal chance to be included in<br />
the study.<br />
Nearly 40% <strong>of</strong> the respondents are between the ages 25 and 34 (the<br />
reason might be that they preferred to work first to pay their own study fees),<br />
between 18 and 24 are 26% <strong>of</strong> the respondents, and between the ages <strong>of</strong> 35<br />
and 44 26% <strong>of</strong> the respondents. There were 28% respondents from<br />
Management studies and 72% from other colleges. It supports the fact that<br />
the College <strong>of</strong> Economic and Management Studies is the college with the<br />
largest number <strong>of</strong> student registrations at UNISA.<br />
If Student, Year <strong>of</strong> Study<br />
In this instance a total <strong>of</strong> 327 people responded. There were 94 first years,<br />
263
Sam Lubbe & Maishe Bopape<br />
50 second years, 88 third years, 25 honours, 57 master and 13 doctoral<br />
students. This shows that the sample included every level <strong>of</strong> study the<br />
university <strong>of</strong>fers; hence the sample is representative in terms <strong>of</strong> level <strong>of</strong><br />
study. Some respondents used more than one Internet access method.<br />
Therefore, the sum total <strong>of</strong> frequencies reflects a higher total than 384.<br />
Figure 2: Primary internet access<br />
Percentages <strong>of</strong> respondents<br />
70.00<br />
60.00<br />
50.00<br />
40.00<br />
30.00<br />
20.00<br />
10.00<br />
0.00<br />
18.86<br />
59.31<br />
Home Unisa Other<br />
Primary Internet access methods<br />
Figure 2 shows that UNISA provides the primary means <strong>of</strong><br />
accessing the Internet to its students. The study indicates that 19%<br />
respondents had Internet access in their homes; 59% accessed the Internet at<br />
UNISA while 22% used other means <strong>of</strong> Internet access.<br />
Some respondents were aware <strong>of</strong> more than one IS at UNISA. As a<br />
result, the total <strong>of</strong> frequencies also reflects a higher total than 384.<br />
Table 1: Awareness about IS<br />
Informatio<br />
n<br />
System<br />
UNISA<br />
Websit<br />
e myUNISA Osprey EDS<br />
264<br />
21.84<br />
Studen<br />
t<br />
system E-mail<br />
Awareness 246 302 69 88 113 238<br />
Percentages 23.30 28.60 6.53 8.33 10.70 22.54<br />
Most respondents know about myUNISA (303) and little less about<br />
the UNISA website (246) and e-mail (238). All the respondents should know<br />
about myUNISA, website and e-mail because it is advertised in all study
The Social Impact <strong>of</strong> Information Systems …<br />
letters and used to deliver study material to the students. Few knew about<br />
Osprey and EDS because they are subject related and not many <strong>of</strong> the<br />
respondents study the courses. Respondents who know about Student<br />
System are those students who are also employed by UNISA, because this<br />
system is not accessible to students.<br />
Comparing Level <strong>of</strong> Awareness <strong>of</strong> the IS<br />
A chi-square test is performed to determine if some IS were known by the<br />
respondents. If there is no higher awareness for some, then identical<br />
awareness implies equal probability <strong>of</strong> awareness <strong>of</strong> the different IS.<br />
Table 2: Chi- square test on IS awareness<br />
IS UNISA<br />
Student<br />
Total<br />
Website myUNISA Osprey EDS system E-mail (N)<br />
O 246 302 69 88 113 238 1056<br />
E 176 176 176 176 176 176<br />
2<br />
2<br />
Thus, 2 ( O − E)<br />
( 246 −176)<br />
( 238 −176)<br />
χ = ∑ E<br />
=<br />
176<br />
+ . . . +<br />
176<br />
Using the 5% significance level the critical region is<br />
265<br />
2<br />
= 271.4886<br />
Since the calculated values <strong>of</strong> falls in the rejection<br />
region, the suggestion that the respondents had awareness for all the IS<br />
cannot be accepted. Therefore, it is concluded that some IS at UNISA are<br />
known more than others.<br />
IS Option you Used<br />
This was a section where overlaps occurred. Some respondents used more<br />
than one IS. Thus, the total <strong>of</strong> frequencies obtained also reflects a higher<br />
total than 384. It was noted that a limited number <strong>of</strong> people are using<br />
myUNISA since this is the primary method <strong>of</strong> delivering study material.<br />
This is in agreement with Amory (2003). The large number is also assessing<br />
the UNISA website and is important since it means that they are using the<br />
site to search for information.
Sam Lubbe & Maishe Bopape<br />
Correlation between Awareness and Use <strong>of</strong> an IS<br />
There exists a statistically significant, strong, positive correlation between<br />
the two variables (r = 0.9981, n = 384, p < 0.05). In other words the more<br />
one is aware <strong>of</strong> the system the more one will tend to use the system. This<br />
relationship is excellent, and the regression linear equation resulting from<br />
the relationship can be used with 97% accuracy <strong>of</strong> results.<br />
Comparing the Level <strong>of</strong> Use <strong>of</strong> the IS<br />
A chi-square test was performed to determine if some IS were used by the<br />
respondents more than others. If there is no higher use <strong>of</strong> some IS than other,<br />
indistinguishable awareness implies that there are equal probabilities <strong>of</strong> use<br />
<strong>of</strong> the different IS (Hill 1999). Thus,<br />
Using the 5% significance level the critical region is<br />
Since the calculated values <strong>of</strong> falls in the rejection<br />
region, the suggestion that the respondents use the different IS equally<br />
cannot be accepted. The general perception is that students and staff should<br />
be using all the systems at UNISA but the stats prove the opposite.<br />
Satisfaction with UNISA’s IS<br />
The respondents were requested to state if they were satisfied with the IS<br />
they used. They had to report the level <strong>of</strong> satisfaction or dissatisfaction on<br />
each IS they were using. Since the total number <strong>of</strong> respondents was affected<br />
by overlapping, this is inherited here. The extent <strong>of</strong> satisfaction or<br />
dissatisfaction was also required. Only six respondents indicated they were<br />
not happy with the systems available to them. This could be interpreted that<br />
the respondents are happy with the systems even though they were not<br />
involved. These results indicate that UNISA IS is reasonably successful as<br />
only 2% <strong>of</strong> users were not satisfied with the systems available to them.<br />
Overall Perception <strong>of</strong> UNISA's IS Quality<br />
The respondents were requested to make their own judgment on the quality<br />
266
The Social Impact <strong>of</strong> Information Systems …<br />
<strong>of</strong> the IS they used. They had to report whether they found it to be excellent,<br />
good, acceptable or poor. Again, the total number <strong>of</strong> respondents was<br />
affected by overlapping. The majority <strong>of</strong> respondents perceive UNISA IS <strong>of</strong><br />
good quality, the reason might be that students are able to access the<br />
information required <strong>of</strong> them.<br />
There exists a statistically significant positive correlation between<br />
perceived quality <strong>of</strong> a system and the satisfaction level from the system (r =<br />
0.5316, n = 384, p< 0.05). This might mean that the more students use the<br />
system, the more the quality <strong>of</strong> the system become evident to them.<br />
Involvement and Participation in Developing Systems<br />
According to Lamb and Kling (2003), user involvement must be divided into<br />
user participation and user involvement. User participation refers to the<br />
actual physical involvement <strong>of</strong> the users in the development and/or<br />
implementation <strong>of</strong> the IS, whereas user involvement refers to the subjective<br />
psychological state reflecting the importance and personal relevance <strong>of</strong> a<br />
system to the user.<br />
Lamb and Kling (2003) reveal one theme has been prominent, that is<br />
the fact that user involvement and participation in the development and/or<br />
implementation <strong>of</strong> a successful IS is vital. Over 80 % <strong>of</strong> respondents did not<br />
participate at all in the development and/or implementation <strong>of</strong> any <strong>of</strong> the<br />
specified UNISA IS. This indicates that there was a forced acceptance as the<br />
users have no choice but to use UNISA’s IS.<br />
The 76 respondents who indicated that they were involved in the<br />
development <strong>of</strong> the IS was invited to indicate the specific system in which<br />
they were involved. The respondents were involved only in the UNISA<br />
website, Osprey and myUNISA and no one was involved in EDS, e-mail and<br />
the student system. The extent <strong>of</strong> involvement as three (4.0%) respondents<br />
having participated in the development <strong>of</strong> the UNISA website, two (2.6%)<br />
having participated in the development <strong>of</strong> Osprey and 71 (93.4%) having<br />
participated in the development <strong>of</strong> myUNISA. This also supports the fact<br />
that systems were ‘forced’ on users.<br />
Needs Considered During Development and/or Planning<br />
More than 60% (66.7%) respondents believed that their needs were taken<br />
into account in the development and/or implementation <strong>of</strong> the UNISA’s IS.<br />
267
Sam Lubbe & Maishe Bopape<br />
The reason for the unexpected student response could be that the students<br />
themselves do not fully understand their own needs.<br />
The respondents needed to indicate if they were consulted about<br />
what they wanted/needed in the IS they were to use while working or<br />
studying at UNISA. This is in accordance with Clow (1999) that feedback<br />
on users <strong>of</strong> systems is important, if the IS is to be successful.<br />
More than 90 (94) <strong>of</strong> the respondents indicated that they were<br />
consulted regarding what they needed in an IS for their work at UNISA, 277<br />
indicated that they were not consulted and 13 did not tell whether they were<br />
consulted or not. These results are almost paradoxical, as fewer students<br />
were asked if they wanted or what they wanted from the system, but most<br />
students feel that their needs have been taken into account. The reason might<br />
be that best practices were applied in the development <strong>of</strong> these systems.<br />
The question wanted the respondents to indicate if they were willing<br />
to be involved in the development <strong>of</strong> the IS used for studies and work at<br />
UNISA. Mckeen et al. (1994) stated that it is important to note the<br />
difference between voluntary versus forced acceptance. It goes to say that<br />
users involvement does not affect acceptance if there is forced acceptance,<br />
as the user has no choice but to use the IS, whereas users involvement does<br />
affect user acceptance if the acceptance is voluntary. Therefore it is<br />
necessary to have positive user involvement when acceptance <strong>of</strong> an IS is left<br />
up to the user. Users’ involvement in the development and implementation<br />
<strong>of</strong> these IS, can be described as their willingness to participate in the<br />
development and improvement <strong>of</strong> the university’s IS, and users view on the<br />
effect <strong>of</strong> their input on the quality <strong>of</strong> those systems (Mckeen et al. 1994).<br />
The results reveal that 85% <strong>of</strong> users said that they would be willing<br />
to participate in the development <strong>of</strong> UNISA IS that is built for them. Hall<br />
(2006) argues that those users, who would not be willing to participate in the<br />
development, may do so because <strong>of</strong> the time and effort that would need to be<br />
expended or because they do not want to use and/or do not support the<br />
implementation <strong>of</strong> the proposed IS.<br />
The results also reveal that 89% <strong>of</strong> respondents would be willing to<br />
participate in the improvement <strong>of</strong> these systems. This is in accordance with<br />
Kling (1999).<br />
To determine if the respondents had confidence that their knowledge<br />
and/or opinions could be useful in improving the quality <strong>of</strong> the IS used in<br />
268
The Social Impact <strong>of</strong> Information Systems …<br />
UNISA. Another determining factor <strong>of</strong> user involvement is how valuable a<br />
user views their input into the development or implementation <strong>of</strong> IS built for<br />
them. Nearly 92% <strong>of</strong> the respondents feel that their participation would have<br />
improved UNISA’ IS.<br />
Use and Satisfaction with UNISA’s Systems<br />
The respondents were requested to indicate their extent <strong>of</strong> use and<br />
satisfaction regarding the three UNISA’s Systems below. A higher<br />
percentage <strong>of</strong> respondents use myUNISA more <strong>of</strong>ten. This rate <strong>of</strong> use is<br />
logical because it is the system that is mainly advertised by the university,<br />
study material is delivered through this system assignments are also<br />
submitted through this system and tutorial letters are posted on this system<br />
by academic. This is in accordance with Yusuf (2005) that ICT provides<br />
access to more extensive and current information.<br />
myUNISA is the system that was accessed at least once a week<br />
compared to other systems. Also, myUNISA is the system with the least rate<br />
for the systems that was never accessed. The reason is that myUNISA is<br />
primary to the distance learning mode <strong>of</strong> UNISA and should always be<br />
accessed by students for students to remain current. Only 2.11% <strong>of</strong> the<br />
respondents never accessed myUNISA.<br />
ANOVA for Testing Frequencies <strong>of</strong> Access and IS<br />
ANOVA is a technique for comparing sample means; but unlike the t- test, it<br />
can be used to compare more than two means. With ANOVA, because<br />
several sample means are usually being compared, once a null hypothesis<br />
has been rejected we need a follow-on, or post hoc, procedure. It is possible<br />
that some pairs <strong>of</strong> means may not be significantly different from one<br />
another. Thus the process is a bit like aerial photography. ANOVA gives a<br />
high-altitude picture, and the null hypothesis can be rejected.<br />
Hypotheses tested are:<br />
Hor: There are no differences in yield according to frequency <strong>of</strong> access<br />
Hoc: There are no differences in yield according to IS accessed<br />
The results were not significant for both rows and columns. It can be<br />
concluded that there is no evidence against the hypotheses that the yield is<br />
269
Sam Lubbe & Maishe Bopape<br />
not affected by the type <strong>of</strong> IS used or by the frequency <strong>of</strong> accessing an IS.<br />
Dependency <strong>of</strong> Frequency <strong>of</strong> Access on the Kind <strong>of</strong> IS<br />
A chi-square test is performed to determine if that dependence is not there,<br />
then independence would mean that (row total)× (row total)/(grand total)<br />
would be close to the observed values. In this case the statistical hypotheses<br />
are:<br />
H0: Frequencies <strong>of</strong> access and IS types are independent vs.<br />
Ha: The said variables are dependent<br />
Thus,<br />
Using the 5% significance level, df = (3 – 1)(4 – 1) = 6, the critical region is<br />
Since the calculated values <strong>of</strong> falls in the rejection<br />
region, the suggestion that the frequency <strong>of</strong> accessing and IS is independent<br />
<strong>of</strong> the kind <strong>of</strong> the system cannot be accepted. Thus, it can be concluded that<br />
the frequency <strong>of</strong> accessing an IS depends on the kind <strong>of</strong> system.<br />
Viewing <strong>of</strong> assignments is the most popular task used with the<br />
systems (18.1% <strong>of</strong> the time) in the systems; followed by submitting/posting<br />
assignments (16.7%); that are closely followed by communication between<br />
students and lecturer (16.0%). It is logical because the tasked indicated are<br />
the most common in distance learning environment (Yusuf 2005).<br />
Comparing the Level <strong>of</strong> Use <strong>of</strong> the IS on Various Tasks<br />
A chi-square test is performed to determine if some IS were used by the<br />
respondents on certain tasks more than in other tasks. If there is no higher<br />
use <strong>of</strong> some IS than other, indistinguishable awareness implies that there are<br />
equal probabilities <strong>of</strong> use <strong>of</strong> the different IS.<br />
1<br />
1<br />
H0: p = vs. H1: p ≠<br />
9<br />
9<br />
O = observed frequencies and<br />
⎛ 1 ⎞<br />
E = Np = 1806 ⎜ ⎟ = 200.<br />
67<br />
⎝ 9 ⎠<br />
Thus,<br />
270
The Social Impact <strong>of</strong> Information Systems …<br />
Using the 5% significance level, df = 9 -1 =8, the critical region is<br />
Since the calculated values <strong>of</strong> falls in the rejection<br />
region, the suggestion that the different IS are used equally on the specific<br />
tasks listed cannot be accepted. Thus, it can be concluded that the<br />
respondents were using IS in some tasks more than in other tasks.<br />
Miscellaneous Use <strong>of</strong> Systems<br />
myUNISA is the system used most <strong>of</strong>ten for all the tasks, even though it<br />
differs in extent <strong>of</strong> use for the various tasks. Viewing assignments,<br />
submitting/posting assignments, library information, posting/reading notices,<br />
posting/viewing lecturer notes and lecturer/student communication, in the<br />
order from highest to lowest, are the most significant tasks for which<br />
myUNISA is used. These tasks are also higher than the highest rates <strong>of</strong> use<br />
<strong>of</strong> all significant uses <strong>of</strong> EDS and Osprey. This results are logical because<br />
the primary purpose <strong>of</strong> myUNISA was to facilitate the tasks as indicated and<br />
all students should be using myUNISA to do exactly those tasks. This is in<br />
agreement with Yusuf (2005) that IS has impacted on how teaching and<br />
learning is delivered in traditional and distance institutions.<br />
EDS is used more than Osprey. The most significant uses <strong>of</strong> EDS,<br />
from highest to lowest, are lecturer/student communication; submit/post<br />
assignment; post/view lecturer notes; view assignments; post/read notices;<br />
and library information. This results shows that myUNISA is a popular<br />
Information System at UNISA.<br />
The uses <strong>of</strong> Osprey, from highest to lowest, are lecture/student<br />
communication; and post/read notices. The reason is that Osprey is course<br />
specific system and not many student registrations in this field <strong>of</strong> study. This<br />
is also in accordance with Dertoulos (1998) that people use IS if perceived<br />
useful and has relevance to their task.<br />
271
Sam Lubbe & Maishe Bopape<br />
ANOVA for Testing Different Tasks and IS<br />
Hypotheses tested are:<br />
Hor: There are no differences in yield according to task<br />
Hoc: There are no differences in yield according to IS<br />
The results are not significant for both rows, but for the columns<br />
they are significant. It can be concluded that there are differences in yield<br />
due to the type <strong>of</strong> IS. Due to the fact that the effects <strong>of</strong> rows are not<br />
significant; there is no evidence that the type <strong>of</strong> task undertaken does not<br />
affect the yield.<br />
Dependency <strong>of</strong> Use <strong>of</strong> Specific Tasks on the Kind <strong>of</strong> IS<br />
A chi-square test was performed to determine if that dependence existed.<br />
H0: IS types and use <strong>of</strong> certain tasks are independent<br />
Ha: Use <strong>of</strong> IS on tasks and the IS are dependent<br />
Using the 5% significance level, df = (3 – 1)(9 – 1) = 16, the critical<br />
region is<br />
Since the calculated values <strong>of</strong> falls in the rejection<br />
region, the suggestion that use <strong>of</strong> IS on specific tasks and the types <strong>of</strong> IS are<br />
independent <strong>of</strong> each other cannot be accepted. Therefore, it can be<br />
concluded that the use <strong>of</strong> IS depends on specific tasks and depend on the<br />
kind <strong>of</strong> the system used. Kling (1999) states that the consequences <strong>of</strong> IS<br />
depends on the context in which IS are developed and designed.<br />
Use <strong>of</strong> IS in Courses<br />
In using the different IS in the courses <strong>of</strong> UNISA, myUNISA was the IS<br />
used the most. Use <strong>of</strong> myUNISA in courses also exceeds the combined uses<br />
<strong>of</strong> EDS and Osprey. In the use in courses, Osprey is used more than EDS.<br />
272
The Social Impact <strong>of</strong> Information Systems …<br />
EDS is the least used in courses, but is not far exceeded by Osprey. This is<br />
expected as myUNISA is the main IS provided for the use <strong>of</strong> students and<br />
academics. This is also in accordance with Kling (1999) who states that the<br />
consequences <strong>of</strong> IS depends on the context in which IS are developed and<br />
designed.<br />
Miscellaneous Impression about System<br />
Another measure <strong>of</strong> a successful IS could be the number <strong>of</strong> problems<br />
experienced by users. Fifty percent <strong>of</strong> respondents reported that they had<br />
experienced problems with UNISA’s IS. This is a relatively high rate <strong>of</strong><br />
respondents that have experienced problems. This might mean that just over<br />
50% <strong>of</strong> the students accessing UNISA’s IS are frustrated by the systems. As<br />
indicated by Kling (1999) that this might be as a result <strong>of</strong> lack <strong>of</strong> user<br />
involvement in the design and planning <strong>of</strong> these systems.<br />
Meeting usage needs, ease <strong>of</strong> use <strong>of</strong> IS and functionality are all<br />
determining factors <strong>of</strong> IS success. UNISA is successful in the IS it made<br />
available for its students and employees. Results reveals that, 76% <strong>of</strong> the<br />
respondents indicated that information content met their needs, 75% reveals<br />
that the Systems are easy to use, 77% indicated that the Systems are user<br />
friendly and 72% indicated that the necessary information was available.<br />
The results reveal that higher percentage <strong>of</strong> users is satisfied with UNISA’s<br />
Systems. Slightly fewer respondents are not happy with the systems UNISA<br />
made available. Lamb and Kling (2003) find that user participation in the<br />
development <strong>of</strong> an IS, may not necessarily lead to user satisfaction, but it is<br />
still a necessary antecedent.<br />
Since a higher percentage <strong>of</strong> users were not involved in the<br />
development and implementation <strong>of</strong> these systems, this might be the reason<br />
why 69% feels that the systems need modification where their inputs should<br />
be taken into account. The remaining 31% feels that what they have is good<br />
enough for them.<br />
Level <strong>of</strong> Satisfaction with Use <strong>of</strong> System<br />
The results indicate that UNISA IS are reasonably successful as no users<br />
were dissatisfied and completely dissatisfied with the systems available to<br />
them. This is in agreement with Amory (2003) who states that many people<br />
are not unhappy with systems.<br />
273
Sam Lubbe & Maishe Bopape<br />
myUNISA is the most preferred medium to receive study material.<br />
This is logical since myUNISA was developed to improve flow <strong>of</strong> academic<br />
information. Academic information comprises courseware, subject-related<br />
academic guidance, discussion groups, and recommended books. This also<br />
proves that most students are starting to accept these systems. This is in<br />
agreement with Kroeker (2000) who stated that IS affected education<br />
methodologies. It also support Dertouzos (1998) who states that IS mediate<br />
the way information is accessed, organised, stored and transmitted. Most <strong>of</strong><br />
the respondents prefer e-mail to communicate. The reason might be that they<br />
want to establish a personal kind <strong>of</strong> a relationship which is non-existence in<br />
distance learning environment. A higher percentage <strong>of</strong> respondents prefer<br />
mail to communicate. The other reasons might be issues <strong>of</strong> integrity and<br />
privacy and also most people logon to their e-mail than other forms <strong>of</strong> IS<br />
available for them.<br />
Preferred Form <strong>of</strong> Communicating with Peers for <strong>University</strong><br />
Work<br />
Regarding the form <strong>of</strong> communication among peers (i.e. from students to<br />
students and from lecturers to lecturers), about 57 (12.1%) respondents used<br />
EDS, 264 (55.9%) used e-mail, 19 (4.0%) used Osprey and 132 (28.0%)<br />
used myUNISA. The reason again may be the issues <strong>of</strong> integrity and privacy.<br />
Also people respond more quickly while using e-mail other than any form <strong>of</strong><br />
communication. The other reason is the fact that most people have access to<br />
their e-mail wherever they are and can keep communication going. This is in<br />
agreement with Yusuf (2005) that IS provides opportunity for users to<br />
communicate with one another through e-mail, mailing lists, chat rooms and<br />
so on.<br />
As a result the social relationships <strong>of</strong> users are affected by the IS<br />
that they use for communicating with their peers. The structures <strong>of</strong> those<br />
relationships are moulded around the IS that are used as a communication<br />
medium.<br />
In testing the valued IS among EDS, myUNISA and Osprey, about<br />
170 (23.5%) respondents valued EDS, 183 (25.3%) used Osprey, and 371<br />
(51.2%) used myUNISA. This seems logical since myUNISA is the most<br />
advertised system. Respondents might value the system because they are<br />
only exposed to it, and forced to use it as it is the only system where<br />
274
The Social Impact <strong>of</strong> Information Systems …<br />
information pertaining to courses and study letters are posted and students<br />
have no choice but to use if they want to succeed in the courses they are<br />
registered for. This is in agreement with Clow (1999) that student<br />
perceptions <strong>of</strong> technology are important in the future <strong>of</strong> distance learning.<br />
Also authorities <strong>of</strong> the university have decided that as from 2009 access to<br />
myUNISA will be a registration requirement. In testing the valued IS that<br />
enhances studies, myUNISA was considered by (56.1%) as a system that<br />
makes their learning environment more conducive to study.<br />
Involvement in Development<br />
User involvement and participation in the development and/or<br />
implementation <strong>of</strong> a successful IS is important. Users’ involvement in the<br />
development and implementation <strong>of</strong> these IS, can be described as their<br />
willingness to participate in the development and improvement <strong>of</strong> the<br />
university’s IS, and users view on the effect <strong>of</strong> their input on the quality <strong>of</strong><br />
those systems. Users said that they would be willing to participate in the<br />
development <strong>of</strong> UNISA IS that are built for them, whilst 50% would willing<br />
to only participate in the development <strong>of</strong> MyUNISA. The remaining 21%<br />
and 28.27% <strong>of</strong> users are willing to participate in development EDS and<br />
Osprey respectively. This is in accordance with Amory (2003) that user<br />
involved when s/he considers a system to be both important and personally<br />
relevant.<br />
Quality <strong>of</strong> UNISA IS can be influenced to some extent by whether<br />
or not users were asked whether they wanted or needed any <strong>of</strong> the specified<br />
UNISA IS. It can therefore be said that, just by merely asking users whether<br />
they want or need the Information System can increase the success <strong>of</strong> that<br />
system. This is in agreement with Kling (1999). The question wanted to<br />
determine the IS wanted by the respondents. About 170 <strong>of</strong> the respondents<br />
wanted EDS, 132 wanted Osprey, and 327 wanted myUNISA.<br />
Needs Taken into Account in Development<br />
This is another question where overlaps occurred. Some respondents used<br />
more than one IS. Thus the total frequencies reflects a higher total than<br />
384.The question wanted to determine if the respondents believed that their<br />
needs were considered in the development <strong>of</strong> specific IS. About 113 (21.2%)<br />
<strong>of</strong> the respondents believed that for EDS their needs was considered, 113<br />
275
Sam Lubbe & Maishe Bopape<br />
(21.2%) believed that for them, Osprey considered their needs, and 308<br />
(57.7%) believed that development <strong>of</strong> myUNISA considered their needs.<br />
Those who feel that their needs have been taken into account perceive<br />
UNISA IS to be <strong>of</strong> good quality and the majority <strong>of</strong> those users who feel that<br />
their needs have not been taken into account; perceive UNISA IS to only be<br />
<strong>of</strong> acceptable quality. In all cases it showed that myUNISA forms the<br />
integral part <strong>of</strong> students’ lives at UNISA. This is again in accordance with<br />
Bostrom and Harrion (1977) who stated that many people are not unhappy<br />
with systems.<br />
Conclusion<br />
This section provided an analysis <strong>of</strong> the data obtained from the empirical<br />
study. A description <strong>of</strong> how the results were calculated and interpreted was<br />
given. This was done to determine the Social Impact <strong>of</strong> Information<br />
Technology at UNISA. The IS investigated were myUNISA, EDS and<br />
Osprey.<br />
The UNISA IS were explored from various uses.The study found<br />
that the dominant IS used by majority <strong>of</strong> users at UNISA is myUNISA. In<br />
addition, the research reveals in Section 5.4 that over 80% <strong>of</strong> users were not<br />
consulted in developing and implementing UNISA IS. However, users feel<br />
that their needs have been taken into account and they are also willing to<br />
participate in future development and implementation <strong>of</strong> UNISA IS. It can<br />
be concluded that UNISA IS is relatively successful in delivering in meeting<br />
the needs <strong>of</strong> community <strong>of</strong> users.<br />
The success <strong>of</strong> a system is determined by the community <strong>of</strong> people<br />
who use it. Therefore it is imperative that UNISA considers social context <strong>of</strong><br />
its users when designing and implementing Information System. In addition,<br />
since myUNISA is the most accessed Information System <strong>of</strong> the three, it will<br />
be more logical to consolidate the best functionality <strong>of</strong> the two systems EDS<br />
and Osprey.<br />
Conclusion and Recommendation<br />
The organisation that formed the basis <strong>of</strong> this Study is the <strong>University</strong> <strong>of</strong><br />
South Africa (UNISA). Items that were investigated are, MyUNISA used to<br />
276
The Social Impact <strong>of</strong> Information Systems …<br />
facilitate learning at the institution, Electronic Delivery System (EDS) used<br />
to facilitate learning for students registered for the Master <strong>of</strong> Business<br />
Leadership (MBL) and Doctor <strong>of</strong> Business Leadership (DBL) through<br />
UNISA’s School <strong>of</strong> Business Leadership (SBL) and Osprey used to facilitate<br />
learning by students registered for Computer Science and IS in the School <strong>of</strong><br />
Computing.<br />
The research was aimed at determining the level <strong>of</strong> impact UNISA’s<br />
IT has on its community <strong>of</strong> users. To determine to what extent the user <strong>of</strong><br />
UNISA’s IS were involved and participated in the development and/or<br />
implementation <strong>of</strong> these systems. The research questions arrived at are as<br />
indicated previously.<br />
This study analysed the effects <strong>of</strong> UNISA’s IS from Social<br />
Informatics perspectives. It was noted that social impact <strong>of</strong> IS are rarely<br />
taken into account when systems are being developed and/or planned. A<br />
social impact <strong>of</strong> an IS are the users. Users play a role in the success <strong>of</strong> an IS,<br />
but the social implications that affect them are not fully accounted for by<br />
system designers\analysts and those implementing the system.<br />
The study revealed that even though over 80% <strong>of</strong> respondents were<br />
not involved or participated in the development and implementation <strong>of</strong><br />
UNISA’s IS as indicated in the results, but the users are satisfied with the IS<br />
provide to them by UNISA.<br />
Response to Research Questions<br />
The main findings <strong>of</strong> this research in relation to each research question will<br />
now be discussed. Each question is followed by a discussion <strong>of</strong> the<br />
findings.<br />
What is the social impact <strong>of</strong> UNISA IS within the institution?<br />
From Kling (2000) it can be concluded that IS have an effect on the social<br />
relationships <strong>of</strong> users. The social relationships <strong>of</strong> users are affected by the IS<br />
that they use for communicating. The structures <strong>of</strong> those relationships are<br />
moulded around the IS that are used as communication medium.<br />
Respondents (63%) indicated that they do not have access to the<br />
internet at their residences, and at the same time study material, notices and<br />
other form <strong>of</strong> information that can enhance learning. These are posted on<br />
these systems for students to access, <strong>of</strong> which the majority <strong>of</strong> students have<br />
277
Sam Lubbe & Maishe Bopape<br />
no access. The impact this have on the community <strong>of</strong> users is that these<br />
systems contribute to the inaccessibility <strong>of</strong> academic staff as students are<br />
always referred to this systems for more information which impact<br />
negatively on their academic progress.<br />
Respondents view these systems <strong>of</strong> value and aid their learning. It<br />
can be concluded that the impact is two folded. The social relationship with<br />
academic staff is impacted negatively by these systems. UNISA is operating<br />
in the third world with the characteristics <strong>of</strong> first world and this on its own<br />
affects the entire social structure <strong>of</strong> community <strong>of</strong> users.<br />
In what ways does the social relationships <strong>of</strong> users during<br />
systems development/planning impact on IS?<br />
According to Kling (2000), the Internet, raises issues about changes in areas<br />
such as working at home, communication, entertainment, and other personal<br />
issues. IS have been used and relied upon and therefore social implications<br />
<strong>of</strong> IS for users have become prevalent. ICT are an integral part <strong>of</strong> some<br />
organisations and so shape identity and institutions (Lamb & Kling 2003).<br />
People routinely use computers, information products and other ICT’s in<br />
their daily lives. These technologies shape who they are as organisational<br />
representatives, their relationship with other people in the organisation as<br />
well as their perceptions about themselves (Lamb & Kling 2003).<br />
An example <strong>of</strong> a social consequence <strong>of</strong> IS’s on users is given by<br />
Kling (1999). The development <strong>of</strong> an IS may reduce the amount <strong>of</strong> paper<br />
produced and used, systems designers may however may not realise that<br />
paper plays important roles in some places where one wouldn’t think it<br />
would be used. This could have social consequences for users <strong>of</strong> the system.<br />
Rosenbaum and Sawyer (2000) suggest that the use <strong>of</strong> ICTs <strong>of</strong>ten lead to<br />
both intended and unintended consequences included in this are the social<br />
consequences for users. In summary IS’s have social consequences and these<br />
consequences need to be considered when IS’s are designed and<br />
implemented. The consequences <strong>of</strong> IS’s depend on the context in which<br />
systems are developed, implemented, and used (Kling 2000). As indicated in<br />
the results show that traditional in-person or telephonic conversations is<br />
been replaced by this System for social chatting at UNISA.<br />
278
The Social Impact <strong>of</strong> Information Systems …<br />
To what degree are the users <strong>of</strong> the UNISA IS involved and<br />
participating in the development and/or planning <strong>of</strong> these<br />
systems?<br />
User involvement is described as subjective psychological state reflecting<br />
the importance and personal relevance <strong>of</strong> a system to the user. User<br />
participation is described as set <strong>of</strong> behaviours or activities performed by<br />
users in the system development process (Kling 2000). The results show that<br />
80% <strong>of</strong> the respondents did not participate at all in the development and/or<br />
implementation <strong>of</strong> any <strong>of</strong> the specified UNISA’s IS. Users were not even<br />
asked if they wanted the implementation <strong>of</strong> the specified IS, or what they<br />
wanted in terms <strong>of</strong> their needs. User acceptance has a lot to do with the<br />
users’ involvement in the development and/or implementation <strong>of</strong> an IS.<br />
According to Kling (2003), it is important to note the difference between<br />
voluntary versus forced acceptance.<br />
It goes to say that users involvement does not affect acceptance if<br />
there is forced acceptance, as the user has no choice but to use the IS,<br />
whereas users involvement does affect user acceptance if the acceptance is<br />
voluntary. Therefore it is necessary to have positive user involvement when<br />
acceptance <strong>of</strong> an IS is left up to the user. UNISA’s IS were forced on the<br />
users.<br />
How does user involvement and participation relate to IS<br />
success?<br />
It is indicated that 85 % <strong>of</strong> respondents are willing to be involved and<br />
participate in the development and implementation <strong>of</strong> UNISA’s IS. If the<br />
success <strong>of</strong> an IS is measured by user satisfaction and user participation in<br />
systems development is related to user satisfaction, then user participation is<br />
essential for the success <strong>of</strong> an IS (Mansell 2005). In the article written by<br />
Mansell (2005) it was found that user participation in the development <strong>of</strong> an<br />
IS, may not necessarily lead to user satisfaction, but it is still a necessary<br />
antecedent for the success <strong>of</strong> IS.<br />
It can also be argued that a successful IS would be one that users <strong>of</strong><br />
that system are satisfied with, perceive the system to be <strong>of</strong> high quality, their<br />
needs are satisfied and the IS does what it was designed to do. Only 2%<br />
279
Sam Lubbe & Maishe Bopape<br />
users are not satisfied with UNISA’s IS, hence UNISA’s IS is reasonably<br />
successful.<br />
What social factors should influence the development/ planning<br />
<strong>of</strong> IS?<br />
According to Gal and Berente (2008) characteristics and attributes <strong>of</strong> the<br />
users <strong>of</strong> the system being developed are expected to influence the systems’<br />
success in a variety <strong>of</strong> ways. Each <strong>of</strong> these factors is described below.<br />
Bias is defined by Dey (1993) as the users’ ‘willingness to change’.<br />
This includes the users’ willingness to try new technological approaches to<br />
support the work system or changes to the business processes that make up<br />
the work system itself. It is generally accepted that most individuals have a<br />
natural tendency to resist change. This may impact a project’s success by<br />
users insisting that the new system work the same way the old one did, e.g.<br />
that a printed report must be in the exact same format or that a printed report<br />
is required at all.<br />
User commitment is defined by Crede (1997) as the level <strong>of</strong><br />
importance the users being affected by the application place on the project's<br />
successful completion. This reflects their level <strong>of</strong> emotional or psychological<br />
obligation to the project. This construct is expected to be similar to team<br />
motivation and management commitment. The users’ commitment to the<br />
project would be expected to impact on the project’s success by influencing<br />
the time users are willing to dedicate to the project. Users that want the<br />
project to succeed will be more willing to provide documents, answer<br />
questions, and perform other development activities.<br />
Users’ communication skills were defined by Amory (2003) as the<br />
writing, speaking, and listening skills <strong>of</strong> the users participating in the IS<br />
Development project. The primary reason for user participation in systems<br />
development is to transfer their job knowledge. Without an adequate level <strong>of</strong><br />
communication skills, the communication and interaction between the users<br />
and IS personnel may be difficult. Without adequate communication skills,<br />
the users’ may be willing to provide the information needed for a successful<br />
project, but not able to express their requirements to the IS personnel, other<br />
users, or management.<br />
280
The Social Impact <strong>of</strong> Information Systems …<br />
Users’ computer literacy is defined by Amory (2003) as the level <strong>of</strong><br />
knowledge and understanding that the users’ possess regarding computers,<br />
s<strong>of</strong>tware, and technology in general. If users are more computer literate,<br />
communication between IS personnel and users may increase because the<br />
users can understand some <strong>of</strong> the computer jargon. Also, as computer<br />
literacy increases users may be more likely to accept new technology, this is<br />
the may display less bias. Also, if users tend to be computer savvy they may<br />
have more realistic expectations with regard to what can and cannot be<br />
accomplished using Information Technology as well as toward the amount<br />
<strong>of</strong> time and money needed to design, construct, and implement new<br />
s<strong>of</strong>tware.<br />
User ownership is defined by Amory (2003) as a psychological<br />
attachment to the system or business process for which a new system or<br />
s<strong>of</strong>tware is being developed or implemented. Similar to user commitment,<br />
but focused on the business activities, user ownership may have a positive or<br />
negative impact on IS Development project success. If a user with a strong<br />
feeling <strong>of</strong> ownership believes that a new system will help the m perform<br />
their activities better or quicker, this may increase user commitment to the<br />
project and positively impact project success. However, if a user with a<br />
strong feeling <strong>of</strong> ownership to the business process sees the project as<br />
threatening the process, increasing their workload, or eliminating their job;<br />
this will decrease commitment and negatively impact project success.<br />
User participation is defined by Amory (2003) as the active,<br />
substantive participation <strong>of</strong> the actual users <strong>of</strong> the application in the<br />
development process. This includes identifying the correct end users and<br />
their performance <strong>of</strong> specific tasks and activities during IS Development.<br />
The proper type and amount <strong>of</strong> user participation in IS Development is still a<br />
matter <strong>of</strong> debate within industry and the academic world. New techniques<br />
such as extreme programming, that minimises the user’s participation, are<br />
being suggested as the most productive IS Development methods while at<br />
the same time the socio-technical approach is still popular and has many<br />
dedicated advocates. User participation in the IS Development process has<br />
had a great deal <strong>of</strong> attention and yet the effect <strong>of</strong> participation on project<br />
success is not well understood. It would seem likely that a contingency<br />
approach for user participation in IS Development based on the type <strong>of</strong><br />
system, management goals, etc. is appropriate.<br />
281
Sam Lubbe & Maishe Bopape<br />
Users’ understanding <strong>of</strong> the current system is defined by Amory<br />
(2003) as the level <strong>of</strong> knowledge that the users participating in the IS<br />
Development process have regarding current manual and computer based<br />
processes and procedures used to perform their duties. Users that have a<br />
high level <strong>of</strong> understanding <strong>of</strong> the current system should be able to point out<br />
specific problems and areas for improvement that can be incorporated into<br />
the new system. One the other hand, users that do not understand the current<br />
system or how it is related to other operations <strong>of</strong> the business may not be<br />
able to provide the details needed to automate processes and may resist<br />
efforts to streamline or eliminate redundant processes or system outputs.<br />
The users’ understanding <strong>of</strong> needs by Bostrom and Heinen (1977) is<br />
defined as the level <strong>of</strong> knowledge that the users who are participating in the<br />
development process have regarding the information required to perform<br />
their duties. This includes knowledge about the information outputs required<br />
and the processing and data required to produce this output. Again, the<br />
primary reason for the participation <strong>of</strong> users in the IS Development process<br />
is to determine the information requirements needed for the users to perform<br />
their job activities. For this transfer <strong>of</strong> knowledge to occur, the users must<br />
have some idea <strong>of</strong> what these information requirements are.<br />
Managerial Guidelines<br />
From the results <strong>of</strong> this study the following guidelines are given to tertiary<br />
institutions that already have, or are planning to develop/implement IS for<br />
the use <strong>of</strong> lecturers and students:<br />
Users needs should be taken into account whether or not they<br />
understand.<br />
IS affect the social aspects <strong>of</strong> users; therefore these impacts must be<br />
taken into consideration before implementing these systems.<br />
Most users want to participate and feel that they can add value to the<br />
development/implementation <strong>of</strong> IS built for them.<br />
Users must participate and be positively involved in IS development/<br />
implementation for it to be truly successful.<br />
Users’ needs must be taken into account, using best practice isn’t<br />
sufficient.<br />
282
The Social Impact <strong>of</strong> Information Systems …<br />
<strong>University</strong> IS are reasonably successful, but are not as effective as<br />
they could be. By accounting for the social aspects <strong>of</strong> these systems,<br />
their successfulness and effectiveness can be optimised.<br />
IS have the potential to add value to and increase the effectiveness<br />
<strong>of</strong> educational practices, but also have the potential to impact<br />
immensely on the encompassing community. This must be<br />
considered before implementing any IS.<br />
Conclusion<br />
The different social impact <strong>of</strong> IS is important to their success and has a<br />
influence on these systems and their users. The study intended to investigate<br />
this social impact in the context <strong>of</strong> <strong>University</strong> IS, how they impact on the<br />
users <strong>of</strong> those systems and how those aspects affect the success <strong>of</strong> those<br />
systems.<br />
It can be said that a broader view <strong>of</strong> users as social actors is needed<br />
for IS developers to fully understand the needs <strong>of</strong> users and the social impact<br />
<strong>of</strong> the IS. Users’ perception <strong>of</strong> IS usefulness and ease <strong>of</strong> use has an impact<br />
on the users’ view <strong>of</strong> the quality <strong>of</strong> the system. It can also be proposed that<br />
user participation and involvement is necessary for IS success, but having it<br />
does not necessarily guarantee IS success. Tertiary Institution IS do have an<br />
effect on social relationships, as they can change the structure <strong>of</strong> many <strong>of</strong> the<br />
relationships that user may have, be it relationships with fellow peers,<br />
students, lecturers or friends.<br />
References<br />
Amory, A 2003. Another Country: Virtual Learning Spaces. World<br />
Conference on Educational Multimedia, Hypermedia &<br />
Telecommunications.<br />
Bostrom, RP & JS Heinen 1977. MIS Problems and Failures: A Socio-<br />
Technical Perspective. Part I: The Causes. MIS Quarterly 1,3.<br />
Brabazon, T 2002. Digital Hemlock: Internet Education and the Poisoning<br />
<strong>of</strong> Teaching. Sydney: <strong>University</strong> <strong>of</strong> New South Wales Press.<br />
283
Sam Lubbe & Maishe Bopape<br />
Brown, B & R Randell 2004. Building a Context Sensitive Telephone: Some<br />
Hopes and Pitfalls for Context Sensitive Computing. CSCW <strong>Journal</strong><br />
13,34: 329-345.<br />
Chan SL 2002. Information Technology in Business Processes. Business<br />
Process Management <strong>Journal</strong> 6,3: 224 - 237.<br />
Chaharbaghi K & R Willis 2000. The P <strong>of</strong> Technological Innovation: The<br />
Missing Link between Purpose, Strategy and Technology. Proceedings<br />
<strong>of</strong> the Eighth International Conference on Management <strong>of</strong><br />
Technology. Cairo.<br />
Clow KE 1999. Interactive Distance Learning: Impact on Student Course<br />
Evaluations. <strong>Journal</strong> <strong>of</strong> Marketing Education 21,2,August: 97 -105.<br />
Crede’, A 1997. Social, Cultural, Economic and Legal Barriers to the<br />
Development <strong>of</strong> Technology-based Information. Industrial<br />
Management & Data Systems 97/1: 58–62<br />
Dertouzos, ML 1998. What Will Be: How the New World <strong>of</strong> Information will<br />
Change our Lives? New York: Harper Collins.<br />
Dey, I 1993. Qualitative Data Analysis: A User-Friendly Guide for Social<br />
Scientists. London: Routledge and Kegan Paul.<br />
Duderstat, JJ 1999. Can Colleges and Universities Survive in the<br />
Information Age? In Katz, RN (ed): Dancing with the Devil:<br />
Information Technology and the New Competition in Higher Education.<br />
San Francisco, CA: Jossey-Bass Inc., Publishers.<br />
Gal, U & N Berente 2008. A Social Representations Perspective on<br />
Information Systems Implementation. <strong>Journal</strong> <strong>of</strong> Information<br />
Technology and People 21,2: 133 -154.<br />
Habib, L 2003. Domestication <strong>of</strong> e-Learning Technologies: A Preliminary<br />
Conceptual Framework. Proceedings <strong>of</strong> the NOKOBIT 2003<br />
Conference, Oslo, November 24-26.<br />
Hall, G 2006. Teens and Technology. New Directions for Youth<br />
Development 111: 41-52.<br />
Hill, MW 1999. The Impact <strong>of</strong> Information Technology on Society. London:<br />
Bowker Saur.<br />
Horton, K, E Davenport & T Wood-Harper 2005. Exploring Socio-technical<br />
Interaction with Rob Kling: Five ‘big’ Ideas. <strong>Journal</strong> <strong>of</strong> Information<br />
Technology & People 18,1.<br />
284
The Social Impact <strong>of</strong> Information Systems …<br />
King WR & RW Zmud 1981. Managing Information Systems: Policy<br />
Planning, Strategic Planning and Operational Planning. In Proceedings<br />
<strong>of</strong> the Second International Conference on Information Systems. Boston,<br />
MA.<br />
Kirkwood, A 2000. Learning at Home with Information and Communication<br />
Technologies. Distance Education 21,2: 248-259.<br />
Kling, R 1999. What is Social Informatics and Why Does it Matter? D-Lib<br />
Magazine 5,1.<br />
Kling, R 2000. Learning about Information Technologies and Social<br />
Change: The Contribution <strong>of</strong> Social Informatics. The Information<br />
Society 16,21.<br />
Kling, R & L Star 1998. Human Centred Systems in the Perspective <strong>of</strong><br />
Organizational and Social Informatics. Computers and Society 28,1: 22-<br />
29.<br />
Krejcie, RV & DW Morgan, 1970. Determining Sample Size for Research<br />
Activities. Educational and Psychological Measurement 30:608.<br />
Kroeker, B 2000. Changing Roles in Information Dissemination and<br />
Education. Garson, GD. Social Dimensions <strong>of</strong> Information Technology:<br />
Issues for the New Millennium. Hershey, PA: IDEA Group<br />
Lamb, R & R Kling 2003. Reconceptualising Users as Social Actors in<br />
Information Systems Research. MIS Quarterly 27,2, June: 197-235.<br />
Levy, CM2005. Social Impact from Technology. Digital Vision Fellowship.<br />
Ling, R 2001. The Diffusion <strong>of</strong> Mobile Telephony among Norwegian Teens:<br />
A Report form after the Revolution No. Presented at ICUST. Paris:<br />
Telenor R&D.<br />
Lubbe, S & RM <strong>Klopper</strong> 2008. The Lubbe-<strong>Klopper</strong> Model for Technology<br />
Acceptance. Unpublished instructional document.<br />
Mao, E. 2002. Investigation <strong>of</strong> IT Usage over Time. AMCIS Proceedings.<br />
Mansell, R 2005. Social Informatics and the Political Economy <strong>of</strong><br />
Communications. <strong>Journal</strong> <strong>of</strong> Information Technology & People 18,1.<br />
McKeen, JD, T Guimaraes & JC Wetherbe 1994. The Relationship between<br />
User Participation and User Satisfaction: An Investigation <strong>of</strong> Four<br />
Contingency Factors. MISQ 18,4.<br />
Moll, P 1983. Should the Third World have Information Technologies?<br />
IFLA <strong>Journal</strong> 9,4: 297.<br />
Pedersen, P 2003. Adoption <strong>of</strong> Mobile Internet Services: An Exploratory<br />
285
Sam Lubbe & Maishe Bopape<br />
Study <strong>of</strong> Mobile Commerce Early Adopters. <strong>Journal</strong> <strong>of</strong> Organizational<br />
Computing and Electronic Commerce. forthcoming.<br />
Roode, D 2003. Information Systems Research: A Matter <strong>of</strong> Choice?<br />
Editorial. South African Computer <strong>Journal</strong> 30: 1-2.<br />
Rosenbaum, H & S Sawyer, 2000. Social Informatics in the Information<br />
Sciences: Current Activities and Emerging Directions. <strong>Journal</strong> <strong>of</strong><br />
Informing Science 32.<br />
Saunders, M, P Lewis & A Thornhill, 2003. Research Methods for Business<br />
Students. 3 rd Edition. Harlow, England: Pearson Education Limited.<br />
Shields, MA 2000. Technological Change, Virtual Learning, and Higher<br />
Education: Prospects, Problems, Potentials. Garson, GD. Social<br />
Dimensions <strong>of</strong> Information Technology: Issues for the New Millennium.<br />
Hershey, PA: Idea Group.<br />
Silverstone, R & L Haddon, 1996. Design and the Domestication <strong>of</strong><br />
Information and Technologies: Technical Change and Everyday Life. In<br />
Silverstone, R & R Mansell (eds): Communication by Design: The<br />
Politics <strong>of</strong> Information and Communication Technologies. Oxford:<br />
Oxford <strong>University</strong>.<br />
<strong>University</strong> <strong>of</strong> South Africa 2007. About UNISA Available at:<br />
www.unisa.ac.za. (Accessed on May 15, 2007.)<br />
School <strong>of</strong> Computing 2007. Management Meeting held 23 rd May 2007.<br />
Available at: www.unisa.cs.ac.za.<br />
Watson, DM 2001. Pedagogy before Technology: Re-Thinking the<br />
Relationship between ICT and Teaching. Education and Information<br />
Technologies 6,4: 251-266.<br />
Witmer, DF, RW Colman, & SL Katzman, 1999. From Paper-and-Pencil to<br />
Screen-and Keyboard. Toward a Methodology for Survey Research on<br />
the Internet. In Jones, S (ed): Doing Internet Research: Critical Issues<br />
and Methods for Examining the Net. London, New Delhi: Sage<br />
Publications, Thousand Oaks.<br />
Wood-Harper, T, & B Wood, 2005. Multiview as Social Informatics in<br />
Action: Past, Present and Future. <strong>Journal</strong> <strong>of</strong> Information Technology<br />
and People 18,1.<br />
Yusuf, MO 2005. Information and Communication Technology and<br />
Education: Analysing the Nigerian National Policy for Information<br />
Technology. International Education <strong>Journal</strong> 6,3: 316-321.<br />
286
The Social Impact <strong>of</strong> Information Systems …<br />
287<br />
Sam Lubbe<br />
School <strong>of</strong> Information Systems<br />
North West <strong>University</strong><br />
South Africa<br />
Sam.lubbe@nwu.ac.za<br />
Maishe Bopape<br />
School <strong>of</strong> Computing<br />
<strong>University</strong> <strong>of</strong> South Africa<br />
Pretoria, South Africa<br />
bopaphm@unisa.ac.za
The Impact <strong>of</strong> Information Quality on<br />
Information Research<br />
Grant Howard<br />
Sam Lubbe<br />
<strong>Rembrandt</strong> <strong>Klopper</strong><br />
Abstract<br />
This contribution analyses the impact <strong>of</strong> information quality on research. It<br />
presents a theoretical discussion <strong>of</strong> the concept ‘information quality’ and<br />
shows that good information quality entails good research. The discussion is<br />
relevant for both researchers and research users, because it shows that<br />
information quality is a critical determinant <strong>of</strong> research success, as measured<br />
by the creation <strong>of</strong> new knowledge. Thus, information quality fundamentally<br />
impacts research. Reasons for the existence <strong>of</strong> low quality information as<br />
well as proposed solutions to this problem are provided in the paper.<br />
Keywords: Information, information accuracy, information attributes,<br />
Information timeliness, information cost, volume, information bias,<br />
information quality, information relevance, information reliability,<br />
Information timeliness, knowledge, research.<br />
Introduction<br />
This article presents a theoretical discussion <strong>of</strong> the impact that information<br />
quality has on research regarding management decision-making. It also<br />
discusses the problems experienced and the solution strategies used by<br />
managers and intermediaries during information acquisition, information<br />
search criteria, information attributes, information search processes,<br />
<strong>Alternation</strong> Special Edition 4 (2011) 288 – 305<br />
ISSN 1023-1757<br />
288
The Impact <strong>of</strong> Information Quality on Information Research<br />
information evaluation, and information transfer. Throughout the article, the<br />
Internet is mentioned as the primary information repository. Finally,<br />
information attributes such as information quality, relevance, reliability,<br />
trustworthiness, timeliness, cost, volume, bias, volatility, and accuracy are<br />
highlighted.<br />
This article provides a theoretical discussion regarding the impact <strong>of</strong><br />
information quality on research. It explains that the use <strong>of</strong> quality<br />
information is a critical determinant <strong>of</strong> success for an organisation; equally<br />
the use <strong>of</strong> quality information is a critical determinant <strong>of</strong> success for<br />
research. In research, information is both a production input and output, and<br />
good quality inputs are prerequisites for good quality outputs. The objective<br />
<strong>of</strong> this article is to present a theoretical discussion about the impact <strong>of</strong><br />
information quality on research, using prior research as point <strong>of</strong> departure.<br />
Literature Review<br />
The literature reviewed is obtained from the World Wide Web. The same<br />
keywords are used in three separate search engines, namely Google and its<br />
scholarly version, Google Scholar, the Association for Computing<br />
Machinery (ACM) digital library search engine, and the Association for<br />
Information Systems e-library search engine.<br />
Information Quality Definition, Attributes, and Importance<br />
There is evidence that measurements <strong>of</strong> information quality can be used to<br />
predict organisational outcomes (Madnick et al. 2009). Data and information<br />
quality is acknowledged as playing a critical role in a data-intensive,<br />
knowledge-based economy. Data quality and information quality are <strong>of</strong>ten<br />
used interchangeably. However, there is tendency to use data quality to refer<br />
to technical issues and information quality to refer to non-technical issues<br />
(Madnick et al. 2009). Data can be regarded as a product that is produced by<br />
organisations through a data manufacturing process (Madnick et al. 2009).<br />
Information is said to consist <strong>of</strong> facts and data, which are organised for a<br />
particular purpose; information quality is a major criterion for measuring the<br />
success <strong>of</strong> an information system, and decision quality is a function <strong>of</strong><br />
information quality (Jung 2004). There is a strong relationship between data<br />
289
Grant Howard, Sam Lubbe & <strong>Rembrandt</strong> <strong>Klopper</strong><br />
quality and decision quality. Data must be relevant, timely, complete,<br />
interpretable, easy to understand, represented concisely and consistently,<br />
appropriate, and accessible but secure (Jung 2004).<br />
According to Tang et al., 2003 the four semantic categories <strong>of</strong><br />
information quality are:<br />
1. Intrinsic accuracy (objectivity, credibility, and reputability);<br />
2. Contextual relevance (valuableness, timeliness, completeness,<br />
information richness);<br />
3. Representational (interpretable, understandable, conciseness,<br />
consistence); and<br />
4. Accessibility (easily and securely obtained).<br />
Information quality attributes can also be regarded to include both<br />
the objective and subjective elements <strong>of</strong> accuracy, reliability, validity,<br />
comprehensiveness, currency, credibility, expertise, trust, thoroughness,<br />
transparency, and an awareness <strong>of</strong> bias (Diakopoulos & Essa 2008).<br />
In particular, accuracy can be stated as mistake free, error free,<br />
correct, conformity to truth, or exactness to a standard or model, and<br />
accuracy states that facts or the version <strong>of</strong> events presented have been<br />
corroborated by multiple reliable sources. Reliability can be defined as<br />
dependability or consistency. However, it is more practical to use<br />
dependability because consistency requires analysis over time. Credibility is<br />
closely linked to reliability through the idea <strong>of</strong> trustworthiness, and is a<br />
perceived, subjective quality <strong>of</strong> an information source; and trustworthiness<br />
is a measure <strong>of</strong> the truthfulness, fairness, lack <strong>of</strong> bias <strong>of</strong> a source or<br />
communication; and expertise is the perceived knowledge, skill, and<br />
experience <strong>of</strong> the source (Diakopoulos & Essa 2008).<br />
In addition, comprehensiveness relates to the completeness <strong>of</strong><br />
coverage <strong>of</strong> the information, this is equivalent to a principle <strong>of</strong><br />
thoroughness, which involves methodical learning about the subject.<br />
Thoroughness indicates the degree <strong>of</strong> comprehensiveness <strong>of</strong> research<br />
performed by the information producer, which allows for informed<br />
information selections. Comprehensiveness also corresponds to the<br />
journalistic principles <strong>of</strong> fairness and balance that require the inclusion <strong>of</strong><br />
diverse sources, perspectives, and opinions (Diakopoulos & Essa 2008).<br />
290
The Impact <strong>of</strong> Information Quality on Information Research<br />
Furthermore, transparency and bias are important attributes <strong>of</strong> information<br />
quality. Transparency entails disclosing and describing how sources know<br />
what they know, what biases they might have, and whether or not there are<br />
conflicting accounts. Bias also relates to sources, including aspects <strong>of</strong> the<br />
communicator’s bias or his/ her relationship to sources and information<br />
users (Diakopoulos & Essa 2008).<br />
Information quality is a relative not an absolute concept. Information<br />
is regarded as <strong>of</strong> high quality if it is fit for purpose, which can be judged by<br />
the consumer <strong>of</strong> the information only. What is high quality for one group <strong>of</strong><br />
users may be considered being <strong>of</strong> poor quality by others (Embury et al.<br />
2009). An example is a typical scenario found in both e-business and escience<br />
where datasets are regarded to be <strong>of</strong> acceptable quality for the<br />
application for which they were initially designed, but are found to be <strong>of</strong> low<br />
quality when applied to a new application (Embury et al. 2009). In addition,<br />
no single definition <strong>of</strong> information quality exists. It is a multidimensional<br />
concept with various dimensions being <strong>of</strong> relevance for different<br />
applications. One study surveyed information pr<strong>of</strong>essionals and resulted in<br />
dimensions including accuracy, completeness, believability, and<br />
interpretability (Embury et al. 2009).<br />
The term ‘information quality’ implies a measure <strong>of</strong> excellence in<br />
communicating knowledge or intelligence. In news production the<br />
transference <strong>of</strong> quality information is vital (Diakopoulos & Essa 2008).<br />
Indeed, <strong>Journal</strong>ism requires a practical or functional form <strong>of</strong> truth that<br />
endeavours to provide the reader with information <strong>of</strong> such a quality so that<br />
the reader can make his or her own decisions about the subject (Diakopoulos<br />
& Essa 2008). Information quality is critical for good understanding,<br />
especially good understanding <strong>of</strong> online media. Information quality relates to<br />
the accuracy and validity <strong>of</strong> claims and the reliability <strong>of</strong> information sources<br />
(Diakopoulos & Essa 2008). There are nine information quality criteria that<br />
are considered to be important to the context <strong>of</strong> news analysis: accuracy,<br />
source reliability, objectivity, depth, author credibility, readability, conciseness,<br />
grammatical correctness, and multiple viewpoints (Tang et al.<br />
2003).<br />
291
Grant Howard, Sam Lubbe & <strong>Rembrandt</strong> <strong>Klopper</strong><br />
Information Quality Problems and Solutions<br />
Information quality problems result in increased, estimated costs <strong>of</strong> between<br />
ten to twenty percent <strong>of</strong> revenue cover, for organisations that use the<br />
information for both operational and strategic decision making; these costs<br />
include reduced productivity due to time spent to recover from data errors;<br />
reduced customer satisfaction and loyalty resulting in reduced future<br />
business opportunities; reduced employee morale; and reduced ability to<br />
change business rules and policies (Embury et al. 2009).<br />
Assessing and benchmarking information quality is a difficult and<br />
inexact activity, this necessitates a methodology to ensure that organisations<br />
develop quality information products and deliver quality information<br />
services to consumers, and benchmarks developed for a methodology can be<br />
used to compare information quality across organisations and baseline<br />
information quality (Kahn et al. 2002).<br />
Organisations are <strong>of</strong>ten unsuccessful when they attempt to translate<br />
data into consequential insights that they can use to improve business<br />
processes, make smart decisions, and create strategic advantages; while<br />
organisations continue to increase investment into collecting, storing, and<br />
processing vast quantities <strong>of</strong> data (Madnick et al. 2009). The difficulties in<br />
translating data into information range from the technical, such as<br />
integration <strong>of</strong> data from disparate sources to the non-technical, such as lack<br />
<strong>of</strong> a cohesive strategy across an organization ensuring that the right<br />
stakeholders have the right information in the right format at the right place<br />
and time (Madnick et al. 2009).<br />
The management <strong>of</strong> data and information quality starts with<br />
evaluating data and information quality in existing systems and processes,<br />
and there are many difficulties in obtaining accurate and cost-effective<br />
assessments <strong>of</strong> data and information quality due to the complexities <strong>of</strong><br />
information systems and the information product manufacturing processes<br />
(Madnick et al. 2009). A problem exists where data and information quality<br />
in many data repositories is very inconsistent, however, the data can still be<br />
useful if the user is aware <strong>of</strong> the quality problems and can formulate<br />
workarounds (Embury et al. 2009). Data and information quality problems<br />
can result from missing or inaccurate data, and out-<strong>of</strong>-date or imprecise<br />
information that will propagate through queries to produce results that are<br />
292
The Impact <strong>of</strong> Information Quality on Information Research<br />
challenging to interpret, reducing the value <strong>of</strong> the information (Embury et al.<br />
2009).<br />
In the IS research environment, there is poor data, inadequate data<br />
preservation and reuse practices, and very little advanced data<br />
instrumentation; the IS research community must give data the attention,<br />
commitment, quality, availability and growth care that is required for valid<br />
research (Lyytinen 2009). Poor data results in poor theory and it has limited<br />
the scope and scale <strong>of</strong> IS research; poor data hinders organisational<br />
orientation and longitudinal research, obstructs integrated theory<br />
development with strong, generalisable results, and results in little or no<br />
digital repositories <strong>of</strong> validated primary data (Lyytinen 2009). One <strong>of</strong> the<br />
causes <strong>of</strong> this data poverty is IS research’s tradition-bound internal norms<br />
and research practices. However, there are solutions that are starting to<br />
emerge, such as IS instrument sharing <strong>of</strong> Internet facilities, public data<br />
sources, new data mining techniques and sharable archival data sets,<br />
institutional data harvesting opportunities, and the digital footprint <strong>of</strong><br />
Internet traffic (Lyytinen 2009).<br />
In addition, the Internet has changed the information flows by<br />
increasing the unmanaged flows dramatically, and serious information<br />
quality problems have resulted for ad-hoc information generated from<br />
various sources, such as external Web sites and individual users' personal<br />
computing applications (Segev n.d.).<br />
Information Acquisition, Analysis, and Transfer<br />
A factor that has an effect on the information acquisition task is a user’s<br />
literacy. In a study <strong>of</strong> how a user’s literacy level affects the information<br />
acquisition task, it was found that low literacy users take eight times longer<br />
than high literacy users to complete an information search task and also were<br />
significantly less accurate than high literacy users. Low literacy users on<br />
average spent one-third more time on a web page than high literacy users,<br />
but did not seem to be informed by it. Low literacy users employed a much<br />
less focused information search strategy than high literacy users visiting<br />
eight times more web pages in total. Low literacy users back-tracked thirteen<br />
times more frequently than high literacy users and are four times more likely<br />
to re-visit web pages. Low literacy users are thirteen times more likely to<br />
293
Grant Howard, Sam Lubbe & <strong>Rembrandt</strong> <strong>Klopper</strong><br />
lose their way on web sites than high literacy users (Kodagoda & Wong<br />
2008).<br />
According to Kodagoda & Wong (2008) an information search<br />
originates from a specific task and the difficulty <strong>of</strong> that task has a direct<br />
effect on the quality <strong>of</strong> information sought. Four factors determine task<br />
difficulty:<br />
1. Having multiple paths to reach its goal, each <strong>of</strong> which yielding its<br />
own outcomes and thus contributing differently to the end goal;<br />
2. Conflicting interdependencies among these paths in reaching the end<br />
goal;<br />
3. Doubts whether a given path would materialize into the end goal,<br />
and<br />
4. Multiple possible goals<br />
Therefore, an information search originates from a task, and it is<br />
influenced by the characteristics <strong>of</strong> the task, namely how the user<br />
approaches and retrieves information, the difficulty <strong>of</strong> the task, and the<br />
search strategy chosen (Kodagoda & Wong 2008).<br />
Information quality analysis is a more complex task than just<br />
calculating a single measure. Separate items <strong>of</strong> evidence must be gathered<br />
for the analysis then decision procedures must be applied to the evidence<br />
gathered to assign specific quality scores to each information item being<br />
analysed. The evidence gathering task and the decision procedures will be<br />
different in scale and complexity for each application domain (Embury et al.<br />
2009). Also, knowledge about data or information sources and the processes<br />
used to derive the data or information is important when users evaluate the<br />
data or information quality; and when users decide on the appropriate use <strong>of</strong><br />
the data or information (Madnick et al. 2009).<br />
The Internet as an Information Repository<br />
The exponential growth <strong>of</strong> the Internet has fundamentally changed how<br />
information is generated, stored, manipulated, and consumed (Gates 2000,<br />
Madnick et al. 2009). Also, each Web user has individual knowledge, which<br />
results in varied predictions, expectations, and evaluations <strong>of</strong> information on<br />
294
The Impact <strong>of</strong> Information Quality on Information Research<br />
the web (Diakopoulos & Essa 2008). Further, information retrieval systems<br />
have been almost exclusively the domain <strong>of</strong> the librarian, but since the<br />
advent <strong>of</strong> the World Wide Web (WWW) this has changed and many people<br />
are now only familiar with information retrieval systems such web search<br />
engines (Jung 2004). In the research environment, the Internet has changed<br />
the way research scientists produce knowledge; the Internet provides access<br />
to information on which scientific inquiry is now highly dependent (Ding et<br />
al. 2009).<br />
The Internet is a massive social network that has emerged without<br />
central planning, the addition <strong>of</strong> pages and links to the Internet is a<br />
distributed, asynchronous, complex, and continual process, however the<br />
Internet has resulted in the vast majority <strong>of</strong> web pages having a small<br />
number <strong>of</strong> links and a few pages having huge numbers <strong>of</strong> links. Only the few<br />
pages with huge numbers <strong>of</strong> links benefit from high volume traffic, search<br />
engine indexing, good search engine ranking, good visibility, holding<br />
consumer attention, and experiencing the ‘winners take all’ phenomenon<br />
(Pennock et al. 2002). This phenomenon has implications for information<br />
searching on the Internet, especially via links.<br />
Methodology<br />
The methodology was decided upon after the researchers gained insights<br />
about the information quality during the literature review. Repeated searches<br />
regarding the nature <strong>of</strong> information quality, using the search terms given at<br />
the beginning <strong>of</strong> this article, incrementally brought to light relevant literature<br />
on the nature <strong>of</strong> information quality how to obtain and evaluate the quality<br />
<strong>of</strong> information. The literature review therefore created a basis for addressing<br />
the objectives <strong>of</strong> the paper. The methodology applied describes the process<br />
that is used to accomplish the aims <strong>of</strong> this paper. The methodology applied<br />
in this article is a systematic process, which increases the reliability and<br />
validity <strong>of</strong> the outcomes.<br />
This article uses a document survey methodology. A nonprobabilistic<br />
sampling technique is used, called purposive sampling (Oates<br />
2006: 98). This sampling technique is used because the exact universe <strong>of</strong><br />
relevant documents is unknown and choosing documents based on the search<br />
criteria will provide data suited for the purpose <strong>of</strong> this paper. The documents<br />
295
Grant Howard, Sam Lubbe & <strong>Rembrandt</strong> <strong>Klopper</strong><br />
are selected based on their relevance and ranking by the search engines. The<br />
number <strong>of</strong> documents selected is suited to the scale <strong>of</strong> this paper.<br />
Qualitative data analysis is then performed on the documents found.<br />
A matrix was used to analyse the data. This was done by searching the<br />
literature for any <strong>of</strong> the following themes that are relevant to this paper:<br />
information quality definition, attributes, and importance; information<br />
quality problems and solutions; information acquisition, analysis, and<br />
transfer; and the Internet as an information repository.<br />
The resulting themes emerging from the literature are extracted and<br />
presented in each theme category in the literature review. In the theory<br />
discussion chapter, the objective <strong>of</strong> the article is discussed as the theory,<br />
with reference to the article and the relevant parts <strong>of</strong> the literature review.<br />
Thereafter conclusions are drawn in the conclusions chapter <strong>of</strong> this paper.<br />
The methodology applied demonstrates the process used by the authors to<br />
address the objective <strong>of</strong> the paper. The methodology applied is tailored to<br />
the scope and purpose <strong>of</strong> the paper, which is to provide a theory discussion<br />
by referring to similar themes found in the article and prior research. The<br />
methodology applied is valuable for assessing the approach adopted by the<br />
authors and the validity <strong>of</strong> the resulting theory discussion. The methodology<br />
provides a description <strong>of</strong> the method used to carry out the objective <strong>of</strong> this<br />
paper.<br />
Theory Discussion<br />
The theory discussion analyses the objective <strong>of</strong> the article by splitting it into<br />
its constituent themes, which are: information quality definition, attributes,<br />
and importance; information quality problems and solutions; information<br />
acquisition, analysis, and transfer; and the Internet as an information<br />
repository.<br />
Information Quality Definition, Attributes, and Importance<br />
The quality <strong>of</strong> a decision is determined by the quality <strong>of</strong> the information that<br />
it is based on, and that the correct use <strong>of</strong> timely information is critical to the<br />
success <strong>of</strong> an organisation. The article continues to state that decisions must<br />
be based on reliable and responsive information, and the information criteria<br />
296
The Impact <strong>of</strong> Information Quality on Information Research<br />
that must be tested are reliability, empathy, assurance, tangibility, and<br />
responsiveness.<br />
The information used in research includes literature and empirical<br />
data, both provide evidence for the research. The information from the<br />
literature is used to determine how worthwhile the research topic is and to<br />
show that the research work will create new knowledge; and the empirical<br />
data gathered is the foundation <strong>of</strong> any research conclusions. Research is<br />
completely dependent on both these information aspects; the quality <strong>of</strong> these<br />
information aspects must be high in order for the quality <strong>of</strong> the resulting<br />
research to be high.<br />
Information Quality Problems and Solutions<br />
Information quality problems arise from broad definitions <strong>of</strong> information<br />
quality and the inability to define information quality so that it can be<br />
measured and managed (Kahn et al. 2002; Madnick et al. 2009). Another<br />
information quality problem is the validity <strong>of</strong> claims, referring to the wellgroundedness,<br />
or logical correctness <strong>of</strong> a claim (Diakopoulos & Essa 2008).<br />
The Internet has also created information quality problems by dramatically<br />
increasing the unmanaged information flows, and from ad-hoc information<br />
generated from various sources (Segev n.d.).<br />
Solutions to information quality problems include triangulation,<br />
corroboration <strong>of</strong> information sources, and developing a chain <strong>of</strong> evidence to<br />
support inferences (Diakopoulos & Essa 2008). Also, exact and measurable<br />
information quality definitions and information quality management<br />
programs are a solution to information quality problems (Kahn et al. 2002;<br />
Madnick et al. 2009). Indeed, information quality problems can be solved by<br />
implementing methodologies and benchmarks to develop and deliver quality<br />
information (Kahn et al. 2002).<br />
Research is negatively impacted by low quality information due to<br />
poor data, inadequate data preservation and reuse practices, and very little<br />
advanced data instrumentation; solutions include increased data attention,<br />
commitment, quality, availability and growth care (Lyytinen 2009). Low<br />
research information quality causes poor theory, limited scope and scale;<br />
hindered organisational orientation and longitudinal research, and obstructed<br />
integrated theory development with strong, generalisable results (Lyytinen<br />
297
Grant Howard, Sam Lubbe & <strong>Rembrandt</strong> <strong>Klopper</strong><br />
2009). Solutions are IS instrument sharing Internet facilities, public data<br />
sources, new data mining techniques and sharable archival data sets,<br />
institutional data harvesting opportunities, and the digital footprint <strong>of</strong><br />
Internet traffic (Lyytinen 2009).<br />
Information Acquisition, Analysis, and Transfer<br />
The article proposes that the information search task become a collaborative<br />
task performed by both information searchers and users. The article shows<br />
that the attention span <strong>of</strong> Internet searchers to web sites is very limited;<br />
searchers require leadership, motivation, adequate breaks, focus, and well<br />
define search requirements. The article exposes the costs <strong>of</strong> information<br />
searching, being time, effort, money, transmission costs, knowledge<br />
transferral costs, opportunity costs, and information filtering costs to ensure<br />
that information is trustworthy, unbiased, and usable; these costs must be<br />
managed carefully.<br />
The article explains that deciding between delegating the<br />
information search task or self-acquisition is an important choice for<br />
information users, because delegation may affect the specificity <strong>of</strong> the<br />
information search and self-acquisition may be technically difficult and time<br />
consuming. Human knowledge transfer is critical between the information<br />
user and the information searcher, to ensure correct information acquisition.<br />
The article presents the information search task as a process that starts with<br />
a description <strong>of</strong> the search phenomenon followed by search phenomenon<br />
theory articulation and ending in an evaluation <strong>of</strong> the collected information.<br />
The article presents criteria for evaluating information before it is used for<br />
decision-making; these are author authority, comparability, stability, format<br />
appropriateness, s<strong>of</strong>tware requirements, ease <strong>of</strong> scope determination, and<br />
ease <strong>of</strong> author identification, last update date, accuracy, and ease <strong>of</strong> use. In<br />
particular, the article indicates that Internet information evaluation criteria<br />
be content, credibility, critical thinking, copyright, citation, continuity,<br />
censorship, connectivity, comparability, and context.<br />
The literature emphasized the effect <strong>of</strong> user literacy on the<br />
information acquisition task, both negative and positive for poor literacy and<br />
good literacy, respectively (Kodagoda & Wong 2008). In addition, the<br />
complexity <strong>of</strong> the need or task giving rise to the information search will<br />
298
The Impact <strong>of</strong> Information Quality on Information Research<br />
affect the difficulty <strong>of</strong> the information acquisition task and the search<br />
strategy employed (Kodagoda & Wong 2008). The information search<br />
process can consist <strong>of</strong> the following stages, initiation, selection, exploration,<br />
formulation, collection and presentation; and four information seeking<br />
models are presented, being the undirected viewing model, the conditioned<br />
viewing model, the informal search model, and the formal search model<br />
(Kodagoda & Wong 2008). Further, information search tasks can include<br />
building manual inclusion and exclusion rules with the disadvantages that<br />
they can be expensive to maintain (Tang et al. 2005).<br />
The literature states that information quality evaluation is a complex<br />
task consisting <strong>of</strong> evidence gathering, application <strong>of</strong> decision procedures,<br />
and assignment <strong>of</strong> specific quality scores; the task will be different in scale<br />
and complexity for each application domain (Embury et al. 2009).<br />
Information quality evaluation can be performed empirically by counting<br />
hyperlinks or conducting advanced statistical models (Tang et al. 2003).<br />
Also, knowledge about information sources and the processes used to derive<br />
the information is important for evaluation <strong>of</strong> information quality (Madnick<br />
et al. 2009). In the health industry, health information evaluation has been<br />
done by health experts using manual assessment protocols <strong>of</strong> medical web<br />
site information quality, based on either scientific evidence or accountability<br />
criteria (Tang et al. 2005).<br />
One can search for Research information in many and varied<br />
sources, including books, manuals, journals, conference and workshop<br />
proceedings, reports, newspapers, magazines, radio, television, art exhibition<br />
catalogues, multimedia literature, resource catalogues, the Internet, online<br />
databases, gateways, and people; and information and data can be generated<br />
through documents, observations, interviews, and questionnaires (Oates<br />
2006). All searches must follow a well-defined systematic process that<br />
directly addresses the research objectives; this is the basis for the acquisition<br />
<strong>of</strong> high quality information. Research information quality evaluation is a<br />
vital task and includes an assessment <strong>of</strong> the author, publisher, editor,<br />
reviewing peers, citations and references, environment and date published or<br />
produced, intended purpose, the intended audience, appropriateness,<br />
production process and method, flaws and omissions, conclusion<br />
justifications and generalisations, limitations, format, relevance, reliability,<br />
validity, and bias (Oates 2006).<br />
299
Grant Howard, Sam Lubbe & <strong>Rembrandt</strong> <strong>Klopper</strong><br />
The Internet as an Information Repository<br />
The article reiterates that Internet information searchers require motivation<br />
and good search definitions in order to successfully provide for the<br />
information needs. Searching on the WWW is characterised by the ‘rich get<br />
richer’ phenomenon, where a relatively small number <strong>of</strong> sites receive a large<br />
proportion <strong>of</strong> hyperlink references and traffic; this may limit a searchers<br />
search landscape and prevent access to infrequently accessed but high<br />
quality information. Internet information must be treated with caution<br />
because there is a great deal <strong>of</strong> grey information on the Internet, which is<br />
low quality and biased information presented as high quality information. In<br />
addition, Internet sites that provide evaluation <strong>of</strong> other sites may also be<br />
subjective and biased. WWW information is rarely neutral, it usually<br />
represents a certain point <strong>of</strong> view, it frequently cannot be verified, so the<br />
truthfulness <strong>of</strong> WWW is questionable; these aspects contribute to making<br />
WWW information difficult to trust.<br />
The Internet has had a pr<strong>of</strong>ound effect on the research community,<br />
changing the way scientists produce knowledge and creating a dependency<br />
on the Internet for information (Ding et al. 2009; Oates 2006). Researchers<br />
must critically evaluate Internet information before it is used as evidence for<br />
new knowledge because <strong>of</strong> the unregulated nature <strong>of</strong> information on the<br />
Internet; <strong>of</strong> particular research concern is the transitory nature <strong>of</strong><br />
information on the Internet, ethical considerations, and copyright laws and<br />
practices (Oates 2006). Nevertheless, the Internet has also presented new<br />
and efficient opportunities for researchers to search for information, use<br />
information, and gather data and information.<br />
Conclusions<br />
The article provided the salient topics emphasised in the article, and<br />
explained how research is impacted by information quality in a similar way<br />
that decision makers are impacted by information quality. The article stated<br />
its objective, which is to present a theory discussion about the impact <strong>of</strong><br />
information quality on research, using the article as a basis, and prior<br />
research as a supporting reference. The article then set out the prior research<br />
that related to the objective <strong>of</strong> the paper. The article also explained the<br />
300
The Impact <strong>of</strong> Information Quality on Information Research<br />
process used to accomplish its objective, and thereafter a detailed theory<br />
discussion was written.<br />
The article shows that information quality is a critical determinant <strong>of</strong><br />
research success, as measured by the creation <strong>of</strong> new knowledge. Thus,<br />
information quality fundamentally impacts research. Low quality<br />
information will guarantee low quality research. Even though it is known<br />
that information quality has a huge impact on research, the literature<br />
explains that low quality information is evident in the research community.<br />
Reasons for the existence <strong>of</strong> low quality information as well as proposed<br />
solutions to this problem were provided. It is an imperative for researches to<br />
develop information acquisition and evaluation methods to systematically<br />
ensure high information quality, both for the integrity <strong>of</strong> the research itself<br />
and ethically for the users <strong>of</strong> the research. The Internet is a particularly<br />
important aspect <strong>of</strong> information quality because it is so widely and<br />
extensively used as an information repository; the quality <strong>of</strong> information<br />
obtained from the Internet has a significant impact on research quality.<br />
The article is valuable to all information users, including decision<br />
makers and organisational management who rely on information to affect<br />
reality for their purposes and objectives. The article is directed toward the<br />
research community, which uses information comprehensively as a<br />
production input. The quality <strong>of</strong> this production input, being information<br />
quality, has a direct effect on the quality <strong>of</strong> the research output, being the<br />
quality <strong>of</strong> new knowledge created.<br />
References<br />
Baker J, D. Jones & J Burkman 2009. Using Visual Representations <strong>of</strong> Data<br />
to Enhance Sensemaking in Data Exploration Tasks. <strong>Journal</strong> <strong>of</strong> the<br />
Association for Information Systems 10,7: 533-559. Available:<br />
http://aisel.aisnet.org/jais/vol10/iss7/2. (Accessed November 11, 2009.)<br />
Clemson <strong>University</strong> 2005. Information Quality. Available:<br />
http://business.clemson.edu/ISE/html/information_quality.html.<br />
(Accessed November 10, 2009.)<br />
Diakopoulos N & I Essa 2008. An Annotation Model for Making Sense <strong>of</strong><br />
Information Quality in Online Video. Proceedings <strong>of</strong> the 3rd<br />
International Conference on the Pragmatic Web: Innovating the<br />
301
Grant Howard, Sam Lubbe & <strong>Rembrandt</strong> <strong>Klopper</strong><br />
Interactive Society, 363, 31-34. New York, NY, USA: Association for<br />
Computing Machinery. Available: http://delivery.acm.org/10.1145/<br />
1480000/1479195/p31-diakopoulos.pdf?key1=1479195&key2= 9042<br />
987521&coll=Portal&dl=GUIDE&CFID=60913111&CFTOKEN =5956<br />
7180. (Accessed November 10, 2009.)<br />
Ding WW, SG Levin, PE Stephan & AE Winkler 2009. The Impact <strong>of</strong><br />
Information Technology on Scientists' Productivity, Quality and<br />
Collaboration Patterns. NBER Working Paper No. 15285*, 1- 35.<br />
Available: http://www.nber.org/papers/w15285. (Accessed November<br />
10, 2009.)<br />
Embury SM, P Missier, S Sampaio, RM Greenwood & AD Preece 2009.<br />
Incorporating Domain-Specific Information Quality Constraints into<br />
Database Queries. <strong>Journal</strong> <strong>of</strong> Data and Information Quality (JDIQ)<br />
Archive 1,2: 11:1-11:31. New York, NY, USA: Association for<br />
Computing Machinery. Available: http://delivery.acm.org/10.1145/<br />
1580000/1577846/a11-embury.pdf?key1=1577846&key2=5318887521<br />
&coll=portal&dl=ACM&CFID=60913111&CFTOKEN=59567180.<br />
(Accessed November 10, 2009.)<br />
Gates Bill 2000. Shaping the Internet Age. (An essay by Bill Gates on the<br />
evolution <strong>of</strong> Internet and the technologies that are helping connect<br />
people to information, resources and to each other). ©2007 Micros<strong>of</strong>t<br />
Corporation. All rights reserved. Available: http://www.micros<strong>of</strong>t.com/<br />
presspass/exec/billg/writing/shapingtheinternet.mspx. (Accessed August<br />
12, 2010.)<br />
Jung W 2004. A Review <strong>of</strong> Research: An Investigation <strong>of</strong> the Impact <strong>of</strong> Data<br />
Quality on Decision Performance. ACM International Conference<br />
Proceeding Series, Proceedings <strong>of</strong> the 2004 international symposium on<br />
Information and communication technologies, 90, 16-171. Trinity<br />
College Dublin. Available: http://delivery.acm.org/10.1145/1080 000/<br />
1071542/p166-ung.pdf?key1=1071542&key2=0699887521&coll=<br />
GUIDE&dl=GUIDE&CFID=60916471&CFTOKEN=71063370.<br />
(Accessed November 10, 2009.)<br />
Kahn BK, DM Strong & RY Wang 2002. Information Quality Benchmarks:<br />
Product and Service Performance. Communications <strong>of</strong> the ACM archive,<br />
45,4: 184-192. New York, NY, USA: Association for Computing<br />
Machinery. Available: http://delivery.acm.org/10.1145/510000/506007/<br />
302
The Impact <strong>of</strong> Information Quality on Information Research<br />
p184-kahn.pdf?key1=506007&key2=8912987521&coll=Portal&dl=<br />
GUIDE&CFID=60913111&CFTOKEN=59567180. (Accessed<br />
November 10, 2009.)<br />
Klein A & W Lehner 2009. Representing Data Quality in Sensor Data<br />
Streaming Environments. <strong>Journal</strong> <strong>of</strong> Data and Information Quality<br />
(JDIQ) Archive 1,2: 10:1-10:28. New York, NY, USA: Association for<br />
Computing Machinery. Available: http://delivery.acm.org/10.1145/<br />
1580000/1577845/a10-klein.pdf?key1=1577845&key2=8218887521<br />
&coll=portal&dl=ACM&CFID=60913111&CFTOKEN=59567180.<br />
(Accessed November 10, 2009.)<br />
Kodagoda N & BLW Wong 2008. Effects <strong>of</strong> Low & High Literacy on User<br />
Performance in Information Search and Retrieval. British Computer<br />
Society Conference on Human-Computer Interaction Archive,<br />
Proceedings <strong>of</strong> the 22nd British HCI Group Annual Conference on HCI<br />
2008: People and Computers XXII: Culture, Creativity, Interaction 1,<br />
173-181. British Computer Society Swinton, UK, UK. Available:<br />
http://delivery.acm.org/10.1145/1540000/1531538/p173-kodagoda.<br />
pdf?key1=1531538&key2=6041987521&coll=Portal&dl=GUIDE&CFI<br />
D=60913111&CFTOKEN=59567180. (Accessed November 10, 2009.)<br />
Lyytinen K 2009. Data Matters in IS Theory Building. <strong>Journal</strong> <strong>of</strong> the<br />
Association for Information Systems 10,10: 715-720. Available:<br />
http://aisel.aisnet.org/jais/vol10/iss10/3. (Accessed November 11, 2009.)<br />
Madnick SE, RY Wang, Y.W. Lee, & H.Zhu 2009. Overview and<br />
Framework for Data and Information Quality Research. <strong>Journal</strong> <strong>of</strong> Data<br />
and Information Quality (JDIQ) Archive 1,1: 3.1-3.22. New York, NY,<br />
USA: Association for Computing Machinery. Available:<br />
http://delivery.acm.org/10.1145/1520000/1516680/a2-madnick.pdf?<br />
key1=1516680&key2=9308887521&coll=portal&dl=ACM&CFID=609<br />
13111&CFTOKEN=59567180. (Accessed November 10, 2009.)<br />
Majkić Z 2004. A General Framework for Query Answering in Data<br />
Quality-based Cooperative Information Systems. Information Quality in<br />
Informational Systems Archive, Proceedings <strong>of</strong> the 2004 International<br />
Workshop on Information Quality in Information Systems, 44-50. New<br />
York, NY, USA: Association for Computing Machinery. Available:<br />
http://delivery.acm.org/10.1145/1020000/1012461/p44-majkic.pdf?<br />
key1=1012461&key2=4291987521&coll=Portal&dl=GUIDE&CFID=60<br />
303
Grant Howard, Sam Lubbe & <strong>Rembrandt</strong> <strong>Klopper</strong><br />
913111&CFTOKEN=59567180. (Accessed November 10, 2009.)<br />
Oates BJ 2006. Researching Information Systems and Computing. London:<br />
Sage Publications Ltd.<br />
Pennock, DM, GW Flake, S Lawrence, EJ Glover, & CL Giles 2002.<br />
Winners don’t Take All: Characterizing the Competition for Links on<br />
the Web. Proceedings <strong>of</strong> the National Academy <strong>of</strong> Sciences <strong>of</strong> the<br />
United States <strong>of</strong> America. Available: http://www.pnas.org/content/99/8/<br />
5207.full. (Accessed November 10, 2009.)<br />
Segev A No Date. On Information Quality and WWW Impact. A Position<br />
Paper. Fisher Center for Information Technology and Management.<br />
Haas School <strong>of</strong> Business, <strong>University</strong> <strong>of</strong> California, Berkeley. Available<br />
at: http://mitiq.mit.edu/iciq/Documents/IQ%20Conference%201996/<br />
Keynote%20and%20Lunch%20Speeches/On%20Information%20Qualit<br />
y%20and%20the%20WWW%20Impact.pdf. (Accessed November 10,<br />
2009.)<br />
Tang R, KB Ng, T Strzalkowski, & PB Kantor 2003. Automatically<br />
Predicting Information Quality in News Documents. North American<br />
Chapter Of The Association For Computational Linguistics archive,<br />
Proceedings <strong>of</strong> the 2003 Conference <strong>of</strong> the North American Chapter <strong>of</strong><br />
the Association for Computational Linguistics on Human Language<br />
Technology: companion volume <strong>of</strong> the Proceedings <strong>of</strong> HLT-NAACL<br />
2003--short papers, 2, 97-99. Association for Computational Linguistics<br />
Morristown, NJ, USA. Available: http://delivery.acm.org/10.1145/<br />
1080000/1073516/p97-tang.pdf?key1=1073516&key2=6332987521&<br />
coll =Portal&dl=GUIDE&CFID=60913111&CFTOKEN=59567180.<br />
(Accessed November 10, 2009.)<br />
Tang TT, D Hawking, N Craswell, & K Griffiths 2005. Focused Crawling<br />
for both Topical Relevance and Quality <strong>of</strong> Medical Information.<br />
Conference on Information and Knowledge Management archive,<br />
Proceedings <strong>of</strong> the 14th ACM international conference on Information<br />
and knowledge management, 147 – 154. New York, NY, USA:<br />
Association for Computing Machinery. Available: http://delivery.<br />
acm.org/10.1145/ 1100000/1099583/p147-tang.pdf?key1=1099583<br />
&key2=1202987521& coll=Portal&dl=GUIDE&CFID=60913111&<br />
CFTOKEN=59567180/. (Accessed November 10, 2009.)<br />
304
The Impact <strong>of</strong> Information Quality on Information Research<br />
305<br />
Grant Howard<br />
School <strong>of</strong> Computing, UNISA<br />
South Africa<br />
Grant.Howard@vodamail.co.za<br />
Sam Lubbe<br />
School <strong>of</strong> Information Systems<br />
North West <strong>University</strong><br />
South Africa<br />
sam.lubbe@nwu.ac.za<br />
<strong>Rembrandt</strong> <strong>Klopper</strong><br />
School <strong>of</strong> Information Systems & Technology<br />
<strong>University</strong> <strong>of</strong> <strong>KwaZulu</strong>-<strong>Natal</strong><br />
Durban, South Africa<br />
rklopper@gmail.com
Strategic Planning for<br />
Digital Convergence in<br />
South African Businesses<br />
Kiru J. Pillay<br />
Manoj S. Maharaj<br />
Abstract<br />
Findings generated from a study that looked at the benefits and barriers that<br />
organisations anticipate, experience and plan for when considering a<br />
strategic implementation <strong>of</strong> convergence initiatives are presented. The study<br />
focused on the strategic planning aspects <strong>of</strong> convergence in South African<br />
organisations and analysed the sophistication <strong>of</strong> these plans. The paper<br />
presents a discussion <strong>of</strong> three phases within the process: The first phase<br />
interrogates the planning process and reveals that the organisations under<br />
study did not adopt a formal approach to planning, and at best relied on a<br />
semi-formal approach. The second phase investigates the planning steps for<br />
convergence, which show that the majority <strong>of</strong> organisations do follow a stepby-step<br />
approach and make deliberate attempts to identify the benefits <strong>of</strong> and<br />
barriers to their convergence initiatives. An expanded model incorporating<br />
these planning steps is proposed with additional steps extrapolated from the<br />
research findings and the literature review. Lastly an in investigation <strong>of</strong> the<br />
benefits and barriers anticipated and experienced reveals that the benefits<br />
anticipated from a convergence initiative show a clear expectation <strong>of</strong> lower<br />
management and service costs.<br />
Keywords: Digital Convergence, Strategic Planning.<br />
Introduction<br />
There has been much written about convergence in the past few decades, so<br />
much so that it has become increasingly difficult to separate hype from<br />
<strong>Alternation</strong> Special Edition 4 (2011) 306 – 333<br />
ISSN 1023-1757<br />
306
Strategic Planning for Digital Convergence in South African Businesses<br />
reality. Convergence is not a single homogenous process, but a range <strong>of</strong><br />
processes comprised <strong>of</strong> a series <strong>of</strong> discrete developments in technologies,<br />
networks, content, gateways, retail marketing strategies, services and<br />
markets, as well as the changing relationships between all <strong>of</strong> these distinct<br />
areas. A clear definition <strong>of</strong> the concept <strong>of</strong> convergence does not exist<br />
(Kaluza, Blecker & Bisch<strong>of</strong> 1999). Convergence has the ability to impact an<br />
organisations’ strategic capability (Chaterjee & Byun 2002) and also has the<br />
potential to impact on the delivery <strong>of</strong> government services. But convergence<br />
has not progressed at the speed at which it was previously thought, largely<br />
due to a number <strong>of</strong> technological, market regulatory and consumer barriers<br />
(Gillwald 2003), with lingering concerns holding some firms back from<br />
deployment (Economist Intelligence Unit 2004). The management <strong>of</strong><br />
technological transition have always been difficult for organisations, and<br />
those that approach convergence tactically rather than strategically will<br />
rebuild their network several times at multiple times the cost <strong>of</strong> a wellplanned<br />
network (Srivastava & Finger 2006).<br />
Problem Statement and Objectives <strong>of</strong> the Study<br />
A review <strong>of</strong> the literature reveals that while extensive research has been<br />
conducted into the technological aspects <strong>of</strong> convergence, there is a lack <strong>of</strong><br />
research into the planning aspects, especially the extent to which<br />
organisations are strategically planning for convergence. Even if planning is<br />
taking place, there is little or no evidence as to the sophistication <strong>of</strong> those<br />
plans. Additionally the literature points to many organisation’s having a<br />
narrow view <strong>of</strong> convergence and its potential benefits, with many confining<br />
convergence to the realm <strong>of</strong> Voice over IP solutions (Gartner 2002).<br />
Similarly little is know about the barriers that organisations encounter in<br />
their endeavour to deploy a converged infrastructure or indeed what steps<br />
are being taken or what methods are available to overcome these barriers.<br />
Given the problem outlined above, this study focused on the<br />
strategic planning aspects <strong>of</strong> digital convergence in South African<br />
organisations. Specifically this study sought to contribute to the literature by<br />
providing insight into the extent <strong>of</strong> the planning process for convergence that<br />
organisations are undertaking, and investigating the sophistication <strong>of</strong> these<br />
plans with respect to established planning process dimensions. Additionally<br />
307
Kiru J. Pillay & Manoj S. Maharaj<br />
the study aimed to identify the benefits and barriers, both anticipated and<br />
experienced.<br />
Importance <strong>of</strong> the Research<br />
Competition in an environment marked by convergence is assumed to lead to<br />
faster-paced innovation and improved products and services for consumers<br />
at lower costs. The resulting networked economy will facilitate national<br />
economic growth and participation in the global information or knowledge<br />
society (Wild 2006). The South African government continues to emphasise<br />
the importance <strong>of</strong> ICT’s and their contribution to the country’s economic<br />
growth, specifically in the broad framework for economic policy as set out<br />
in the Accelerated and Shared Growth Initiative <strong>of</strong> South Africa (ASGISA).<br />
In the current version, the action plan includes the goal to bring down the<br />
cost <strong>of</strong> ICT by developing high-speed national and international broadband<br />
capacity. However, South Africa continues, despite the overall growth <strong>of</strong> the<br />
ICT sector, to lag behind the international community, and while the<br />
incremental movements down international scales are not dramatic, they<br />
certainly indicate an inability by the country to harness the potential <strong>of</strong> ICT<br />
for economic growth and development as articulated in various national<br />
policies and strategies. The World Economic Forum (2008) which measures<br />
a country’s ICT capability through its ‘networked readiness index’ (NRI),<br />
currently ranks South Africa 52nd in its 2008-2009 report, out a possible 134<br />
countries. South Africa has fallen from 51 st in 2007-2008.<br />
The results from this study will assist organisations reflect on their<br />
planning process; it will enable organisations understand weaknesses and<br />
strengths within their planning process for convergence, thereby assisting in<br />
the realignment <strong>of</strong> the planning process to better meet the demands <strong>of</strong><br />
convergence planning. Moreover this study will identify and compare<br />
benefits and barriers, both anticipated and experienced. It will enable<br />
organisations to benchmark against the benefits being experienced in the<br />
wider industry and also gain a better understanding <strong>of</strong> the barriers to<br />
convergence being faced by organisations.<br />
Literature Review<br />
Convergence<br />
Information has increasingly become a commodity in its own right and now<br />
308
Strategic Planning for Digital Convergence in South African Businesses<br />
ranks as one <strong>of</strong> the natural resources <strong>of</strong> an economy along with human,<br />
natural and financial resources. It has been argued that society at large is<br />
now entering a new type <strong>of</strong> information-driven economy or even a<br />
completely new form <strong>of</strong> ‘information society’ and ‘information economy’<br />
(Webster 1994). The International Telecommunications Union (ITU 2007)<br />
defines this information society as the digital revolution in information and<br />
communication technologies that have created a platform for a free flow <strong>of</strong><br />
information, ideas and knowledge across the globe; while Katz (1987)<br />
describes the information society as socio-economic systems that exhibit<br />
high employment <strong>of</strong> information-related occupations and wide diffusion <strong>of</strong><br />
information technologies.<br />
The diffusion <strong>of</strong> new technology is perceived as a major feature <strong>of</strong><br />
the information society (European Commission 1996; Melody et al. 2005),<br />
with convergence in particular being hailed by many as the catalyst for the<br />
information revolution (Hassan 2000; Braman 1993). Rosenberg (1963)<br />
notes that the term convergence was first used to describe ‘convergent<br />
technologies’ in the US machine tool industry. Since then several scholars<br />
have adopted the concept for various industries. The common theme in<br />
respect <strong>of</strong> a definition <strong>of</strong> convergence indicates a moving towards or<br />
meeting at some common point or tending towards the same result, i.e.<br />
merging. Primarily what is being conceived as merged relates to technology,<br />
i.e. the integration <strong>of</strong> communications, broadcasting, telecommunications<br />
and computers, but in a secondary sense a number <strong>of</strong> other areas come into<br />
play: services; markets; industry alliances and mergers and policy and<br />
regulation (Bohlin 2000).<br />
While the literature is littered with definitions <strong>of</strong> convergence, the<br />
most frequently quoted source for a definition <strong>of</strong> convergence comes from<br />
the Green Paper on Convergence issued by the European Commission in<br />
1997 which defines convergence as ‘the ability <strong>of</strong> different network<br />
platforms to carry essentially similar kinds <strong>of</strong> services’ or ‘the coming<br />
together <strong>of</strong> consumer devices such as the telephone, television and personal<br />
computer’. For the purposes <strong>of</strong> this study convergence is defined at its most<br />
general level as the increasing interrelationship and level <strong>of</strong> integration,<br />
between the disciplines <strong>of</strong> telecommunications, broadcasting media, and<br />
information technology.<br />
309
Kiru J. Pillay & Manoj S. Maharaj<br />
The Strategic Nature <strong>of</strong> Convergence<br />
Competition in an environment marked by convergence is assumed to lead to<br />
faster-paced innovation and improved products and services for consumers<br />
at lower costs (Wild 2006). Kaluza et al. (1999) cite the example <strong>of</strong> Siemans<br />
AG, which stated that besides deregulation and privatisation, the main driver<br />
for the organisations planned restructure had been the convergence <strong>of</strong><br />
technologies. Convergence can also shape the delivery <strong>of</strong> government<br />
services, redefine the way businesses operate and provide individuals with<br />
as yet unimagined information and communication services. Converged<br />
services may <strong>of</strong>fer many people in developing countries a better value<br />
proposition and lower priced access to basic voice communications and will<br />
also provide new opportunities for extending network access to many rural<br />
areas in an economically sustainable manner.<br />
Convergence: Legislation and Research<br />
With its relatively well developed and diverse infrastructure, South Africa is<br />
taking a leading role in the region in respect <strong>of</strong> convergence <strong>of</strong><br />
telecommunications and information technologies with the media and<br />
entertainment sector (Budde 2008), as envisaged in the Electronic<br />
Communications Act (ECA), that encompasses legislation relating to<br />
convergence. The stated intention <strong>of</strong> the ECA is to lower costs <strong>of</strong> access to<br />
ICT and increase efficiency <strong>of</strong> telecommunications provisioning in South<br />
Africa (ECA 2005).<br />
Various industry-based surveys that provide evidence <strong>of</strong> the<br />
strategic nature and <strong>of</strong> the importance with which organisations view<br />
convergence have been undertaken. The Economist Intelligence Unit (2004)<br />
survey found that over two-thirds <strong>of</strong> companies surveyed were expected to<br />
shift to converged networks throughout most or all <strong>of</strong> their organizations. A<br />
Yankee Group (2003) survey found that 80% <strong>of</strong> operators believe<br />
deployment <strong>of</strong> converged services will boost pr<strong>of</strong>it margins.<br />
The Planning Process for Convergence<br />
Gottschalk (1999) writes that barriers to the implementation <strong>of</strong> strategic<br />
plans may have roots in the planning process, and may include the fact that<br />
the plan was not sufficiently useful and it did not fit the organisation. An<br />
extensive analysis <strong>of</strong> Strategic Information Systems Planning (SISP) reveals<br />
310
Strategic Planning for Digital Convergence in South African Businesses<br />
six emergent process dimensions that are robust (Segars, Grover & Teng<br />
1998), and which can be used to investigate the strategic planning process<br />
for convergence.<br />
Research Question 1<br />
What is the extent <strong>of</strong> planning for digital convergence in South African<br />
organisations with respect to the following planning process dimensions?<br />
Formalisation: refers to the existence <strong>of</strong> structures, techniques, written<br />
procedures, and policies that guide the planning process (Lederer &<br />
Sethi 1996).<br />
Consistency: is concerned with the frequency <strong>of</strong> planning activities and<br />
the frequency <strong>of</strong> evaluation and revision <strong>of</strong> strategic plans (Sabherwal &<br />
King 1995 as cited in Segars et al. 1998).<br />
Planning Flow: refers to the locus <strong>of</strong> authority or devolution <strong>of</strong><br />
responsibilities for strategic planning; in other words, the roles played<br />
by corporate and divisional managers in the initiation <strong>of</strong> the planning<br />
process (Segars & Grover 1999).<br />
Focus: refers to the balance between creativity and control that exist<br />
within the strategic planning process (Chakravarthy 1987).<br />
Participation: captures the breadth <strong>of</strong> involvement in strategic planning<br />
by examining the number <strong>of</strong> planners involved and representation from<br />
various functional areas in the planning process (Lederer & Sethi 1996;<br />
Sabherwal & King 1995).<br />
Comprehensiveness: Segars et al. (1998) define comprehensiveness as<br />
‘the extent to which an organisation attempts to be exhaustive or<br />
inclusive in making and integrating strategic decisions’.<br />
Planning Steps for Convergence<br />
Various commentators (Chatterejee & Byun 2002; Hukill et al. 2000)<br />
propose questions that must be posed when undertaking a strategic planning<br />
311
Kiru J. Pillay & Manoj S. Maharaj<br />
process for convergence. Green (2001) proposes a model that begins with a<br />
complete understanding <strong>of</strong> the business plans and organisational objectives.<br />
Problems the organisation is experiencing are analysed. Once the problems<br />
and objectives are well understood, the next step is to develop alternatives.<br />
The alternatives are tested against the objectives to determine how they will<br />
meet the mandatory features. Then a feasibility process is used to determine<br />
which alternatives <strong>of</strong>fer the best economic and technical performance. The<br />
literature suggests that there appears to be no adequate planning model for<br />
convergence initiatives. There are many models for strategic planning, but<br />
none that specifically target infrastructure convergence initiatives and none<br />
that take into account the nuances that may make a convergence<br />
infrastructure project unique.<br />
Research Question 2<br />
2a -What are the relevant steps for convergence planning?<br />
2b -Do the planning steps specifically identify the implementation issues<br />
with regards to these initiatives?<br />
Benefits <strong>of</strong>, and Barriers to Convergence<br />
In an opening address at the National Colloquium on Convergence Policy<br />
(NCCP 2003), held and hosted by the South African Department <strong>of</strong><br />
Communications in July 2003, the then Minister <strong>of</strong> Communication affirmed<br />
that convergence will lead to numerous economic and social benefits, but<br />
that there are many challenges as well (MoC 2003). Organisations need to<br />
have a clear understanding <strong>of</strong> what benefits they anticipate from<br />
convergence before they invest in it. The value proposition for convergence<br />
embraces service providers, enterprises, individual business users and<br />
residential users (Chatterjee & Byun 2002). Many organisations have a<br />
narrow view <strong>of</strong> convergence and its potential benefits with many having<br />
considered convergence simply as the transmission <strong>of</strong> voice traffic over<br />
alternate technologies without fully planning for the value-added services<br />
that can be leveraged <strong>of</strong>f <strong>of</strong> a converged network. While the uptake <strong>of</strong><br />
convergence seems inevitable, Gillwald (2003) notes that convergence has<br />
not progressed at the speed at which it was previously thought, largely due<br />
to a number <strong>of</strong> technological, market regulatory and consumer barriers, with<br />
312
Strategic Planning for Digital Convergence in South African Businesses<br />
one <strong>of</strong> the major challenges being the actual concept and definition <strong>of</strong><br />
convergence.<br />
Research Question 3<br />
3a -To what extent are benefits and barriers that are anticipated during the<br />
planning stage for convergence being experienced post implementation?<br />
3b -Do the planning steps specifically identify the benefits <strong>of</strong>, and barriers to<br />
convergence?<br />
Research Methodology<br />
This study was exploratory in nature with the intention to look for patterns<br />
and to gain familiarity with the area <strong>of</strong> strategic planning for convergence,<br />
and to identify areas for a more rigorous investigation at a later stage. A<br />
primarily qualitative design was selected which allows for in-depth probing<br />
<strong>of</strong> issues and greater detail in responses (Denzin & Lincoln 1994). The study<br />
also included some quantitative data collection and analysis using a priori<br />
methods, with the analysis taking the form <strong>of</strong> frequency counts and<br />
descriptive statistics.<br />
This study adopted a multiple case study approach considered<br />
appropriate to an exploratory study (Galliers 1991; Hussey & Hussey 1997),<br />
based on a series <strong>of</strong> semi-structured in-depth interviews (Martin 2003;<br />
Denzin & Lincoln 1994). The unit <strong>of</strong> analysis were organisations that had<br />
implemented, or were in the process <strong>of</strong> implementing, a converged<br />
infrastructure. The population for this study were medium to large<br />
organisations as defined by the National Small Business act <strong>of</strong> 1996, (NSBA<br />
1996) with more than 50 employees and annual turnover <strong>of</strong> over R10m.<br />
The organisations were based in Gauteng, South Africa. In total<br />
eleven participants from eight organisations contributed to this research and<br />
all were interviewed individually in their role as a representative <strong>of</strong> a<br />
particular company. Three <strong>of</strong> the eight organisations provided two<br />
respondents, while the remaining five provided one respondent. Where<br />
organisations provided two interviewees, these multiple interviews were<br />
treated as confirmatory interviews. Divergent views were reconciled by<br />
contacting these interviewees with a view to reaching consensus. An<br />
interview schedule was developed that contained all the questions required<br />
313
Kiru J. Pillay & Manoj S. Maharaj<br />
to elicit the required information. Both a pre-test and a pilot test were<br />
conducted prior to the initial data collection phase. The eleven interviews<br />
were held in person in the second half <strong>of</strong> 2008 and took approximately one<br />
hour each.<br />
In this research the quantitative questions produced responses that<br />
could be easily counted and summarised. The qualitative questions were<br />
subject to content analysis or interpretive analysis (Martin 2003). This<br />
involved coding the qualitative data which entailed mapping the interview<br />
transcripts and notes made during the interview. Codes were allocated to<br />
pre-existing categories developed as part <strong>of</strong> an a priori design and also to the<br />
categories that emerged from the data. The process planning dimensions,<br />
Research Question One, provided a convenient and appropriate high-level<br />
coding scheme with the process dimensions being allocated codes D1-D6.<br />
Multiple-choice questions provided natural categories that only needed to be<br />
allocated appropriate codes. Research Question two did not require a<br />
category construction but integrated the relevant steps described by the<br />
respondents to derive the planning model.<br />
Presentation and Interpretation <strong>of</strong> Findings<br />
The respondents were senior personnel responsible for the planning and<br />
deployment <strong>of</strong> converged solutions; they had insight into the reason why<br />
organisations opt for a converged infrastructure and were able to highlight<br />
the benefits and barriers anticipated and experienced. Four <strong>of</strong> the<br />
interviewees were in executive IT positions. The specific responsibility<br />
included new business development, ICT process optimisation and general<br />
IT management. One respondent was the managing director <strong>of</strong> the company<br />
and another was the chief enterprise architect. The industry sectors<br />
represented by the organisations in the sample were telecommunications,<br />
information technology, transportation and system integrators. The average<br />
experience in ‘IT planning and administration’ across all organisations was<br />
approximately 12 years. The average experience in ‘network planning and<br />
administration’ across all organisations was approximately five years. The<br />
average experience in ‘telecommunications, media and broadcasting<br />
planning across all organisations was approximately four years.<br />
314
Strategic Planning for Digital Convergence in South African Businesses<br />
Research Question One: Discussion and Interpretation <strong>of</strong><br />
Findings<br />
Analysis <strong>of</strong> the process dimensions reveals distinct pr<strong>of</strong>iles in planning<br />
within organisations (Chakravarthy 1987). Figure 3.1 has been adapted from<br />
Segars & Grover (1999) and pr<strong>of</strong>iles the sample under study with respect to<br />
the six dimensions for the planning process. Even though the Segars &<br />
Grover model was used to illustrate the analysis <strong>of</strong> quantitative data, the<br />
model is still a convenient way <strong>of</strong> pr<strong>of</strong>ile the planning process for this<br />
exploratory study.<br />
The position <strong>of</strong> the dimension in Figure 3.1 is an indication <strong>of</strong> where<br />
the majority <strong>of</strong> responses occurred. The horizontal line indicates a mid-point<br />
i.e. an even split in responses. Rational planning systems display high levels<br />
<strong>of</strong> comprehensiveness, formalisation and a focus on integration while<br />
planning systems with high adaptability display wide participation and high<br />
levels <strong>of</strong> planning consistency (Segars et al. 1998). This pr<strong>of</strong>ile <strong>of</strong> the study<br />
is split on rationality and adaptability and exhibits relatively informal and<br />
non-comprehensive planning with a medium magnitude <strong>of</strong> control, but with<br />
a high top-down orientation and high levels <strong>of</strong> participation and consistency.<br />
In practice the formalisation <strong>of</strong> the planning process generally has a<br />
weak focus in the sample with only two organisations emphatically<br />
indicating a formal process. This has important implications for the choices<br />
that are apparent to organisations. Formal planning systems and processes<br />
will lead to better choices, more informed evaluation <strong>of</strong> alternatives and<br />
ultimately better levels <strong>of</strong> organisational performance. Organisations that<br />
exhibit a low degree <strong>of</strong> formality may find it difficult to facilitate ‘out <strong>of</strong> the<br />
box’ thinking, and the planning process may not be particularly effective<br />
(Segars & Grover 1999).<br />
Both <strong>of</strong> the organisations that indicated a formal strategic planning<br />
process were system integrators, and were subsidiaries <strong>of</strong> larger international<br />
organisations. Respondents from both organisations alluded to a strong<br />
influence from the parent company and also, parent organisations that were<br />
process dependent. The inference <strong>of</strong> this is that South African organisations,<br />
which made up the remainder <strong>of</strong> the sample, have to pay more attention to<br />
their operational processes, all <strong>of</strong> which may relate to the ‘maturity’ <strong>of</strong><br />
organisations. While the degree <strong>of</strong> formalisation <strong>of</strong> the strategic planning<br />
process for convergence was generally low there was an overall intention to<br />
315
Kiru J. Pillay & Manoj S. Maharaj<br />
change this situation - all organisations were in the process <strong>of</strong> creating<br />
formalised structures and techniques to initiate and guide the planning<br />
process, which are characteristics <strong>of</strong> formal systems (Segars et al. 1998).<br />
Formal planning systems create efficiency for both the receipt and<br />
processing <strong>of</strong> information and increases organisational ability to consider a<br />
greater number <strong>of</strong> issues, a view that was supported by the majority <strong>of</strong> the<br />
sample. Mintzberg (1994) in describing what he calls the ‘fallacy <strong>of</strong><br />
formalisation’ voices a contrasting view, which says that while formalisation<br />
implies a rational process from analysis to eventual action planning is also a<br />
learning process that can proceed in the opposite direction as well.<br />
In this study the sample displayed a high-level <strong>of</strong> consistency,<br />
characterised by a planning process that is part <strong>of</strong> a continuous planning<br />
cycle. A continuous planning process improves decision speed, which may<br />
be necessary for organisations that are required to adapt to unexpected<br />
changes in both internal and external environments (Sabherwal & King<br />
1995). Inconsistent planning systems, on the other hand, generally have<br />
strategic plans with longer time frames, an approach that may be warranted<br />
when strategic issues are relatively few and stable. The organisations in the<br />
study sample all work in the IT, telecommunications or transportation sector,<br />
which are considered fast-changing environments, in which organisations<br />
have to react quickly and display organisational agility. Highly consistency<br />
would be an imperative for this. In South African companies information<br />
technology is viewed as essential for executing strategies and therefore ‘adhoc,<br />
incremental and disconnected approaches to information systems (IS)<br />
strategy formulation are simply not good enough’ (Cohen 2003). While the<br />
strategic plan analyses the longer-range view, normally three to seven years<br />
into the future, some companies attempt to look even further into the future.<br />
But the longer the planning the more likely something will render it invalid<br />
especially in a fluid environment e.g. the rapid growth <strong>of</strong> the Internet and ecommerce<br />
took many organisations by surprise (Green 2001).<br />
This study revealed a ‘top-down’ planning flow that is characterised<br />
by limited participation <strong>of</strong> lower level managers in the initiation <strong>of</strong> the<br />
strategic planning process. Wilson (1991) supports this approach and<br />
contends that strategy must be corporate in character and must be initiated at<br />
board level. The role <strong>of</strong> functional or business unit managers in a top-down<br />
planning system is limited to strategy implementation. In essence higher<br />
316
Strategic Planning for Digital Convergence in South African Businesses<br />
Figure 1: Pr<strong>of</strong>ile <strong>of</strong> Planning<br />
Informal /<br />
Semi-formal<br />
Inconsistent<br />
Bottom-Up<br />
Creativity<br />
Focus<br />
Narrow<br />
Participation<br />
Noncomprehensive<br />
317<br />
Formal<br />
Consistent<br />
Top-Down<br />
Control<br />
Focus<br />
Broad<br />
Particpation<br />
Comprehensiveness<br />
levels <strong>of</strong> management assume the responsibility for formulating all new<br />
strategic moves. Top management participation has been associated with<br />
more successful strategic information system planning (Lederer & Salmela<br />
1996). Enns & Huff (n.d.) believe that the ability <strong>of</strong> the CIO to obtain the<br />
cooperation and commitment in the organisation is critical to the successful<br />
IS strategy implementation.
Kiru J. Pillay & Manoj S. Maharaj<br />
The scope <strong>of</strong> Strategic Information System Planning (SISP) efforts<br />
is broad and includes the development <strong>of</strong> organisational-wide information<br />
requirements and plans for the general direction the company. These plans<br />
lack detail and look at issues like market share, opportunities, threats, and<br />
competitive position (Green 2001). The perspective <strong>of</strong> SISP is that <strong>of</strong> the<br />
highest levels <strong>of</strong> management and the highest level <strong>of</strong> an organisation’s<br />
planning hierarchy. This implies a ‘top-down’ flow, where authority resides<br />
with top management, and indicates a responsibility from top management<br />
for the strategic planning process and implementation <strong>of</strong> strategic plans.<br />
Simpson (1998) in contrast states that the governance model based the<br />
premise that senior people should work on strategy is flawed because usually<br />
people at the top <strong>of</strong> an organisations are too disconnected from the business<br />
to do a good job <strong>of</strong> developing strategy on their own.<br />
The sample showed a very small bias towards a control focus i.e. an<br />
integrative approach that is closely tied to the regular accounting and<br />
budgetary systems <strong>of</strong> the organisation (Chakravarthy 1987). These two<br />
somewhat opposed orientations <strong>of</strong> control and creativity must be balanced in<br />
order to enhance the effectiveness <strong>of</strong> a planning system; an excessive<br />
emphasis on either <strong>of</strong> these is apt to be a dysfunctional planning system<br />
(Ramanujam et al. 1986). The innovative approach, which nurtures<br />
creativity through a continuous and systematic search for opportunities<br />
and/or threats in the competitive environment (Segars & Grover 1999), was<br />
also favoured by many <strong>of</strong> the organisations in the sample. This duality <strong>of</strong><br />
purpose is a source <strong>of</strong> further research and can be attributed to the current<br />
market conditions that may have forced organisations to re-look at their<br />
strategic purpose and reducing costs may be the more prudent option at<br />
present. Innovation and the search for innovation carry a financial burden;<br />
more sources <strong>of</strong> information would have to be consulted and this is possibly<br />
a financial outlay that organisations are not prepared to make at present. The<br />
stimuli for innovative solutions are <strong>of</strong>ten opportunities e.g. reaching new<br />
customers or introducing new products, and are <strong>of</strong>ten based on expectations<br />
and projections without hard evidence (Boonstra 2003). Simpson (1998)<br />
believes that strategy development is a creative process and does not flourish<br />
when there are routines imposed and contends that ‘routines processes<br />
produce routine results’ while Mintzberg (1978) states that strategy<br />
development is as much art as science and is crafted rather than engineered.<br />
318
Strategic Planning for Digital Convergence in South African Businesses<br />
The research was conducted during a time <strong>of</strong> extreme world-wide economic<br />
crisis, with many organisations and countries facing extremely tough trading<br />
conditions. While the research did have a long-term view in mind, it is<br />
possible that some responses were tinged with a pre-occupation with the<br />
economic conditions, which may have favoured a more integrative approach<br />
to planning.<br />
With respect to participation there was a wide breadth <strong>of</strong><br />
involvement across all organisations. All organisations involved the IT<br />
management staff in the strategic planning process for convergence, with the<br />
majority <strong>of</strong> organisations indicating some involvement <strong>of</strong> senior IT<br />
management. There was an intention amongst organisations to increase the<br />
level <strong>of</strong> participation from non-IT management. Lederer and Salmela (1996)<br />
contend that participation by members <strong>of</strong> the user community and<br />
information system managers can greatly facilitate the planning process as<br />
long as they have the necessary skills and experience. Systems with a narrow<br />
participation generally foster an isolated approach to planning (Segars et al.<br />
1998) and this study highlighted a contradiction in that although there was a<br />
high degree <strong>of</strong> participation, there was still an isolated approach to strategic<br />
planning for convergence. One explanation is that while the breadth <strong>of</strong><br />
participation is broad, it is broad across the IT function within the<br />
organisation and therefore relatively isolated from other sections <strong>of</strong> the<br />
organisation; if this scenario <strong>of</strong> narrow ownership is true, then it may result<br />
in planning that is sterile (Grundy & King 1992). Godet (2000) writes that<br />
the complexity <strong>of</strong> strategic problems means using methods that are as<br />
‘rigorous and participatory’ as possible to find acceptable solution.<br />
The study showed a low-level <strong>of</strong> comprehensiveness with the<br />
majority <strong>of</strong> organisations not being exhaustive in information gathering or in<br />
evalu-ation <strong>of</strong> alternatives. This in turn negatively affects an organisations<br />
ability to: thoroughly canvass a wide range <strong>of</strong> alternatives; survey a full<br />
range <strong>of</strong> objectives; carefully weigh up the costs and risks <strong>of</strong> various<br />
consequences; search for information to evaluate alternative actions;<br />
objectively evaluating information regarding alternative actions; reexamining<br />
the consequences <strong>of</strong> all known alternatives and make detailed<br />
plans – all <strong>of</strong> which are indicators <strong>of</strong> comprehensiveness (Janis & Mann<br />
1977).<br />
319
Kiru J. Pillay & Manoj S. Maharaj<br />
In general, organisations must balance the benefits <strong>of</strong> consistency<br />
and integration associated with thorough decision analysis with the costs <strong>of</strong><br />
inaction, managerial time and financial resources. This study indicated a low<br />
degree <strong>of</strong> comprehensiveness as there was no attempt to be exhaustive in<br />
information gathering and also no inclination to searching for the best<br />
solution. In some competitive contexts it may be more appropriate to<br />
‘satisfice’ rather than optimise (Sabherwal & King 1995). This may be<br />
particularly true <strong>of</strong> this study sample that all operate in fast-changing<br />
environments. Boonstra (2003) identified decision-making patterns <strong>of</strong> simple<br />
‘impasse’, where a ready-made solution is available, or ‘basic search’ where<br />
the search is for the best available ready-made solutions, as part <strong>of</strong> the<br />
‘satisficying’ approach.<br />
Research Question Two: Discussion and Interpretation <strong>of</strong><br />
Findings<br />
A suitable model from the literature (Green 2001) was presented to and<br />
served the purpose <strong>of</strong> framing the respondents’ responses. This model<br />
represents what is currently being used and was chosen as a convenient<br />
benchmark and does not represents an authoritative or definitive view on<br />
what planning steps should be included. Based on the findings an extension<br />
<strong>of</strong> Green’s model, illustrated in Figure 3.2 below, is presented. The model<br />
attempts to specify planning steps as articulated by the respondents and from<br />
the literature.<br />
The first step identified by respondents entailed the identification <strong>of</strong><br />
either a problem within the organisation that required a solution or a potential<br />
opportunity. This step was also referred to as a ‘feasibility study’, ‘project<br />
mandate’ or ‘identification <strong>of</strong> a need’. The second step identified was<br />
given the label ‘approval’ and as the name implies, it is the step that either<br />
approves or rejects the initiative. The next two steps involved the analysis <strong>of</strong><br />
the initiative, with step three given the name ‘financial analysis’ and step<br />
four given the label ‘technical analysis’. The next step was the labelled<br />
‘choose plan’, which as the name implies involved choosing from the<br />
alternatives available. Surprisingly not all organisations indicated a specific<br />
step to evaluate alternate solutions. Green (2001) states that while solutions<br />
may be obvious when problems and objectives are clearly stated, when there<br />
is no obvious solution in sight, alternatives must be developed. Step six,<br />
320
Strategic Planning for Digital Convergence in South African Businesses<br />
‘detailed planning’ expanded on the alternatives that were accepted in the<br />
approval step and received three mentions. Step seven was responsible for<br />
‘implementation’; it received five mentions and was also termed ‘rollout’ or<br />
‘implementation analysis’. This step implemented the solution in a working<br />
environment. The ‘post-implementation’ issues were part <strong>of</strong> step eight.<br />
In summary the initial steps <strong>of</strong> the extended model differ from<br />
Green’s model; the analysis steps remain similar while the post-analysis<br />
steps differ. The additional steps at the beginning were the ‘SWOT’ analysis,<br />
development <strong>of</strong> a business case and project definition and mandate. The<br />
steps added at the end included a pro<strong>of</strong> <strong>of</strong> concept, testing, implementation<br />
and post-implementation. The need for improved implementation <strong>of</strong> strategic<br />
IS plans has been emphasised in both empirical and prescriptive studies. The<br />
poor implementation <strong>of</strong> strategic plans has been cited as one <strong>of</strong> the causes <strong>of</strong><br />
lack <strong>of</strong> investment in IS (Gottschalk 1999).<br />
Consideration <strong>of</strong> implementation issues is particularly important in a<br />
converged initiative where there is a lack <strong>of</strong> understanding and consensus<br />
around the definitions and benefits that can be leveraged, or indeed the<br />
barriers that may be encountered. Fuller & Swanson (1992) warn that<br />
especially when new technology is involved, implementation is likely to be<br />
problematic. Therefore any consideration <strong>of</strong> implementation during the<br />
planning process must be a positive factor in the eventual implementation <strong>of</strong><br />
these strategic plans.<br />
A close look at the anticipated benefits <strong>of</strong> convergence shows a<br />
focus on the costs and management <strong>of</strong> the network. It was not surprisingly to<br />
find an emphasis on costs saving that could be leveraged from a converged<br />
infrastructure. Reducing network management costs and lower operational<br />
costs were some <strong>of</strong> the benefits anticipated by organisations (Yankee Group<br />
2003; Wild 2006). Other benefits anticipated included ‘better customer<br />
service’ and ‘new applications’.<br />
There is no single convergence benefit that was experienced widely<br />
across organisations with the highest-ranking benefits being selected by<br />
most, three organisations. This was an unexpected finding as there was an<br />
expectation that at least some <strong>of</strong> the benefits identified would be<br />
experienced by a greater number <strong>of</strong> organisations. Another surprising<br />
finding was that the ‘lower cost <strong>of</strong> network management’ was not being<br />
experienced by the majority <strong>of</strong> organisations, nor was the possibility <strong>of</strong><br />
321
Kiru J. Pillay & Manoj S. Maharaj<br />
‘easier network management’. The evidence for this point to the fact that the<br />
people intimately involved with convergence initiatives have a more prag-<br />
matic understanding <strong>of</strong> the benefits that can be leveraged.<br />
Figure 2: Extension <strong>of</strong> the planning model for convergence<br />
Names as referred<br />
to by respondents<br />
Feasibility Study<br />
Case Study<br />
Business Plan<br />
Position Paper<br />
Detail Costing<br />
Evaluate Alternatives<br />
Pilot Implementation<br />
Lab Test<br />
System Check<br />
322<br />
Revised Model<br />
Planning Steps for Convergence<br />
Objectives Business Plans SWOT<br />
( 1) Initiation<br />
(2) Approval<br />
(3) Financial Analysis<br />
(4) Technical Specification<br />
(5)<br />
Choose<br />
Plan<br />
(6) Document Plan<br />
(6) Pro<strong>of</strong> <strong>of</strong> Concept<br />
(6) Testing<br />
(7) Implementation<br />
(8) Post-Implementation
Strategic Planning for Digital Convergence in South African Businesses<br />
Research Question Three: Discussion and Interpretation <strong>of</strong><br />
Findings<br />
Benefits Anticipated vs. Benefits Experienced<br />
This section presents the findings with respect to the benefits anticipated and<br />
benefits experienced.<br />
Figure 3: Benefits anticipated versus Benefits experienced<br />
Legend<br />
(Ben1) Lower-cost network management<br />
(Ben2) Reduced network tariffs / service costs<br />
(Ben3) Easier network management<br />
(Ben4) Better customer service<br />
(Ben5) Better quality <strong>of</strong> communications<br />
(Ben6) Increased employee productivity<br />
(Ben7) New applications e.g. video training<br />
(Ben8) Centralisation <strong>of</strong> telephony services / reductions in PBX’s<br />
(Ben9) Improved teamwork<br />
(Ben10) Deployment costs<br />
There is a wide disparity between the benefits anticipated and those<br />
that were actually experienced with none <strong>of</strong> the benefits anticipated being<br />
experienced to the same extent upon implementation. The expectation that<br />
converged networks would be easier to manage and would provide some<br />
323
Kiru J. Pillay & Manoj S. Maharaj<br />
cost savings did not materialise. This expectation is consistent with the<br />
literature with the Yankee Group (2003) stating that organisations<br />
implementing converged infrastructures generally expect lower operational<br />
costs. The benefits <strong>of</strong> ‘improved teamwork’ and ‘increased productivity’<br />
were also only realised in one organisation although they were planned for<br />
in three and four organisations respectively. It is possible that current<br />
planning systems are focused on traditional IT planning which may not be in<br />
sync with what is needed for convergence initiatives. Kaluza et al. (1999)<br />
writes that convergence significantly alters the way business is done making<br />
traditional concepts <strong>of</strong> strategic management obsolete; rather it requires<br />
innovative approaches in order to gain and sustain competitive advantage in<br />
the increasing fluid environment <strong>of</strong> converging industries.<br />
The main barriers anticipated dealt with the financial implications <strong>of</strong><br />
rolling out convergence infrastructure and the biggest barrier, which was<br />
selected by seven organisations, was ‘price <strong>of</strong> equipment/technology’. The<br />
next biggest anticipated barriers were ‘implementation costs’ and ‘awareness<br />
and understanding’. It is not surprising to see ‘awareness and understanding’<br />
listed as a barrier as this is supported by the literature which highlights the<br />
lack <strong>of</strong> definition and understanding <strong>of</strong> convergence (Kaluza et al. 1992).<br />
One surprising findings was that the barrier ‘regulatory landscape’ received<br />
only one selection. It was expected that this would be most pertinent to<br />
organisations than indicated. Concerns over privacy’ received no mentions.<br />
This was also a surprising finding. The discussion around the right<br />
to privacy is in the public domain, even more so since the adoption <strong>of</strong> many<br />
laws post 9/11. It is possible that even while rights to privacy are very much<br />
on people’s mind the connection between convergence (which has only<br />
recently permeated the broader media) and rights to privacy has not been<br />
made.<br />
The barrier which was most experienced by the sample under study,<br />
and which received six mentions was ‘implementation costs’. At present the<br />
costs <strong>of</strong> converged infrastructure is not competitive and this will probably<br />
prevent large-scale adoption until costs drop (Economist Intelligence Unit<br />
2004). The next most experienced barrier was the ‘disruption to business’<br />
during the deployment phase, which was experienced by five organisations.<br />
324
Strategic Planning for Digital Convergence in South African Businesses<br />
Figure 4: Barriers anticipated versus Barriers experienced<br />
Legend<br />
(Bar 1) Doubts about security<br />
(Bar 2) Implementation costs<br />
(Bar 3) Lack <strong>of</strong> a compelling business case<br />
(Bar 4) Concern over quality <strong>of</strong> voice communications<br />
(Bar 5) Awareness and understanding<br />
(Bar 6) Price <strong>of</strong> equipment / technology<br />
(Bar 7) Lack <strong>of</strong> consensus within organisation<br />
(Bar 8) Concern over implications <strong>of</strong> single network ‘putting eggs in 1 basket’<br />
(Bar 9) Timescales for Return on Investment<br />
(Bar 10) Concerns over privacy<br />
(Bar 11) Disruption <strong>of</strong> business while converting<br />
(Bar 12) Satisfaction with present system<br />
(Bar 13) Regulatory landscape<br />
‘Awareness and understanding’ was selected as a barrier<br />
experienced by four organisations. There is much confusion and a lack <strong>of</strong><br />
awareness over convergence exacerbated by the different definitions<br />
assigned to convergence by different authors; a clear definition <strong>of</strong><br />
325
Kiru J. Pillay & Manoj S. Maharaj<br />
convergence that satisfies all industry sectors does not exist with actors in<br />
the media sector viewing convergence differently from actors in the<br />
telecommunications sector (Kaluza et al. 1992). This lack <strong>of</strong> understanding<br />
is a major barrier to achieving convergence. The allied barriers <strong>of</strong> ‘lack <strong>of</strong><br />
consensus within organisation’ and ‘lack <strong>of</strong> a compelling business case’<br />
allude to problems with the objectives (or lack there<strong>of</strong>) that are being<br />
planned for convergence projects. It could also relate to a lack <strong>of</strong><br />
communication within the organisation or even to a deeper planning malaise.<br />
If the convergence initiatives do not have consensus within the organisation<br />
it could be that either the initiative has not been thought through properly –<br />
no exhaustive investigation into current situation and future objectives, or it<br />
could be that the objectives have not been communicated effectively from<br />
higher-level planning hierarchies.<br />
There was a more equitable match between barriers anticipated and<br />
those actually experienced. Barriers to the implementation <strong>of</strong> strategic plans<br />
may have roots in the planning process and may include the fact that the plan<br />
was not sufficiently useful and it did not fit the organisation. Some barriers<br />
were experienced to a greater extent than anticipated e.g. ‘implementation<br />
costs’ and ‘disruption <strong>of</strong> business while converting’. The cost <strong>of</strong><br />
implementation was a barrier that was anticipated by five organisations and<br />
experienced by six organisations. This shows that organisations have a good<br />
idea <strong>of</strong> the high cost currently involved in convergence projects. Some<br />
barriers were anticipated to a greater extent than experienced including ‘lack<br />
<strong>of</strong> a compelling business case’ and ‘awareness and understanding’. The<br />
‘awareness and understanding’ <strong>of</strong> convergence was anticipated by five<br />
organisations and experienced by four. Steinmuller (2000) and Stieglitz<br />
(2003) write that it is vitally important to have a clear definition <strong>of</strong><br />
convergence with many commentators indicating the lack <strong>of</strong> a clear<br />
definition <strong>of</strong> convergence (Kaluza et al. 1999). Some barriers were<br />
anticipated and expected to the same extent. Voice quality and security<br />
concerns were still very important to organisations when considering<br />
deploying converged infrastructures (Economist Intelligence Unit 2004).<br />
The ‘lack <strong>of</strong> consensus within organisation’ and the allied barrier <strong>of</strong> ‘lack <strong>of</strong><br />
a compelling business case’ can be addressed by the planning process and<br />
the planning steps for convergence.<br />
326
Strategic Planning for Digital Convergence in South African Businesses<br />
‘Regulatory landscape’ received one mention, which is surprising in<br />
light <strong>of</strong> the literature. Convergence has not progressed at the speed at which<br />
it was previously thought, largely due to a number <strong>of</strong> technological, market<br />
regulatory and consumer barriers. For the potential <strong>of</strong> convergence to be<br />
realised and the backbone <strong>of</strong> an effective digital economy to be developed an<br />
entirely new approach will need to be adopted – one that is more reflective<br />
<strong>of</strong> the information era and which will enable the development <strong>of</strong> the<br />
information infrastructure needed to underpin a modern network economy<br />
(Gillwald 2003). Addressing convergence through appropriate ICT policy<br />
and regulatory mechanisms is therefore important as part <strong>of</strong> the broader<br />
strategy to promote growth and position countries within regional and global<br />
information environments. Current restrictions regarding what types <strong>of</strong><br />
services can be carried on different infrastructures could make it difficult for<br />
operators to formulate unified strategies and may also prevent economies <strong>of</strong><br />
scale being optimised.<br />
Contribution <strong>of</strong> the Study<br />
The most important conceptual implications <strong>of</strong> this research relates to the<br />
identification <strong>of</strong> a planning pr<strong>of</strong>ile for the sample frame. The pr<strong>of</strong>ile gives<br />
an indication <strong>of</strong> current planning systems for convergence and highlights<br />
areas <strong>of</strong> weakness and areas <strong>of</strong> strengths within these systems. The study<br />
created a basis for further study into the relevance <strong>of</strong> the planning<br />
dimensions used for this study for convergence planning. Closely aligned to<br />
this is the identification <strong>of</strong> the actual steps <strong>of</strong> the strategic plan and the<br />
extension <strong>of</strong> current models. This study contributed to the understanding <strong>of</strong><br />
how strategic planning for convergence differs from these other planning<br />
models and provides a basis for developing a comprehensive strategic<br />
planning model for convergence.<br />
Delegates to the International Federation for Information Processing<br />
conference held in 1998 agreed that qualitative approaches to information<br />
systems research was finally gaining acceptance (Avison et al. 1999) This<br />
study presents a methodological approach through the use <strong>of</strong> primarily<br />
qualitative methods, combined with some quantitative methods.<br />
The practical side <strong>of</strong> the study relates to the increase in<br />
understanding <strong>of</strong> the planning process and the dimensions involved. It<br />
327
Kiru J. Pillay & Manoj S. Maharaj<br />
elucidates the dimensions and the types <strong>of</strong> questions that practitioners must<br />
address when planning strategically for convergence. The steps identified<br />
give a basis for practitioners to use in their own planning systems.<br />
Organisations must look at their current strategic planning processes<br />
objectively and decide if their planning system is adequate. This ongoing<br />
process <strong>of</strong> evaluation and refinement is called meta-planning and results in<br />
systems <strong>of</strong> planning that emerge through constant iteration. The metaplanning<br />
process is characterised by three inter-dependent processes <strong>of</strong><br />
analysis, design and evaluation. Analysis is the process <strong>of</strong> assessing both the<br />
organisational and environmental context to determine the ‘fit’ <strong>of</strong> the<br />
existing planning system with competitive planning needs. Design is the<br />
process <strong>of</strong> structuring the desired system <strong>of</strong> planning and formulating<br />
strategies for conversion <strong>of</strong> the existing planning system. Evaluation is the<br />
process <strong>of</strong> assessing the performance <strong>of</strong> the planning system.<br />
Conclusion<br />
The research set out to answer three questions. With respect to the planning<br />
process the research revealed that the organisations under study did not<br />
adopt a formal approach to planning, and at best relied on a semi-formal<br />
approach. Most planning took place as part <strong>of</strong> a continuing planning cycle<br />
and there was a wide breadth <strong>of</strong> involvement at all management levels in the<br />
strategic management process with most organisations indicating active<br />
involvement from their senior IT management. The primary focus <strong>of</strong><br />
strategic planning for convergence was the controlling <strong>of</strong> costs through the<br />
diffusion <strong>of</strong> assets across the organisation. The planning process for<br />
convergence followed a ‘top-down’ approach with senior management<br />
responsible for endorsing and initiating the strategic planning process and<br />
lower-level managers responsible for the implementation <strong>of</strong> these plans. The<br />
majority <strong>of</strong> organisations did not delay the planning process until all<br />
decisions had been evaluated but rather were content to ‘satisfice’ – i.e.<br />
choosing a solution that works rather than optimising the evaluation process.<br />
The planning pr<strong>of</strong>ile <strong>of</strong> the organisations investigated can be summarised as:<br />
relatively informal and non-comprehensive planning with a medium<br />
magnitude <strong>of</strong> control, but with a high top-down orientation and high levels<br />
<strong>of</strong> participation and consistency.<br />
328
Strategic Planning for Digital Convergence in South African Businesses<br />
The planning steps for convergence revealed that the majority <strong>of</strong><br />
organisations do follow a step-by-step approach. All organisations made<br />
deliberate attempts to identify the benefits <strong>of</strong> and barriers to their<br />
convergence initiatives. The majority <strong>of</strong> organisations do consider<br />
implementation issues during their strategic planning steps with a high<br />
proportion taking into account the allocation <strong>of</strong> resources. An expansion <strong>of</strong> a<br />
current model was proposed with additional steps extrapolated from the<br />
research findings and the literature review.<br />
The investigation into the benefits and barriers anticipated and<br />
experienced revealed a disparity between what was anticipated and what was<br />
eventually experienced. This disparity was more pr<strong>of</strong>ound with regards to<br />
the benefits, with the barriers showing a better correlation between what was<br />
anticipated and what was actually experienced. There was a clear<br />
expectation <strong>of</strong> reduction in costs that were not necessarily realised within<br />
the sample frame under study. The barriers that were anticipated also related<br />
to costs in respect <strong>of</strong> equipment and implementation. This study has <strong>of</strong>fered:<br />
• An assessment <strong>of</strong> the state <strong>of</strong> the convergence planning process in<br />
South African organisations<br />
• An enhanced model for convergence planning<br />
• An understanding <strong>of</strong> the benefits and barriers <strong>of</strong> convergence<br />
initiatives both anticipated and experienced.<br />
References<br />
Avison D, F Lau, M Myers & PA Nielsen 1999. Action Research.<br />
Communications <strong>of</strong> the ACM 42,1: 94-97.<br />
Bohlin E 2000. Convergence in Communications and Beyond: An<br />
Introduction. In Bohlin E, K Brodin, A Lundgren & B Thorngren (eds):<br />
Convergence in Communications and Beyond. Amsterdam: North<br />
Holland.<br />
Boonstra A 2003. Structure and Analysis <strong>of</strong> IS Decision-making Process.<br />
European <strong>Journal</strong> <strong>of</strong> Information Systems 12: 195-209.<br />
Braman S 1993. Harmonization <strong>of</strong> Systems: The Third Stage <strong>of</strong> the<br />
Information Society. <strong>Journal</strong> <strong>of</strong> Communication 43,3: 133-140.<br />
329
Kiru J. Pillay & Manoj S. Maharaj<br />
Budde P 2008. South Africa – Convergence – VoIP, NGN and Digital<br />
Media. Paul Budde Communications Pty Ltd.<br />
Chakravarthy BS 1987. On Tailoring a Strategic Planning System to its<br />
Context: Some Empirical Evidence. Strategic Management <strong>Journal</strong> 8,3:<br />
517-534.<br />
Chatterjee S & J Byun 2002. Network Convergence: Where is the Value?<br />
Communications <strong>of</strong> the Association for Information Systems 9: 421 -<br />
440.<br />
Cohen JF 2003. Chapter 16 - Explaining Information Systems Strategic<br />
Planning (ISSP) Behavior: An Empirical Study <strong>of</strong> the Effects <strong>of</strong> the Role<br />
<strong>of</strong> IS on ISSP. In Kangas, K (ed): Business Strategies for Information<br />
Technology Management. Hershey, USA: IRM Press.<br />
Denzin NK & YS Lincoln 1994. Handbook <strong>of</strong> Qualitative Research.<br />
Thousand Oaks: Sage. ECA 2005. Available at: http://www.info.<br />
gov.za/view/DownloadFileAction?id=88342.<br />
Economist Intelligence Unit 2004. Deploy or Delay? Converged Networks in<br />
the Enterprise. Available at: http://graphics.eiu.com/files/ad_pdfs/<br />
Agilent_Convergence_WP.pdf.<br />
Enns HG & SL Huff n.d. CIOs’ Power, Influence, and IS Strategy<br />
Implementation. Ontario: <strong>University</strong> <strong>of</strong> West Ontario. (Richard Ivey<br />
School <strong>of</strong> Business.)<br />
European Commission 1996. The Information Society. Luxembourg: Office<br />
for Official Publications <strong>of</strong> the European Communities.<br />
European Commission 1997. Green Paper on the Convergence <strong>of</strong> the<br />
Telecommunications, Media and Information Technology Sectors, and<br />
the Implications for Regulation. Towards an information society<br />
approach, COM (97) 623. European Commission. Brussels. Available<br />
at: http://ec.europa.eu/avpolicy/docs/library/legal/com/greenp_97_623_<br />
en.pdf.<br />
Galliers RD 1991. Choosing Appropriate Information Systems Research<br />
Approaches: A Revised Taxonomy. In Klein, HK, R Hirscheim & H-E<br />
Nissen (eds): Information Systems Research: Contemporary Approaches<br />
and Emergent Traditions. Amsterdam: Elsevier.<br />
Gartner Group 2002. Convergence: More than Voice Over IP. Gartner<br />
Symposium, U.S. Symposium/Itxpo, 6–11 October 2002. Orlando,<br />
Florida: Walt Disney World.<br />
330
Strategic Planning for Digital Convergence in South African Businesses<br />
Gillwald A 2003. National Convergence Policy in a Globalised World:<br />
Preparing South Africa for Next Generation Networks, Service and<br />
Regulation. Link Centre Policy Research Paper No. 4. Available at:<br />
http://link.wits.ac.za/papers/ag20030707.pdf.<br />
Godet M 2000. The Art <strong>of</strong> Scenarios and Strategic Planning: Tools and<br />
Pitfalls. Technological Forecasting and Social Change 65: 3-22.<br />
Gottschalk P 1999. Implementation <strong>of</strong> Formal Plans: The Case <strong>of</strong><br />
Information Technology Strategy. Long Range Planning 32,3: 362-372.<br />
Green JH 2001. The Irwin Handbook <strong>of</strong> Telecommunications. Berkshire:<br />
McGraw-Hill.<br />
Grundy T & D King 1992. Using Strategic Planning to Drive Strategic<br />
Change. Long Range Planning 25,1: 100-108.<br />
Hassan R 2000. The Space Economy <strong>of</strong> Convergence. The <strong>Journal</strong> <strong>of</strong><br />
Research into New Media Technologies 6,4: 18-35.<br />
Hukill M, R Ono & C Vallath 2000. Electronic Communication<br />
Convergence. London: Sage Publications.<br />
Hussey J & R Hussey 1997. Business Research: A Practical Guide for<br />
Undergraduate and Postgraduate Students. New York: Palgrave.<br />
ITU 2007. International Telecommunications Union. Basic Information –<br />
Frequently Asked Questions. Available at: http://www.itu.int/osg/spu/<br />
wsis-themes/Vision/Vision.html.<br />
Janis IL & L Mann 1977. Decision-Making. New York: Free Press.<br />
Kaluza B, T Blecker & C Bisch<strong>of</strong> 1999. Implications <strong>of</strong> Digital<br />
Convergence on Strategic Management. In Dahiya, SB (ed): The<br />
Current State <strong>of</strong> Economic Science. Volume 4. Rohtak: Spellbound.<br />
Katz, RL 1987. The Information Society: An International Perspective. New<br />
York: Praeger.<br />
Lederer AL & H Salmela 1996. Towards a Theory <strong>of</strong> Strategic Information<br />
System Planning. <strong>Journal</strong> <strong>of</strong> Strategic Information System Planning 5:<br />
237-253.<br />
Lederer AL & V Sethi 1996. Key Prescriptions for Strategic Information<br />
Systems Planning. <strong>Journal</strong> <strong>of</strong> Management Information Systems 13,2:<br />
35-62.<br />
Martin A 2003. What Drives the Configuration <strong>of</strong> Information Technology<br />
Projects? Exploratory Research in 10 Organisations. <strong>Journal</strong> <strong>of</strong><br />
Information Technology 18: 1-15.<br />
331
Kiru J. Pillay & Manoj S. Maharaj<br />
Melody WH, E Sutherland & R Tadayoni 2005. Convergence, IP Telephony<br />
and Telecom Regulation: Challenges & Opportunities for Network<br />
Development, with Particular Reference to India. Telecommunication<br />
Regulatory Authority <strong>of</strong> India (TRAI). New Delhi.<br />
Mintzberg H 1978. Patterns in Strategy Formulation. Management Science<br />
24,9: 934-948.<br />
Mintzberg H 1994. The Rise and Fall <strong>of</strong> Strategic Planning. Harvard<br />
Business Review January-February.<br />
MoC 2003. Minister <strong>of</strong> Communications Convergence Colloquium.<br />
Available at: http://www.polity.org.za/article/matsepecasaburri-conver<br />
gence-colloquium-15072003-2003-07-15.<br />
NCCP 2003. National Colloquium on Convergence Policy. Available Online<br />
at: www.info.gov.za/view/DownloadFileAction?id=70184.<br />
NSBA 1996. The National Small Business Act. Available at: http://www.<br />
info.gov.za/view/DownloadFileAction?id=70848.<br />
Ramanujam V, N Venkatraman & JC Camillus 1986. Multi-objective<br />
Assessment <strong>of</strong> Effectiveness <strong>of</strong> Strategic Planning: A Discriminant<br />
Analysis Approach. Academy <strong>of</strong> Management <strong>Journal</strong> 29,2: 347-371.<br />
Rosenberg NS 1963. Technological Change in the Machine Tool Industry:<br />
1840 – 1910. <strong>Journal</strong> <strong>of</strong> Economic History 23,4: 414-443.<br />
Sabherwal R & WR King 1995. An Empirical Taxonomy <strong>of</strong> the Decisionmaking<br />
Processes Concerning Strategic Applications <strong>of</strong> Information<br />
Systems, <strong>Journal</strong> <strong>of</strong> Management Information Systems 11,1: 177 - 214.<br />
Segars AH & V Grover 1999. Pr<strong>of</strong>iles <strong>of</strong> Strategic Information Systems<br />
Planning. Information Systems Research 10,3: 199-232.<br />
Segars AH, V Grover & JTC Teng 1998. Strategic Information Systems<br />
Planning: Planning System Dimensions, Internal Coalignment, and<br />
Implications for Planning Effectiveness. Decision Sciences 29,2: 303-<br />
345.<br />
Simpson DG 1998. Why Most Strategic Planning is a Waste <strong>of</strong> Time and<br />
What you can do about it. Long Range Planning 31,3: 476-480.<br />
Srivastava JV & M Finger 2006. Fixed to Mobile Convergence (FMC):<br />
Technological Convergence and the Restructuring <strong>of</strong> the European<br />
Telecommunications Industry. SPRU 40th Anniversary Conference.<br />
Brighton, UK, September 11-13, 2006.<br />
332
Strategic Planning for Digital Convergence in South African Businesses<br />
Steinmueller WE 2000. Paths to Convergence: The Roles <strong>of</strong> Popularization,<br />
Virtualization and Intermediation. In Bohlin, E, K Brodin, A Lundgren<br />
& B Thorngren (eds): Convergence in Communications and Beyond.<br />
Amsterdam: North Holland.<br />
Stieglitz N 2003. Digital Dynamics and Types <strong>of</strong> Industry Convergence: The<br />
Evolution <strong>of</strong> the Handheld Computers Market in the 1990s and Beyond.<br />
In Bohlin, E, K Brodin, A Lundgren & B Thorngren (eds): The<br />
Industrial Dynamics <strong>of</strong> the New Digital Economy. Cheltenham: Edward<br />
Elgar Publishing.<br />
Webster F 1994. What Information Society? Information Society 10,1:1-23.<br />
Wild K 2006. The Importance <strong>of</strong> Convergence in the ICT Policy<br />
Environment. Association for Progressive Communication - APC Issue<br />
Papers Series 2006, October 2006.<br />
Wilson T 1991. Overcoming the Barriers to the Implementation <strong>of</strong><br />
Information System Strategies. <strong>Journal</strong> <strong>of</strong> Information Technology<br />
1991,6: 39-44.<br />
World Economic Forum 2008. The Global Information Technology Report<br />
2008-2009: Mobility in a Networked World. Available at: http://www<br />
.insead.edu/v1/gitr/wef/main/fullreport/index.html.<br />
Yankee Group 2003. South African Communications Market Study, prepared<br />
for the Department <strong>of</strong> Communications, South Africa.<br />
333<br />
Kiru J Pillay<br />
School <strong>of</strong> IS&T<br />
<strong>University</strong> <strong>of</strong> <strong>KwaZulu</strong>-<strong>Natal</strong><br />
Durban, South Africa<br />
kiru2010@gmail.com<br />
Manoj S. Maharaj<br />
School <strong>of</strong> IS&T<br />
<strong>University</strong> <strong>of</strong> <strong>KwaZulu</strong>-<strong>Natal</strong><br />
Durban, South Africa<br />
Maharajms@ukzn.ac.za
Using Mobile Technologies for<br />
eBusiness Infrastructure in<br />
Kenyan Rural Micro and Small Enterprises:<br />
Hype or Opportunity?<br />
Patrick Kanyi Wamuyu<br />
Manoj S. Maharaj<br />
Abstract<br />
The number <strong>of</strong> mobile telephone subscribers has grown steadily (CCK 2009)<br />
since the liberalization <strong>of</strong> the Kenyan telecommunications sub-sector<br />
through the 1997 Communications Act (KCA 2008). This has seen increased<br />
Mobile technologies penetration in the rural areas. Mobile telephones are the<br />
first telecommunications infrastructure in most Kenyan rural enterprises. As<br />
has been seen in the case <strong>of</strong> Bangladesh (Lawson C & N Meyenn 2000), this<br />
has contributed to development through employment creation, access to<br />
services and increased access to information. With such a massive<br />
acceptance, mobile technologies create opportunities for Micro and Small<br />
Enterprises (MSEs) in rural areas to deploy an eBusiness infrastructure.<br />
These technologies also present a unique opportunity for Medium and Small<br />
Enterprises (MSEs) to overcome their institutional impediments to Internet<br />
access and e-payments by providing new services and technical capabilities<br />
such as effective and highly available voice communication, Internet access<br />
and e-payments transactions. Availability <strong>of</strong> these technologies is only an<br />
enabling factor. To positively impact an organization’s performance, mobile<br />
technologies must appropriately match its eBusiness infrastructure<br />
requirements. However, appropriateness alone does not guarantee use. User<br />
acceptance is critical to successful implementation <strong>of</strong> any new technology.<br />
This study extends Task-Technology Fit (TTF) theory to incorporate<br />
acceptance as a factor that could influence the use <strong>of</strong> Wireless eBusiness<br />
<strong>Alternation</strong> Special Edition 4 (2011) 334 – 349<br />
ISSN 1023-1757<br />
334
eBusiness Infrastructure in Kenyan Rural Enterprises<br />
infrastructure. The proposed model was empirically tested using<br />
questionnaire responses from MSEs in the rural town <strong>of</strong> Nanyuki. The<br />
findings from the study suggest that appropriateness and acceptance do<br />
influence the use <strong>of</strong> wireless technologies to implement eBusiness<br />
infrastructure and that using wireless technologies to implement eBusiness<br />
infrastructure positively and significantly influences an organization’s<br />
performance. It also found that affordability and risk factors have a<br />
moderating effect on the use <strong>of</strong> wireless eBusiness infrastructure.<br />
Consequently, the final modified model referred to as the ‘Suitability <strong>of</strong><br />
Wireless eBusiness Infrastructure’ (SWeBI) model has the power to explain<br />
use <strong>of</strong> wireless technologies to implement eBusiness infrastructure and<br />
could help practitioners to take efficient measures to improve its use in<br />
Kenyan rural MSEs.<br />
Keywords: Wireless Technologies, eBusiness, Task-Technology Fit, Micro<br />
and Small Enterprises, user acceptance.<br />
Introduction<br />
There is no doubt that the explosive growth <strong>of</strong> cellular networks has an<br />
enormous impact on the livelihood <strong>of</strong> many Kenyans. Mobile telephones<br />
represent the first telecommunications infrastructure in most Kenyan rural<br />
homes and enterprises. Statistics show that mobile network coverage is<br />
predominantly urban with data from the Communications Commission <strong>of</strong><br />
Kenya (CCK 2009) indicating that cellular networks have a national<br />
coverage <strong>of</strong> about 84% <strong>of</strong> the population but only about 33% <strong>of</strong> geographic<br />
coverage. This may require government intervention in expansion <strong>of</strong> the<br />
cellular networks to underserved areas that are usually regarded as not<br />
commercially pr<strong>of</strong>itable by service providers. Kenya is predominantly an<br />
agricultural country. The efficiency <strong>of</strong> the economy will be enhanced should<br />
farmers being able to efficiently communicate with their prospective buyers.<br />
Availing cellular networks to the farmers could easily transform the way<br />
they market their agricultural produce.<br />
While mobile telephones traditionally mainly <strong>of</strong>fer just voice<br />
communication the introduction <strong>of</strong> value added services such as mobile<br />
payments, mobile banking, Internet and data access could enhance the way<br />
335
Patrick Kanyi Wamayu & Manoj S. Maharaj<br />
business is conducted and at the same time create new business<br />
opportunities. Mobile telephones and related services have created new<br />
livelihoods through creation <strong>of</strong> pr<strong>of</strong>essional and non-pr<strong>of</strong>essional jobs.<br />
Problem Statement, Objectives and Research Questions<br />
Most <strong>of</strong> the Kenyan population live in rural and remote areas and only a<br />
small fraction <strong>of</strong> these had access to telephones before the cellular network<br />
coverage was expanded there. Today, most rural areas have mobile<br />
telephone networks which come with a number <strong>of</strong> developmental benefits in<br />
terms <strong>of</strong> employment creation, access to services and increased access to<br />
information, hence contributing significantly to economic growth. This<br />
research has been motivated by the significant benefits mobile telephones<br />
have brought to disparate and geographically remote population in Kenya<br />
and seeks to explore how this expanding mobile phone infrastructure can be<br />
harnessed to support an enterprise-wide eBusiness infrastructure and benefit<br />
MSEs by facilitating use <strong>of</strong> eBusiness applications. The aim <strong>of</strong> this study is<br />
to determine the appropriateness <strong>of</strong> wireless technologies for implementing<br />
an eBusiness infrastructure in MSEs by evaluating whether the wireless<br />
technologies meet MSEs’ eBusiness infrastructure requirements. The<br />
following research questions guided the study:<br />
1. Does the extended Task-Technology Fit describe the utilisation <strong>of</strong><br />
wireless technologies in implementing an eBusiness infrastructure?<br />
2. Does utilisation <strong>of</strong> wireless technology in implementing an<br />
eBusiness infrastructure result in higher MSE performance?<br />
3. What are the drivers and barriers to utilising wireless technologies to<br />
implement an eBusiness infrastructure in Kenyan MSEs?<br />
Literature Review<br />
The literature review covers three components <strong>of</strong> this study. The first section<br />
presents the scope <strong>of</strong> mobile technologies in the study, the second section<br />
presents a discussion on the theories applied in this study while the final<br />
section gives an overview <strong>of</strong> MSEs in Kenya and a review <strong>of</strong> the direction<br />
the research in use <strong>of</strong> Information and Communications Technologies (ICTs)<br />
in Kenyan MSEs has taken over the last few years.<br />
336
eBusiness Infrastructure in Kenyan Rural Enterprises<br />
Wireless Technologies<br />
Mobile telephones are mostly used for voice communications, short message<br />
services and personal information management using calendars, reminders,<br />
scheduling, etc. The capacity to <strong>of</strong>fer additional advanced services such as<br />
money transfers, accessing bank accounts, and paying bills, receiving special<br />
promotions and stock quotes, Internet access as well as initiating purchase or<br />
sales transactions has increased the level <strong>of</strong> mobile telephone usage over the<br />
last few years.<br />
M-Payment is the transfer <strong>of</strong> money using mobile devices such as a<br />
mobile telephone to make payments for goods and services. The services <strong>of</strong><br />
mobile payments are <strong>of</strong>fered through Safaricom’s (M-Pesa 2009) M-Pesa<br />
services and Zain’s (Zap 2009) Zap services. Wireless Local Area Networks<br />
(WLANs) allow users to transmit and receive data within a range <strong>of</strong> 30-50<br />
meters. Most organizations are using WLAN due to its flexibility,<br />
convenience and increased reliability. With the absence <strong>of</strong> cables, there is<br />
increased mobility, reduced installation time and cost savings when<br />
performing installation in difficult-to-wire areas. Bluetooth is also used to<br />
connect devices autonomously in a relatively small area within a radius <strong>of</strong><br />
ten meters within personal workspaces. WLAN and Bluetooth allow<br />
enterprise information to be quickly accessed and transmitted within the<br />
enterprises hence increased productivity.<br />
Wireless Metropolitan Networks (WMANs) provide mobile<br />
broadband wireless access network that meets the needs <strong>of</strong> business within a<br />
ity. In Kenya the use <strong>of</strong> Worldwide Interoperability for Microwave Access<br />
(WiMAX) technology to provide ubiquitous broadband access for wireless<br />
data, voice and video services is now common in major towns and cities.<br />
The wireless network is accessed through mobile devices such as telephones<br />
and PDAs, and desktop systems connected to a wireless Internet access<br />
device such as a fixed wireless desktop telephone or a wireless data modem.<br />
There is also use <strong>of</strong> mobile technologies such as the HealthTrack!<br />
(2009), and Open Data Kit (2009) in the Kenyan health services for data<br />
collection purposes. Such tools could be useful to the MSEs’ traders as they<br />
distribute their products in the rural areas to collect and manage data<br />
pertaining to their sales, deliveries and future orders while monitoring their<br />
stocks back at their stores.<br />
337
Patrick Kanyi Wamayu & Manoj S. Maharaj<br />
Task-Technology Fit<br />
As with any choice and implementation <strong>of</strong> technology, the question <strong>of</strong><br />
choosing the right technology at the right time is always pertinent. The main<br />
aim <strong>of</strong> the Task-Technology Fit model by Goodhue and Thompson (1995) is<br />
to match the capabilities <strong>of</strong> the technology to the demands <strong>of</strong> the particular<br />
task. It is the degree to which features <strong>of</strong> a technology match the<br />
requirements <strong>of</strong> the task and the abilities <strong>of</strong> the individuals involved with the<br />
task. Goodhue and Thompson (1995) specified the TTF construct as<br />
consisting <strong>of</strong> the following variables: data quality, locatability <strong>of</strong> data,<br />
authorization to access data, data compatibility between systems, training<br />
and ease <strong>of</strong> use, production timeliness, systems reliability, and information<br />
systems relationship with the user.<br />
Task Technology Fit is the relationship between task requirements,<br />
technology functionality, technology experiences and task knowledge<br />
(Benford & Hunton 2000). Benslimane, Plaisant & Bernard (2002) validated<br />
TTF on web-based procurement from corporate buyers from organisations<br />
operating in various industries in Canada. They concluded that a better fit<br />
between the tasks required during the procurement process and Internet<br />
websites’ functionalities leads to a higher level <strong>of</strong> web usage, which then<br />
leads to an improved performance for users. Gagnon et al., (2004) validated<br />
TTF and found reasonably good fit between the task and individuals<br />
utilizing the administrative support systems in a university setting. D’Ambra<br />
and Wilson (2004) introduced an uncertainty factor in the TTF to investigate<br />
the adoption <strong>of</strong> the World Wide Web for international travel. Staples and<br />
Seddon (2004) found out that TTF could explain performance in both<br />
mandatory and voluntary use. Norzaidi and Intan Salwani (2008) carried out<br />
a study to test whether TTF predicts Intranet usage in Malaysia and found<br />
that TTF could significantly predict usage if task and technology were<br />
matched.<br />
This study aims to test the fit between wireless technologies and<br />
eBusiness infrastructure within MSEs. To the knowledge <strong>of</strong> the researcher<br />
TTF has not been validated in the context <strong>of</strong> IT adoption in Kenya and<br />
proposes that the model may be suitable for investigating the<br />
appropriateness <strong>of</strong> wireless technologies in implementing an eBusiness<br />
infrastructure in Kenyan MSEs.<br />
338
eBusiness Infrastructure in Kenyan Rural Enterprises<br />
Technology Acceptance<br />
The Unified Theory <strong>of</strong> Acceptance and use <strong>of</strong> Technology (UTAUT)<br />
proposed by Venkatesh, Morris, Davis and Davis (2003) consolidates<br />
constructs from eight user acceptance models. Unlike other user acceptance<br />
models UTAUT takes into consideration the fact that some systems are<br />
mandatory and others are voluntary. UTAUT has four constructs. These are<br />
Performance Expectancy, Effort Expectancy, Social influence, and<br />
Facilitating conditions. The four constructs are independent variables<br />
influencing the dependent variables behavioural intention to use and usage.<br />
Gender, age, experience with the system and voluntariness <strong>of</strong> the system<br />
have indirect influence on the dependent variables through the four core<br />
constructs hence they have a moderating effect. UTAUT has an accuracy <strong>of</strong><br />
70% in predicting user acceptance <strong>of</strong> information technology innovations,<br />
Venkatesh et al., (2003), which all the previous models were not able to<br />
successfully do. This is why UTAUT is regarded a superior model. This<br />
paper extends the TTF model with UTAUT constructs.<br />
MSEs in Kenya<br />
In Kenya, MSEs are defined as those non-primary enterprises (excluding<br />
agricultural production, animal husbandry, fishing, hunting, gathering and<br />
forestry), whether in the formal or informal sector which employ 1-50<br />
people (ICED 1999). Micro-enterprises are those that employ 10 or fewer<br />
workers and small enterprises are those that employ 11-50 workers. The<br />
business activities <strong>of</strong> MSEs include manufacturing, trade and service<br />
provision. The National Baseline Survey (ICEG 1999) revealed that there<br />
were 1.3 million MSEs in Kenya by 1999 compared to 910,000 in 1993,<br />
reflecting a 7% increase per year. The survey also revealed that: 66% <strong>of</strong> the<br />
enterprises are located in rural areas. In terms <strong>of</strong> operations, the survey<br />
established that 13.4% <strong>of</strong> the enterprises are in manufacturing; 64.3% <strong>of</strong> the<br />
enterprises are engaged in trade while 14.8% <strong>of</strong> the enterprises are in<br />
services provision. In 1999, MSEs employed 2.4 million people (ICEG<br />
1999) compared to 7.9 million people in 2008 (Republic <strong>of</strong> Kenya 2009) are<br />
presented in figure 1 below. The 1999 MSEs contributed 18% to GDP<br />
(ICEG 1999) while the Economic Survey <strong>of</strong> 2003 (Republic <strong>of</strong> Kenya 2003)<br />
shows that the MSEs contributed 18.4% in the year 2002. This implies that,<br />
339
Patrick Kanyi Wamayu & Manoj S. Maharaj<br />
with the help <strong>of</strong> appropriate technologies and technical support services,<br />
MSEs can contribute immensely to the growth <strong>of</strong> the Kenyan economy.<br />
MSEs and Information and Communications Technology<br />
Research<br />
Research on mobile telephone use in MSEs includes a study on changes to<br />
social and business networks (Donner 2007). The status <strong>of</strong> e-commerce in<br />
Kenya has been studied by Mureithi (2000), Mulli (2004) and Kiiru (2002).<br />
The Kenya country e-preparedness report (Atac 2003) also highlights ICT<br />
access issues between late nineteen ninety’s and the year 2003. A further<br />
review <strong>of</strong> published literature on MSEs shows that, to date, a number <strong>of</strong><br />
studies conducted on MSEs focus on the sector’s contribution to the<br />
economy in terms <strong>of</strong> employment, income, and gross domestic product such<br />
as the National Baseline Survey (ICEG 1999). Other studies focus on access<br />
to credit (Aketon 2007), and government policy and strategy frameworks<br />
(ACEG 2006; Ronge et al. 2002). Most <strong>of</strong> the current research focuses on<br />
ICT access and usage. There has been no known research, to the knowledge<br />
<strong>of</strong> the researcher, which has studied the use and impact <strong>of</strong> wireless networks<br />
on e-business usage in Kenya. This study seeks to address this research gap.<br />
Research Methodology<br />
The research model used to guide the study is shown in figure 1. This model<br />
is grounded in the streams <strong>of</strong> research focusing on Task-Technology Fit and<br />
Technology Acceptance drawn from a literature review to provide a richer<br />
understanding <strong>of</strong> the appropriateness, acceptance utilisation and<br />
performance impacts <strong>of</strong> using wireless technologies in implementing an<br />
eBusiness infrastructure in Kenyan rural MSEs. This model was designed to<br />
incorporate the essential measures to test appropriateness and user<br />
acceptance as well as moderating variables from the preliminary study.<br />
Venkatesh, Morris, Davis and Davis (2003) adapted the measures <strong>of</strong><br />
appropriateness from the Task-Technology Fit model by Goodhue and<br />
Thompson (1995) while the measures for User Acceptance are from the<br />
Unified Theory <strong>of</strong> Acceptance and use <strong>of</strong> Technology (UTAUT) proposed.<br />
Utilization measures are usage <strong>of</strong> voice calls, text messages, m-payments, mbanking,<br />
data networks, Internet access and information management using<br />
340
eBusiness Infrastructure in Kenyan Rural Enterprises<br />
calendars and reminders. From the preliminary study, affordability and<br />
perceived risks had a moderating effect on use <strong>of</strong> mobile technologies.<br />
Performance impacts were measured through improved productivity,<br />
improved communication and coordination, reduced coordination costs and<br />
faster transactions.<br />
Figure 1: Research model<br />
Appropriateness<br />
Acceptance<br />
Perceived Risks<br />
Utilisation<br />
Moderators<br />
Each item in the model had a corresponding set <strong>of</strong> questions. The<br />
questionnaire was composed <strong>of</strong> thirty-five unambiguous questions that were<br />
easy for respondents to complete. Each item on the questionnaire was<br />
measured on a five-point Likert scale whose end points were ‘strongly<br />
agree’ (5) and ‘strongly disagree’ (1). A list is presented here as table 1.<br />
To test the research model, a survey was conducted using a<br />
questionnaire to gather the necessary information from Nanyuki town.<br />
Nanyuki town was purposely selected for this study because it has all the<br />
characteristics <strong>of</strong> a Kenyan rural town. Nanyuki is a town lying on the<br />
equator and North West <strong>of</strong> Mount Kenya. Climbers and backpackers <strong>of</strong>ten<br />
visit it on their way to or from Mount Kenya. Mount Kenya is the highest<br />
mountain in Kenya and the second highest in Africa (after Mount<br />
Kilimanjaro). Economic activities in the Nanyuki consist mainly <strong>of</strong> tourism,<br />
trade and agriculture (particularly in the horticulture and ranching). Other<br />
341<br />
Affordability<br />
Performance<br />
impacts
Patrick Kanyi Wamayu & Manoj S. Maharaj<br />
economic activities include small-scale industries in textile and food<br />
processing.<br />
Table 1: Constructs and their measures<br />
Model<br />
Construct<br />
(Items)<br />
Measures Adapted from<br />
Quality <strong>of</strong> data, locatability <strong>of</strong> data, TTF (Goodhue<br />
Appropriateness Ease <strong>of</strong> use, Training, Timeliness, and Thompson<br />
(10) System reliability, Relationship 1995)<br />
with users<br />
Mobility: employees can access Use context<br />
same services from any where (preliminary<br />
study)<br />
Acceptance Perceived usefulness, Social UTAUT<br />
(7) influence (Enabling Business (Venkatesh et al.<br />
Environment)<br />
2003)<br />
Moderators Risk factors, Cost factors Barriers to use<br />
(7) (Affordable prices) <strong>of</strong> using (preliminary<br />
wireless eBusiness infrastructure study)<br />
Utilization Use and frequency <strong>of</strong> using TTF (Goodhue<br />
(4) wireless technologies<br />
and<br />
1995)<br />
Thompson<br />
Performance Improved productivity and TTF (Goodhue<br />
impacts efficiency, reduced operation costs, and Thompson<br />
(4) improved communication and 1995)<br />
coordination, improve effectiveness<br />
Data Collection and Analysis<br />
The survey results were analysed using SPSS 15.0 for Windows ® and<br />
Micros<strong>of</strong>t Excel 2003 ® . MSEs in Kenya operate under similar conditions<br />
and have uniform characteristics. The questionnaire was administered to 60<br />
enterprises in Nanyuki town. 54 responses were received. After eliminating<br />
incomplete responses, 50 usable responses were selected as the sample, an<br />
342
eBusiness Infrastructure in Kenyan Rural Enterprises<br />
overall response rate <strong>of</strong> 83.33%. Such a good response rate was attributed to<br />
the ample response time given to the respondents to complete the<br />
questionnaire and the follow-up telephone calls made to the respondents in<br />
order to encourage their participation. Another contributing factor could be<br />
that most <strong>of</strong> the respondents are the owners or the managers <strong>of</strong> these<br />
enterprises.<br />
The following table gives the demographic breakdown <strong>of</strong><br />
respondents by gender, age, education and the roles <strong>of</strong> the respondents<br />
within the enterprises.<br />
Table 2: Demographic characteristics<br />
Overview <strong>of</strong> respondents Frequency Percentage<br />
Gender Male 32 69.57<br />
Female 14 30.43<br />
Age 18-24 14 30.43<br />
25-34 20 43.48<br />
35-44 6 13.04<br />
Education<br />
Level<br />
Role <strong>of</strong> the<br />
respondents<br />
45-54 6 13.04<br />
High School 2 4.35<br />
Diploma 12 26.09<br />
Pr<strong>of</strong>essional Course such as<br />
CPA<br />
6 13.04<br />
College certificate 8 17.39<br />
Undergraduate degree 16 34.78<br />
Postgraduate degree 2 4.35<br />
Managers 36 72<br />
Computer systems support<br />
staff<br />
8 16<br />
Sales 2 4<br />
Accountants 4 8<br />
Using mobile payments and mobile banking makes it easier to<br />
conduct business, and almost all enterprises in the study have used it. The<br />
number <strong>of</strong> enterprises using eBusiness applications is also relatively high,<br />
implying that the uptake <strong>of</strong> eBusiness applications in the rural Kenya is<br />
gaining acceptance. This could also be attributed to adequate infrastructure<br />
provided by wireless technologies, which has proved to be highly beneficial<br />
343
Patrick Kanyi Wamayu & Manoj S. Maharaj<br />
to the enterprises. Table 3 gives an overview <strong>of</strong> the use <strong>of</strong> mobile<br />
technologies in MSEs in Nanyuki as at 2009.<br />
Internal consistency is used to assess the consistency <strong>of</strong> results<br />
across items within a test. Cronbach’s Alpha is one <strong>of</strong> the most widely used<br />
diagnostic measures <strong>of</strong> internal consistency. Cronbach’s Alpha was<br />
calculated for the six core constructs and the results are presented in table 4.<br />
All the constructs exhibited a Cronbach’s alpha above the 0.7 acceptable<br />
levels as reported by Hair et al. (1998). The results show that the<br />
questionnaire was a reliable measurement instrument.<br />
Table 3: Use <strong>of</strong> wireless technologies<br />
Mobile Make calls and send messages (SMS) 100%<br />
phone to Checking and paying utility bills such as Water<br />
and Electricity bills<br />
42%<br />
M-banking (checking account balance, Bank SMS<br />
alerts and notifications)<br />
38%<br />
Receive SMS advertisements and promotional<br />
materials<br />
100%<br />
Send SMS advertisements and promotional<br />
materials<br />
10%<br />
Checking stock prices, alerts and quotations 74%<br />
Business information management using<br />
calendars, reminders, contacts and schedules<br />
96%<br />
Make mobile payments (M-Pesa or Zap) 64%<br />
Access internet 22%<br />
Wireless desktop phones to access the Internet (Telkom -<br />
CDMA)<br />
16%<br />
Wireless Modem to access internet 48%<br />
Wireless Broadband Internet Access – Safaricom 3G, Orange<br />
3G+ technologies<br />
12%<br />
Wi-Fi for Wireless Local Area Network 8%<br />
Bluetooth to connect devices 2%<br />
Table 4 shows that the research instrument was reliable, with each<br />
<strong>of</strong> the constructs achieving a Cronbach alpha measure greater than 0.8.<br />
344
Table 4: Reliability analysis<br />
Construct Reliability<br />
eBusiness Infrastructure in Kenyan Rural Enterprises<br />
(Cronbachs’s α)<br />
345<br />
Mean** St. Deviation<br />
Appropriateness 0.924 4.08 0.944<br />
User Acceptance 0.939 3.68 0.741<br />
Utilisation 0.812 4.36 0.563<br />
Affordability 0.953 3.62 1.107<br />
Perceived Risks 0.895 3.44 1.195<br />
Performance Impacts 0.952 4.24 0.657<br />
Answers to Research Questions<br />
The primary purpose <strong>of</strong> this study was to investigate the extent to which<br />
wireless technologies meet the eBusiness infrastructure requirements <strong>of</strong><br />
Kenyan rural MSEs. The outcome <strong>of</strong> the study highlights that<br />
appropriateness and user acceptance directly influences utilization <strong>of</strong><br />
wireless eBusiness infrastructure while utilization has a huge positive impact<br />
on performance <strong>of</strong> MSEs in rural areas. Wireless technologies consist <strong>of</strong><br />
data networks, cellular Internet and mobile payments. This provides the<br />
necessary infrastructure for eBusiness applications usage by allowing<br />
Internet access, mobile payments and ease access to enterprise data. The<br />
potential <strong>of</strong> wireless technologies to facilitate internal business process<br />
automation, procurement and supply chain management, marketing and sales<br />
processes management and e-commerce and customer relationship<br />
management, all, which require faster access to current and up-to-date<br />
information, is significant. The cost <strong>of</strong> using and maintaining the systems<br />
seems to be a key aspect <strong>of</strong> choosing to use wireless technologies to<br />
implement eBusiness infrastructure.<br />
The entrepreneurs also consider after-sales support as a major factor<br />
affecting the decision to continue using a particular vender’s service. When<br />
a new provider emerges and <strong>of</strong>fers the same services at a better price, greater<br />
quality coupled with efficient support and a faster response to down time,<br />
this provider wins over all the existing users. The entrepreneurs seem to be<br />
using the word <strong>of</strong> mouth to share their experiences in using a particular<br />
wireless technology and eventually influencing other users’ decision to use<br />
the technology.
Patrick Kanyi Wamayu & Manoj S. Maharaj<br />
Another major issue that seems to determine the use <strong>of</strong> wireless<br />
technology is access to information. There is lack <strong>of</strong> awareness on all the<br />
benefits <strong>of</strong> using wireless technology in implementing eBusiness<br />
infrastructure in some MSEs. Most entrepreneurs depend on corporate<br />
marketers to get information about the available wireless technology<br />
services. This leads to use <strong>of</strong> technology on bases <strong>of</strong> first (sales person)<br />
come, first served or on who is convincing well enough. These marketers do<br />
not necessarily assess the technological and organisational issues necessary<br />
in acceptance and usage <strong>of</strong> their products before recommending the<br />
application <strong>of</strong> a particular technology. Their main catch is on costs and not<br />
the quality <strong>of</strong> their services as they are familiar with the limited budget and<br />
resource allocation for information technology related investments within<br />
MSEs. This creates a need to have the government subsidise infrastructure<br />
rollout in areas regarded as not being commercially pr<strong>of</strong>itable by most<br />
service providers.<br />
Some MSEs considered affordability (cost <strong>of</strong> installation and daily<br />
usage) to moderate their use <strong>of</strong> wireless technologies while security and<br />
privacy risks are considered a priority while using wireless technologies.<br />
Conclusion<br />
The findings <strong>of</strong> the study demonstrate the suitability <strong>of</strong> wireless technologies<br />
to implement an eBusiness infrastructure in Kenyan Rural MSEs. MSEs in<br />
Kenyan rural areas are today using wireless technologies to implement<br />
eBusiness infrastructure leading to the existence <strong>of</strong> Smart MSEs. Smart<br />
MSEs manage their customer relationships, supply chains and core business<br />
operations using wireless technologies, making them more efficient,<br />
enhancing their productivity and improving on their internal and external<br />
communications.<br />
Efficiency due to mobility, reduced installation cost and time,<br />
increase in employee’s productivity and customer satisfaction are some <strong>of</strong><br />
the benefits MSEs are enjoying as a result <strong>of</strong> implementing eBusiness using<br />
wireless technologies. Also reduced connection costs, ease <strong>of</strong> installation<br />
and maintenance make wireless technologies an ideal choice in<br />
implementing eBusiness infrastructure for most rural MSEs. All these<br />
benefits have a positive direct effect on MSEs’ pr<strong>of</strong>itability and<br />
performance.<br />
346
eBusiness Infrastructure in Kenyan Rural Enterprises<br />
Using the research model developed in this study, the entrepreneurs<br />
can test any technology availed to them and decide on what bases to use the<br />
technology or not and establish which technology is suitable to be the<br />
enterprise’s IT infrastructure. Wireless technologies faithful usage increases<br />
user’s task performance when the technologies fit the required tasks and the<br />
user is sufficiently competent to use the technology. Wireless eBusiness<br />
infrastructure has increased competitiveness in most MSEs as they seek to<br />
improve how they operate in terms <strong>of</strong> quality <strong>of</strong> service, faster and cheaper<br />
transactions and efficiency. Wireless technologies have proved to be highly<br />
beneficial and have led to better organisational performance, hence they are<br />
not just hype but an opportunity for Kenyan rural MSEs to implement their<br />
eBusiness infrastructure<br />
References<br />
Atac O, R Badrinath 2003. E-Preparedness Report: Kenya. International<br />
Trade Centre UNCTAD/WTO, E-Trade Bridge Series.<br />
Akoten JE 2007. Breaking the Vicious Cycle <strong>of</strong> Poor Access to Credit by<br />
Micro and Small Enterprises in Kenya. Nairobi: Institute <strong>of</strong> Policy<br />
Analysis and Research (ipar), Discussion Paper No. 095/2007.<br />
Benford TL, JE Hunton 2000. Incorporating Information Technology<br />
Considerations into an Expanded Model <strong>of</strong> Judgment and Decision<br />
Making in Accounting. International <strong>Journal</strong> <strong>of</strong> Accounting Information<br />
Systems 1: 54-65.<br />
Benslimane Y, M Plaisent & P Bernard 2002. Applying the Task<br />
Technology Fit Model to WWW-based Procurement: Conceptualization<br />
and Measurement. Proceedings <strong>of</strong> the 36 th Hawaii International<br />
Conference on System Sciences. IEEE. The Computer Society.<br />
Communications Commission <strong>of</strong> Kenya 2009. Communications Statistics<br />
Report 2008. CCK, June 2009 Market Analysis Report.<br />
D’Ambria J & C Wilson 2004. Use <strong>of</strong> the World Wide Web for International<br />
Travel: Integrating the Construct <strong>of</strong> Uncertaininty in Information Seeking<br />
and Task-technology Fit (TTF) model. <strong>Journal</strong> <strong>of</strong> the American Society<br />
for Information Science and Technology 55,8: 731-742.<br />
Davis FD 1989. Perceived Usefulness, Perceived Ease <strong>of</strong> Use, and User<br />
Acceptance <strong>of</strong> Information Technology. MIS Quarterly September: 318-<br />
340.<br />
347
Patrick Kanyi Wamayu & Manoj S. Maharaj<br />
Dishaw MT & DM Strong 1998. Assessing S<strong>of</strong>tware Maintenance Tool<br />
Utilisation using Task-Technology Fit and Fitness-for-use Models.<br />
<strong>Journal</strong> <strong>of</strong> S<strong>of</strong>tware Maintenance: Research and Practice 10,3: 151-179.<br />
Donner J 2007. The Use <strong>of</strong> Mobile Telephones by Micro Entrepreneurs in<br />
Kigali Rwanda: Changes to Social and Business Networks.<br />
Massachusetts Institute <strong>of</strong> Technology: Information Technologies and<br />
International Development 3,2: 3-19.<br />
Gagnon E, RV McCarthy 2004. User Acceptance <strong>of</strong> Tactical Technology: An<br />
Evaluation <strong>of</strong> Administrative Support Systems within Higher Education.<br />
Issues in Information Systems V,2.<br />
Goodhue DL 1998. Development and Measurement <strong>of</strong> Validity <strong>of</strong> a Task-<br />
Technology Fit Instrument for User Evaluations <strong>of</strong> Information Systems.<br />
Decision Sciences 29,1: 105-138.<br />
Goodhue DL & RL Thompson 1995. Task-Technology Fit and Individual<br />
Performance. MIS Quarterly 19,2: 213-236.<br />
Hair JF, WC Black, BJ Babin, RF Anderson, & RL Tatham 2006.<br />
Multivariate Data Analysis. 6 th Edition. New Jersey: Prentice Hall.<br />
Healthtrack! 2009. Available at: http://www.pinnaclekenya.com.<br />
International Centre for Economic Growth 1999. National Micro and Small<br />
Enterprise Baseline Survey. Nairobi: CBS, K-Rep, ICEG.<br />
International Telecommunication Union 2007. Telecommunication/ICT<br />
Markets and Trends in Africa 2007. Africa, ICT Indicators, 2007,<br />
International Telecommunication Union. Geneva Switzerland: Place des<br />
Nations, CH-1211.<br />
Kenya Communications Act 2008. Available at: http://www.cck.go.ke/policy<br />
_and_legistration. (Accessed November 2009.)<br />
Kiiru MJ 2002. Revenue Implications <strong>of</strong> E-Commerce for Development.<br />
Geneva: WTO's Seminar on E-commerce.<br />
Lawson C & N Meyenn 2000. Bringing Cellular Phone Service to Rural<br />
Areas: Grameen Telecom and Village Pay Phones in Bangladesh.<br />
Worldbank: Public Policy for the Private Sector.<br />
M-Pesa 2009. Accessed Online at: www.safricom.co.ke.<br />
Mathieson K & M Keil 1998. Beyond the Interface: Ease <strong>of</strong> Use and<br />
Task/Technology Fit. Information and Management 34,4: 221-230.<br />
Mulli J 2004. E-commerce in Kenya – Where Are We? Available at: http://<br />
www.apc.org/apps/img_upload/6972616672696361646f63756d656e<br />
348
eBusiness Infrastructure in Kenyan Rural Enterprises<br />
74/IVERI.ppt. (Accessed in April 2009.)<br />
Mureithi M 2005. Strategies to Drive Internet Growth in Kenya. Lessons<br />
from Internet Usage among Micro & Small Enterprises in Kariobangi<br />
Light Industries. Nairobi Kenya: Summit Strategies Ltd.<br />
Norzaidi MD & M Intan Salwani 2008. TECHRPOVED Model: New<br />
Information Technology (IT) Management Tool. Paper presented at<br />
International Conference <strong>of</strong> Logistics, Services, and Management<br />
Operations (LSOM) and Business Information Technology (BIT). Seoul,<br />
South Korea.<br />
Open Data Kit 2009. Available at: http://code.google.com/p/open--data--kit.<br />
Ronge E, L Ndirangu & H Nyangito 2002. Review <strong>of</strong> Government Polices for<br />
the Promotion <strong>of</strong> Micro and Smallscale Enterprises. Kenya, Nairobi: The<br />
Kenya Institute for Public Policy Research and Analysis (KIPRA),<br />
DP/20/2002.<br />
Staples DJ & P Seddon 2004. Testing the Technology-to-Performance Chain<br />
Model. <strong>Journal</strong> <strong>of</strong> Organizational and End User Computing 16,4: 17-36.<br />
Venkatesh V, MG Morris, GB Davis & FD Davis 2003. User Acceptance <strong>of</strong><br />
Information Technology: Towards a Unified View. MIS Quarterly 273,3:<br />
425-478.<br />
Vessey I 1991. Cognitive Fit: A Theory-Based Analysis <strong>of</strong> the Graphs versus<br />
Tables Literature. Decision Sciences 22: 219-240.<br />
Zigurs I, BK Buckland, JR Connolly & EV Wilson 1999. A Test <strong>of</strong> Task-<br />
Technology Fit Theory for Group Support Systems. The Database for<br />
Advances in Information Systems 30,3,4: 34-35<br />
Zap 2009. Available Online at: http://www.zain.co.ke.<br />
349<br />
Patrick Kanyi Wamuyu<br />
Computer Science Department<br />
Daystar <strong>University</strong><br />
Kenya<br />
kanyiwamuyu@yahoo.com<br />
Manoj S Maharaj<br />
School <strong>of</strong> Information Systems & Technology<br />
<strong>University</strong> <strong>of</strong> <strong>KwaZulu</strong>-<strong>Natal</strong><br />
South Africa<br />
maharajms@ukzn.ac.za
Why are there not More<br />
Grounded Theories in<br />
Information Systems Research?<br />
Hans Lehmann<br />
Rosemary Quilling<br />
Abstract<br />
Theories indigenous to the information systems discipline are scarce. The<br />
Grounded Theory method is specifically aimed at creating ‘grounded<br />
theories’ in domains where no prior ones are. However, although its use in<br />
information systems research increased over the last two decades, the<br />
number <strong>of</strong> grounded theories created did not. This could be because either<br />
the Grounded Theory method is not ‘right’ for the information systems<br />
discipline or that it is not ‘done right’. The paper investigates both options<br />
and concludes firstly that the method is ‘right’. As a general method, capable<br />
<strong>of</strong> accepting any kind <strong>of</strong> data, Grounded Theory works well with<br />
information systems, which are viewed as actor networks <strong>of</strong> technology and<br />
people. There is, however, <strong>of</strong>ten a misunderstanding about what the<br />
Grounded Theory’s core tenets are and how to apply them. It is shown that<br />
the coding regime used is not unique to Grounded Theory. Its two core<br />
tenets are defined as the maxims <strong>of</strong> data collection jointly with analysis and<br />
that <strong>of</strong> theoretical sampling until saturation. The Grounded Theory method’s<br />
paradigmatic position (or, more accurately, its lack <strong>of</strong> one) is discussed. It is<br />
concluded that Grounded Theory, is only ‘right’ for Information Systems if<br />
it’s done ‘right’.<br />
Keywords: Grounded Theory, Qualitative Research methods, Triangulation.<br />
<strong>Alternation</strong> Special Edition 4 (2011) 350 – 364<br />
ISSN 1023-1757<br />
350
… Grounded Theory in Information Systems Research<br />
Introduction<br />
Theories, together with the methods and skills to build them, still seem<br />
scarce in the Information Systems (IS) discipline. A decade ago Bob Zmud<br />
(1998), then Editor-in-Chief <strong>of</strong> MISQ, issued a call for more ‘pure-theory’<br />
contributions to the journal. Ron Weber (2003) had to repeat his<br />
predecessor’s call because there had still been ‘much more … written about<br />
theory testing than theory building’. He pointed out that too many theories in<br />
IS research are ‘borrowed and adapted from other disciplines – perhaps a<br />
manifestation <strong>of</strong> our need to build theories in domains where no prior<br />
theories exist’, a sign that ‘as members <strong>of</strong> a discipline, we [information<br />
systems researchers] still need to improve our theory building skills’ (Weber<br />
2003). Whilst there are many ways to build theory, in ‘domains where no<br />
prior theories exist’ qualitative, and initially inductive, theory creation<br />
methods seem intuitively a natural fit. One <strong>of</strong> those, the Grounded Theory<br />
Method (GTM) is specifically geared to ‘discover’ social theory from<br />
empirical data sourced in a wide range <strong>of</strong> contexts and activities.<br />
Why is GTM not Successful in Generating IS Specific<br />
Theories?<br />
There could be two possible explanations for this: Firstly, GTM is not<br />
‘right’ for IS, with its mix <strong>of</strong> technological and social phenomena; and/or<br />
secondly; GTM is not done ‘right’. Already in the mid-1990s misuse <strong>of</strong><br />
GTM was commented on (e.g. Bryman & Burgess 1994 and Locke 1996). A<br />
recently updated analysis (Lehmann, Urquhart & Myers) <strong>of</strong> a decade <strong>of</strong> IS<br />
research papers that pr<strong>of</strong>ess to have used GTM confirms this.<br />
In order to generate good theory, the essentials <strong>of</strong> the GTM process<br />
need to be first understood and then followed. If they are not, then the<br />
outcomes will be conceptually weak, theoretically inconclusive or, in<br />
extremis, just plainly meaningless.<br />
In order to explore these questions further it is necessary to first<br />
provide a brief overview <strong>of</strong> the GTM. It is then necessary to consider if the<br />
GTM is ‘right’ for IS, and to explore how one is expected to perform GTM<br />
‘right’. Only then can we debate the real issue confronting IS researchers: If<br />
GTM is intended as a tool for theory development, why do the majority <strong>of</strong><br />
studies fail to produce this outcome?<br />
351
Hans Lehmann & Rosemary Quilling<br />
A Brief Overview <strong>of</strong> GTM<br />
There are various definitions <strong>of</strong> the grounded theory method, this from the<br />
creators themselves:<br />
‘[GTM is] the discovery <strong>of</strong> theory from data – systematically<br />
obtained and analysed in social research’ (Glaser & Strauss 1967:1).<br />
The Grounded Theory method described in the ‘Discovery <strong>of</strong><br />
Grounded Theory’ (Glaser & Strauss 1967) was the first synthesis <strong>of</strong> the two<br />
opposing worldviews in social science: Glaser, who came from Columbia<br />
with a heritage <strong>of</strong> ‘scientific’ thinking in sociology, complemented Strauss’s<br />
Chicago-style emphasis on understanding and explaining <strong>of</strong> social<br />
phenomena. The outcome was an ‘inductive technique, grounded in the data<br />
to an extent that would convince ‘hard-nosed’ quantitative researchers <strong>of</strong> the<br />
soundness <strong>of</strong> the approach’ (Gibbs 2002:165).<br />
As more researchers started to use GTM, it soon became evident<br />
that many found the required high degree <strong>of</strong> creative conceptualising<br />
difficult. Then Strauss, with one <strong>of</strong> his students, published a detailed,<br />
procedural ‘how-to guide’ to GTM (Strauss & Corbin 1990). Glaser,<br />
however, virulently opposed their heavily procedurised method critiquing it<br />
as restrictive to the point that it actually inhibits the emergence <strong>of</strong> a ‘theory’<br />
(Glaser 1992). With two versions <strong>of</strong> GTM available (labelled ‘Glaser’ and<br />
‘Strauss’), its use spread fast and wide. By 1994 influential opinion<br />
considered it to be ‘probably the most widely employed interpretive strategy<br />
in the social sciences today’ (Denzin & Lincoln 2000:382).<br />
This qualification <strong>of</strong> GTM as a ‘social research’ method, however,<br />
raises the question: How suitable is GTM for researching information<br />
systems, when the identity <strong>of</strong> IS as a social discipline (among other issues) is<br />
still being debated?<br />
‘Right’ for Information Systems Research?<br />
Numerous definitions <strong>of</strong> an information system have been postulated.<br />
Kroenke (2008:6) proposes an updated actor-network (AN) model involving<br />
hardware, s<strong>of</strong>tware, data, processes and people; with an interdependency<br />
between the technical and organisational elements <strong>of</strong> the ‘package’.<br />
An analysis <strong>of</strong> 177 articles published between 1990 and 2000 in<br />
Information Systems Research (Orlikowski & Iacono 2001), however, found<br />
that this notion <strong>of</strong> information technology as an organic fusion <strong>of</strong> technology<br />
352
… Grounded Theory in Information Systems Research<br />
and organisation had not been reflected in reported IS research. Instead, five<br />
isolated ‘views <strong>of</strong> the IT artefact’ seemed to guide IS research. Figure 1<br />
places the ‘views <strong>of</strong> the IT artefact’ into the contexts <strong>of</strong> the AN model.<br />
Figure 1: Views <strong>of</strong> the Technology, Processes and People in the<br />
Information Technology Artefact (following Orlikowski & Iacono<br />
2001; and Kroenke 2007)<br />
The ‘nominal’ and ‘computational’ views both treat the technology or<br />
the organisational applications as a ‘black box’. These accounted for about<br />
half <strong>of</strong> the research investigated. Researching how technology facilitates<br />
(‘tool’ view) or influences organisational goals (‘proxy’ view) makes up two<br />
fifths <strong>of</strong> the papers. Research into how all components <strong>of</strong> an IS function<br />
together, the ‘ensemble’ view, was only attempted by 12% <strong>of</strong> the studies –<br />
and only 4% were about ‘Technology as Embedded System’ where all parts<br />
<strong>of</strong> the AN were given equal research focus.<br />
The analysis did not cover why and how this came about. It is<br />
plausible, though, to postulate that the restrictions imposed by specific<br />
methodologies had something to do with it: the realist approaches used in<br />
the investigations <strong>of</strong> the ‘computational’ and ‘proxy’ views are not very<br />
suitable for the organisation-oriented views. Conversely, the interpretivist/<br />
constructionist methods used there were not a useful fit for technologyfocused<br />
research. In contrast, in an analysis <strong>of</strong> recent studies that purport to<br />
have used GTM (Urquhart), it was found that more than half had attempted<br />
to build theories within the ‘embedded’ version <strong>of</strong> the ‘Ensemble’ view <strong>of</strong><br />
information technology. This may well be attributed to the fact that GTM is<br />
353
Hans Lehmann & Rosemary Quilling<br />
a ‘general method’ (Glaser 1998), where the ‘slices <strong>of</strong> data’ gathered can be<br />
about any actant in the IS-AN under investigation, and can refer to any<br />
relationship in the theoretical constructs ‘discovered’.<br />
A domain neutral method such as GTM could thus well answer the<br />
challenge for ‘more work to be done from an ensemble view [in two<br />
directions]: developing conceptualisations and theories <strong>of</strong> IT artefacts; and<br />
incorporating [them] expressly into our studies … [irrespective] <strong>of</strong> any<br />
particular perspective or methodology’ (Orlikowski & Iacono 2001:130).<br />
Such extensions to the original method are, however, legitimate only if they<br />
preserve the essence <strong>of</strong> GTM.<br />
The ‘Right’ GTM?<br />
When it was developed GTM’s major difference to other qualitative<br />
methods was its rigour – the key to ensure that emerging theories are as<br />
close a fit to the data as possible and that they work to understand, explain<br />
and predict the phenomena under investigation. But much <strong>of</strong> what is seen to<br />
characterise GTM is not unique: If we can sift out those elements common<br />
to other qualitative methods then we can highlight the underpinning <strong>of</strong> the<br />
rigour inherent in the method.<br />
There are two common characteristics in social science research<br />
methods, namely: the three-step research sequence and the coding <strong>of</strong> text.<br />
Firstly, GTM follows the traditional three-step research sequence <strong>of</strong> any<br />
social science method, as described by Stoller: ‘I ‘gathered data’ and once<br />
the data was arranged in ‘neat piles’, I ‘wrote them up’. (Stoller & Olkes<br />
1987:227). While this may be challenged by some researchers, the basic<br />
sequence seems to be an immutable axiom for most conclusion-oriented<br />
investigative activities. Secondly, the ‘coding’ <strong>of</strong> the data - which can be any<br />
‘text’ - happens at the exact same three levels <strong>of</strong> depth as in all social<br />
research. Miles and Huberman (1994:57) label them as follows:<br />
• initially, commonalities in the data are captured in ‘descriptive’<br />
codes to clearer capture the essential aspects <strong>of</strong> the phenomenon;<br />
• next, as more data and codes are available, ‘interpretive’ codes are<br />
abstracted from the concrete incidents to help understand what is<br />
going on ‘behind’ the data;<br />
354
… Grounded Theory in Information Systems Research<br />
• lastly, inferential ‘pattern’ codes, now abstract <strong>of</strong> space and time,<br />
are conceptualised that are explanatory and <strong>of</strong>ten predictive.<br />
The nomenclature <strong>of</strong> GTM is different: Glaser and Strauss (1967)<br />
talk <strong>of</strong> ‘categories’ and their ‘properties’ instead <strong>of</strong> ‘codes’, but also<br />
recognise their development in ‘open’ coding first, then in ‘theoretical’<br />
coding, followed by ‘selective’ coding to reduce the number <strong>of</strong> concepts that<br />
make up the final theory. Strauss and Corbin, as well as Charmaz have their<br />
own labels, as well as some interim steps, but these are only immaterially<br />
different from the three universal coding levels (see Table 1 for a<br />
comparison).<br />
Generic<br />
‘Coding’<br />
Levels<br />
Glaser &<br />
Strauss (1967)<br />
355<br />
Strauss &<br />
Corbin (1990)<br />
Charmaz<br />
(2006)<br />
Descriptive Open Coding Open Coding Open Coding<br />
Focused<br />
Coding<br />
Axial Coding<br />
Interpretive Theoretical Axial Coding Theoretical<br />
Pattern Coding Selective Coding<br />
Coding<br />
Selective<br />
Coding<br />
Table 1: Relation <strong>of</strong> different GTM coding classifications schools to<br />
levels <strong>of</strong> abstraction in generic coding levels <strong>of</strong> qualitative data<br />
analysis (after Miles & Huberman 1994)<br />
The use <strong>of</strong> these generic methods <strong>of</strong> social research clearly does not<br />
set GTM apart from other qualitative social research. So what does?<br />
GTM incorporates a ‘constant comparative method <strong>of</strong> joint data<br />
collection and analysis’ (Glaser & Strauss 1965). This has two stringent<br />
rules: Firstly, data gathering and data analysis are undertaken together, not<br />
sequentially; and secondly, this analysis is a constant comparison <strong>of</strong> every<br />
new slice <strong>of</strong> data with the conceptual content <strong>of</strong> every other slice <strong>of</strong> data,<br />
with the intent to generate new abstract categories or to enhance the<br />
properties <strong>of</strong> existing ones.
Hans Lehmann & Rosemary Quilling<br />
In the ‘Discovery’, two years later, the method was completed by<br />
stipulating how to collect the next slice <strong>of</strong> data – and when to stop<br />
collecting: After each round <strong>of</strong> analysis the ‘next slices <strong>of</strong> data’ are selected<br />
using theoretical sampling, i.e. the nature <strong>of</strong> the conceptual constructs in<br />
hand (e.g. clarity, completeness, scope) determines what next slice <strong>of</strong> data is<br />
required to enhance (clarify, extend, or densify) the present constructs; and<br />
lastly, but most importantly, the cyclical iterations only end when new slices<br />
<strong>of</strong> data cannot enhance the conceptual constructs any further, i.e. when they<br />
are theoretically saturated. Figure 2 illustrates the sequence <strong>of</strong> activities in<br />
the GTM cycle and highlights the parts that are specific and unique to the<br />
method.<br />
* Here ‘Strauss’ and Charmaz vary from ‘Glaser’<br />
Figure 2. Sequence <strong>of</strong> activities in the GTM<br />
356
… Grounded Theory in Information Systems Research<br />
This approach to sampling is fundamentally different from many<br />
other social research methods. Furthermore, and most importantly, there is<br />
no pre-set sample size - data gathering only stops when there is nothing more<br />
new to be learned about the categories and their relations, i.e. the nascent<br />
theory.<br />
There are thus really only two essential characteristics that define<br />
GTM, namely,<br />
1. The constant comparison <strong>of</strong> all existing conceptual constructs with<br />
every instance <strong>of</strong> new data, jointly with their collection;<br />
2. Theoretical sampling for new slices <strong>of</strong> data until, and always until,<br />
theoretical saturation <strong>of</strong> the nascent theory is reached.<br />
Both these ‘core analytic tenets’ must be met otherwise it is<br />
impossible to ‘reasonably assess how the data were used to generate key<br />
conceptual categories’ and the research should not pr<strong>of</strong>ess to use the GTM<br />
(Suddaby 2006:640).<br />
But is the use <strong>of</strong> GTM possible for researchers who follow different<br />
paradigms – does GTM have a paradigmatic bias? The next section<br />
endeavours to get to the bottom <strong>of</strong> these considerations.<br />
Paradigmatic Comments<br />
Because GTM use is not contingent on any specific view <strong>of</strong> ‘the world’ it is<br />
fully compatible with (post)positivist and interpretivist stances, be they<br />
objectivist, constructivist, or critical (when such knowledge is deemed<br />
instrumental for social emancipation and justice) or participatory (which<br />
adds a practical dimension to the critical stance). GTM’s core tenets simply<br />
prescribe a way <strong>of</strong> developing a theory that has the closest possible<br />
relationship to the data it ‘emerged’ from. The method is entirely<br />
independent <strong>of</strong> the nature <strong>of</strong> the data or the nature <strong>of</strong> the abstractions<br />
incumbent researchers assign to them. GTM neither prescribes a specific<br />
ontology or epistemology, nor does it limit the researcher’s freedom to<br />
choose whether they consider data to be naively or critically real or a<br />
subjective, transactional and/or a relativistic construction.<br />
The original ignition point for the discussions about GTM’s<br />
paradigmatic classification was the role <strong>of</strong> induction versus deduction in the<br />
357
Hans Lehmann & Rosemary Quilling<br />
method. In the first instance GTM is an inductive method and has been<br />
named that by its founders from the very beginning. Because induction is<br />
<strong>of</strong>ten (and myopically) equated with interpretivist paradigms GTM has been<br />
labelled that, too. On the other hand, it has been argued that GTM’s<br />
distinction between empirical base and derived abstractions may be dualist,<br />
which eo ipso characterizes GTM as (post)positivist (Annells 1996). As a<br />
positivist method, however, GTM would be strongly (and equally<br />
myopically) associated with the deductive development and verification <strong>of</strong><br />
hypotheses – which is toto orbe from GTM, and vehemently so (Glaser &<br />
Strauss 1967:2).<br />
The resolution <strong>of</strong> the argument is that GTM does both. The cycle<br />
alternates between inductive and deductive logic as the research proceeds.<br />
The initial abstracting <strong>of</strong> concepts from the data is inductive, but deductive<br />
work is used to derive from induced codes the clues and directions for where<br />
to go next in the theoretical sampling stage. This fusion <strong>of</strong> approaches is<br />
termed ‘abduction’. Its definition is ‘The process <strong>of</strong> forming an explanatory<br />
hypothesis. It is the only logical operation which introduces any new idea<br />
…. Deduction proves something that must be, Induction shows that<br />
something actually is operative, Abduction merely suggests that something<br />
may be’ (Peirce 1903:216). Kathy Charmaz, an original student <strong>of</strong> both<br />
Glaser and Strauss, (Charmaz 2000) in a detailed investigation eventually<br />
reconciled the long-running objectivist/constructionist schism among<br />
grounded theorists and set out a guide on how to discover grounded theory<br />
for either paradigm family (Charmaz 2006).<br />
GTM is thus a neutral research procedure and inherently multiparadigmatic.<br />
This insight should be emancipatory; allowing researchers to<br />
develop theories from within their methodological paradigm(s). While this is<br />
the case, the challenge <strong>of</strong> the GTM is inherently the creative demands it<br />
places on the researcher. The process <strong>of</strong> exploring the data on hand, and<br />
determining the successive iterations <strong>of</strong> data to collect, is inherently<br />
challenging as it depends on the ability <strong>of</strong> the researcher to create meaning<br />
from the data. It is at the level <strong>of</strong> exploring links between codes (nodes or<br />
categories) that this is most difficult. Being inherently multi-paradigmatic it<br />
does not exist in ‘conflict’ with another paradigm, but is able to be teamed in<br />
a complementary fashion, to provide more clarity in the process. To<br />
complete the discussion <strong>of</strong> GTM as a tool for theory development in IS, it<br />
thus becomes necessary to consider the use <strong>of</strong> triangulation (mixed or<br />
358
… Grounded Theory in Information Systems Research<br />
multiple method research) as a catalyst to further enabling theory<br />
development.<br />
Bridging the Creative Divide<br />
Accepting the hybrid view <strong>of</strong> IS as mixed-actant ANs is one thing. Using<br />
GTM in IS, however, requires an extension <strong>of</strong> the method. ‘Glaser’ and<br />
‘Strauss’ methods were explicitly grounded in research about the<br />
interactions between individual human actors in predominantly non-business<br />
sociological settings. Researching the IS ‘Ensemble’ needs a wider focus on<br />
interactions between groups <strong>of</strong> people and technology, all embedded in<br />
organisations. Practically, the fact that an IS researcher needs to consider<br />
such a wide focus, requires a pragmatic research approach: A mixed or<br />
multiple method approach may be most conducive to theory development<br />
with GTM, with its neutral paradigm, being complemented by another<br />
research method.<br />
The triangulation <strong>of</strong> findings from different research approaches<br />
allows the situation to be viewed, and studied, through different analytical<br />
lenses. Triangulation can involve four distinct planes <strong>of</strong> interest, namely: the<br />
theoretical approach chosen, the research methods, the data source, and<br />
participating or referenced researchers (Fielding & Schreier 2001; Hilton<br />
1999; Kleining & Witt 2001). The distinct form a particular triangulated<br />
study takes depends on how the researcher chooses to combine the planes <strong>of</strong><br />
interest, and the choices available within each plane (Kelle 2001; Quilling &<br />
Blewett 2003).<br />
Triangulation has been represented in different ways, but central to<br />
this discussion is the fact that triangulation focuses on the integration <strong>of</strong><br />
different perspectives to produce a more complete picture. ‘Triangulation is<br />
less a strategy for validating results and procedures than an alternative to<br />
validation … which increases scope, depth and consistency in<br />
methodological proceedings’ (Flick 1998 as discussed in Kelle 2001). He<br />
stresses though, that in this understanding <strong>of</strong> the term, each method on its<br />
own should be able to provide an explanation <strong>of</strong> the phenomenon. As such<br />
the term ‘triangulation’ should be considered to be a metaphor for the<br />
methodological process rather than a specific approach (Cupchik 2001;<br />
Kelle 2001; Knox 2004; Steiner 2002; Zinn 2002).<br />
359
Hans Lehmann & Rosemary Quilling<br />
The value <strong>of</strong> triangulation is that it suggests the use <strong>of</strong> alternative<br />
ways <strong>of</strong> exploring phenomena: When facing a creative chasm while applying<br />
the GTM a researcher may feel there is little guidance available in terms <strong>of</strong><br />
determining the next data to be collected or patterns emerging. Self-doubt<br />
can be a challenge and clarity may seem elusive: Is the data really saying<br />
that? By referring to another methodological stance it may be possible to<br />
gain a new perspective <strong>of</strong> a potential ‘next step’ in the research process.<br />
IS contexts, located within organisations, are typically investigated<br />
using a case study methodology. One way <strong>of</strong> achieving an ensemble<br />
approach using GTM (Lehmann 2005:166-167) starts with conceptualising<br />
all the individual slices <strong>of</strong> data (technical and organisational) within one<br />
organisation and then amalgamating them into one contiguous narrative (the<br />
‘case history’). This then forms a second-order ‘text’ from where further<br />
conceptualisations now progress. Theoretical sampling thus first ranges<br />
within-case to maximise the theoretical depth and density <strong>of</strong> the case story.<br />
The resulting theorems <strong>of</strong> what ‘happens in the case’ are then applied to<br />
theoretical sampling between-cases to move the overall theory - <strong>of</strong> what<br />
‘happens in the substantive area’ - forward. A combination <strong>of</strong> a case study<br />
and GTM can provide insight into how the data can be explored for<br />
meaning, and theory developed.<br />
In areas where little is known about the subject it may be useful to<br />
supplement traditional qualitative data (such as focus group interviews) with<br />
data received from surveys, as a part <strong>of</strong> the model building process. This<br />
approach was employed in a study considering the impact <strong>of</strong> the disciplinary<br />
culture <strong>of</strong> individual team members on the workings <strong>of</strong> a multidisciplinary<br />
student team (Quilling 2008). Initial theory development was based on the<br />
perspective provided by 13 IS project development teams’ members (4-5<br />
students per team). Findings from the analysis <strong>of</strong> a survey <strong>of</strong> 108 individuals<br />
who constituted the same class; thus incorporating a significant number <strong>of</strong><br />
the students who would already have been represented in the focus group<br />
interviews, were added as further data.<br />
While it is important to consider the philosophical underpinning <strong>of</strong><br />
methodologies, which are to be used together, it has already been shown that<br />
GTM lends itself to this form <strong>of</strong> research due to its neutral position. In<br />
addition, the additional insights the researcher may gain from changing<br />
methodological perspective may greatly enhance the creativity they bring to<br />
the data, by providing alternative ways to ‘see’ the data.<br />
360
… Grounded Theory in Information Systems Research<br />
Conclusion<br />
This paper has explored the relevance <strong>of</strong> GTM as an appropriate research<br />
methodology for application in the IS discipline. It has underlined the fact<br />
that GTM’s main point is the rigour with which it anchors conceptual<br />
conjecture in data to give it legitimacy as a theory. GTM’s proven<br />
applicability to divergent disciplines rests on its generality – data can come<br />
from any source This makes it the right choice for fundamental research in<br />
IS, which is an actor network <strong>of</strong> technical and people actants. Right choice is<br />
one thing – doing GTM the right way is another: It was then necessary to<br />
clarify that the essential elements <strong>of</strong> GTM are joint data gathering and<br />
constant comparison on the one hand and theoretical sampling and saturation<br />
on the other. This has helped to correct the common misconception that<br />
coding in a specific way constitutes GTM – it does not, whatever fancy<br />
name the different coding levels may have been given – coding is common<br />
to other social science methods as well. The second quality that makes GTM<br />
useful for IS is its paradigmatic neutrality – researchers <strong>of</strong> the technology<br />
part <strong>of</strong> the IS can apply a positivist approach and investigations where<br />
people and organisational aspects are in the foreground may use a<br />
constructivist lens, but both would use the same basic process <strong>of</strong> grounding<br />
their concepts in the data. The discussion <strong>of</strong> paradigmatic neutrality<br />
concluded that abduction logic best describes the GTM approach to<br />
distilling meaning from phenomena. This straddles most <strong>of</strong> the paradigmatic<br />
stances represented in social science. Finally, it is this neutrality, which<br />
allows it to be teamed with other research approaches in a mixed- or<br />
multiple- method study (triangulated study). Two examples are provided to<br />
illustrate how this may aid in bridging the creative gap – that space where<br />
the researcher only has themselves to rely on - when trying to interpret what<br />
the analysis may be suggesting.<br />
Concluding: GTM is a useful method to create theory in domains<br />
where few exist. It is, however, not formulaic – it requires creativity. It is not<br />
easy – it requires knowledge <strong>of</strong> the field and method skills. It takes you<br />
where no-one has been before – this makes it risky. Yet like with everything<br />
high risk - occasionally there can be high reward.<br />
Acknowledgement<br />
This paper was presented at the Business and Management Conference<br />
(UKZN), Durban, South Africa, 5-7 November 2009.<br />
361
Hans Lehmann & Rosemary Quilling<br />
References<br />
Annells M 1996. Grounded Theory Method: Philosophical Perspectives,<br />
Paradigm <strong>of</strong> Inquiry, and Postmodernism. Qualitative Health Research<br />
6.3: 379-393.<br />
Bryman A & R Burgess 1994. Developments in Qualitative Data Analysis:<br />
An Introduction. In Bryman A & R Burgess (eds): Analysing Qualitative<br />
Data. London: Routledge.<br />
Charmaz K 2000. Grounded Theory in the 21st Century: A Qualitative<br />
Method for Advancing Social Justice Research. In Denzin N & Y Lincoln<br />
(eds): The Handbook <strong>of</strong> Qualitative Research. 3 rd Edition. Thousand<br />
Oaks: Sage.<br />
Charmaz, K 2006. Constructing Grounded Theory: A Practical Guide<br />
Through Qualitative Analysis. Thousand Oaks: Sage.<br />
Denzin N & Y Lincoln 2000. Strategies <strong>of</strong> Inquiry. In Denzin N & Y Lincoln<br />
(eds): The Handbook <strong>of</strong> Qualitative Research. 3 rd Edition. Thousand<br />
Oaks: Sage.<br />
Gibbs G 2002. Qualitative Data Analysis. Maidenhead: Open <strong>University</strong><br />
Press.<br />
Glaser B & A Strauss 1965. Discovery <strong>of</strong> Substantive Theory: A Basic<br />
Strategy Underlying Qualitative Analysis. American Behavioural<br />
Scientist 8: 5-12.<br />
Glaser B 1998. Doing Grounded Theory: Issues and Discussions. Mill<br />
Valley: Sociology Press.<br />
Glaser B 1992. Emergence vs. Forcing: Basics <strong>of</strong> Grounded Theory Analysis.<br />
Mill Valley: Sociology Press.<br />
Glaser B & A Strauss 1967. The Discovery <strong>of</strong> Grounded Theory: Strategies<br />
for Qualitative Research. Chicago: Aldine Publishing Company.<br />
Hilton A 1999. Should Qualitative and Quantitative Studies be Triangulated?<br />
Cancer Care. Available at: http://www.isncc.org/news/triangle.htm.<br />
Kelle U 2001. Sociological Explanations between Micro and Macro and the<br />
Integration <strong>of</strong> Qualitative and Quantitative Methods. Forum Qualitative-<br />
Sozialforschung Forum: Qualitative Research 2,1. Available:<br />
http://www.qualitative-research.net/index.php/fqs/article/view/966/2109.<br />
Kleining G & H Witt 2001. Discovery as Basic Methodology <strong>of</strong> Qualitative<br />
and Quantitative research. Forum Qualitative-Sozialforschung Forum:<br />
Qualitative Research 2,1. Available: http://www.qualitativeresearch.<br />
net/index.php/fqs/article/view/977/2131.<br />
362
… Grounded Theory in Information Systems Research<br />
Knox K 2004. A Researcher’s Dilemma - Philosophical and Methodological<br />
Pluralism. Electronic <strong>Journal</strong> <strong>of</strong> Business Research Methods 2,2: 119-<br />
128.<br />
Kroenke D 2008. Experiencing MIS. Upper Saddle River: Pearson<br />
Publications.<br />
Lehmann H, C Urquhart & M Myers 2006. Putting the ‘Theory’ Back into<br />
Grounded Theory: A Framework for Grounded Theory Studies in<br />
Information Systems. <strong>University</strong> <strong>of</strong> Auckland Working Paper.<br />
Lehmann H & R Gallupe 2005. Information Systems for Multinational<br />
Enterprises – Some Factors at Work in their Design and Implementation.<br />
<strong>Journal</strong> <strong>of</strong> International Management 11,4: 28-49.<br />
Locke K 1996. Rewriting the Discovery <strong>of</strong> Grounded Theory after 25 Years?<br />
<strong>Journal</strong> <strong>of</strong> Management Inquiry 5: 239-245.<br />
Miles M & A Huberman 1994. Qualitative Data Analysis: An Expanded<br />
Sourcebook. 2 nd Edition. Newbury Park: Sage Publications.<br />
Orlikowski W & C Iacono 2001. Research Commentary: Desperately Seeking<br />
the ‘IT’ in IT Research – A Call to Theorizing the IT Artefact.<br />
Information Systems Research 12.2: 121-134.<br />
Peirce C 1903. The Essential Peirce: Selected Philosophical Writings 2.<br />
Bloomington: Indiana <strong>University</strong> Press.<br />
Quilling R 2008. Multidisciplinary Teams in Information Systems.<br />
Unpublished MCom (IS&T) Dissertation, <strong>University</strong> <strong>of</strong> <strong>KwaZulu</strong>-<strong>Natal</strong>,<br />
South Africa.<br />
Quilling R & C Blewett 2003. The Research Pyramid - Taking Honour’s<br />
Students Up to See the View. Proceedings <strong>of</strong> the 33rd Annual SACLA<br />
(Southern African Computer Lecturers Association) Conference.<br />
Steiner C 2002. The Technicity Paradigm and Scientism in Qualitative<br />
Research. The Qualitative Report 7.2: 24.<br />
Stoller P & C Olkes 1987. In Sorcery’s Shadow: A Memoir <strong>of</strong> Apprenticeship<br />
Among the Songhay <strong>of</strong> Niger. Chicago: <strong>University</strong> <strong>of</strong> Chicago Press.<br />
Strauss A & J Corbin 1990. Basics <strong>of</strong> Qualitative Research: Grounded<br />
Theory Procedures and Techniques. Newbury Park: Sage Publications.<br />
Suddaby R 2007. From the Editors: What Grounded Theory is Not. Academy<br />
<strong>of</strong> Management <strong>Journal</strong> 46.4: 633-642.<br />
Weber R 1998. Editor’s Comments: Theoretically Speaking. Management<br />
Information Systems Quarterly 27,3: iii-xii.<br />
363
Hans Lehmann & Rosemary Quilling<br />
Zinn J 2002. Conceptual Considerations and an Empirical Approach to<br />
Research on Processes <strong>of</strong> Individualisation. Forum: Qualitative Social<br />
Research 3,1: Available at: http://www.qualitative-research.net/index.<br />
php/fqs/article/view/887/1937.<br />
Zmud R 1998. Pure Theory Manuscripts. Management Information Systems<br />
Quarterly 22.2: iv-xv.<br />
364<br />
Hans Lehmann<br />
chool <strong>of</strong> Information Management<br />
Victoria <strong>University</strong> <strong>of</strong> Wellington,<br />
Wellington, New Zealand<br />
Hans.Lehmann@vuw.ac.nz<br />
Rosemary Quilling<br />
School <strong>of</strong> Information Systems &Technology<br />
Faculty <strong>of</strong> Management Studies<br />
<strong>University</strong> <strong>of</strong> <strong>KwaZulu</strong>-<strong>Natal</strong><br />
Westville, South Africa<br />
quillingr@ukzn.ac.za
The Partial Approach to<br />
Grounded Theory Integrated with<br />
Activity Theory: A Generic Framework,<br />
Illustrated by a Base Study in an<br />
e-Learning Context<br />
Mc Donald van der Merwe<br />
Ruth de Villiers<br />
Abstract<br />
Published studies frequently emphasize research situations and data<br />
collection methods at the expense <strong>of</strong> discussions <strong>of</strong> analysis (Eisenhardt<br />
1989). This results in a gap between data and conclusions. Grounded Theory<br />
research, in particular, is prone to misconceptions and technical fixes that<br />
increase the gap. The principal objective <strong>of</strong> this meta-research study is to<br />
propose, articulate, and motivate an integrated generic research framework<br />
that combines elements <strong>of</strong> the Grounded Theory Method and Activity<br />
Theory in a Partial Grounded Theory approach. The integrated research<br />
design was synthesized during a base study on forum interactions in an elearning<br />
context. Pertinent aspects <strong>of</strong> this qualitative base study are<br />
described to illustrate the framework, after which the full framework and its<br />
phases are presented.<br />
Keywords: Grounded theory, partial grounded theory, activity theory, metaresearch,<br />
mathematics education, e-learning, online discussions.<br />
Introduction and Background<br />
Grounded Theory originated with the seminal publication, ‘The Discovery<br />
<strong>Alternation</strong> Special Edition 4 (2011) 365 – 402<br />
ISSN 1023-1757<br />
365
Mc Donald van der Merwe & Ruth de Villiers<br />
<strong>of</strong> Grounded Theory’ by Glaser and Strauss (1967). Grounded theory (GT)<br />
is a popular method for the collection and analysis <strong>of</strong> qualitative data in<br />
situations where there are few theoretical explanations regarding a topic.<br />
Using the Grounded Theory Method (GTM), conceptual properties and<br />
categories are either discovered or generated from qualitative data which<br />
leads to the development <strong>of</strong> new or emerging theory. It is claimed to be the<br />
most widely used qualitative research method in the social sciences (Locke<br />
2001). A probable reason for its popularity is that it contains a number <strong>of</strong><br />
guidelines and procedures, thereby providing a useful template that serves as<br />
a ‘comfort factor’ when conducting qualitative research (Hughes &<br />
Howcr<strong>of</strong>t 2000).<br />
Grounded Theory is traditionally aligned with objectivism, but has<br />
also been used in constructivist contexts (Mills, Bonner & Francis 2006).<br />
This change in stance led to different rules for conducting GT research,<br />
sparking a long-standing debate between the initial authors over the ‘correct’<br />
method and strategies for collecting and analyzing data (see Glaser 1978,<br />
1992) versus Strauss and Corbin (1990; 1998)). The major divergence<br />
relates to the methodological rather than ontological and epistemological<br />
aspects, with researchers typically choosing the approach they find most<br />
appropriate for their particular research and that provides them with a clearer<br />
picture <strong>of</strong> how to apply Grounded Theory contextually. These tactics have<br />
resulted in many ‘technical fixes’ to GTM over the years (Barbour 2001).<br />
Whereas the original intended use <strong>of</strong> the GTM requires a<br />
longitudinal interplay between data gathering and analysis in a cyclic<br />
fashion, Parry (1998) notes that this approach is seldom implemented, with<br />
scientists loosely employing the term ‘Grounded Theory’ to indicate that<br />
theory was derived from data. Strauss and Corbin (1990) distinguish<br />
between a Full Grounded Theory approach, which is iterative, and a Partial<br />
Approach, whereby the data is simply theorized upon, not necessarily in an<br />
iterative manner. They furthermore state that there are two main shortfalls in<br />
the partial method that reduce its efficacy as sound scientific research. The<br />
first is the absence <strong>of</strong> an explainable analytical process by which concepts<br />
are built up to higher levels <strong>of</strong> abstraction. The second relates to failure to<br />
deter-mine (or at least, explain) the nature <strong>of</strong> relationships between<br />
categories or concepts. The result is that some GT methods fail to meet the<br />
precision and criteria for good scientific research (Strauss & Corbin<br />
1990).<br />
366
Grounded Theory Integrated with Activity Theory …<br />
To circumvent these criticisms, Charmaz (2006), who is<br />
acknowledged as a leading theorist and exponent <strong>of</strong> GTM, recently<br />
repositioned Grounded Theory as a flexible approach and not a strict<br />
methodology, thereby inviting researchers from other standpoints to use it in<br />
innovative ways. Seaman (2008) elaborates on various ways in which<br />
traditional GTM can be extended to new directions by following different<br />
methodological guidelines, in particular, using the vantage point <strong>of</strong> Cultural-<br />
Historical Activity Theory as a test case. In exploring the use <strong>of</strong> GTM within<br />
another existing theoretical framework, namely Activity Theory, he<br />
addresses issues faced by many GT researchers starting from an existing<br />
theoretical stance, namely: how to determine an appropriate role for<br />
Grounded Theory, and how to adapt its methods and strategies in the light <strong>of</strong><br />
different methodological guidelines, whilst yet maintaining its original intent<br />
(Seaman 2008).<br />
Similarly, this article seeks to contribute to the repositioning <strong>of</strong><br />
Grounded Theory from a methodology with positivist underpinnings to a<br />
partial and flexible approach for use within different theoretical frameworks.<br />
As with Seaman (2008), the framework <strong>of</strong> choice is Activity Theory (AT).<br />
Objective<br />
The principal objective <strong>of</strong> this meta-research study is to propose, articulate,<br />
and motivate an integrated research framework that combines Activity<br />
Theory and the Partial Grounded Theory Method. In articulating the steps <strong>of</strong><br />
the methodology, this paper addresses Strauss and Corbin’s (1990) shortfalls<br />
<strong>of</strong> the partial method, i.e. the absence <strong>of</strong> an explainable analytic process<br />
and/or the failure to determine the nature <strong>of</strong> relationships between<br />
categories/concepts. We illustrate use <strong>of</strong> the framework by describing a<br />
recent study by van der Merwe and van der Merwe (2008), relating to use <strong>of</strong><br />
an online discussion forum by two distinct groups <strong>of</strong> mathematics teachers.<br />
This study is referred to as the base study and the integrated phase-by-phase<br />
framework was initially generated to meet its particular requirements. The<br />
objective <strong>of</strong> the base study was to gain a deep understanding <strong>of</strong> the data<br />
from two case studies within specific contexts, through the application <strong>of</strong><br />
selected and adapted Grounded Theory techniques, illuminated by Activity<br />
Theory.<br />
367
Mc Donald van der Merwe & Ruth de Villiers<br />
The article explains the essential foundations <strong>of</strong> the theories and<br />
methods applied, highlighting the techniques and procedures that were<br />
adopted and adapted for the researchers’ purposes. This is a similar effort to<br />
that <strong>of</strong> Locke (2001:95) to ‘capture the complexities <strong>of</strong> the context in which<br />
the action unfolded ...’. Furthermore, we overview and present examples that<br />
illustrate the analytical processes. The purpose <strong>of</strong> this present article is to<br />
explicate and advocate this innovative research approach.<br />
First, a review is provided <strong>of</strong> the essential foundations <strong>of</strong> Grounded<br />
Theory and Activity Theory. A research method is a strategy <strong>of</strong> inquiry that<br />
moves from the underlying philosophical assumptions to research design and<br />
data collection (Myers 2007). To this end, we then overview the base study,<br />
explaining the selection <strong>of</strong> its research methods and philosophical<br />
perspective, followed by an outlining <strong>of</strong> the data collection and analytical<br />
processes. Finally, the article consolidates the approach and its contributions<br />
by suggesting a generic integrated framework that can be applied by<br />
researchers in other contexts. The reason for presenting the base study prior<br />
to the introduction <strong>of</strong> the framework is to lead the reader toward the main<br />
proposal <strong>of</strong> this study by using an example.<br />
Grounded Theory<br />
Grounded Theory was outlined in the Introduction and is elaborated in this<br />
section. The defining characteristic is its use to generate substantive as well<br />
as formal theories through induction from data and comparative analysis,<br />
either by well-codified sets <strong>of</strong> properties or in running theoretical<br />
discussions (Glaser & Strauss 1967). Martin and Turner (1986:141) define<br />
GT as an ‘inductive theory-discovery methodology that allows the<br />
researcher to develop a theoretical account <strong>of</strong> general features <strong>of</strong> the topic,<br />
while simultaneously grounding the account in empirical observations <strong>of</strong><br />
data’.<br />
There are two key beliefs in the classic GT <strong>of</strong> Glaser and Strauss:<br />
1. Initially, no theory exists to be proven, disproved or extended, and<br />
2. Grounded Theory is discovered through constant comparison<br />
between incidents and properties <strong>of</strong> a category.<br />
368
Grounded Theory Integrated with Activity Theory …<br />
GT is thus appropriate when little is known about a topic and where<br />
there are few existing theories to explain a phenomenon (Hutchinson<br />
1988).<br />
Babchuck (1997) identified research that employed the GTM in<br />
educational environments, including studies on: teacher burn-out and stress<br />
(Blase 1982); middle school students’ perceptions <strong>of</strong> factors facilitating the<br />
learning <strong>of</strong> science (Spector & Gibson 1991); adaptive strategies <strong>of</strong> expert<br />
teachers (Conrad 1987); life in an adult basic education classroom<br />
(Courtney, Jha & Babchuk 1994); group socialization <strong>of</strong> secondary school<br />
teachers (Gehrke 1982); and instructional innovation in higher education<br />
(Kozma 1985). Other GMT research identified by the primary author <strong>of</strong> the<br />
present article includes: attitudes, needs and pr<strong>of</strong>essional development <strong>of</strong><br />
science teachers (Klieger, Ben-Hur & Bar-Yossef 2009); web-based learning<br />
environments (Zimmerman, 2002); academic change (Conrad 1978); and<br />
self-efficacy beliefs in academic settings (Pajares 1996).<br />
The GT-method is also well suited to IS-research (de Villiers 2005).<br />
Some <strong>of</strong> the more prominent studies advocating a GT methodology in IS<br />
include Orlikowski (1993), Walsham (1995), Fitzgerald (1997), Hughes et<br />
al. (2003) and Hansen et al. (2005).<br />
One <strong>of</strong> the major criticisms <strong>of</strong> studies employing the GTM relates to<br />
the lack <strong>of</strong> actual theory generation. For example, Locke (1996) criticizes an<br />
‘anything goes’ approach by some researchers; Bryman and Burgess (1994)<br />
express concern about the use <strong>of</strong> Grounded Theory as ‘an approving bumper<br />
sticker’ to imply academic respectability in the absence <strong>of</strong> a helpful<br />
description <strong>of</strong> the analysis strategy used; Melia (1997) suggests that most<br />
researchers use a pragmatic approach in an effort to achieve ‘added value’<br />
by identifying new themes from the data alongside those that could have<br />
been anticipated from the outset; and Barbour (2001) charges that in the<br />
absence <strong>of</strong> analytical, in-depth analysis, many researchers produce<br />
‘artificially neat and tidy’ descriptive accounts. The result is that many<br />
papers claim to be Grounded Theory when they do not give full attention to<br />
the systematic yet flexible procedures it <strong>of</strong>fers, or fail to <strong>of</strong>fer or elaborate<br />
on the exact procedures employed.<br />
The four core GTM steps used in the analysis <strong>of</strong> data are open<br />
coding, axial coding, selective coding, and theoretical sampling until<br />
theoretical saturation is reached.<br />
369
Mc Donald van der Merwe & Ruth de Villiers<br />
Open Coding<br />
The three basic elements <strong>of</strong> the GTM are concepts, categories and<br />
propositions (Pandit 1996). Incidents or activities are analysed as potential<br />
indicators <strong>of</strong> phenomena and are given conceptual labels in order to<br />
accumulate basic units for theory generation. Categories are higher level<br />
abstractions <strong>of</strong> these concepts and provide the means whereby theory can be<br />
integrated. Propositions indicate general relationships between a category<br />
and its concepts, and between discrete categories. GT frequently involves<br />
analysis <strong>of</strong> texts, systematically searching for terms, statements and phrases<br />
in the content and classifying them with explanatory labels (Hansen et al.<br />
2005), so as to identify, name, categorize and describe phenomena (Glaser et<br />
al. 1967).<br />
Theoretical sensitivity, a cornerstone <strong>of</strong> GT, is defined by Glaser<br />
(1978) as the personal insight with which a researcher approaches a research<br />
situation. Such insight should be conceptual rather than concrete. It<br />
represents the creative aspect <strong>of</strong> the GTM, and through such theoretical<br />
sensitivity, the researcher becomes able to recognise important data, and to<br />
filter it from the particular to the more general or abstract. Recognizing and<br />
continually challenging his or her personal theories and biases against the<br />
data (known as GT’s constant comparison method) provides a way to<br />
consolidate, but also to manage, theoretical sensitivity.<br />
Open coding employs theoretical sensitivity and is hermeneutic, i.e.<br />
an interpretive act by the researcher. During initial analytical reading, firstattempt<br />
labels are assigned to sections <strong>of</strong> text. The process <strong>of</strong> constant<br />
comparison and re-reading results in certain labels being renamed, others<br />
being refined, and ‘in-vivo’ re-structuring whereby duplicates are eliminated<br />
and text fragments with the same meaning are assigned the same label. Such<br />
thematic analysis involves the search for, and identification <strong>of</strong>, common<br />
threads that extend throughout the data.<br />
Axial Coding<br />
The purpose <strong>of</strong> axial coding is a further pass through the data to discover<br />
categories into which the concepts can be classified, i.e. the data is<br />
reconstructed in different ways. The meanings behind concepts and<br />
categories are then compared in order to explain the material and<br />
relationships between concepts (Hansen et al. 2005). Axial coding is a<br />
370
Grounded Theory Integrated with Activity Theory …<br />
cornerstone <strong>of</strong> Strauss and Corbin’s (1998) approach, but is regarded by<br />
Charmaz (2006) as highly structured and optional. The ability to perceive<br />
variables and relationships is also part <strong>of</strong> the researcher’s theoretical<br />
sensitivity and can be enhanced by the use <strong>of</strong> appropriate techniques<br />
(Strauss et al. 1990), including automated tools for qualitative analysis.<br />
In iterative comparison, it may be necessary to shuttle between open<br />
and axial coding and to move between levels <strong>of</strong> abstraction to make<br />
adjustments. This ensures that important data is not unintentionally<br />
discarded, and also assists in making sense <strong>of</strong> the data. Glaser and Strauss<br />
(1977) warn that meaningless data should not be fitted to concepts or<br />
categories, but should be disqualified.<br />
Selective Coding<br />
Selective coding is the process <strong>of</strong> choosing one category as the core<br />
category, and relating all other categories to it (Strauss et al. 1990). This<br />
category is intended to act as a guide for further data collection and analysis<br />
in order to build the theoretical framework (Glaser, 1978). The essential idea<br />
is to develop a single storyline around which all else is draped. Such a core<br />
category almost always exists (Strauss et al. 1990) and is typically identified<br />
as the category that is mentioned with highest frequency and is well<br />
connected to other categories. In a full GTM, one would typically cease<br />
coding text that does not relate to the core category and would collect more<br />
data on it, as well as on its connected categories and properties en route to<br />
building a theory.<br />
Theoretical Sampling<br />
Theoretical sampling is the process <strong>of</strong> literal and theoretical replication.<br />
New cases are selected and the process is repeated until theoretical<br />
saturation occurs. The purpose is to confirm, extend and sharpen the<br />
theoretical framework (Yin 1994). The process ends when improvements are<br />
marginal.<br />
Activity Theory<br />
Activity Theory (Vygotsky 1978; Leontjev 1978, 1981; Engeström 1987;<br />
Cole & Engeström 1994) is a particularly suitable theoretical framework<br />
371
Mc Donald van der Merwe & Ruth de Villiers<br />
when context is central to the research. Kuutti (1995) discusses the potential<br />
<strong>of</strong> AT for research into human-computer interaction (HCI), proposing it as a<br />
framework for HCI research and design. In AT, the basic unit <strong>of</strong> analysis is<br />
human activity (work). In simple terms, an activity is defined as the<br />
engagement <strong>of</strong> a subject toward a certain goal or objective. An activity is<br />
undertaken by a human agent (subject) who is motivated toward the solution<br />
<strong>of</strong> a problem or purpose (object), and mediated by tools (artifacts) in<br />
collaboration (roles) with others (community). The structure <strong>of</strong> the activity<br />
is constrained by contextual cultural factors including conventions (rules)<br />
and social strata (division <strong>of</strong> labour) (Ryder 1999).<br />
Each activity performed by the subject is analyzed as part <strong>of</strong> the<br />
collective Activity System and within the social-cultural context <strong>of</strong> both the<br />
individual and the collective. In order to make sense <strong>of</strong> the system, a shared<br />
understanding is required <strong>of</strong>: the character and history <strong>of</strong> the subject; the<br />
object that the individual is trying to attain; characteristics <strong>of</strong> the<br />
community; and the tools available to the subject. In the process <strong>of</strong> the<br />
object changing, all the other components adopt new perspectives, and a<br />
new Activity System is born. The components <strong>of</strong> such systems are not static<br />
components existing in isolation. They interact reciprocally and, in this way,<br />
are reciprocally constituted through mutual interactions within the Activity<br />
System. Figure 1 shows this tri-stratal representation <strong>of</strong> social activity.<br />
An examination <strong>of</strong> any phenomenon must consider the dynamics<br />
between its components. Data analysis should therefore be conducted within<br />
the context <strong>of</strong> the tri-stratal framework to ensure understanding <strong>of</strong> the<br />
activities, actions and operations performed by the subjects, and reveal their<br />
motives, goals and instrumental conditions.<br />
It is important to note that AT is a broad conceptual framework and<br />
not a theory in the strict sense. It consists <strong>of</strong> a set <strong>of</strong> basic principles which<br />
constitute a general conceptual system that can be integrated with more<br />
specific theories, such as GT. One <strong>of</strong> Engeström’s (1987) original<br />
motivations for using GT was to allow researchers to identify the inner<br />
contradictions that impose tensions and instability on participants’ settings<br />
and help them change the nature <strong>of</strong> an activity to overcome those tensions.<br />
The identification <strong>of</strong> tensions provides an indication <strong>of</strong> the stability or<br />
instability <strong>of</strong> the Activity System. If there are no tensions, there are no<br />
contradictions and the nature <strong>of</strong> an activity need not change.<br />
372
Grounded Theory Integrated with Activity Theory …<br />
Figure 1: The tri-stratal framework <strong>of</strong> Activity Theory (Ryder 1999)<br />
Having introduced the essential foundations, we now focus on<br />
reconstructing how we arrived at the exact analytic processes followed in the<br />
base study, with specific reference to our adapted GTM steps and the use <strong>of</strong><br />
AT to determine the nature <strong>of</strong> relationships between categories/ concepts.<br />
Overview <strong>of</strong> the Base Study<br />
Purpose and Context<br />
In reconceptualising Continuous Pr<strong>of</strong>essional Development (CPD) for<br />
school teachers, Smiley and Conyers (1991), call for a paradigm shift from<br />
learning separately and learning through replication (static learning) to<br />
learning together and practicing (interactive learning). Teachers are <strong>of</strong>ten<br />
isolated from peers in their discipline, whereas they could benefit from<br />
mutual engagement in inquiry and reflection (Barnett 1998; Clandinin &<br />
Connely 1995; Stein, Smith & Silver 1999). Interactive communication with<br />
colleagues and the exchange <strong>of</strong> knowledge and ideas is the conceptual<br />
backbone <strong>of</strong> this paradigm shift, and one very common research route<br />
focuses on the use <strong>of</strong> online discussion forums to create virtual communities<br />
<strong>of</strong> practice.<br />
373
Mc Donald van der Merwe & Ruth de Villiers<br />
The van der Merwe et al. (2008) study aimed to discover personal<br />
and situational factors (or tensions) that impact on the value and practical<br />
use <strong>of</strong> a mathematics-friendly online discussion forum environment<br />
(ODEM) as a reflective tool in pursuit <strong>of</strong> the CPD <strong>of</strong> Grade 5-7 mathematics<br />
teachers in the South African context <strong>of</strong> disparities. Participating teachers<br />
came from both a (previously) disadvantaged group and a (previously)<br />
advantaged group. The primary foci <strong>of</strong> this base study were to discover<br />
tensions that occurred and impacted on the use <strong>of</strong> the ODEM in the CPD<br />
educational process <strong>of</strong> the two different sub-communities, and to understand<br />
the differences (if any) between the groups. Findings would serve to ensure<br />
that future on-line CPD strategies are more directed and purposeful. The<br />
base study therefore lies in the application area <strong>of</strong> mathematics education,<br />
with a focus area <strong>of</strong> e-learning, due to the use <strong>of</strong> an online discussion forum<br />
as a communication tool.<br />
To support the study, personal computers (PC’s) and home Internet<br />
connections were provided to both groups <strong>of</strong> disadvantaged and advantaged<br />
teachers. The selected teachers were already active participants in cluster<br />
meetings, and therefore intrinsically motivated towards CPD opportunities.<br />
Twenty teachers (ten from each group) were tasked to visit the ODEM on a<br />
regular basis and to reflect and share on their classroom practises within<br />
separate discussion forums, thereby providing opportunities for collegial<br />
interaction and the exchange <strong>of</strong> knowledge and ideas. Prior to this venture,<br />
few teachers and schools – particularly from disadvantaged communities –<br />
owned or had access to PC’s and the Internet. The cost associated with the<br />
provision <strong>of</strong> hardware and access necessitated small samples, which also<br />
hindered replication <strong>of</strong> datasets and use <strong>of</strong> the full GTM.<br />
Of the twenty teachers, only sixteen were successfully connected<br />
and able to participate. In order to effect a meaningful investigation, a fitting<br />
research design and associated methodology was required. The research<br />
approach, which was based on particular philosophical stances, dictated the<br />
design and methodology adopted. These are outlined in the next section.<br />
Philosophical Perspective<br />
It was clear from the outset that context was important. The focus <strong>of</strong> the<br />
research was on human activities within the context-specific settings <strong>of</strong><br />
advantaged and disadvantaged communities, and how these actions were<br />
374
Grounded Theory Integrated with Activity Theory …<br />
influenced by their settings. Human activity should be studied in its real-life<br />
situation (Marshall & Rossman 2006), and the study therefore adopted the<br />
qualitative research paradigm.<br />
Since the study aimed to understand the context <strong>of</strong> implementation<br />
<strong>of</strong> a computing system and the processes whereby its use and value were<br />
influenced by said context, an interpretive perspective was selected as the<br />
philosophical foundation. The philosophical basis <strong>of</strong> interpretive research is<br />
hermeneutics and phenomenology (Boland 1985), which neatly tied the<br />
selected philosophical approach to the qualitative ethos <strong>of</strong> the study.<br />
The next chronological decision was the selection <strong>of</strong> appropriate<br />
research method(s) to employ.<br />
Research Design and Methods<br />
Following on the preceding theoretical overviews <strong>of</strong> Grounded Theory and<br />
Activity Theory, this section outlines their application in the base study. The<br />
actual implementation and adaptation <strong>of</strong> the techniques is addressed in more<br />
detail in the section on data collection and analysis.<br />
Various qualitative and interpretive research methods were<br />
investigated, using a framework proposed by Van der Merwe (not the<br />
present author), Kotze and Cronje (2005), which matches the research<br />
questions <strong>of</strong> a study against the key elements <strong>of</strong> qualitative research<br />
paradigms. In the case <strong>of</strong> the base study, these questions related to<br />
identifying tensions in each group <strong>of</strong> participants and contrasting these<br />
differences. The study was found to fall within the ambit <strong>of</strong> Grounded<br />
Theory- (GT), Activity Theory- (AT), or Case Study methods and it was<br />
decided to use aspects <strong>of</strong> all three. The next subsection describe the role <strong>of</strong><br />
AT and a partial GT approach (Strauss & Corbin 1990), as applied to the<br />
particular cases in the base study.<br />
Case studies involve examination <strong>of</strong> specific phenomena (such as<br />
programmes, events, processes, institutions or groups) in their real-world<br />
contexts, by presenting detailed information about the phenomena,<br />
frequently including accounts by the subject/s themselves (Merriam 1988;<br />
Yin 1984; 1988). Tellis (1997) advocates that the researcher should<br />
personally work with the situation in each case. In the base study, there were<br />
two distinct types <strong>of</strong> case, polar types, presented by the advantaged and<br />
disadvantaged groups, respectively, with sampling-logic rather than<br />
375
Mc Donald van der Merwe & Ruth de Villiers<br />
replication defining the cases. The study followed Yin’s (2002) interpretive,<br />
revelatory single-case approach in each <strong>of</strong> the two distinct communities. To<br />
identify the tensions in each, a detailed within-case, write-up approach was<br />
followed, in order to become ‘intimately familiar with each case as a standalone<br />
entity’ (Eisenhardt 1989:540) before generalization <strong>of</strong> patterns could<br />
occur across the two cases.<br />
Grounded Theory and Activity Theory, as Used in the Base Study<br />
Previous sections introduced essential foundations <strong>of</strong> GTM and AT. This<br />
section describes their joint use in the context <strong>of</strong> the cases in the base study.<br />
We have mentioned applications <strong>of</strong> GT in educational research, and a strong<br />
motive for pursuing GTM in this study is its suitability for research in adult<br />
education which, according to Babchuk (1996), is characterized by a strong<br />
commitment to the real world <strong>of</strong> practice but lacks well-developed<br />
theoretical foundations. Furthermore, Preece, Rogers and Sharpe (2007<br />
citing Sarker 2001), describe the application <strong>of</strong> GT as a research approach<br />
for analysing an interactive discussion forum<br />
The selection <strong>of</strong> a single repeated-case approach in two distinct<br />
communities <strong>of</strong>fered little potential for theory building. As Eisenhardt<br />
(1989) posits, with fewer than four cases, the empirical grounding is likely<br />
to be unconvincing – unless a case contains several subcases, which may<br />
<strong>of</strong>fer an even deeper understanding <strong>of</strong> processes and outcomes and a sound<br />
picture <strong>of</strong> locally grounded causality (Miles & Hubermann 1994). In order to<br />
arrive at convincing theoretical concepts, the identification <strong>of</strong> embedded<br />
subcases was a necessary objective. This is elaborated in the data analysis<br />
section, where it is shown how Activity Systems were used to define<br />
contextual units <strong>of</strong> analysis (or Activity Systems) in the base study.<br />
The base study centred on the properties <strong>of</strong> units – where the units<br />
were: a disadvantaged group; an advantaged group; the tensions within each<br />
group as it uses the ODEM; and the value they obtain from the ODEM. As<br />
Glaser (1978) points out, properties <strong>of</strong> a unit are more relevant to<br />
descriptive qualitative studies, while properties <strong>of</strong> a process are more<br />
relevant to studies aiming at theoretical conceptualization. This meant that<br />
the GT-method used here, is similar to that in Chow’s (1998) qualitative<br />
descriptive study, which had GT overtones by its employment <strong>of</strong> GTtechniques<br />
but without theory generation.<br />
376
Grounded Theory Integrated with Activity Theory …<br />
The use <strong>of</strong> selected GT techniques only, thus seemed an appropriate<br />
choice for investigating and analysing data. In particular, Strauss and<br />
Corbin’s (1990) ‘partial’ GMT approach is relevant, whereby emerging<br />
theory is not induced in an iterative manner. Although Strauss and Corbin<br />
(1990) acknowledge shortfalls in the partial approach, this paper suggests<br />
ways <strong>of</strong> using the GTM in line with Charmaz’s (2006) flexible, rather than<br />
strict methodological, approach.<br />
Barab, Schatz and Scheckler (2004) make the point that, while it is<br />
common for educational-technology researchers to publish studies reporting<br />
the nature <strong>of</strong> systems in terms <strong>of</strong> a unitary, coherent, and refined entity, the<br />
same researchers fail to portray and acknowledge the complex human and<br />
other dynamics that characterise the development and usage <strong>of</strong> a system. In<br />
their classic work on qualitative data analysis, Miles and Huberman (1994)<br />
suggest that the methods they present should not be applied scrupulously.<br />
Instead, the creation, testing and revision <strong>of</strong> simple, practical and effective<br />
analysis methods remain the highest priority for qualitative researchers.<br />
Mindful <strong>of</strong> the criticism levelled at partial GT-methods and the<br />
limitations <strong>of</strong> single case study designs, it was necessary to maximise the<br />
context-analytic possibilities inherent in the base study and to do so by data<br />
triangulation, which means using different sources <strong>of</strong> data.<br />
In concurring with these viewpoints, the study applied selected<br />
techniques <strong>of</strong> both partial GTM and AT in a case study context, but<br />
structured and adapted to effect credible results. A further way in which<br />
theoretical credibility can be achieved, is through interactions between<br />
elements <strong>of</strong> GT and AT, leading to theoretical triangulation, which, in its<br />
simplest terms, means analyzing the same set <strong>of</strong> data from multiple<br />
perspectives. Annels (2006) notes that different research approaches can be<br />
creatively and successfully used in one study if there has been adequate<br />
consideration <strong>of</strong> vital factors that determine whether there is a good 'fit' <strong>of</strong><br />
the approaches, not only with the research problems and questions, but also<br />
with each other, while maintaining the integrity <strong>of</strong> techniques. The use in<br />
this study <strong>of</strong> Activity Theory within a partial GT methodology attempts not<br />
only to address shortcomings, but also to fill gaps created by the use <strong>of</strong><br />
selected GT-techniques only.<br />
Finally, Thorne, Reimer Kirkham and O’Flynn-Magee (2004)<br />
describe interpretive description as a coherent conceptual description that<br />
taps thematic patterns and commonalities which characterize the<br />
377
Mc Donald van der Merwe & Ruth de Villiers<br />
phenomenon under investigation and that also accounts for the inevitable<br />
individual variations. This description accurately fits the research focus <strong>of</strong><br />
the base study. The base study thus adopted a revelatory, interpretive and<br />
descriptive approach to the two single cases under investigation. The next<br />
section summarizes the data collection phase, followed by a detailed report<br />
<strong>of</strong> the exact analytical processes followed.<br />
Data Collection and Analysis<br />
Having motivated the methods selected and adapted, the subsections on data<br />
collection and data analysis provide a walk-through <strong>of</strong> how the methods<br />
were used, thereby presenting a situated introduction to the framework<br />
presented at the end <strong>of</strong> this paper.<br />
Data Collection<br />
Data was collected from semi-structured interviews, forum posts, server<br />
logs, teacher journals, the primary author’s own research journal and a focus<br />
questionnaire, thereby providing multiple perspectives and ensuring<br />
triangulation <strong>of</strong> data (Glaser et al. 1967; Orlikowski 1993; Pandit 1996).<br />
Primary data sources in the first phase <strong>of</strong> analysis were interview<br />
data and journals kept by teachers and the researcher. Forum posts and<br />
server-logs data were used to confirm or deny concepts and tensions<br />
discovered. GTM-type memos were kept throughout the analysis, as<br />
subsequent data collection.<br />
Parry (1998) advises the use <strong>of</strong> computer s<strong>of</strong>tware to maintain and<br />
analyse data in scientific grounded theory research. With the exception <strong>of</strong><br />
server logs, all the data was transcribed and fed into the Atlas-ti s<strong>of</strong>tware<br />
package, which is a powerful workbench for qualitative analysis <strong>of</strong> large<br />
bodies <strong>of</strong> textual data (see http://www.atlasti.com). It contains tools for<br />
accomplishing various tasks associated with systematic approaches to ‘s<strong>of</strong>t<br />
data’. After hermeneutic units had been created, including all the data from<br />
the two groups, respectively, formal data analysis commenced.<br />
Open Coding<br />
In order to indentify emerging concepts from the data, the GT technique <strong>of</strong><br />
open coding was employed. Within the Atlas-ti environment, the transcribed<br />
378
Grounded Theory Integrated with Activity Theory …<br />
texts were analysed manually, line by line, searching for different words in<br />
the statements and classifying part-statements with labels to explain the<br />
meanings <strong>of</strong> the different parts (Hansen et al. 2005). This process was<br />
concerned with identifying, naming, categorizing and describing phenomena<br />
in the text (Glaser et al. 1967). As in all GTM research, the research results<br />
were emergent that is no preconceived theory existed about possible<br />
tensions. An open strategy (Creswell 1998) was followed. During initial<br />
reading, first-attempt labels were assigned to sections <strong>of</strong> text. In a process <strong>of</strong><br />
constant comparison, texts were re-read several times, leading to re-naming<br />
<strong>of</strong> some labels, refinement <strong>of</strong> others, and assignment <strong>of</strong> the same label to<br />
texts that had very similar meanings.<br />
Cole and Knowles (2001) posit that the analytical process required<br />
in contextual research is not one <strong>of</strong> dissection but one <strong>of</strong> immersion,<br />
rationality and intuition. They suggest that: ‘We become surrounded and<br />
washed by the material, we bathe in it, live it, and breathe it. Like getting to<br />
know a good friend, because we have spent so much time together and come<br />
to know so much about her, eventually we begin to think, just a little, like<br />
her’ (Cole & Knowles 2001:106).<br />
This accurately portrayed the base study, as concepts or themes rose<br />
to the surface from deep inside the data (Neuman 2003). For example, it<br />
became apparent that some <strong>of</strong> the labels could be categorized into a concept<br />
termed ‘Township- 1<br />
related problems’. This related to the unique kind <strong>of</strong><br />
problems experienced by disadvantaged teachers as a direct consequence <strong>of</strong><br />
the crowded township environment they work and live in, and which in<br />
instances negatively impacted on their participation in the ODEM.<br />
On completion <strong>of</strong> the open coding phase, focused questionnaires<br />
were used to confirm certain themes that emerged and to supplement<br />
incomplete information. Several concepts were discovered in this manner,<br />
initiating the next step in data analysis – the GTM-technique <strong>of</strong> axial<br />
coding.<br />
1<br />
Townships are sub-urban residential areas established in the apartheid area<br />
on the periphery <strong>of</strong> white towns and cities – close enough to work in white<br />
areas but distant enough to ensure separate development.<br />
379
Mc Donald van der Merwe & Ruth de Villiers<br />
Axial Coding<br />
In a further pass through the data, categories were discovered and concepts<br />
were classified. This supported the researcher in better understanding the<br />
information and identifying relationships between concepts.<br />
The Network View Manager in Atlas-ti was used to develop<br />
preliminary categories by grouping concepts with similar meanings. Once<br />
again, the researcher’s theoretical sensitivity was employed. Figure 2<br />
combines three screenshots from the Network View Manager that visually<br />
represent the open and axial coding processes <strong>of</strong> the disadvantaged group at<br />
a certain stage.<br />
The text segment marked A comprises two lines <strong>of</strong> text from a<br />
transcribed interview. It was initially labelled differently, but was renamed<br />
‘township problems’ when a concept termed ‘problems related to township<br />
life’ emerged from the data.<br />
B represents a screenshot <strong>of</strong> an extract from a drop-down list<br />
containing links to all the transcribed text that was related to the concept<br />
‘township problems’. C shows this concept, ‘Township problems’, grouped<br />
along with several other concepts such as ‘no study’, ‘transport problems’,<br />
‘busy family life’, etc. These were placed in a category called ‘Preventative<br />
issues’ (D), to contain issues that hindered teachers from optimal<br />
participation in the ODEM. Moving from A through to D therefore presents<br />
increasingly abstract representations <strong>of</strong> the data collected. Several other<br />
categories were discovered in this way. E shows a screen shot <strong>of</strong> the<br />
‘Positive participation effects’ category and its concepts.<br />
Grounded theorists seldom return to earlier text to code newly<br />
discovered categories. However, in the process <strong>of</strong> discovering new<br />
categories, the researcher became more sensitized to the emerging view, and<br />
revisited the original data regularly to check whether the initial coding was<br />
too narrow or too broad. Glaser and Strauss (1977) caution that meaningless<br />
data should not be refitted to concepts or categories, but should be<br />
disqualified. In this manner, from a total <strong>of</strong> 870 codes initially generated for<br />
the two cases together, 441 were used and the rest discarded.<br />
Atlas-ti’s Network Manager simplifies forwards-and-backwards<br />
mobility between various levels <strong>of</strong> abstraction to make adjustments where<br />
necessary. For example, clicking on any concept C opens the associated<br />
drop-down list B, and clicking any <strong>of</strong> the text lines in B transports one<br />
directly to the original transcribed and labelled text A. Such constant shutt-<br />
380
Grounded Theory Integrated with Activity Theory …<br />
Figure 2: Open- and axial-coding: Atlas-ti Network View Manager<br />
Snapshots<br />
381
Mc Donald van der Merwe & Ruth de Villiers<br />
ling between open and axial coding ensures that important data is not<br />
unintentionally discarded, and also assists in making sense <strong>of</strong> the data. For<br />
example, the text, ‘Yes, I came across people who wanted to kill me’ in A<br />
should not be viewed in isolation from the preceding or following text in the<br />
hermeneutic unit. The respondent simply meant that some bad guys were<br />
after him – not necessarily to kill him. The shuttling process is time<br />
consuming but, as the foundation <strong>of</strong> data analysis, it cannot be otherwise.<br />
Selective Coding<br />
The next chronological step in GTM is selective coding, in which a single<br />
category is chosen as the core category, and all other categories are related<br />
to it (Strauss et al. 1990). At this point, researchers would cease coding text<br />
that does not relate to the core. For the purpose <strong>of</strong> theory building, they<br />
would collect more data on the core, as well as on its related categories and<br />
properties. Due to the Partial GT approach and the single cases in the base<br />
study, this was not possible and, at this point, we moved towards Activity<br />
Theory. Rather than choosing one category as the core category, the<br />
technique <strong>of</strong> selective coding was adapted by forming new ‘supercategories’<br />
to serve as containers (or classes) for related categories. Table 1<br />
provides a condensed view <strong>of</strong> the disadvantaged group classes (underlined in<br />
the table) and their related categories, as they emerged from the open, axial<br />
and adapted selective coding processes.<br />
The class<br />
Connecting to the ODEM was created from categories<br />
related to the provision <strong>of</strong> and access to an Internet-ready computer, as well<br />
as the ability to successfully connect to the ODEM in order to participate 2 .<br />
The class Using the ODEM was created from categories that are selfdescriptive,<br />
such as Preventative factors, Negative participation effects,<br />
Motivation for participation, and so forth 3 . Some category concepts fitted in<br />
both these classes, and were thus placed in a Shared class. The Asked class<br />
existed because <strong>of</strong> specific questions that were posed during the semistructured<br />
interviews and the focus questionnaire.<br />
2 For various reasons, the disadvantaged teachers experienced a variety <strong>of</strong><br />
problems in connecting to the Internet and the ODEM.<br />
3 These impacted on the use <strong>of</strong> the ODEM by teachers<br />
382
Grounded Theory Integrated with Activity Theory …<br />
Table 1: Category and Class view <strong>of</strong> disadvantaged data<br />
CLASSES CATEGORIES<br />
Connecting to the ODEM Connecting to ODEM (8:23)<br />
Shared<br />
Using the ODEM<br />
Asked<br />
Support required (5:19)<br />
Financial factors (3:13<br />
Preventative factors (11:46)<br />
Negative participation effects (9:25)<br />
Positive participation effects 14:(36)<br />
Suggestions (11:13)<br />
Training (4:17)<br />
Value <strong>of</strong> ODEM (5:25)<br />
Personal characteristics (7:15)<br />
Ease <strong>of</strong> use (7:15)<br />
Other use <strong>of</strong> PC than for ODEM<br />
(3:11)<br />
Motivation for participation (4:5)<br />
Point <strong>of</strong> access 4:7)<br />
ODEM vs. Cluster (3:10)<br />
Subject Advisor required (9:16)<br />
Content vs. reflection (7:11)<br />
PC literacy (7:25)<br />
Cross-cultural (3:7)<br />
Key: Figures in brackets (the number <strong>of</strong> concepts associated with the<br />
category: total number <strong>of</strong> codes associated with the concepts in that<br />
category)<br />
For example, teachers were asked whether they preferred access to<br />
the ODEM from home or from school. The category Point <strong>of</strong> Access was in<br />
fact not discovered during open coding, but was nevertheless labelled to<br />
assist the interpretation phase. The classes identified can be viewed as<br />
subcases. Two classes are explicit: Connecting to the ODEM and Using the<br />
ODEM. The Shared and Asked classes, in this instance, provide supporting<br />
evidence.<br />
The shift away from the pure GT technique <strong>of</strong> selective coding is<br />
significant in the context <strong>of</strong> this paper, since it firmly positions the research<br />
383
Mc Donald van der Merwe & Ruth de Villiers<br />
approach as a Partial GTM. In the next sections, some shortfalls <strong>of</strong> the<br />
partial GTM are addressed, namely the: (i) absence <strong>of</strong> an explainable<br />
analytic process by which concepts are built up to higher levels <strong>of</strong><br />
abstraction, and (ii) the failure to determine the nature <strong>of</strong> relationships<br />
between categories/concepts.<br />
As a starting point, the two explicit classes identified in Table 4 can<br />
be viewed as subcases, or, from an Activity Theory perspective, ‘Activity<br />
Systems’.<br />
Subcases as Activity Systems<br />
Figure 3 represents a specific instance <strong>of</strong> the generic diagram in Figure 1. It<br />
graphically depicts the subcase Connecting to the ODEM for the<br />
Disadvantaged group as an Activity System.<br />
Consider the act <strong>of</strong> a teacher wanting to participate in the ODEM.<br />
Connecting to the ODEM via the Internet can be considered an Activity<br />
System, where the subject is a mathematics teacher; the object is an Internet<br />
connection with the goal <strong>of</strong> participation in the ODEM; and the community<br />
is disadvantaged. The tool is an Internet-ready personal computer; rules are<br />
that teachers must connect to the Internet and visit their respective forums to<br />
reflect on their practise and respond to other teachers’ reflections. The roles<br />
may be the telephone provider who should supply a clear and working<br />
telephone line; an Internet Service Provider to ensure Internet access; the<br />
researcher who must prepare Internet-ready computers, transfer funds for<br />
Internet-connection fees to teachers’ bank accounts, and provide support and<br />
training on the ODEM; the teacher who must pay connection fees and who<br />
must perform the activities defined in the rules. If the object is connecting to<br />
the ODEM but the Internet connection fees were not paid, no connection is<br />
possible and the object <strong>of</strong> the Activity System then becomes paying the fees,<br />
with the subsequent goal <strong>of</strong> a successful connection. In the process <strong>of</strong> the<br />
object changing, all the other components adopt new perspectives, allowing<br />
analysis in context.<br />
Accordingly, two Activity Systems existed:<br />
• Disadvantaged Activity System 1 (DAS1): Connecting to the<br />
ODEM; and<br />
• Disadvantaged Activity System 2 (DAS2): Using the ODEM.<br />
384
Grounded Theory Integrated with Activity Theory …<br />
Figure 3: The class Connecting to the ODEM represented as an Activity<br />
System<br />
Further analysis took place within each Activity System – ensuring<br />
context and understanding <strong>of</strong> the activities, actions and operations<br />
performed by the subjects, revealing their motives, goals and instrumental<br />
conditions. How further analysis was done was achieved through a process<br />
which can be called ‘Decomposition <strong>of</strong> Activity Systems phase’.<br />
Decomposition <strong>of</strong> Activity Systems Phase<br />
Decomposition, also not part <strong>of</strong> conventional GTM, occurred within the<br />
Activity Theory framework <strong>of</strong> subjects, rules, community, division <strong>of</strong> labour<br />
and the objects and goals by way <strong>of</strong> a chronological report in narrative<br />
format.<br />
385
Mc Donald van der Merwe & Ruth de Villiers<br />
As a first step, the collected (transcribed and not-transcribed, suchas<br />
server logs) data was interpreted by identifying and describing the Activity<br />
System’s components and possible tensions that existed in and between<br />
components. It required going back to the original transcribed text via the<br />
Activity System and its identified categories and concepts, using the<br />
demonstrated functionality <strong>of</strong> Atlas-ti Network Manager. This process is<br />
particularly suited to a storyline approach, where all the original data is put<br />
back together again in thick, rich descriptions that explicate the conceptual<br />
journey followed.<br />
To illustrate this process, it is appropriate to present an example.<br />
Consider the following two (compacted) rich descriptions. They relate to the<br />
community, but supported a subject tension labelled T3|DAS2: Lack <strong>of</strong><br />
Fervour (or Tension 3 in Disadvantaged Activity System 2, to indicate<br />
teachers’ lack <strong>of</strong> enthusiasm, eagerness and commitment, which impacted on<br />
the depth and level <strong>of</strong> their forum contributions):<br />
The townships schools are very difficult and you find that there are<br />
people who ... during breaks and during the lessons ... are selling<br />
these drugs to the learners. Most <strong>of</strong> the learners are coming late,<br />
especially for the first periods .... the problem which causes this I<br />
think is the government, because the government <strong>of</strong>ficials used to<br />
stand in front <strong>of</strong> the national TV and tell the learners there is<br />
nothing the teacher can do to you. So even if the siren is ringing ...<br />
they are just strolling.<br />
Teacher 4<br />
Then the other issue that I am afraid that needs to be addressed is the<br />
morale <strong>of</strong> the teachers, it's very, very low, they don't feel good they<br />
feel they are more or less powerless. In terms <strong>of</strong> discipline there is a<br />
big void that has come in between the learner and the teacher ...<br />
what is the boundary <strong>of</strong> the teacher? What is the boundary <strong>of</strong> the<br />
learner? Discipline is the problem. It's not the content itself.<br />
Teacher 1<br />
Content analysis and classification <strong>of</strong> postings on the forum, shown<br />
in Table 2(a) also lend themselves to rich qualitative study and the<br />
development <strong>of</strong> themes and patterns, which is strongly in line with GT. This<br />
386
Grounded Theory Integrated with Activity Theory …<br />
is also the case with initiation and response tallies (another data source),<br />
illustrated by Table 2(b).<br />
Relationships discovered in the qualitative data were strengthened<br />
by the parallel use <strong>of</strong> such data. For example, the tension T3|DAS2: Lack <strong>of</strong><br />
Fervour is strengthened with evidence from Tables 2(a) and 2(b), while<br />
another tension, T4|DAS2: Lack <strong>of</strong> Reflective Practises was partially<br />
confirmed with the evidence from Table 2(a).<br />
Decomposition was a revelatory process. As each additional<br />
category was decomposed, more insight was gained into previously<br />
decomposed categories. In this process, the author also made extensive use<br />
<strong>of</strong> the GT-technique <strong>of</strong> memo writing (on ideas that formed when processing<br />
the data). These memos became data for subsequent phases.<br />
These insights, in turn, forced regular revisits to the raw data in<br />
order to confirm and/or expand the evolving perceptions. Throughout the<br />
decomposition phase, tensions emerged which either explained or<br />
exaggerated previous tensions. The process ended when saturation was<br />
achieved, i.e. when all the apparent tensions within the data had been<br />
identified.<br />
In the pure GTM, a basic theoretical framework would have existed<br />
at this stage, to be followed by theoretical sampling, with the purpose <strong>of</strong><br />
confirming, extending and sharpening the theoretical framework. In that<br />
activity, there is literal and theoretical replication <strong>of</strong> the cases until<br />
theoretical saturation is reached. Given that this study had no explicit<br />
intention to develop grounded theory, these GTM activities were replaced by<br />
an interpretation phase using various perspectives, or data views.<br />
Table 2(a): Nature <strong>of</strong> posts by classification<br />
Nature <strong>of</strong> post Number <strong>of</strong><br />
Question – for clarification 6<br />
Question – for support 18<br />
Question – for a solution 5<br />
Response – agreeing 6<br />
Response – affirming 8<br />
Response – <strong>of</strong>fering 28<br />
Response – correcting 6<br />
387<br />
Total<br />
Percent<br />
29 26%<br />
49 43%
Mc Donald van der Merwe & Ruth de Villiers<br />
Response – no solution 1<br />
Positive statement<br />
Negative statement<br />
10<br />
2<br />
12 11%<br />
ODEM support 3 3 3%<br />
Descriptive reflection 4<br />
Dialogic reflection 11<br />
20 18%<br />
Critical reflection 5<br />
Totals 113 113 100%<br />
Table 2(b): Post and response patterns<br />
Participan<br />
t<br />
Started<br />
thread<br />
Own thread<br />
reply<br />
Response to<br />
other<br />
Total posts<br />
Teacher1 4 3 16 23<br />
Teacher2 0 0 2 2<br />
Teacher3 4 1 2 7<br />
Teacher4 2 1 4 7<br />
Teacher5 1 1 21 23<br />
Teacher6 3 0 7 10<br />
Teacher7 8 1 5 14<br />
Teacher8 0 0 0 0<br />
Teacher9 0 0 1 1<br />
Totals 22 7 58 87<br />
Interpretation Phase<br />
In the interpretation phase, the data and findings were reviewed from<br />
alternative perspectives. Cognisance was taken <strong>of</strong> the warning by Miles and<br />
Huberman (1994) that humans are not powerful processors <strong>of</strong> large amounts<br />
<strong>of</strong> information, and that they have a cognitive tendency to reduce complex<br />
information into selective and simplified configurations. The way in which<br />
information is displayed, plays an important role in the way it is extracted.<br />
Figure 4 shows their model representing interactions between data<br />
collection, reduction, display and conclusions.<br />
388
Grounded Theory Integrated with Activity Theory …<br />
This model proposes that, after data collection, the analyst should<br />
shuttle between reduction, display and drawing <strong>of</strong> conclusions, thereby<br />
preventing simplified and selective conclusions.<br />
Data collection<br />
Data reduction<br />
Figure 4: Components <strong>of</strong> Data Analysis: Interactive Model.<br />
(Miles and Huberman, 1994)<br />
In Table 3 the columns relate to the base study’s research questions<br />
(with some shared), and the rows to the Activity System components. This<br />
data view <strong>of</strong>fered a refreshingly new perspective <strong>of</strong> the tensions in the<br />
disadvantaged group that had not been evident in the decomposition phase.<br />
Interpretation <strong>of</strong> this data view led to discovery <strong>of</strong> the core tension,<br />
T12|DAS2: Leader required. It was core in that if this tension could be<br />
resolved, then most <strong>of</strong> the other tensions would be resolved too. This step is<br />
notably similar to the GT-technique <strong>of</strong> selective coding, the difference being<br />
‘core tensions’ in the base study, as opposed to ‘core categories’ in the<br />
GTM.<br />
These processes were repeated for the advantaged group, whereafter<br />
comparisons were made between the two groups. The goal, as described by<br />
Eisenhardt (1989), is to become intimately familiar with each case as a<br />
stand-alone entity (in-case), which allows its unique patterns to emerge<br />
before attempting to generalize patterns across cases. Moreover, it gives<br />
investigators a rich familiarity with the data from each case which, in turn,<br />
accelerates cross-case comparison. If the processes described here, were<br />
repeated with another disadvantaged group, then the research would have<br />
leaned towards a full GT method.<br />
389<br />
Data display<br />
Conclusions:<br />
drawing / verifying
Mc Donald van der Merwe & Ruth de Villiers<br />
Table 3: An Activity Theory and Research Questions Perspective <strong>of</strong><br />
Disadvantaged Tensions<br />
Table 4 provides a second data view example. It is based on Riel and<br />
Levin’s (1990) schematic framework for describing network communities,<br />
which was also used to develop the interview questionnaire. This view<br />
isolated features that correlated with successful patterns <strong>of</strong> network<br />
interaction, in- and between-case.<br />
390
Grounded Theory Integrated with Activity Theory …<br />
Other frameworks were employed to create further views, allowing<br />
rich, contextual cross-case comparisons.<br />
Table 4: Features and tensions comparison<br />
Structure Disadvantaged Group Advantaged Group<br />
Organization <strong>of</strong><br />
Network<br />
Size <strong>of</strong> groups 9 teachers, 8 active<br />
participants<br />
Physical location <strong>of</strong><br />
active teachers<br />
7 teachers from Mamelodi<br />
Township (middle to lower<br />
class)<br />
1 teacher from Ladium, an<br />
Indian community<br />
(higher to middle class)<br />
1 teacher from Pretoria<br />
Central (middle to lower class)<br />
391<br />
7 teachers, 5 active<br />
participants<br />
3 from Pretoria East (higher<br />
class)<br />
2 from Pretoria North (higher<br />
to middle class)<br />
1 from Pretoria Southwest<br />
(higher to middle class)<br />
Level <strong>of</strong> Education 7 Diplomas, 1 Degree 1 Diploma, 4 Degrees<br />
Common experience All active Cluster Meetings<br />
participants<br />
Grade 7-9 phase math<br />
teachers<br />
Level <strong>of</strong> PC/Internet<br />
Literacy<br />
Relationship to one<br />
another<br />
Network Task<br />
Organization<br />
(Activity)<br />
T9|DAS2: Training Required<br />
1 literate<br />
7 illiterate<br />
Horizontal Horizontal<br />
Reflect, exchange information,<br />
share ideas<br />
T4|DAS2: Lack <strong>of</strong> Reflective<br />
Practices<br />
T1|DAS2: What to Post<br />
T2|DAS2: Irregular<br />
Contributions<br />
All active Cluster Meetings<br />
participants<br />
Grade 7-9 phase math<br />
teachers<br />
4 literate<br />
1 illiterate<br />
Reflect, exchange information,<br />
share ideas<br />
T2|AAS1: Lack <strong>of</strong> Reflective<br />
Practices<br />
T1|AAS1: Starting Threads
Mc Donald van der Merwe & Ruth de Villiers<br />
Response<br />
Opportunities<br />
Response<br />
Obligations<br />
Coordination and<br />
evaluation<br />
T1|DAS1: Creating Internet<br />
Accounts<br />
T6|DAS2: A Busy Life<br />
T2|DAS1: Connection<br />
Problems<br />
T3|DAS1: Lack <strong>of</strong> Suitable<br />
Support Structures<br />
T5|DAS2: Financial Factors<br />
T7|DAS2: School/Township<br />
Related Issues<br />
T11|DAS2: Point <strong>of</strong> Access<br />
T8|DAS2: Quality <strong>of</strong><br />
Participation<br />
T10|DAS2: Lack <strong>of</strong> Motivation<br />
T3|DAS2: Lack <strong>of</strong> Fervour<br />
T9|DAS2: Training Required<br />
392<br />
T3|AAS1: Slow Connections<br />
T4|AAS1: A busy life<br />
T5|AAS1: Quality <strong>of</strong><br />
participation<br />
T7|AAS1: Substance required<br />
T12|DAS2: Leader Required T6|AAS1: Subject Advisor<br />
required<br />
Literature Comparison Phase<br />
In a full GT approach, an integral feature <strong>of</strong> theory building is comparison <strong>of</strong><br />
the emergent concepts, theory, or hypotheses with the extant literature. This<br />
involves reflection on what it is similar to, what it contradicts, and why. A<br />
key to this process is to consider a broad range <strong>of</strong> literature only when the<br />
new theory begins to emerge and not beforehand (Glaser 1992; de Villiers<br />
2005). In this manner the literature becomes an additional and equal source<br />
<strong>of</strong> data, as opposed to a constraint that may influence the coding and memoing<br />
processes.<br />
In the base study, the intention <strong>of</strong> this phase was to locate, confirm<br />
and/or disconfirm the evidence in the light <strong>of</strong> relevant literature.<br />
Outcome <strong>of</strong> the Base Study<br />
The previous phases, combining selected aspects <strong>of</strong> Grounded Theory and<br />
Activity Theory and applied in the particular context <strong>of</strong> the base study,<br />
provided a theoretical foundation <strong>of</strong> constructs that supported the
Grounded Theory Integrated with Activity Theory …<br />
development <strong>of</strong> a model to direct future online CPD-strategies for teachers<br />
(van der Merwe, van der Merwe & Venter 2010).<br />
In the present study, it furthermore supports the generation <strong>of</strong> a<br />
substantive generic conceptual framework that can be applied to data<br />
collection and analysis in other research studies in the South African context<br />
<strong>of</strong> disparities.<br />
A Framework to Integrate Partial Grounded Theory with<br />
Activity Theory<br />
In the introduction section, two main criticisms <strong>of</strong> a Partial Grounded<br />
Theory were noted, namely: the absence <strong>of</strong> an explainable analytic process<br />
by which concepts are built up to higher levels <strong>of</strong> abstraction, and a failure<br />
to determine the nature <strong>of</strong> relationships between categories or concepts. We<br />
attempted to address these criticisms by way <strong>of</strong> a detailed explanation that<br />
moved from the underlying philosophical assumptions, through research<br />
design, then on to data collection, followed by data analysis and the process<br />
<strong>of</strong> constructing relationships – the latter by using elements <strong>of</strong> GT within the<br />
theoretical framework <strong>of</strong> AT.<br />
Figure 5 summarizes these steps in a newly-synthesized generic<br />
framework that provides a roadmap <strong>of</strong> the analytical processes followed.<br />
The figure depicts the series <strong>of</strong> phases by blocks – some being blocks within<br />
container blocks – linked by connectors to indicate the progression.<br />
Input to the framework comes in the form <strong>of</strong> a hermeneutic unit<br />
containing raw data in textual format, which emanates from multiple data<br />
sources. The purpose <strong>of</strong> the first two phases – the standard GT-techniques <strong>of</strong><br />
open- and axial coding, respectively – is to open the data in each case. In<br />
phase 1, open coding is employed to identify concepts, while in phase 2,<br />
axial coding is used to discover categories from similar concepts.<br />
In phase 3, with the data now opened, we move away from GTtechniques<br />
to favour AT-techniques that allow us to reconstruct the opened<br />
data, i.e. put it together in new ways in order to make sense <strong>of</strong> it. Hence, in<br />
phase 3, instead <strong>of</strong> using the GT-technique <strong>of</strong> selective coding to identify the<br />
core category, related categories are grouped into classes. These classes can<br />
be viewed as subcases.<br />
393
Mc Donald van der Merwe & Ruth de Villiers<br />
Figure 5. A Framework to Integrate Grounded Theory and Activity<br />
Theory in Qualitative, Contextual Studies<br />
In phase 4, these subcases <strong>of</strong>fer contextual units <strong>of</strong> analysis, or<br />
Activity Systems, in which the opened data is reduced (or decomposed) by<br />
way <strong>of</strong> a rich narrative report. The classic AT framework <strong>of</strong> subjects, rules,<br />
community, division <strong>of</strong> labour, objects and goals, provides the necessary<br />
394
Grounded Theory Integrated with Activity Theory …<br />
scaffolding to decompose data in context. As indicated by the broken line<br />
connector from the 4 th phase back to the 1 st phase, the process is repeated for<br />
each additional polar case.<br />
In phase 5 – continuing with the AT-driven reconstruction (or<br />
modelling) process – decomposed and within-case data is interpreted and<br />
put together in new data views by mapping it to relevant theoretical<br />
frameworks, theory-perspectives and/or quantitative inputs. Where<br />
appropriate, new data views are constructed between-case to complement<br />
within-case views. These discrete perspectives aim to make sense <strong>of</strong> it all by<br />
maximizing the investigator's access to the evidence. The products (or<br />
findings) that emerge are theoretical constructs.<br />
In concluding and consolidating the reconstruction process, a 6 th<br />
phase, namely, literature comparison, is incorporated to strengthen the<br />
theoretical grounding <strong>of</strong> the findings. A secondary, but important, purpose<br />
<strong>of</strong> this phase is to avoid an over-emphasis on inductive reasoning, whereby<br />
theoretical sensitivity could be ignored in favour <strong>of</strong> ‘creativity’ that leads to<br />
‘retroduction’ or immersion into ‘alternative shaping <strong>of</strong> observation and<br />
explanation, rather than an ex post facto discovery <strong>of</strong> explanatory ideas’<br />
(Katz 1983: 133-134). It serves as a potential counter against premature<br />
closure and under-analysis <strong>of</strong> data associated with the Partial GTM. It<br />
allows the researcher to 'lift' ideas from the data and explain them<br />
theoretically, thus giving meaning to descriptions <strong>of</strong> the behaviour (Skodol-<br />
Wilson & Ambler-Hutchinson 1996). Literature comparison is a recognised<br />
GT-technique which, in this study, is incorporated with the<br />
reconstruction phases because it provides additional data sources within the<br />
AT focus.<br />
Following the reconstruction phases, the output in the form <strong>of</strong><br />
theoretical concepts that emerge from the integration <strong>of</strong> GT and AT, may be<br />
one or more <strong>of</strong> the following:<br />
• Themes or patterns that characterizes the activities within a<br />
particular domain;<br />
• Models <strong>of</strong> good practise in the domain;<br />
• New theoretical constructs;<br />
• Notable facts and relationships; and<br />
• Tentative predictions.<br />
395
Mc Donald van der Merwe & Ruth de Villiers<br />
The framework closely relates to what Yin (1984) refers to as<br />
embedded design, or multiple levels <strong>of</strong> analysis in a single study afforded by<br />
more than one unit <strong>of</strong> analysis. While this is a Partial GTM approach, it<br />
adheres to several essential standard GTM principles:<br />
• The use <strong>of</strong> multiple data sources: These sources converge on the<br />
same phenomenon, and have been termed ‘slices <strong>of</strong> data’ (Glaser et<br />
al. 1967). As a multifaceted approach, there are no limits to the<br />
techniques <strong>of</strong> data collection, the way they are used, nor the type <strong>of</strong><br />
data collected (Pandit 1996). Furthermore, the use <strong>of</strong> multiple data<br />
sources enhances construct validity and reliability (Yin 1989).<br />
• Triangulation across various data collection techniques: This is<br />
particularly beneficial in theory generation, since it provides<br />
multiple perspectives, supplies more information on emerging<br />
concepts, allows for cross-checking, and yields stronger<br />
substantiation <strong>of</strong> constructs (Orlikowski 1993).<br />
• The (optional) use <strong>of</strong> quantative data: Supplementary quantitative<br />
data provides a synergistic view <strong>of</strong> evidence (Pandit 1996).<br />
The framework presented in Figure 5 does not claim to generate<br />
‘theory’ in its truest sense. However, the activity <strong>of</strong> collapsing a single case<br />
into several distinct classes provides subcases that, when viewed and<br />
interpreted from the perspective <strong>of</strong> Activity Theory (via Activity Systems),<br />
<strong>of</strong>fer a deeper understanding <strong>of</strong> processes and outcomes <strong>of</strong> individual cases<br />
and a good picture <strong>of</strong> locally grounded causes, effect and especially context.<br />
In addition, the insight gained from combining various data views is<br />
accentuated by using different theoretical frameworks to create such views.<br />
To conclude it is apt to cite Van Maanen (1988), who states that<br />
qualitative authors desire to tell ‘tales <strong>of</strong> the field’ that convey:<br />
… their methodological rigor, but also methodological flexibility;<br />
their intimacy with - while maintaining their distance from - their<br />
subjects and data; and, their fidelity to the tenets <strong>of</strong> objective<br />
inquiry, but also their feeling for the persons and events they<br />
observed. In this endeavour, qualitative writers want their reports to<br />
be as true as science is commonly held to be, and yet as evocative as<br />
art is supposed to be (Van Maanen 1988:xviii).<br />
396
Grounded Theory Integrated with Activity Theory …<br />
In the Introduction and earlier in this section, we refer to Strauss and<br />
Corbin’s (1990) criticisms <strong>of</strong> partial approaches to GT. Our proposed<br />
framework overcomes the shortfalls in that, first, a systematic and<br />
explainable process is presented by which concepts are constructed on<br />
various levels <strong>of</strong> abstraction and, second, relationships between categories<br />
are explicated and emphasized. We suggest that the framework provides a<br />
Partial GT-approach, yet with methodological rigour and flexibility. This, in<br />
turn, is synergistically enhanced by integration with the lens <strong>of</strong> AT intimacy<br />
that produces a level <strong>of</strong> theoretical credibility not normally associated with<br />
either the partial GTM or single case studies.<br />
References<br />
Annels, M 2006. Triangulation <strong>of</strong> Qualitative Approaches: Hermeneutical<br />
Phenomenology and Grounded Theory. <strong>Journal</strong> <strong>of</strong> Advanced Nursing<br />
56,1: 51-61.<br />
Babchuk, WA 1996. Glaser or Strauss? Grounded Theory and Adult<br />
Education. In Dirkx, JM (ed): Proceedings <strong>of</strong> the 15th Annual Midwest<br />
Research-to-Practice Conference in Adult, Continuing, and Community<br />
Education. Lincoln, Nebraska: <strong>University</strong> <strong>of</strong> Nebraska.<br />
Babchuk, WA 1997. The Rediscovery <strong>of</strong> Grounded Theory: Strategies for<br />
Qualitative Research in Adult Education. Doctoral dissertation. Lincoln,<br />
Nebraska: <strong>University</strong> <strong>of</strong> Nebraska.<br />
Barab, SA, M Barnett, L Yamagata-Lynch, K Squire, & T Keating 2002.<br />
Using Activity Theory to Understand the Contradictions Characterizing<br />
a Technology-rich Introductory Astronomy Course. Mind, Culture, and<br />
Activity 9,2:76-107.<br />
Barab, SA, S Schatz & R Scheckler 2004. Using Activity Theory to<br />
Conceptualize Online Community and Using Online Community to<br />
Conceptualize Activity Theory. Mind Culture and Activity 11,1: 25-47.<br />
Barnett, C 1998. Mathematics Teaching Cases as a Catalyst for Informed<br />
Strategy. Teaching and Teacher Education 14,1: 89-93.<br />
Blasé, JJ 1982. A Social-psychological Grounded Theory <strong>of</strong> Teachers Stress<br />
and Burnout. Education Administration Quarterly 18,4: 93-113.<br />
Boland, R 1985. Phenomenology: A Preferred Approach to Research in<br />
Information System. In Mumford, E, RA Hirschheim, G Fitzgerald & T<br />
397
Mc Donald van der Merwe & Ruth de Villiers<br />
WoodHarper (eds): Research Methods in Information Systems.<br />
Amsterdam: North Holland.<br />
Barbour, RS 2001. Checklists for Improving Rigour in Qualitative Research:<br />
A Case <strong>of</strong> the Tail Wagging the Dog? BMJ 322:1115-1117<br />
Bryman, A & RA Burgess 1994. Analyzing Qualitative Data. London:<br />
Routledge.<br />
Charmaz, K 2006. Constructing Grounded Theory: A Practical Guide<br />
Through Qualitative Analysis. Thousand Oaks, CA: Sage Publications.<br />
Chow, S 1998. Speciality Group Differences Over Tonsillectomy:<br />
Pediatricians versus Otolaryngologists. Qualitative Health Research 8:<br />
61-75.<br />
Clandinin, DJ & FM Connely 1995. Teachers' Pr<strong>of</strong>essional Knowledge<br />
Landscapes. NY: Teachers College Press.<br />
Cole, AL & G Knowles 2001. Lives in Context: The Art <strong>of</strong> Life History<br />
Research. Walnut Creek, CA: Rowman Altamira Press.<br />
Cole, M & Y Engestrom 1993. A Cultural-historical Approach to<br />
Distributed Cognition. In Salomon, G (ed): Distributed Cognitions:<br />
Psychological and Educational Considerations. Cambridge: Cambridge<br />
<strong>University</strong> Press.<br />
Conrad, CF 1978. A Grounded Theory <strong>of</strong> Academic Change. Sociology <strong>of</strong><br />
Education 51: 110-112.<br />
Courtney, S, LR Jha & WA Babchuk 1994. Like School? A Grounded<br />
Theory <strong>of</strong> Life in an ABE/GED Classroom. Adult Basic Education 4,3:<br />
172-195.<br />
Creswell, JW 2003. Qualitative, Quantitative, and Mixed Methods<br />
Approaches. 2 nd Edition. Thousand Oaks, CA: Sage.<br />
Creswell, JW 1998. Qualitative Inquiry and Research Design. Thousand<br />
Oaks, CA: Sage.<br />
De Villiers, MR 2005. Interpretive Research Models for Informatics: Action<br />
Research, Grounded Theory, and the Family <strong>of</strong> Design- and<br />
Development Research. <strong>Alternation</strong> 12,2: 10-52.<br />
Eisenhardt, KM 1989. Building Theories from Case Study Research.<br />
Academy <strong>of</strong> Management Review 14,4: 532-550.<br />
Engeström, Y 1987. Learning by Expanding: An Activity-Theoretical<br />
Approach to Developmental Research. Helsinki: Orienta-Konsultit Oy.<br />
Fitzgerald, B 1997. The Use <strong>of</strong> Systems Development Methodologies in<br />
Practice: A Field Study. Information Systems <strong>Journal</strong> 7,4: 121-132.<br />
398
Grounded Theory Integrated with Activity Theory …<br />
Gehrke, NJ 1982. A Grounded Theory Study <strong>of</strong> Beginning Teachers Role<br />
Personalization through Reference Groups Relations. <strong>Journal</strong> <strong>of</strong><br />
Teacher Education 32,6: 34-38.<br />
Glaser, BG 1978. Theoretical Sensitivity. Mill Valley, CA: Sociology Press.<br />
Glaser, BG & AL Strauss 1967. The Discovery <strong>of</strong> Grounded Theory:<br />
Strategies for Qualitative Research. NY: Aldine Publishing Company.<br />
Glaser, B & AL Strauss 1977. Anguish: The Case History <strong>of</strong> a Dying<br />
Trajectory. Mill Valley: Sociology Press.<br />
Hansen, BH & K Kautz 2005. Grounded Theory Applied - Studying<br />
Information Systems Development Methodologies in Practice. 38th<br />
Hawaii International Conference on System Sciences. Big Island, HI,<br />
USA.<br />
Hughes, J & DA Howcr<strong>of</strong>t 2000. Grounded Theory: Never Knowingly<br />
Understood. Information Systems Review 4,1: 181-197.<br />
Hughes, J & S Jones 2003. Reflections on the Use <strong>of</strong> Grounded Theory in<br />
Interpretive Information Systems Research. ECIS’ 2003 Conference,<br />
Naples, Italy.<br />
Hutchinson, SA 1988. Education and Grounded Theory. In Sherman, R & R<br />
B Webb (eds): Qualitative Research in Education: Focus and Methods.<br />
New York, NY: The Falmer Press.<br />
Katz, J 1983. A Theory <strong>of</strong> Qualitative Methodology: The Social System <strong>of</strong><br />
Analytical Fieldwork. In Emerson, R (ed): Contemporary Field<br />
Research: A Collection <strong>of</strong> Readings. Boston, MA: Little Brown<br />
Company.<br />
Kozma, RB 1985. A Grounded Theory <strong>of</strong> Institutional Innovation in Higher<br />
Education. <strong>Journal</strong> <strong>of</strong> Higher Education 53,3: 300-319.<br />
Klieger, A, Y Ben-Hur & N Bar-Yossef 2009. Integrating Laptop Computers<br />
into Classroom: Attitudes, Needs, and Pr<strong>of</strong>essional Development <strong>of</strong><br />
Science Teachers - A Case Study. <strong>Journal</strong> <strong>of</strong> Science Education and<br />
Technology 19,2: 187-198.<br />
Kuutti, K 1995. Activity Theory as a Potential Framework for Human-<br />
Computer Interaction Research. In Nardi, BA (ed): Context and<br />
Consciousness: Activity Theory and Human Computer Interaction.<br />
Cambridge: MIT Press.<br />
Leontiev, AN 1978. Activity, Consciousness, and Personality. Hillsdale:<br />
Prentice-Hall.<br />
399
Mc Donald van der Merwe & Ruth de Villiers<br />
Leontiev, AN 1981. Problems <strong>of</strong> the Development <strong>of</strong> the Mind. Kopylova, M<br />
(trans). Moscow: Progress Publishers.<br />
Locke, K 2001. Grounded Theory in Management Research. Thousand<br />
Oaks, CA: Sage.<br />
Marshall, C & GB Rossman 2006. Designing Qualitative Research.<br />
Thousand Oaks, CA: Sage.<br />
Martin, PY & BA Turner 1986. <strong>Journal</strong> <strong>of</strong> Applied Behavioral Science 22:<br />
141-157.<br />
Melia, KM 1997. Producing ‘Plausible Stories’. Interviewing Student<br />
Nurses. In Miller, G & R Dingwell (eds): Context and Method in<br />
Qualitative Research. London: Sage.<br />
Merriam, SB 1988. Qualitative Research and Case Study Applications in<br />
Education. San Francisco: Jossey-Bass Publishers.<br />
Mills, J, A Bonner & K Francis 2006. The Development <strong>of</strong> Constructivist<br />
Grounded Theory. International <strong>Journal</strong> <strong>of</strong> Qualitative Method 5,1:1-<br />
10.<br />
Miles, M B & AM Huberman 1994. Qualitative Data Analysis. Thousand<br />
Oaks, CA: Sage.<br />
Myers, MD 2007. Qualitative Research in Information Systems. Available<br />
at: http://www.qual.auckland.ac.nz.<br />
Neuman, WL 2003. Basics <strong>of</strong> Social Research: Qualitative and Quantitative<br />
Approaches. Boston: Pearson Education.<br />
Orlikowski, WJ 1993. CASE Tools as Organisational Change: Investigating<br />
Incremental and Radical Changes in Systems Development. MISQ. 21,2:<br />
309-340.<br />
Pajares, F 1996. Self-efficacy Beliefs in Achievement Settings. Review <strong>of</strong><br />
Educational Research 66: 543-578.<br />
Pandit, NR 1996. The Creation <strong>of</strong> Theory: A Recent Application <strong>of</strong> the<br />
Grounded Theory Method. The Qualitative Report 2,4: 1-14.<br />
Parry, K 1998. Grounded Theory and Social Process: A New Direction for<br />
Leadership Research. Leadership Quarterly 9,1: 85-105.<br />
Patton, MQ 1990. Qualitative Evaluation and Research Methods. Newbury<br />
Park, CA: Sage.<br />
Riel, MM & JA Levin 1990. Building Electronic Communities: Success and<br />
Failure in Computer Networking. Instructional Science. 19: 145-169.<br />
Seaman, JS 2008. Adopting a Grounded Theory Approach to Cultural-<br />
Historical Research: Conflicting Methodologies or Complementary<br />
400
Grounded Theory Integrated with Activity Theory …<br />
Methods? International <strong>Journal</strong> <strong>of</strong> Qualitative Methods 7,1:1-17.<br />
Skodol-Wilson, H & S Ambler-Hutchinson 1996. Methodological Mistakes<br />
in Grounded Theory. Nursing Research 45:122-4.<br />
Smiley, MA & JG Conyers 1991. Changing Conceptions <strong>of</strong> Teaching<br />
Influence the Future <strong>of</strong> Staff Development. <strong>Journal</strong> <strong>of</strong> Staff<br />
Development 12,1: 12-16.<br />
Spector, BA & CW Gibson 1991. A Qualitative Study <strong>of</strong> Middle School<br />
Students’ Perceptions <strong>of</strong> Factors Facilitating the Learning <strong>of</strong> Science:<br />
Grounded Theory and Existing Theory. <strong>Journal</strong> <strong>of</strong> Research in Science<br />
Teaching 28,6: 467-484.<br />
Stein, MK, MS Smith & EA Silver 1999. The Development <strong>of</strong> Pr<strong>of</strong>essional<br />
Developers: Learning to Assist Teachers in New Settings in New Ways.<br />
Harvard Educational Review 69,3: 237-269.<br />
Strauss, AL & J Corbin 1998. Basics <strong>of</strong> Qualitative Research: Grounded<br />
Theory, Procedures and Techniques. Newbury Park, CA: Sage.<br />
Strauss, AL & J Corbin 1990. Basics <strong>of</strong> Qualitative Research: Grounded<br />
Theory Procedures and Techniques. Newbury Park, CA: Sage.<br />
Tellis, W 1997. Introduction to Case Study. The Qualitative Report. 3.2.<br />
Available at: http://www.nova.edu/ssss/QR/QR3-2/tellis1.html.<br />
Thorne, SS, S Reimer Kirkham & K O’Flynn-Magee 2004. The Analytic<br />
Challenge in Interpretive Description. International <strong>Journal</strong> <strong>of</strong><br />
Qualitative Methods 3,1: Article 1.<br />
Van der Merwe, TM & AJ van der Merwe 2008. Online Continuing<br />
Pr<strong>of</strong>essional Development: Tensions Impacting on the Reflective Use <strong>of</strong><br />
a Mathematics-friendly Forum Environment. South African Computer<br />
<strong>Journal</strong>, SACLA 2008 (Special Edition) 42: 59-67.<br />
Van der Merwe, TM, AJ van der Merwe & LM Venter 2010. A Model to<br />
Direct Online Continuous Pr<strong>of</strong>essional Development Opportunities for<br />
Mathematics Teachers in the South African Context <strong>of</strong> Disparities.<br />
African <strong>Journal</strong> <strong>of</strong> Mathematics, Science and Technology Education. In<br />
press.<br />
Van der Merwe, AJ, P Kotze & J Cronje 2005. Selecting a Qualitative<br />
Research Approach for Information Systems Research. Kasane,<br />
Botswana: South African Computer Lecturers Association.<br />
Van Maanen, J 1988. Tales <strong>of</strong> the Field: On Writing Ethnography. Chicago:<br />
<strong>University</strong> <strong>of</strong> Chicago Press.<br />
401
Mc Donald van der Merwe & Ruth de Villiers<br />
Vygotsky, L 1978. Interaction between Learning and Development. In Mind<br />
in Society. Cole, M (trans). Cambridge, MA: Harvard <strong>University</strong> Press.<br />
Walsham, G 1995. Interpretive Case Studies in IS Research: Nature and<br />
Method. European <strong>Journal</strong> <strong>of</strong> Information Systems 4,2: 74-81.<br />
Yin, RK 1984. Case Study Research: Design and Methods. Beverly Hills,<br />
CA: Sage.<br />
Yin, RK 1989. Case Study Research: Designs and Methods. London: Sage.<br />
Yin, RK 1994. Case Study Research. 2 nd Edition. Beverly Hills, CA: Sage.<br />
Yin, RK 2002. Case Study Research. Beverly Hills, CA: Sage.<br />
Zimmerman, BJ 2002. Becoming a Self-Regulated Learner: An Overview.<br />
Theory into Practice 41,2: 64-70.<br />
402<br />
Mc Donald van der Merwe<br />
School <strong>of</strong> Computing<br />
<strong>University</strong> <strong>of</strong> South Africa<br />
South Africa<br />
Vdmertm@unisa.ac.za<br />
Ruth de Villiers<br />
School <strong>of</strong> Computing<br />
<strong>University</strong> <strong>of</strong> South Africa<br />
South Africa<br />
Dvillmr@unisa.ac.za
Using Matrix Analysis to Achieve Traction,<br />
Coherence, Progression and Closure in<br />
Problem-Solution Oriented Research<br />
<strong>Rembrandt</strong> <strong>Klopper</strong><br />
Sam Lubbe<br />
Abstract<br />
In this contribution we propose the use <strong>of</strong> two types <strong>of</strong> matrices as<br />
conceptual scaffolding at the beginning <strong>of</strong> a problem-solution oriented<br />
research project when solutions to problems under investigation are finite<br />
while ignorance about them is more or less infinite. The first type <strong>of</strong> matrix<br />
is the problem-research question alignment matrix used to ensure that the<br />
sub-problems that are identified in problem statements are properly aligned<br />
with the research questions that the researcher poses to ensure viable<br />
empirical results. The second type <strong>of</strong> matrix is the concept matrix used to<br />
present a concept-centric rather than an author-centric literature review,<br />
thereby ensuring that one’s literature review does not become a subjective<br />
process stitching together a patchwork quilt <strong>of</strong> references, or the unilateral<br />
cherry picking <strong>of</strong> references that supports a preferred point <strong>of</strong> view. Finally,<br />
we would like to point out that the concept-centric approach to literature<br />
review that we propose is firmly rooted in epistemological research<br />
philosophy.<br />
Keywords: Concept, concept matrix, epistemology, knowledge, literature<br />
review, matrix analysis, problem-based research, problem-solution oriented<br />
research, problem statement, research question.<br />
Introductory Remarks<br />
Matrix analysis <strong>of</strong> one sort or another has for the past century been used in a<br />
<strong>Alternation</strong> Special Edition 4 (2011) 403 – 419<br />
ISSN 1023-1757<br />
403
<strong>Rembrandt</strong> <strong>Klopper</strong> & Sam Lubbe<br />
variety <strong>of</strong> disciplines to summarise complex aspects <strong>of</strong> knowledge<br />
generation and to provide an eagle’s eye perspective <strong>of</strong> them. Examples are<br />
formal probability theory (Popper 1959), linguistics (Chomsky & Halle<br />
1968; Quirk et al. 1974; Chen & Wang 1975; Lass 1984), psychology (Fox<br />
et al. 2001) and in communication science (Rugbeer 2004; Reddy 2004).<br />
The focus <strong>of</strong> this article, the matrix method <strong>of</strong> literature review, was<br />
popularised as a research tool in the health sciences by Garrard (1999), later<br />
reprinted as Garrard (2004). We have adapted Garrard’s method somewhat<br />
to extend it to other disciplines and to make it more flexible from an<br />
epistemological point <strong>of</strong> view.<br />
The matrix method <strong>of</strong> literary review protects the reviewer against<br />
ignorant assumptions about the research theme at a stage that s/he is the<br />
most vulnerable due to lack <strong>of</strong> knowledge about the topic under<br />
investigation. This <strong>of</strong> course relates to the conceptual domain <strong>of</strong> knowledge<br />
known as epistemology.<br />
From an epistemological vantage point it is self evident that research<br />
mostly begins at a stage <strong>of</strong> total ignorance about the topic under<br />
investigation, progressing to a realisation <strong>of</strong> the extent <strong>of</strong> one’s ignorance, to<br />
a stage <strong>of</strong> limited knowledge about it, and if one persists, to a stage <strong>of</strong> expert<br />
knowledge <strong>of</strong> the topic. All problem-based research therefore begins with<br />
ignorance, because conducting research about known subjects would be like<br />
reinventing the wheel. We propose the following four-phase knowledge<br />
competency continuum:<br />
Figure 1: Levels <strong>of</strong> competence when completing a conceptual task<br />
Unconscious Incompetence<br />
↓<br />
Conscious Incompetence<br />
↓<br />
Conscious Competence<br />
↓<br />
Unconscious Competence<br />
404
Using Matrix Analysis in Problem-Solution Oriented Research<br />
• Unconscious incompetence: being unaware <strong>of</strong> something, its<br />
relationship to other things, and how it can be used in conjunction<br />
with other things.<br />
• Conscious incompetence: becoming aware that one does not know<br />
what can be known.<br />
• Conscious competence: beginning to surmise, envisage and<br />
hypothesise the nature <strong>of</strong> something, its relationship to other things,<br />
how it can be used, but not yet being able to use it as intended.<br />
• Unconscious competence: achieving an expert level <strong>of</strong> knowledge <strong>of</strong><br />
something and its relationship to other things, how it can be used,<br />
and having achieved such a level <strong>of</strong> command <strong>of</strong> using it, that one<br />
can conceptualise it as forming part <strong>of</strong> newly understood events, and<br />
being able to utilise it without consciously focussing one’s attention<br />
on it, so that one can focus one’s attention on the general<br />
interrelationship and interaction potentials between that thing and<br />
other things.<br />
The matrix method <strong>of</strong> literature review is a powerful and practical<br />
research tool that forms the initial scaffolding to help researchers sharpen<br />
the focus <strong>of</strong> their research and to enable them to rapidly progress from the<br />
initial state <strong>of</strong> conscious incompetence to the stage <strong>of</strong> unconscious<br />
competence as outlined above.<br />
Aligning Research Problems, Aims and Research Questions<br />
In the authors’ capacities as postgraduate supervisors, external examiners<br />
and peer reviewers they regularly encounter research designs in which<br />
general problems and research questions are either absent or misaligned. In a<br />
well-designed research project the researcher has a clear conceptualisation<br />
<strong>of</strong> what the general problem is that should be solved and the questions one<br />
should answer through one’s own research to solve the problem.<br />
Once the researcher understands the general problem and research<br />
question, s/he has to expound them in greater detail into more specific<br />
subproblems and sub-questions as in Figure 2 below:<br />
405
<strong>Rembrandt</strong> <strong>Klopper</strong> & Sam Lubbe<br />
Figure 2: Flowchart demonstrating the alignment <strong>of</strong> a general problem<br />
and research question, and reconceptualising them in greater detail as<br />
properly aligned subproblems and research questions disseminated as<br />
<strong>Klopper</strong> (2009)<br />
In a well designed research project the researcher will extract a<br />
specific number <strong>of</strong> subproblems from the general problem, as well as the<br />
same number <strong>of</strong> sub-questions from the general research question in such a<br />
way that sub-questions and subproblems are properly aligned. If this is done<br />
systematically, the answer to a specific research sub-question will provide<br />
the solution to its associated subproblem.<br />
Finally, in empirical research the sub-questions <strong>of</strong> the research<br />
design phase will be restated in greater detail in the research instrument –<br />
the questionnaire in the case <strong>of</strong> quantitative research, or the interview<br />
schedule in the case <strong>of</strong> qualitative research.<br />
The Problem-Research Question Alignment Matrix<br />
The flowchart in Figure 2 above shows the alignment <strong>of</strong> research problems,<br />
subproblems and research questions in flowchart format. Figure 3 below<br />
presents a table that demonstrates the alignment <strong>of</strong> an actual general problem<br />
and sub-problems with research questions regarding solving problems with<br />
plagiarism in present-day academic research:<br />
406
Using Matrix Analysis in Problem-Solution Oriented Research<br />
Figure 3: The problem-research question alignment matrix for solving<br />
the problem <strong>of</strong> plagiarism, adapted from <strong>Klopper</strong> (2009)<br />
The above matrix can be further extended to align the research<br />
questions and the questionnaire questions. The approach would allow the<br />
researcher to demonstrate that s/he has proved that all processes have been<br />
thought through.<br />
Figure 4: The research-question questionnaire alignment matrix for<br />
ensuring data collected help solve the research questions<br />
407
<strong>Rembrandt</strong> <strong>Klopper</strong> & Sam Lubbe<br />
Building a Concept Matrix<br />
How a matrix is to be constructed is a process that relates more to the<br />
personal creativity, pr<strong>of</strong>iciency and originality <strong>of</strong> the researcher than to rules<br />
and principles. Miles and Huberman 1994: (240-241) state that there are no<br />
correct matrices, only functional matrices. Researchers should keep in mind<br />
that they will have to modify earlier versions <strong>of</strong> literature survey matrices as<br />
their understanding <strong>of</strong> their research topic grows.<br />
A Word Processor Based (or Pen-and-Paper Based) Concept<br />
Matrix<br />
Figure 4 below provides a sample word processor based concept matrix that<br />
focuses on the research theme <strong>of</strong> e-Readiness, how ready members <strong>of</strong><br />
particular communities are to adopt electronic resources for every-day use:<br />
Figure 5: A typical concept matrix showing which concepts are<br />
discussed in references for a literature review on e-Readiness<br />
408
Using Matrix Analysis in Problem-Solution Oriented Research<br />
As can be seen above, the layout <strong>of</strong> the concept matrix is<br />
straightforward. In the leftmost column the references to be reviewed are<br />
listed in abbreviated Harvard style. The head <strong>of</strong> each column displays a<br />
concept that was extracted from the problem statement <strong>of</strong> the research<br />
project. If a relevant concept is discussed in a particular reference a 1 (one)<br />
is placed in the appropriate cell.<br />
In order to determine the relevance <strong>of</strong> a source the researcher does<br />
not have to waste time by reading the whole article. It is sufficient to scan<br />
the abstract (where the content <strong>of</strong> the reference is summarised prospectively)<br />
and the summary/ conclusions section (where the content <strong>of</strong> the reference is<br />
summarised retrospectively) to determine the relevance <strong>of</strong> the reference.<br />
This approach enables the researcher to conduct a critical<br />
comparative literature review <strong>of</strong> all references listed under each concept.<br />
This approach emancipates the reviewer from the tyranny <strong>of</strong> being trapped<br />
within a particular reference, and from merely providing general paraphrases<br />
<strong>of</strong> references. It also enables supervisors to establish at a glance that only<br />
relevant literature is being reviewed and captured in the bibliography<br />
because references that do not appear on the concept matrix may not form<br />
part <strong>of</strong> the literature review and should therefore not be included in the<br />
bibliography.<br />
Although the understanding <strong>of</strong> these concepts is central to the<br />
attention <strong>of</strong> researchers the literature may not contain some examples <strong>of</strong> the<br />
historical analysis <strong>of</strong> this type. It should be noted that epistemological<br />
classifications could be included in the matrix just after the reference to<br />
address this. This should be done to show how important this article is<br />
epistemologically in terms <strong>of</strong> the topic being researched.<br />
A Spreadsheet Based Concept Matrix<br />
The concept matrix can also be created as an electronic spreadsheet,<br />
allowing the researcher to easily keep track <strong>of</strong> how many references deal<br />
with more than one concept in the overall theme under investigation as well<br />
as how many sources deal with a particular concept. This allows the<br />
researcher to differentiate between core references that deal with multiple<br />
aspects <strong>of</strong> the research theme, and references <strong>of</strong> a more peripheral nature,<br />
and with well researched and less well researched concepts as shown in<br />
Figure 6 below:<br />
409
<strong>Rembrandt</strong> <strong>Klopper</strong> & Sam Lubbe<br />
Figure 6: A typical concept matrix in electronic spreadsheet format,<br />
with an added row indicating the total number <strong>of</strong> sources per concept as<br />
well as the total number <strong>of</strong> relevant concepts per source for a literature<br />
review that focuses on e-Readiness<br />
One <strong>of</strong> the benefits <strong>of</strong> the electronic concept matrix is that it visually<br />
references in summary format the number <strong>of</strong> sources per concept, or how<br />
many different relevant concepts a particular reference covers, enabling the<br />
researcher to distinguish between primary and secondary references, or<br />
between major and minor concepts as is the case <strong>of</strong> Figure 7 below:<br />
410
Using Matrix Analysis in Problem-Solution Oriented Research<br />
Figure 7: Bar graph showing the number <strong>of</strong> sources per concept on the<br />
concept matrix for a literature review that focuses on e-Readiness,<br />
generated from the electronic spread sheet that was used to create the<br />
concept matrix shown in Figure 6<br />
From the above graph one can conclude that ‘economic<br />
development’ (6 references) and ‘access to ICT services’ (5 references) are<br />
the two most researched concepts on the theme <strong>of</strong> e-Readiness, followed by<br />
the concepts ‘innovation’, ‘e-Schools’ and ‘E-Education Policy’ (with 4<br />
references each). By contrast, ‘Readiness Evaluation’, ‘Digital<br />
Inclusiveness’, ‘E-Learning’ (at 2 references each), and ‘Networked World’<br />
(with only 1 reference) were not heavily researched aspects <strong>of</strong> the E-<br />
Readiness theme.<br />
411
<strong>Rembrandt</strong> <strong>Klopper</strong> & Sam Lubbe<br />
Discussion and Conclusion<br />
In this paper we have proposed the use <strong>of</strong> two types <strong>of</strong> matrices to achieve<br />
traction, coherence, progression and closure in research, namely the<br />
problem-research question alignment matrix that is used to ensure that the<br />
sub-problems that are identified in problem statements are properly aligned<br />
with the research questions that the researcher poses to ensure viable<br />
empirical results, and the concept matrix used to present a concept-centric<br />
rather than an author-centric literature review.<br />
The problem-research question alignment matrix ensures that the<br />
whole research process is problem-solution oriented by taking the problem<br />
statement as point <strong>of</strong> departure. This firstly is done by extracting<br />
subproblems from the general problem statement and aligning research<br />
questions with each <strong>of</strong> the subproblems. The alignment and cohesion <strong>of</strong> the<br />
research design is enhanced by basing the array <strong>of</strong> research instrument<br />
questions on the questions <strong>of</strong> the problem-research question alignment<br />
matrix. Closure is achieved at the end <strong>of</strong> the research process if the<br />
researcher demonstrates to what extent s/he is able to answer the research<br />
questions by means <strong>of</strong> her/ his own empirical results, on the principle that<br />
the extent to which one is able to answer one’s research questions, is the<br />
extent to which one has succeeded in solving the problems that prompted the<br />
research in the first place.<br />
The concept matrix ensures that the researcher conducts a conceptcentric<br />
problem-solution oriented literature review provided that the search<br />
terms for the review are extracted from one’s problem statement. Furthermore,<br />
the literature review essentially is a qualitative content analysis <strong>of</strong><br />
available information already published on the problem under investigated.<br />
It can be a study <strong>of</strong> the research object alone, with the aim <strong>of</strong> collecting<br />
information about its structure, process and relationships, increasing the<br />
familiarity <strong>of</strong> the researcher with the research object and establishing the<br />
credibility <strong>of</strong> the project. In addition, it can consider previous research,<br />
attempting to link it with the study currently planned. It may also be geared<br />
towards a historical or comparative analysis <strong>of</strong> the issue in question so the<br />
current study can be placed in a historical context. Finally, it may review a<br />
theory <strong>of</strong> methods and techniques most suitable for the study, simply by<br />
looking at the ways other researchers have approached the topic, and by<br />
evaluating their suitability and effectiveness (Sarantakos 1998: 129).<br />
412
Using Matrix Analysis in Problem-Solution Oriented Research<br />
Punch (1994: 93) writes that without adequate training and<br />
supervision, the neophyte researcher can unwittingly become an unguarded<br />
projectile bringing turbulence to the field, fostering personal trauma (for<br />
researcher and researched), and even causing damage to the discipline.<br />
There are many cases where students have attempted to conduct a literature<br />
review (see some previous section) but many failed and their studies<br />
therefore failed as well. O’Neill in Wellington et al. (2005: 89) states that<br />
conducting a literature review is a bit like climbing your way up a pyramid,<br />
where the total area at any particular point in the climb represents the search<br />
area for the review at that particular moment in time. You start in the largest<br />
area at the bottom and slowly move upwards, all the time refining and<br />
narrowing your searches, as you move from incompetence to competence.<br />
Wellington et al. (2005: 87) state that reviewing the literature<br />
involves searching, collecting, prioritising, reading with a purpose and<br />
seeking out key issues and themes, and then presenting and discussing these<br />
critically. The aims <strong>of</strong> a literature review are:<br />
• To establish which <strong>of</strong> the problems identified for solution by means<br />
<strong>of</strong> empirical research have been solved by other researchers so that<br />
they can be removed from the research equation<br />
• To give readers a clear idea <strong>of</strong> the nature and context <strong>of</strong> one’s<br />
research<br />
• To convince the reader <strong>of</strong> one’s knowledge <strong>of</strong> the field<br />
• To build a case for the empirical part <strong>of</strong> one’s study<br />
If one looks at the way novice researchers attempt to survey<br />
literature, it seems that the supervisor has failed to acquaint the student with<br />
the different phases for conducting a proper literature review. The first phase<br />
is where many students get stuck and remain – they cast about collecting<br />
data with no defined problem statement from which they extract keywords to<br />
serve as filter for the identification <strong>of</strong> relevant literature. They read each<br />
reference in detail rather than using abstracts and summaries to establish<br />
relevance, and they start summarising the literature with no plan in mind,<br />
and end up with a document without a proper layout, showing no coherence<br />
and progression, and in many cases ending up perpetrating intentional or<br />
unintentional plagiarism because they have not kept track <strong>of</strong> the sources <strong>of</strong><br />
413
<strong>Rembrandt</strong> <strong>Klopper</strong> & Sam Lubbe<br />
the ideas that they jotted down so that, even if they wanted to, they cannot<br />
properly acknowledge their sources. This is the first and probably the worst<br />
case scenario. In our view it reflects a mindstate <strong>of</strong> unconscious<br />
incompetence.<br />
The next phase is when students begin to appreciate how little they<br />
do know <strong>of</strong> the topic, but they set out without a plan and write<br />
unsystematically without knowing where they must stop creating pages upon<br />
pages <strong>of</strong> copious notes. They rely on the supervisor to tell them what they<br />
must leave out. We call this phase conscious incompetence. The next phase<br />
is conscious competence. In this phase the student becomes aware <strong>of</strong> the fact<br />
that s/he is coming to grips with the major references that relate to the<br />
problems under investigation. Due to the student’s newfound confidence is<br />
sometimes difficult for the supervisor to properly advise the student what to,<br />
leading to disagreements about what should be included in the literature<br />
review and what should be left out and <strong>of</strong>ten leading to unfounded mistrust<br />
on the side <strong>of</strong> the student.<br />
The final phase is where the student has become a true researcher.<br />
This stage we refer to as unconscious competence. The student creates a<br />
proper problem statement and extracts key concepts from it that s/he then<br />
uses to search for refereed literature to be used in the literature review. By<br />
using key concepts derived from the problem statement, the problem<br />
statement itself becomes the filter that ensures that only literature relevant to<br />
the problems under investigation forms part <strong>of</strong> the review. This method also<br />
enables the researcher to determine to what extent propblems that s/he has<br />
identified have been solved by other researchers, enabling the researcher to<br />
remove solved problems and reformulate the original problem statement, the<br />
research objectives and the research questions, the latter which forms the<br />
basis <strong>of</strong> particular more detailed questions posed to respondents in research<br />
instruments like questionnaires and interview schedules.<br />
The researcher generates content for the concept matrix by<br />
surveying only the abstracts and summaries <strong>of</strong> references. Once the<br />
appropriate literature to review has been identified the researcher<br />
commences with the literature survey proper, which entails a critical<br />
analysis <strong>of</strong> each reference to identify potential solutions to the problems<br />
under investigation. The critical analysis <strong>of</strong> individual references should be<br />
followed by a critical comparative analysis <strong>of</strong> all references that are listed<br />
414
Using Matrix Analysis in Problem-Solution Oriented Research<br />
under a particular concept, to esablish differences <strong>of</strong> opinion, converging<br />
opinions and concensus among experts under review.<br />
In this approach to literature review the researcher systematically<br />
reads each article, considers the validity <strong>of</strong> what is being being read, and<br />
thereafter classifies the reference thematically. The importance <strong>of</strong> using this<br />
method is that the student must realise that s/he cannot use everything in an<br />
article but should instead concentrate on those aspects that relate to the<br />
problems under investigation.<br />
The key concepts on the matrix therefore become the key concepts<br />
embedded in the headings in the literature review. The concept matrix<br />
enables the researcher to subject all literature to critical comparative<br />
analysis. The references that have been ticked in a particular column <strong>of</strong> the<br />
concept matrix are subjected to critical comparative analysis in the thesis.<br />
The concept matrix also enables the researcher to establish at a glance<br />
whether s/he has identified enough references under each concept.<br />
The researcher can order each column <strong>of</strong> the matrix in different ways to<br />
foreground different aspects <strong>of</strong> the knowledge contained in it. The matrix<br />
can be reorganised according to:<br />
• Publication date, demonstrating longitudenal aspects <strong>of</strong> the topic<br />
(time-ordered matrix)<br />
• Table rows containing verbal information about the view <strong>of</strong> role<br />
occupants on a specific issue <strong>of</strong> the project (role-ordered matrix)<br />
• Integrated data on a summative index or scale, thus organising<br />
several components <strong>of</strong> a single, coherent variable (checklist matrix)<br />
• A central theme (conceptually clustered matrix)<br />
• Outcomes and dependent variables (effects matrix)<br />
• Present forces that are at work in particular contexts showing<br />
processes and outcomes (site dynamics matrix)<br />
• A series <strong>of</strong> events displayed in any possible order (event listing)<br />
• A field <strong>of</strong> interrelationships between dependent and independent<br />
variables, describing causal connections between them (causal<br />
network) (Sarantakos 1998: 360).<br />
Wellington et al. (2005: 83) state that in writing about the literature,<br />
one is adding to it, by creating links, drawing attention to particular issues<br />
415
<strong>Rembrandt</strong> <strong>Klopper</strong> & Sam Lubbe<br />
and contributing one’s construction <strong>of</strong> the ‘story’ to told in existing research.<br />
It is a long and ‘rigorous’ road for a researcher to progress from<br />
unconscious incompetence to unconsciouses competence. The supervisor<br />
will have to be patient and has to ensure that the student keeps a proper<br />
record (the matrix) <strong>of</strong> the process. The matrix should be added as an<br />
appendix into the dissertation. The student cannot move directly from<br />
unconscious incompetence to unconscious competence but has to follow<br />
each stage the sequence <strong>of</strong> understanding shown in Figure 1.<br />
References<br />
Alavi, M, P Carlson & G Brooke 1989. The Ecology <strong>of</strong> MIS Research: A<br />
Twenty Year Status Review. In DeGross JI, JC Henderson & BR<br />
Konsynski (eds): The Proceedings <strong>of</strong> the Tenth International<br />
Conference on Information Systems. Boston: Academic Conferences.<br />
Barabash, Marita, Raisa Guberman-Glebvon & Rachel Baruch 2003.<br />
Decision-making in Construction <strong>of</strong> Courses Combining Classroombased<br />
and Internet-based Learning and Teaching Strategies in<br />
Mathematics-Teacher Education. <strong>Journal</strong> <strong>of</strong> Educational Media 28,2.<br />
Bridges.org 2005. E-readiness Assessment Tools Comparison.bridges.org<br />
under the Creative Commons Attribution-NoDerives-NonCommercial<br />
License. Available at www.bridges.org.<br />
Brown, Susan A, Robert M Fuller & Chelly Vician 2004. Who’s Afraid <strong>of</strong><br />
the Virtual World? Anxiety and Computer-Mediated Communication.<br />
<strong>Journal</strong> <strong>of</strong> the Association for Information Systems 5,2.<br />
Bruce, C 2001. Interpreting the Scope <strong>of</strong> Their Literature Reviews:<br />
Significant Differences in Research Students’ Concerns. New Library<br />
World 102,4/5: 158-166.<br />
Bruce, CS 1994. Research Students’ Early Experiences <strong>of</strong> the Dissertation<br />
Literature Review. Studies in Higher Education 19,2: 217-229.<br />
Buckner, Kathy & Greg Stoner 1999. Implementing Learning Technology.<br />
Practical implementation issues. Available at: http://www.icb.hw.ac.<br />
uk/itdi/implementing-it.html.<br />
Cette, Gilbert, Jacques Mairesse & Yussuf Kocoglu 2001. The Contribution<br />
<strong>of</strong> Information and Communication Technology to French Economic<br />
Growth. <strong>Journal</strong> Economie et Statistique February: 25-31.<br />
416
Using Matrix Analysis in Problem-Solution Oriented Research<br />
Chasia, Henry 2002. ICTs for Development in Africa. The New Partnership<br />
for Africa’s Development (NEPAD) ICT Programme and the Role <strong>of</strong> the<br />
UN ICT Task Force. New York: e-Africa Commission.<br />
Chen, M & WS-Y Wang 1975. Sound Change Activation and<br />
Implementation. Language 51: 255-281.<br />
Chomsky, N & M Halle 1968. The Sound Pattern <strong>of</strong> English. New York:<br />
Harper & Row Publishers.<br />
De Villiers, MR 2005. E-Learning Artefacts: Are they Based on Learning<br />
Theory? <strong>Alternation</strong> 12,1b: 345-371.<br />
Duff, A 1966. The Literature Search: A Library-Based Model for<br />
Information Skills Instruction. Library Review 45,4: 14-18.<br />
Finlay, Alan 2005. Community Access Initiatives in South Africa. Open<br />
Society Foundation. South Africa. At www.openresearch.co.za.<br />
Fox, RA, IC McManus & BC Winder 2001. The Shortened Study Process<br />
Questionnaire: An Investigation <strong>of</strong> its Structure and Longitudinal<br />
Stability Using Confirmatory Factor Analysis. British <strong>Journal</strong> <strong>of</strong><br />
Educational Psychology 71: 511-530.<br />
Froese, AD 1998. Teaching Students to Write Literature Reviews: A Meta-<br />
Analytic Model. Teaching <strong>of</strong> Psychology 25,2: 102-105.<br />
Garrard, Judith [1999] 2004. Health Sciences Literature Review Made Easy:<br />
The Matrix Method. Gaithersburg, Md.: Aspen Publishers.<br />
Gilwarld, Alison 2004. Towards an African e-Index Access and Usage.<br />
Johannesburg. Link Centre, <strong>University</strong> <strong>of</strong> the Witwatersrand.<br />
Govender, D 2004. Communication for Conflict Transformation: An<br />
Assessment <strong>of</strong> Arbitration Procedures between Aggrieved Educators and<br />
the <strong>KwaZulu</strong>-<strong>Natal</strong> Department <strong>of</strong> Education. Masters dissertation.<br />
Department <strong>of</strong> Communication Science, <strong>University</strong> <strong>of</strong> Zululand.<br />
Govindsamy, Krishna 2002. Modelling Optimal Communication for the<br />
School as an Organization. Masters dissertation, Zululand.<br />
Hart, Chris 1998. Doing a Literature Review: Releasing the Social Science<br />
Research Imagination. Univ. <strong>of</strong> Central England, Birmingham: SAGE.<br />
Hiralal, Keemanthla Hemraj 2005. Dominance and Submission. How Peer<br />
Groups in South African Secondary Schools Construct and Utilize Peer<br />
Networks. Kwadlangezwa: Dept Communication Science, Zululand.<br />
H<strong>of</strong>fman, L Donna & Thomas P Novak 1998. Bridging the Digital Divide on<br />
417
<strong>Rembrandt</strong> <strong>Klopper</strong> & Sam Lubbe<br />
the Internet. The Impact <strong>of</strong> Race on Computer Access and Internet Use.<br />
Vanderbilt <strong>University</strong> Nashville, Tennessee: Science Department.<br />
Jacobs, SJ & Marllen Herselman 2002. Analysis <strong>of</strong> the Success <strong>of</strong> ICT at<br />
the Ikageng MPCC in support <strong>of</strong> the Itsoseng Community: A Case<br />
Study. International <strong>Journal</strong> <strong>of</strong> Education and Development using<br />
Information and Communication Technology (IJEDICT) 1,3: 16-34.<br />
Jiamton, Kwansuree & Margaret Sills 2005. Developing Strategies to<br />
Implement Technological Innovation in Educational Institution: Can<br />
Theories Inform Practice? Proceedings <strong>of</strong> the Second International<br />
Conference on e-Learning for knowledge–Based Society, August,<br />
Bangkok, Thailand.<br />
Jintrawet, Usanee & Rosanne Harrigan 2003. Issues in Comprehensive<br />
Paediatric Nursing 26: 77-88.<br />
Kelly, Tim 2004. Changing ICT Rankings <strong>of</strong> African Nations. Geneva,<br />
Switzerland: Strategy and Policy Unit, ITU.<br />
<strong>Klopper</strong>, <strong>Rembrandt</strong> 2003. Yesterday is another Country: Image Schemas in<br />
Conceptual Blending to Optimise Human Scale Thinking. <strong>Alternation</strong><br />
10,2: 292-320.<br />
<strong>Klopper</strong>, <strong>Rembrandt</strong> 2009. The Case for Cyber Forensic Linguistics.<br />
<strong>Alternation</strong> 16,1: 261-294.<br />
Lass, R 1984. Phonology: An Introduction to Basic Concepts. Cambridge,<br />
Cambridge <strong>University</strong> Press.<br />
Markle Foundation 2001. Creating a Development Dynamic. Final Report <strong>of</strong><br />
the Digital Opportunity Initiative. United Nations Millennium Summit,<br />
Estonia, 2001.<br />
Matthew, Clarke 2003. E-Development? Development and the New<br />
Economy. Hakapaino, Finland: UNU World Institute for Development<br />
Economics Research (UNU-Wider).<br />
Mbarika, WA, Victor Chitu Okoli, Terry Anthony Byrd & Pratim Datta<br />
2005. The Neglected Continent <strong>of</strong> IS Research: A Research Agenda for<br />
Sub-Saharan Africa. <strong>Journal</strong> <strong>of</strong> the Association for Information Systems<br />
6,5: 38-43.<br />
McConnell International LLC in collaboration with World Information<br />
Technology and Services Alliance (WITSA) 2000. Risk E-Business:<br />
Seizing the Opportunity <strong>of</strong> Global E-Readiness. Available:<br />
http://www.mcconneinternational.com/.<br />
418
Using Matrix Analysis in Problem-Solution Oriented Research<br />
Melody, William H, Willie Currie & Sean Kane 2003. Preparing South<br />
Africa for Information Society ‘E -Services’: The Significance <strong>of</strong> the<br />
New Value-Added Network Services (VANS) Sector. Communication<br />
Technology Handbook. Johannesburg, South Africa.<br />
Miles, MB & AM Huberman 1994. Qualitative Data Analysis: An Expanded<br />
Sourcebook. California: Sage.<br />
Pongjaturawit, Yunee & Rosanne Harrigan 2003. Parent Participation in the<br />
Care <strong>of</strong> Hospitalized Child in Thai and Western Cultures. Issues in<br />
Comprehensive Paediatric Nursing 26: 183–199.<br />
Popper, Karl R [1959] 1980. The Logic <strong>of</strong> Scientific Discovery. London:<br />
Hutchenson.<br />
Punch, M 1994. Politics and Ethics in Qualitative Research. In Denzin, N &<br />
Y Lincoln (editors): The Handbook <strong>of</strong> Qualitative Research. California,<br />
Sage.<br />
Quirk, RG, Sydney G Leech & J Svartvik 1974. A Grammar <strong>of</strong><br />
Contemporary English. London: Longman Group Limited.<br />
Reddy, MM 2004. Communication in Christian Groups from Movements to<br />
Organisations. D.Litt dissertation. Department <strong>of</strong> Communication<br />
Science. The <strong>University</strong> <strong>of</strong> Zululand, South Africa.<br />
Rugbeer, Yasmin 2004. Deceptive Communication: When it is Acceptable to<br />
Deceive Others, and When it is Not. D.Litt dissertation. Department <strong>of</strong><br />
Communication Science. The <strong>University</strong> <strong>of</strong> Zululand, South Africa.<br />
Sarantakos, S 1998. Social Research. New York: Palgrave.<br />
Webster, Jane & Richard T Watson 2002. Analysing the Past to Prepare for<br />
the Future: Writing a Literature Review. MIS Quarterly 26,2.<br />
Wellington, JAB, C Hunt, G McCulloch & P Sikes 2005. Succeeding with<br />
your Doctorate. California: Sage.<br />
<strong>Rembrandt</strong> <strong>Klopper</strong><br />
School <strong>of</strong> Information Systems and Technology<br />
<strong>University</strong> <strong>of</strong> <strong>KwaZulu</strong>-<strong>Natal</strong><br />
rklopper@gmail.com<br />
419<br />
Sam Lubbe<br />
North West <strong>University</strong><br />
Sam.lubbe@nwu.ac.za
‘New Zealand’s Darkest Day’ 1<br />
:<br />
The Representation <strong>of</strong> National Grief in the<br />
Media: The Case <strong>of</strong> the<br />
Christchurch Earthquake<br />
Petra Theunissen<br />
Gary Mersham<br />
Abstract<br />
2<br />
On 22 February 2011 a powerful earthquake struck the city <strong>of</strong> Christchurch,<br />
New Zealand. Buildings had collapsed, businesses were disrupted, and many<br />
lives were lost. As the death toll rose and the realities <strong>of</strong> the destruction set<br />
in, a nation moved from initial shock to anger and depression—not unlike<br />
the stages <strong>of</strong> grieving. This paper discusses the stages <strong>of</strong> grieving and the<br />
mourning process as they were reflected in national media. It explores how<br />
national identity and national consciousness are related to national mourning<br />
by a review <strong>of</strong> the literature and a thematic analysis <strong>of</strong> selected media<br />
content.<br />
The authors found that emotion is not only evident in reporting but it<br />
is necessary and expected when disaster is reported, challenging traditional<br />
1 ‘We may be witnessing New Zealand's darkest day’, Prime Minister John<br />
Key told TVNZ, after arriving in the quake-struck city within hours <strong>of</strong> the<br />
tremor. The comment was widely reported in national and international<br />
media (see, for example, http://world.globaltimes.cn/asia-pacific/2011-<br />
02/626105.html; http://www.theage.com.au/world/nation-confronts-fearand-despair-20110222-1b46q.html.)<br />
2 Civil Defence Emergency Management and other government departments<br />
refer to the Canterbury earthquake. The general public and the majority <strong>of</strong><br />
the media refer to the Christchurch earthquake.<br />
<strong>Alternation</strong> Special Edition 4 (2011) 420 – 440<br />
ISSN 1023-1757<br />
420
The Representation <strong>of</strong> National Grief in the Media<br />
views <strong>of</strong> ‘quality’ journalism that favour rationalism and objectivity over<br />
emotion in reporting.<br />
This research contributes to scholarly debate concerning the<br />
reporting <strong>of</strong> national disasters and how it impacts on its national identity.<br />
Keywords: media, disaster, emotion, grieving, national consciousness,<br />
national identity.<br />
Introduction<br />
The 6.3 magnitude earthquake that struck New Zealand’s second most<br />
populated city <strong>of</strong> Christchurch in Canterbury, New Zealand, on the 22 nd <strong>of</strong><br />
February 2011 made international news. Compared to other global disasters<br />
the numbers <strong>of</strong> fatalities were relatively small, but to a nation <strong>of</strong> four million<br />
people the loss <strong>of</strong> nearly 200 people in one single disaster affected all New<br />
Zealanders. No-one remained untouched by the grief that followed the<br />
earthquake. Many had friends or relatives living in Christchurch who were<br />
directly affected; others knew those who had friends and family there. The<br />
media played a crucial part not only in reporting the events but providing an<br />
avenue for those moved to express their shock, despair and even anger about<br />
the disaster and its subsequent impact. What was seen in the media was a<br />
cumulative and shared process <strong>of</strong> grieving for what was lost: people,<br />
livelihoods, identity, and, as the ripple effects were reported upon, lost<br />
opportunities.<br />
When discussing the media as a conduit for national mourning, it is<br />
important to remember that journalists are part <strong>of</strong> the community and <strong>of</strong> a<br />
nation 3<br />
. While there is an expectation that journalists must remain objective,<br />
they are in fact participant observers, and sometimes, observing participants.<br />
As Pantti and Wahl-Jorgenson (2011) argue, journalists are doing more than<br />
reporting events: they have become active participants in political and social<br />
processes, and particularly when there is a social crisis such as a disaster.<br />
3 As journalist Karl du Fresne points out, ‘one <strong>of</strong> the difficulties in being a<br />
journalist in a small and intimate society such as New Zealand is that you’re<br />
likely to know many <strong>of</strong> the people you write about’. http://karldufresne.<br />
blogspot.com/2010/10/two-degrees-<strong>of</strong>-separation.html.<br />
421
Theunissen & Mersham<br />
Thus, journalists cannot remain objective or emotionally detached, and their<br />
audience would not expect them to be. A poignant example where emotions<br />
spilled over into the reporting took place during the morning show TVNZ<br />
Breakfast. Covering the Canterbury earthquake in Christchurch, the reporter<br />
found himself overwhelmed by his experiences, and at the end <strong>of</strong> an<br />
interview with a volunteer group he choked as he referred to the ‘fantastic<br />
well <strong>of</strong> human spirit’ (De Jong 2011). It may be argued that ‘the media<br />
appropriates a social role to transform tragic events into platforms for global<br />
communion’ (Ibrahim 2010:123) while emotive images <strong>of</strong> collective<br />
expressions <strong>of</strong> grief and empathy are naturally newsworthy (Pantti 2010).<br />
In her discussion about the affective impact <strong>of</strong> media coverage <strong>of</strong> the<br />
2009 bushfire in Australia, Yell (2010:118) points out that the ‘public<br />
sharing <strong>of</strong> private emotion has become orthodox and mainstream’. Pantti and<br />
Wahl-Jorgenson (2011) concur, suggesting that since the 1980s there is a<br />
shift towards personalised expression <strong>of</strong> emotion in media coverage <strong>of</strong><br />
national disasters. The images shown <strong>of</strong> natural disasters such as the<br />
Australian bushfire have become much more intimate and emotive than they<br />
were when the media reported on the 1939 and 1983 bushfires, proving that<br />
a change in reporting has taken place (Yell 2010). In fact, Pantti (2010)<br />
suggests that contemporary journalists believe that emotional images allow<br />
the truth or real story to emerge. As a result <strong>of</strong> such emotive images, the<br />
recipient becomes more intimately engaged with the victims (Yell 2010).<br />
The Process <strong>of</strong> Grieving<br />
As Bhowmik, Basu and Mitra (2010) have shown, emotions are <strong>of</strong>ten<br />
evoked among recipients <strong>of</strong> news reporting. While the use <strong>of</strong> emotion in<br />
news reporting remains controversial, the process <strong>of</strong> grieving is wellrecorded<br />
in psychology and sociology. As humans we construct our world<br />
symbolically, create meaning and invest in relationships. When these<br />
relationships or the meanings we have shaped are lost or disrupted, we<br />
experience bereavement (Love 2007), or, as Hutchinson (2010) suggests,<br />
‘trauma’, signifying shock, vulnerability and confusion.<br />
Though the terms ‘grief’, ‘mourning’ and ‘bereavement’ are <strong>of</strong>ten<br />
used interchangeably, there are distinct differences between them. Grief<br />
refers to the response to loss, while mourning is the expression <strong>of</strong> that grief<br />
422
The Representation <strong>of</strong> National Grief in the Media<br />
(Buglass 2010). Thus national grief in this context refers to the loss that<br />
affects a nation, and national mourning the collective expression <strong>of</strong> grief by<br />
that nation. Bereavement, on the other hand, is a state <strong>of</strong> ‘having<br />
experienced a loss’ and refers to the ‘period after loss during which grief and<br />
mourning occur’ (Buglass 2010:44). National bereavement continues after<br />
the event; affording a place to it in its collective memory—part <strong>of</strong> the sensemaking<br />
process necessary to achieve acceptance.<br />
Grief is a normal reaction to loss, and feelings <strong>of</strong> despair or loss<br />
usually decrease in intensity and frequency as time passes (Love 2007), but<br />
as Hutchinson (2010) suggests, the after-effects <strong>of</strong> traumatic events can<br />
linger and shape future social (and political) landscapes. Although the<br />
emotions associated with grief and mourning are no longer news, feelings<br />
associated are likely to be renewed annually when associated events are<br />
described. For example, in a report on a shoot-out, the headline tellingly read<br />
Shot man an earthquake refugee (Donnell 2011), re-igniting memories <strong>of</strong> the<br />
trauma in Christchurch.<br />
How intense the grief is and how complex the grieving process is<br />
determined by how the death (or loss) occurs (Anderson 2010). In his<br />
exploration why we mourn for people unknown to us, Brennan (2008:3)<br />
argues that we mourn the loss <strong>of</strong> meaning that ‘comes from the predictability<br />
<strong>of</strong> every day life; from taken for granted routines’. We do not expect people<br />
to die while going about their daily business, and indeed, stories reported in<br />
the media about victims going about their daily lives were particularly<br />
poignant: workers taking the bus or staying in the <strong>of</strong>fice to finish work<br />
during lunch time, couples having lunch in cafés, family members catching<br />
up over a cup <strong>of</strong> c<strong>of</strong>fee. ‘The world we thought was safe is not’ (Anderson<br />
2010:128). Stories such about ordinary people dying under extraordinary<br />
and unexpected circumstances intensifies the mourning for those affected,<br />
the loss <strong>of</strong> meaning and certainty <strong>of</strong> things we take for granted. The Press<br />
summed this up in their tribute to the victims <strong>of</strong> the Canterbury earthquake:<br />
February 22, 2011. Just another ordinary day in Christchurch.<br />
Workers on their lunch break leave the <strong>of</strong>fice to grab a bite. Shoppers go<br />
about their daily business. Tourists at ChristChurch Cathedral—the majestic<br />
19th-century beauty that came to symbolise a city— enjoy the view from the<br />
spire. Just another day, no different from the one before. Then, at 12.51pm,<br />
it hit.<br />
423
Theunissen & Mersham<br />
The 6.3 magnitude earthquake that brought a city to its knees and<br />
broke a nation's heart. Our darkest day. A disaster beyond comprehension<br />
that has left hundreds missing, scores dead and ruined countless lives. Hopes<br />
have faded and dreams have crumbled, much like that once-mighty<br />
cathedral. So many lives, so much loss, the sorrow is almost too much to<br />
bear. The little boy who never made it to his six-month birthday. The brother<br />
who was due to give his sister away at her wedding. The father who left<br />
home to get groceries, never to return to his wife and their children.<br />
The girl in the rubble who texted her father in China to tell him she<br />
was trapped. The little sister whose loving brother just wants her to<br />
come home. These are the victims, these are their stories. And we<br />
will remember them (The Press 2011b, online).<br />
The description is filled with emotive language and imagery,<br />
highlighting how one traumatic event changed ordinary lives. It reinforces<br />
the notion <strong>of</strong> ‘nation’ and its unity by focusing on similarities rather than<br />
differences. Although it can be argued that the media exploited the<br />
‘sentiment <strong>of</strong> compassion’ (Ibrahim 2010:131), it can equally be argued that<br />
such emotions and imagery allowed media consumers who were ‘outside’<br />
the stricken area to identify with those directly affected, and provided an<br />
opportunity for all New Zealanders (and those following from outside New<br />
Zealand) to become part <strong>of</strong> the national mourning process. Trauma, by its<br />
very nature, is solitary but as it is shared by others through the media, social<br />
meaning is given to individual pain, and it enters into the national<br />
consciousness, encouraging us to re-evaluate how we are connected to the<br />
world as a nation (Hutchinson 2010).<br />
National Identity and National Consciousness<br />
Benedict Anderson, well known for his work on the origins <strong>of</strong> nationalism,<br />
argues that modern nations are always to some degree imagined<br />
communities, because ‘in the minds <strong>of</strong> each lives the image <strong>of</strong> their<br />
communion’ (Anderson 2006:6). Importantly here, he acknowledges the<br />
significant role <strong>of</strong> media in these imaginings as ‘creating unified fields <strong>of</strong><br />
exchange’ (Anderson 2006 cited in Guibernau & Rex 2010: 62). Not only is<br />
424
The Representation <strong>of</strong> National Grief in the Media<br />
national consciousness reflected in the media, but the media plays a<br />
significant role in recreating it in times <strong>of</strong> crisis (Avraham & First 2006).<br />
We might speculate that in present times that this role has increased<br />
exponentially as a result <strong>of</strong> the ubiquity <strong>of</strong> social media.<br />
Anderson suggests that ‘nationalism’ or ‘nation-ness’ are ‘cultural<br />
artefacts <strong>of</strong> a particular kind’ (2006:4). He posits that ‘comradeship’ and<br />
‘fraternity’ and ‘solidarity’ exist as features <strong>of</strong> culture that have first a<br />
history and then a structure that emerges from that history in the form <strong>of</strong><br />
nationalism. Regardless <strong>of</strong> actual inequalities in the modern nation state, ‘it<br />
is always conceived as a deep, horizontal comradeship’ (Anderson 2006:7).<br />
Social solidarity and community (Jobst 2005) is reflected in the<br />
widespread reporting <strong>of</strong> activities by New Zealanders such as fundraising<br />
and donations to assist Canterburians to rebuild Christchurch and their<br />
livelihoods after the earthquake. A national sense <strong>of</strong> social solidarity,<br />
reflected in the belief <strong>of</strong> ‘two degrees <strong>of</strong> separation’ due to New Zealand’s<br />
relatively small population <strong>of</strong> four million people, was <strong>of</strong>ten reflected in<br />
media reporting 4<br />
. The removal <strong>of</strong> over 200,000 tonnes <strong>of</strong> liquefaction silt by<br />
Canterbury <strong>University</strong>'s ‘Student Volunteer Army’, Federated Farmers'<br />
4 Many New Zealanders subscribe to the idea <strong>of</strong> ‘two degrees <strong>of</strong> separation’.<br />
This is manifested in internet blogs and television programmes. Mobile<br />
phone provider Two Degrees Mobile capitalises on the idea in a series <strong>of</strong><br />
television commercials with the line ‘Everyone knows someone who knows<br />
someone who knows them’. According to Internet commentator David<br />
Farrar this belief can be traced back to 1979 Erebus disaster when people in<br />
New Zealand ‘knew someone, or knew someone who knew someone’<br />
involved in some way (Stuff 2008). There have been many voices linking the<br />
two degrees <strong>of</strong> separation specifically to the Christchurch earthquake (cf.<br />
relevant websites). In a Mayoral media release pledging Auckland support<br />
for Christchurch, Councillor Michael Goudie, chairperson <strong>of</strong> the Civil<br />
Defence and Emergency Management Committee, says ‘New Zealand has<br />
always been known for two degrees <strong>of</strong> separation and this is more evident<br />
than ever before’. While this belief may be more emotionally imagined than<br />
real, research by Statistics New Zealand has found that there are<br />
approximately four degrees <strong>of</strong> separation among members <strong>of</strong> the New<br />
Zealand workforce (MacGibbon 2008: 3).<br />
425
Theunissen & Mersham<br />
‘Farmy Army’ and the ‘Rangiora Earthquake Express’ provision <strong>of</strong> over 250<br />
tonnes <strong>of</strong> water, medical supplies, and food, from the nearby town <strong>of</strong><br />
Rangiora by helicopter and truck, featured prominently. Patriotism in the<br />
form <strong>of</strong> this type <strong>of</strong> activity alongside emotional restraint, and its related<br />
cousin ‘resilience’, have long characterised reporting on disasters (Pantti &<br />
Wahl-Jorgenson 2011) but as suggested earlier, more recently the emotion<br />
and vulnerability <strong>of</strong> those reporting traumatic events has become more<br />
commonplace (Furedi 2007).<br />
A nation and national consciousness is not necessarily delineated by<br />
geographical boundaries, and face to face contact is not required for people<br />
to identify with large social groups (such as a nation). Indeed, only the<br />
subjective knowing (Wissen) and a feeling <strong>of</strong> belonging (Zugehörigkeit) are<br />
sufficient to create a national identity and build a nation (Jobst 2005).<br />
‘Information technology has increased our awareness <strong>of</strong> suffering anywhere<br />
in the world’ (Anderson 2010:129) and enables audiences to participate in<br />
the discourse surrounding events, thus constructing private and public<br />
memory (Ibrahim 2010).<br />
That this national consciousness was not limited to geographical<br />
boundaries was reflected in the media by messages <strong>of</strong> support and sympathy<br />
from people outside New Zealand who had either visited Christchurch or<br />
lived there for a period <strong>of</strong> time. These people identified with Christchurch<br />
and New Zealand, and therefore become part <strong>of</strong> the national consciousness<br />
<strong>of</strong> mourning alongside those who were living in New Zealand. On the New<br />
Zealand Herald website, an interactive world map showed how many<br />
messages <strong>of</strong> support were received from various countries. For example, 343<br />
messages were received from the United States <strong>of</strong> America, 293 from the<br />
United Kingdom and 209 from Australia (nzherald.co.nz 2011c). As the<br />
news spread, messages <strong>of</strong> condolences continued pouring in from all over<br />
the world:<br />
I was there for the first one but seeing the devastation this one has<br />
caused is hard to take in, I miss Christchurch more then ever and<br />
my heart goes out to all New Zealanders, I wish I was back home to<br />
give everyone I know a hug. I wish I could get in contact with the<br />
people I know. (expat kiwi in Beijing)—phebz88 (China) 08:52AM<br />
Wednesday, 23 Feb 2011 (nzherald.co.nz, 2011b, online).<br />
426
The Representation <strong>of</strong> National Grief in the Media<br />
The next two messages <strong>of</strong> support clearly show how identification<br />
with a nation crosses geographic boundaries, pointing towards the<br />
connection that is built through tourism and national image:<br />
Dear Friends in Christchurch! As a German ‘Kiwi’ I feel with you<br />
and my thoughts are also with you! I hope you all are well and your<br />
families as well. I feel very sorry for all those lifes which got lost.<br />
Big hug to all <strong>of</strong> you!—Jen (Germany) 12:20AM Wednesday, 23<br />
Feb 2011 (nzherald.co.nz, 2011b, online).<br />
I spent my honeymoon in New Zealand, we arrived in the morning to<br />
Christchurch, we loved the people, we moved the city, walked<br />
around the streets and gardens. I have only great memories <strong>of</strong> your<br />
country and you. This morning I heard this horrible news, I give you<br />
a big hug and many tears. From Spain, from the world.—Àngel<br />
(Spain) 12:51AM Wednesday, 23 Feb 2011. (nzherald.co.nz, 2011b,<br />
online).<br />
By providing the facilities for expression <strong>of</strong> messages, publishing<br />
them and encouraging further messages <strong>of</strong> support, the media draws in the<br />
audiences’ compassion and acts as a conduit and mediator for national<br />
mourning and the expression <strong>of</strong> grief.<br />
Media as a Conduit for National Mourning<br />
The news coverage following a natural disaster does not only provide<br />
information but ‘represents and elicits strong emotion’ (Yell 2010:110).<br />
Emotions shared collectively are typically used to reaffirm social bonds, and<br />
the reporting on these disasters result in these becoming ‘integrative events,<br />
moments <strong>of</strong> national consensus and unity born out <strong>of</strong> mourning together’<br />
(Pantti & Wieten 2005:301). This is similar to Linenthal's (2001:111)<br />
description <strong>of</strong> the construction <strong>of</strong> an imagined nationwide bereaved<br />
community through ‘popular, mediated mournings’.<br />
Representing national mourning and grief is inherently emotional,<br />
and while emotions are embedded in our society (Pantti & Wahl-Jorgenson<br />
2011), the use <strong>of</strong> emotions in journalism is a topic <strong>of</strong> debate, and journalism<br />
427
Theunissen & Mersham<br />
has been soundly and repeatedly criticised for relying on emotion in<br />
reporting. It has been put that emotions have no place in quality journalism<br />
(cf, for example, Williams 1978; Protess et al. 2011; Corcoran 2006).<br />
Perhaps more realistically, others suggest emotion in reporting is<br />
required to aid in creating understanding. Meijer (2001:189), for example,<br />
advocates incorporating ‘emotions’, ‘everyday life’ and a ‘relative sense <strong>of</strong><br />
self’ into a more inclusive concept <strong>of</strong> public quality, media and citizenship.<br />
Pantti and Wahl-Jorgenson (2011) argue that emotions are integral to the<br />
reporting <strong>of</strong> disaster. Hutchinson (2010:70) points out, ‘one may speak ...<br />
speak and write <strong>of</strong> trauma yet words fail to convey the perceptual intensity<br />
<strong>of</strong> feelings, either physical or emotional ones’. Emotionally, the bereaved<br />
will experience a range <strong>of</strong> feelings, including sadness, anger, guild and<br />
anxiety, and by encoding these <strong>of</strong>ten unarticulated experiences within social<br />
symbols and linguistic patterns <strong>of</strong> the contemporary mass media allows the<br />
unspoken aspects <strong>of</strong> trauma to gather social meaning (Hutchinson 2010). It<br />
is ultimately through this meaning that sense can be made <strong>of</strong> a traumatic<br />
event such as a natural disaster, allowing it to be absorbed into the national<br />
consciousness.<br />
The expectation <strong>of</strong> how emotion should be and will be expressed,<br />
depends on so-called ‘feeling rules’ (Furedi 2007). These are defined by a<br />
cultural script that determines the norms or rules about how emotions should<br />
be expressed and what these emotions should mean. Therefore they<br />
influence (or guide) the collective sense-making <strong>of</strong> a national disaster. They<br />
also determine how and when emotion is expressed in media, because—like<br />
all members <strong>of</strong> society—journalists, too, have to adhere to these norms.<br />
Mourning and the subsequent sense-making activity are unlikely to<br />
take place without an element <strong>of</strong> anger, conflict and frustration, and these<br />
too are subject to feeling rules. Anger is not perceived as a unifying value<br />
(Pantti & Wieten 2005), and although reported in the media, is generally not<br />
as widely recounted as more positive values, such as resilience and<br />
community spirit. Pantti and Wahl-Jorgenson (2011) suggest that the most<br />
powerful emotions linked to national disaster is anger but this anger needs a<br />
focal point for expression, and in the case <strong>of</strong> a national disaster it has to be<br />
someone who can be held responsible, such as industry or political<br />
authorities (Pantti & Wahl-Jorgenson 2011). In the case <strong>of</strong> the Christchurch<br />
earthquake, questions were raised why some newer buildings collapsed, why<br />
428
The Representation <strong>of</strong> National Grief in the Media<br />
not all buildings were ‘earthquake-pro<strong>of</strong>ed’, and the speed <strong>of</strong> the recovery<br />
effort. Typically, however, these issues are reported upon as coming from<br />
the victims, their families and external sources, distancing the journalists<br />
from such negative emotions, such as happened in the reporting <strong>of</strong> a group<br />
<strong>of</strong> frustrated business owners who ignored the barrier surrounding the<br />
stricken city centre <strong>of</strong> Christchurch and crossed it in protest to having been<br />
prevented access to their business premises. While their anger was evident<br />
and their actions widely reported as ‘storming a cordon’ (Stuff.co.nz 2011a,<br />
online), by all standards their behaviour remained in the realm <strong>of</strong> civil<br />
disobedience rather than violent expression <strong>of</strong> anger, reaffirming the<br />
nation’s tolerance for peaceful protest.<br />
It remains undisputable that no society can re-establish its identity<br />
without questioning where it has been, where it is and where it is going.<br />
Anger allows the community to raise ‘structural questions <strong>of</strong> collective<br />
significance’ (Pantti & Wahl-Jorgenson 2011:119), and therefore anger as an<br />
emotional dimension <strong>of</strong> grief is crucial in the sense-making stage <strong>of</strong> the<br />
mourning process. But in the case <strong>of</strong> the media, this dimension is reflected<br />
rather than mediated.<br />
A key argument in the debate surrounding the expression <strong>of</strong> emotion<br />
in media reporting relies on the distinction between a private and a public<br />
sphere. If we are to assume that there is indeed such a patent distinction,<br />
then ‘private emotions are presented for public consumption’ (Yell<br />
2010:117) and ‘pain and suffering become tools to conjoin private and<br />
public memory’ (Ibrahim 2010:131). When shown in the media through<br />
headlines, visuals and stories, these emotions evoke affective responses<br />
among the audiences who no longer remain detached. Rather, they enter into<br />
what Yell (2010) calls a parasocial relation with the friends and families <strong>of</strong><br />
the victims, sharing their shock and fear (Hutchinson 2010) as is expressed<br />
in the following message on the New Zealand Herald website:<br />
We feel so helpless watching the devastation <strong>of</strong> the earthquake. We<br />
send all our thoughts and prayers to you all at this time. We are with<br />
you in spirit.—JANET m (New South Wales) 12:20AM Wednesday,<br />
23 Feb 2011.<br />
429
Theunissen & Mersham<br />
This parasocial element can act as a conduit for community building<br />
and the creation <strong>of</strong> identity, and is not limited to national borders (Ibrahim<br />
2010). In this sense, the media can<br />
... unify a group <strong>of</strong> people whose members do not know one another<br />
and turn them into a community whose members share, at least on an<br />
imagined level, one social world. As a carrier <strong>of</strong> symbols and shared<br />
messages to groups and people <strong>of</strong> different backgrounds, the media<br />
assist in the development <strong>of</strong> social integration processes (Avraham<br />
& First 2006:73).<br />
Thus, in the vein <strong>of</strong> this argument, reporting on disasters such as the<br />
Christchurch earthquake can build national identity and consciousness, and<br />
contribute to nation building. Sharing feelings <strong>of</strong> sympathy and shock, and<br />
mourning alongside the victims, solidarity is created and communal<br />
connections are solidified (Hutchinson 2010). The media takes on an<br />
authoritarian role by assuming the role to speak for a society as a whole—<br />
whether it be global, national or local—interpreting the events and<br />
establishing its place in the memory <strong>of</strong> a nation (Riegert & Olssen 2007),<br />
and thus satisfying the emotional dimension <strong>of</strong> grief.<br />
The second dimension <strong>of</strong> grief is cognitive, and this includes<br />
preoccupation with the deceased (or, in this case, the disaster itself),<br />
rumination, fantasising and confusion (Love 2007). The cognitive dimension<br />
is satisfied by the media’s focus on the earthquake and the events<br />
surrounding it—typical <strong>of</strong> reporting during a disaster occurrence. Fantasy,<br />
Brennan (2008:9) suggests, manifests itself in the ‘symbolic domain <strong>of</strong><br />
language and the imagination’ where the inner world meets the outer<br />
world. According to him messages <strong>of</strong> support <strong>of</strong>ten contain such<br />
manifestations.<br />
The third dimension <strong>of</strong> grief is physical, and includes reported<br />
aspects <strong>of</strong> lowered immune functions and somatic complaints, e.g. aches and<br />
pains (Love 2007). This dimension is seldom—if ever—reported on in the<br />
media. One might speculate that it is indeed perceived as too private to place<br />
into the public domain, and perhaps, not as newsworthy as the emotional and<br />
behavioural dimensions. Regardless, victims <strong>of</strong> a disaster are likely to<br />
experience physical aspects <strong>of</strong> grief.<br />
430
The Representation <strong>of</strong> National Grief in the Media<br />
The fourth dimension is behavioural, and includes actions such as<br />
crying, agitation and searching for loved ones (Love 2007). This dimension<br />
has been widely reflected in the media because <strong>of</strong> its obvious news values<br />
and potential to be shown visually in, for example, video clips and<br />
photojournalism. It is <strong>of</strong>ten interlinked with the emotional dimension, and<br />
because <strong>of</strong> poignancy is likely to move audiences to express their grief.<br />
But, it is the fifth dimension <strong>of</strong> grief, namely its existential<br />
dimension that can be perceived as having the greatest impact on nation<br />
building and reaffirmation <strong>of</strong> its identity and consciousness. ‘Disruptions<br />
such as death ... can precipitate searching for meaning in death and the<br />
questioning <strong>of</strong> spiritual beliefs and values, <strong>of</strong>ten resulting in a re-evaluation<br />
<strong>of</strong> core beliefs’ (Love 2007:75). A nation’s identity, and thus its<br />
consciousness, is shaped through its beliefs, values and its attitudes. The<br />
media’s reporting <strong>of</strong> the Christchurch earthquake and its aftermath did not<br />
only involve audiences emotionally but allowed them to metaphysically<br />
mourn alongside those who were directly affected by the quake. It opened<br />
the way for the New Zealand nation to re-evaluate (or re-confirm) its core<br />
values and beliefs, such as preservation <strong>of</strong> heritage, community support and<br />
resilience (a ‘can do’ attitude).<br />
Reports that point towards a re-evaluation or confirmation <strong>of</strong> values<br />
are wide and varied. For example, reports in the media <strong>of</strong> Earthquake<br />
Recovery Minister Gerry Brownlee's suggestion that he would tear down the<br />
heritage buildings as the ‘old buildings killed people when they toppled<br />
during the earthquake’ (nzherald.co.nz 2011a, online) caused outrage, and<br />
reaffirmed New Zealanders’ views on the preservation <strong>of</strong> their heritage. It<br />
also impacted on the political landscape, resulting in Brownlee backtracking<br />
on his suggestion that he planned to bulldoze heritage buildings (The Press<br />
2011a, online). A month later a Canterbury <strong>University</strong> student and victim <strong>of</strong><br />
the earthquake made headlines by handing in her thesis, pointing towards the<br />
underlying discourse <strong>of</strong> resilience and pride in overcoming adversity. Her<br />
supervisor was quoted as saying she had ‘… shown remarkable stoicism and<br />
resilience and we can all be proud <strong>of</strong> her achievement’ (Stuff.co.nz 2011b,<br />
online).<br />
Finally, some form <strong>of</strong> acceptance is achieved when a new identity is<br />
created, changes to lifestyle and plans for the future are made (Love 2007).<br />
Although emotional ties will always remain and the disaster will never be<br />
431
Theunissen & Mersham<br />
forgotten, the bereaved will start looking towards the future. ‘Life will<br />
probably never be the same again, and it is important to acknowledge that’<br />
(Love 2007:82). The media can help move a nation towards acceptance by<br />
reporting on expressions <strong>of</strong> support from the nation, and key figures, such as<br />
the Prime Minister John Key. Love (2007:81) suggests that a ‘bereaved<br />
person needs to interact with others who are empathetic and understanding<br />
<strong>of</strong> their suffering’. It is therefore important that the media becomes a nation's<br />
voice, not only showing the victims’ suffering to the world so others can<br />
understand the impact <strong>of</strong> the disaster but also allowing a nation to express<br />
their affections and support through donations and <strong>of</strong>fers <strong>of</strong> help. Such<br />
support must be given and must be palpable (Love 2007). With <strong>of</strong>fers <strong>of</strong><br />
support and donations posted on various media sites and reported through<br />
national radio and TV channels the media became a conduit for generating<br />
aid—not unlike Ibrahim’s (2010) assertion that mediated trauma does not<br />
only elicit strong emotion but also a humanitarian reaction from individuals<br />
and the community. Expressions <strong>of</strong> support posted onto media websites,<br />
such as The Breeze, New Zealand Herald Online and Trade Me websites<br />
were akin to public condolence books, which Brennan (2008) describes as a<br />
public forum that enable the outward expression <strong>of</strong> inner speech. While<br />
many <strong>of</strong> these condolence books were in the form <strong>of</strong> messages <strong>of</strong> support<br />
online, the Hutt City Council initiated a physical condolence book to be<br />
handed to the Christchurch City Council (Hutt City Council 2011). In doing<br />
so, they not only displayed their support but recognised that the earthquake<br />
would become part <strong>of</strong> their counterpart's heritage, and provided an<br />
opportunity for those who had witnessed the disaster through the media to<br />
express their feelings and support.<br />
Public expression <strong>of</strong> condolences have become a ritual or as<br />
Anderson (2010) describes them, ‘rituals <strong>of</strong> lament’:<br />
Rituals <strong>of</strong> lament foster hope by calling evil, injustice, violence and<br />
irrational suffering by their proper names. Such honesty in our<br />
rituals after public tragedy helps us to restore a belief that the world<br />
is still safe (Anderson 2010:129).<br />
Rituals help restore social order (Roman<strong>of</strong>f & Terenzio 1998) and<br />
therefore a nation’s identity. This includes the media's own response to a<br />
432
The Representation <strong>of</strong> National Grief in the Media<br />
disaster through interruption <strong>of</strong> normal broadcasting, which have become<br />
taken-for-granted. According to Roman<strong>of</strong>f and Terenzio (1998) such rituals<br />
provide a vehicle for expressing and controlling powerful emotions, such as<br />
those experienced as a result <strong>of</strong> grief. Goren (2007) suggests that societies<br />
that have experienced considerable loss <strong>of</strong> life through war or other<br />
catastrophes allow death to figure broadly in their self-image or rituals.<br />
While she does not identify New Zealand per se, losses through earthquake<br />
and other disasters are not a new phenomenon to this country. In the early<br />
20 th century, for example, the city <strong>of</strong> Napier was all but destroyed by an<br />
earthquake, resulting in rebuilding the city centre and re-establishing a new<br />
identity as an art deco city as a result.<br />
But before restoration can begin, the loss and its irreversibility has<br />
to be absorbed (Love 2007). This is likely to take time because grieving is<br />
rarely a linear process. We move through all or some stages <strong>of</strong> grief, and we<br />
move back and forth until we reach acceptance. This lack <strong>of</strong> linearity is<br />
reflected in the media coverage, such as recovery <strong>of</strong> bodies and the lack <strong>of</strong><br />
power and sanitation while showing emotional visuals <strong>of</strong> funerals and griefstricken<br />
disaster victims. When Prime Minister John Key announced that as<br />
many as 10,000 houses might have to be demolished and whole<br />
neighbourhoods relocated, an affected resident was reported as saying:<br />
They need to name the areas now – please tell us ....We are just<br />
struggling with day-to-day living and we don't need somebody to<br />
come and say our suburb won't exist anymore. If that is the case,<br />
we'd like to be told quickly. Our lives are on hold. It's not a nice<br />
feeling; it's not a nice feeling at all (Migone 2011, online).<br />
While the statement reflects a patent need to move forward (typical<br />
<strong>of</strong> a community that values resilience), the emotional impact <strong>of</strong> dealing<br />
simultaneously with the loss and the subsequent practicalities is evident.<br />
This moving between emotions and practicalities in media reporting, reflects<br />
the dual process model <strong>of</strong> coping with bereavement as discussed by Buglass<br />
(2010) where those who are in the process <strong>of</strong> grieving move between dealing<br />
with emotional issues and practical issues (Love 2007).<br />
The dual process model, encompassing restoration-oriented and<br />
loss-oriented processes, suggests that loss-oriented processes are about<br />
433
Theunissen & Mersham<br />
emotional issues such as grief, the intrusion <strong>of</strong> grief, denial or avoidance <strong>of</strong><br />
changes that the restoration process brings and breaking bonds or ties with<br />
what has been lost. These aspects have been widely reported on in the media<br />
coverage <strong>of</strong> Prime Minister John Key’s speech on the occasion <strong>of</strong> the<br />
national Christchurch memorial service:<br />
It is only natural that you want things to simply go back the way they<br />
were. That is a very human desire - to feel the familiar again. To be<br />
angry that your loved one will never return. To long to hear again<br />
the sounds <strong>of</strong> joy and excitement that once filled your homes and<br />
your hearts. Most <strong>of</strong> all I know this is a time <strong>of</strong> great uncertainty.<br />
And I know that such uncertainty makes recovery from this<br />
earthquake slow, painful and difficult. But today I also want to talk<br />
not only <strong>of</strong> loss, but also <strong>of</strong> hope, and healing …. Thank you for<br />
caring. That makes you part <strong>of</strong> the story <strong>of</strong> rebuilding Christchurch<br />
(Scoop Independent News 2011b, online).<br />
Key told mourners and families <strong>of</strong> those who died that the quake<br />
‘had left scars that will never be erased from our land and our hearts’ and it<br />
was time to remember those who had been lost, and to express grief and<br />
sorrow. ‘Let us remember them – they are the faces <strong>of</strong> a Christchurch that<br />
will never be as it was again’…. So today we remember Christchurch as it<br />
was, and we treasure that memory.’ It was a time <strong>of</strong> great uncertainty and the<br />
recovery would be slow, painful and difficult, but it was also a time to<br />
celebrate the power <strong>of</strong> community …’ (Dominion Post 2011, A5).<br />
Restoration-oriented processes are about practical issues, such as<br />
attending to life-style changes, distraction from grief, doing new things and<br />
establishing new roles, identities or relationships (Buglass 2010). Such<br />
processes are reflected in reportage on the current discussions around how<br />
the devastated Christchurch Central Business District (CBD) should be<br />
rebuilt, and are necessary in reaching acceptance, the final stage in the<br />
grieving process. Architect Ian Athfield was quoted as saying ‘through an<br />
unfortunate set <strong>of</strong> circumstances, we have a great chance to make an even<br />
better city’ (Stuff. co.nz, 2011c, online). Not only did his statement reflect<br />
the restoration-oriented processes but it reflected the resilience that is part <strong>of</strong><br />
the New Zealand nation’s identity and consciousness. By reporting on<br />
434
The Representation <strong>of</strong> National Grief in the Media<br />
attempts to recover as well as the devastation itself, a nation is guided<br />
towards recovery.<br />
In many ways, such reporting might be likened to keeping a<br />
collective journal, which Love (2007) suggests is a practical step in moving<br />
towards acceptance. He puts forward that a person affected by grief can help<br />
clarify and integrate the experiences arising from that loss by keeping a<br />
journal. In the case <strong>of</strong> the Christchurch earthquake, the media effectively<br />
becomes a national journal that reports on the disaster and its aftermath,<br />
attempting to make sense <strong>of</strong> it all. By allowing audiences to identify with the<br />
events through emotive stories and explanations ranging from the scientific<br />
to the pseudo-scientific, the sense-making activity is continued (see<br />
Zembylas, 2009), and the audience’s understanding and knowledge <strong>of</strong> the<br />
disaster is improved (Pantti 2010).<br />
Conclusion<br />
The grief that inevitably follows a national disaster forces a nation to reevaluate<br />
and re-establish its identity and key values. The media fulfils a<br />
mediating role in this process through its reporting on such disaster.<br />
Although <strong>of</strong>ten criticised for exploiting these events for its emotional news<br />
value, reportage that encompass raw emotion, graphic images and harsh<br />
realities unites a nation in its grief. It allows those who were not at the scene<br />
<strong>of</strong> the disaster to bear witness and grieve with the victims <strong>of</strong> the disaster. At<br />
the same time, the media reflects the national mourning <strong>of</strong> identity,<br />
livelihoods and lives lost during disasters, and indirectly can aide in the<br />
process <strong>of</strong> mourning for those who have been affected. Had the media not<br />
reported the events as it did, its victims would have might have felt<br />
unsupported and uncared for by their community and fellow nationals.<br />
Reporting also elicits financial and physical help from those who<br />
identify with the affected, and aides in the recovery process and acceptance<br />
<strong>of</strong> loss. Without this support and help, normal grief may lead to what Love<br />
(2007) describes as ‘complicated grief’. In such a case a nation would be<br />
unable to move through a natural process <strong>of</strong> mourning and could struggle to<br />
recover from the disaster. Such a nation would suffer damage to its<br />
consciousness, which may potentially lead to social instability. <strong>Journal</strong>ists’<br />
role is indispensable in managing a nation’s emotions and re-establishing<br />
435
Theunissen & Mersham<br />
social and identity during a time <strong>of</strong> grief (Pantti & Wieten 2005). But while<br />
the New Zealand nation mourned publicly through the media, acceptance is<br />
unlikely to be achieved in the time frame reported here, and reconstruction<br />
<strong>of</strong> livelihoods and re-establishing <strong>of</strong> identity will be a long-term project.<br />
References<br />
Anderson, B 2006. Imagined Communities: Reflections on the Origin and<br />
Spread <strong>of</strong> Nationalism. London: Verso.<br />
Anderson, H 2010. Common Grief, Complex Grieving. Pastoral Psychology<br />
59: 127-136. doi: 10.1007/s11089-009-0243-5.<br />
Avraham, E & A First 2006. Media, Power and Space: Ways <strong>of</strong> Constructing<br />
the Periphery as the ‘other’. Social & Cultural Geography 7, February,<br />
1: 71-86. doi: 10.1080/14649360500451741.<br />
Bhowmick, PK, A Basu & P Mitra 2010. Classifying Emotion in News<br />
Sentences: When Machine Classification Meets Human Classification.<br />
International <strong>Journal</strong> on Computer Science and Engineering 2,1: 98-<br />
108.<br />
Brennan, M 2008. Mourning and Loss: Finding Meaning in the Mourning<br />
for Hillsborough. Mortality 13,1: 1-23. doi: 10.1080/13576270701783<br />
082.<br />
Buglass, E 2010. Grief and Bereavement Theories. Nursing Standard<br />
24,June,41: 44-47.<br />
Corcoran, PE 2006. Emotional Framing in Australian <strong>Journal</strong>ism. Paper<br />
presented at the Australian & New Zealand Communication Association<br />
International Conference, Adelaide, Australia, 4-7 July. ANZCA.<br />
Retrieved from http://www.adelaide.edu.au/anzca2006/conf proceed<br />
ings/corcoran_paul_emotionalframing.pdf.<br />
De Jong, L 2011. Interview with the Comfort Crusaders. TNVZ Breakfast, 3<br />
March. Podcast retrieved from http://tvnz.co.nz/podcasts.<br />
Dominion Post, 2011. Scars can never be erased, says Key, but we will<br />
rebuild. 19 March, A5.<br />
Donnell , H 2011. Shot Man an Earthquake Refugee. nzherald.co.nz, 28<br />
March. Retrieved from http://www.nzherald.co.nz/nz/news/article.cfm?c<br />
id=1&objectid=10715486.<br />
Furedi, F 2007. From the Narrative <strong>of</strong> the Blitz to the Rhetoric <strong>of</strong> Vulner-<br />
436
The Representation <strong>of</strong> National Grief in the Media<br />
ability. Cultural Sociology 1,2: 235-254. doi: 10.1177/ 1749975507<br />
078189.<br />
Goren, E 2007. Society’s Use <strong>of</strong> the Hero Following a National Trauma. The<br />
American <strong>Journal</strong> <strong>of</strong> Psychoanalysis 67: 37-52. doi: 10.1057/ palgrave.<br />
ajp.3350013.<br />
Guibernau M & J Rex 2010. The Ethnicity Reader: Nationalism,<br />
Multiculturalism and Migration. Cambridge, UK: Polity Press.<br />
Heap, B 2011. Thoughts and Feelings on the Christchurch Earthquake from<br />
Australia, 24 February. Available at http://www.brad.net.nz/blog/<br />
2011/02/thoughts-and-feelings-on-the-christchurch-earthquake-fromaustralia/.<br />
Hutchinson, E 2010. Trauma and the Politics <strong>of</strong> Emotions: Constituting<br />
Identity, Security and Community after the Bali Bombing. International<br />
Relations 24,1: 65-86. doi: 10.1177/0047117809348712.<br />
Hutt City Council 2011. Leave messages <strong>of</strong> support for Christchurch. Press<br />
Release. Scoop Independent News, 7 March. Retrieved from http://<br />
www.scoop.co.nz/stories/AK1103/S00318/leave-messages-<strong>of</strong>-supportfor-christchurch.htm.<br />
Ibrahim, Y 2010. Distant Suffering and Postmodern Subjectivity: The<br />
Communal Politics <strong>of</strong> Pity. Nebula 7,1/7,2,June: 122-135.<br />
Jobst, S 2005. Europäisches Bewusstsein: Zur Definition eines<br />
vielschichtigen Begriffes und seiner Bildungstheoretischen Bedeutung.<br />
Review <strong>of</strong> Education 51: 385-402. doi: 10.1007/s11159-005-5145-x.<br />
Karinthy, F 2006. Chain-Links. In Newman, EJ & J Watts (eds): The<br />
Structure and Dynamics <strong>of</strong> Networks. New Jersey: Princeton <strong>University</strong><br />
Press.<br />
Linenthal, ET 2001. The Unfinished Bombing: Oklahoma City in American<br />
Memory. Oxford: Oxford <strong>University</strong> Press.<br />
Love, AW 2007. Progress in Understanding, Complicated Grief, and Caring<br />
for the Bereaved. Contemporary Nurse 27,1: 73-83.<br />
MacGibbon, N 2008. Degrees <strong>of</strong> Separation in the New Zealand Workforce:<br />
Evidence from linked employer-employee data. Retrieved from<br />
http://www.stats.govt.nz/browse_for_stats/work_income_and_spending/<br />
employment_and_unemployment/degrees-<strong>of</strong>-separation.aspx.<br />
Meijer, IJ 2001. The Public Quality <strong>of</strong> Popular <strong>Journal</strong>ism: Developing a<br />
Normative Framework. <strong>Journal</strong>ism Studies 2,2: 189 – 205.<br />
437
Theunissen & Mersham<br />
Migone, P 2011. Shaky Residents want Information. nzherald.co.nz, 9<br />
March, online. Retrieved from http://www.nzherald.co.nz/ nz/news/<br />
article. cfm?c_id=1&objectid=10711189.<br />
Milgram S, 1967. The Small World Problem. Psychology Today 2: 60 - 67.<br />
nzherald.co.nz 2011a. Brownlee Takes Hard Line on Damaged Heritage<br />
Buildings, 5 March. Retrieved from http://www.nzherald.co.nz/Christ<br />
church-earthquake/news/article.cfm?c_id=1502981&objected =107103<br />
18.<br />
nzherald.co.nz 2011b. Send your Messages <strong>of</strong> Support to the Canterbury<br />
Earthquake Victims, 22 February. Retrieved from 25 March http://<br />
www.nzherald.co.nz/nz/news/article.cfm?c_id=1&objectid=10708120&<br />
pnum=3.<br />
nzherald.co.nz 2011c. World Supports Christchurch. Retrieved 25 March<br />
from http://www.nzherald.co.nz/nz/news/article.cfm?c_id=1&objectid<br />
=10708120&pnum=3.<br />
Pantti M 2010. The Value <strong>of</strong> Emotion: An Examination <strong>of</strong> Television<br />
<strong>Journal</strong>ists’ Notions on Emotionality. European <strong>Journal</strong> <strong>of</strong><br />
Communication 25,2: 168-181. doi: 10.1177/0267323110363653.<br />
Pantti, MK & K Wahl-Jorgenson 2011. ‘Not an act <strong>of</strong> God’: Anger and<br />
Citizenship in Press Coverage <strong>of</strong> British Man-made Disasters. Media,<br />
Culture & Society 33,1: 105-122. doi: 10.1177/0163443710385503.<br />
Pantti. M & J Wieten 2005. Mourning Becomes the Nation: Television<br />
Coverage <strong>of</strong> the Murder <strong>of</strong> Pim Fortuyn. <strong>Journal</strong>ism Studies 6,3: 301-<br />
313. doi: 10.1080/14616700500131893.<br />
Protess, DF, J Cook, J Doppelt, J Ettema, M Gordon, D Leff & P Miller<br />
1991. The <strong>Journal</strong>ism <strong>of</strong> Outrage: Investigative Reporting and Agenda<br />
Building in America. New York: Guilford Press.<br />
Radio New Zealand 2011. Farmy Army Puts Away the Shovels - For Now. 9<br />
March. Retrieved from http://www.radionz.co.nz/news/canterburyearthquake/69958/farmy-army-puts-away-the-shovels-for-now.<br />
Riegert, K & E Olssen 2007. The Importance <strong>of</strong> Ritual in Crisis <strong>Journal</strong>ism.<br />
<strong>Journal</strong>ism Practice 1,2: 143-158. doi: 10.1080/17512780701275457.<br />
Roman<strong>of</strong>f BD & M Terenzio 1998. Rituals and the Grieving Process. Death<br />
Studies 22, 697-711.<br />
Sargent LM 2009. Contemporary Political Ideologies: A Comparative<br />
Analysis. 14 th Ediiton. Belmont, CA: Wadsworth.<br />
438
The Representation <strong>of</strong> National Grief in the Media<br />
Smith A 2010. Nationalism: Key Concepts. 2 nd Edition. Cambridge: Polity..<br />
Scoop Independent New, 2011. ‘A Job Well Done for Rangiora Earthquake<br />
Express’, 1 March. Retrieved from http://www.scoop.co.nz/stories/<br />
AK1103/S00058/a-job-well-done-for-rangiora-earthquake-express.htm.<br />
Retrieved 9 March 2011.<br />
Scoop Independent News 2011. Key Notes: National Memorial Service.<br />
Press release: John Key, 18 March. Retrieved from http://www.scoop.<br />
co.nz/stories/PA1103/S00316/key-notes-national-memorial-service.htm.<br />
Stuff.co.nz 2008. 6 Degrees <strong>of</strong> Separation? Actually, 6.6, 3 August.<br />
Retrieved 4 March 2011 from http://www.stuff.co.nz/technolgy/5<br />
62747.<br />
Stuff.co.nz 2011a. Christchurch Earthquake Anger Erupts, 21 March.<br />
Retrieved from http://www.stuff.co.nz/national.<br />
Stuff.co.nz 2011b. Earthquake Survivor Delivers her Thesis, 24 March.<br />
Retrieved from http://www.stuff.co.nz/national.<br />
Stuff.co.nz 2011c. ‘Sympathy’ for Athfield’s Views on Christchurch, 24<br />
March. Stuff.co.nz. Retrieved from http://www.stuff.co.nz/national.<br />
The Breeze 2011. Send your messages <strong>of</strong> support to Christchurch. Retrieved<br />
9 March from http://www.thebreeze.co.nz/Send-Your-Messages-<strong>of</strong>-<br />
Support-to-Christchurch/tabid/566/articleID/2382/Default.aspx.<br />
The Press 2011a. Christchurch Earthquake: ‘Wrong time for heritage focus;<br />
– Brownlee, 7 March. Retrieved from http://www.stuff.co.nz/the-press/<br />
news/christchurch-earthquake-2011/4740191/Christchurch-earthquake-<br />
Wrong-time-for-heritage-focus-Brownlee.<br />
The Press 2011b. Victims <strong>of</strong> the Quake, 22 February. Retrieved from<br />
http://www.stuff.co.nz/national/christchurch-earthquake/quake-victims.<br />
Two Degree <strong>of</strong> Separation website 1: http://businessblogs.co.nz/ 2009/07/<br />
six-five-four-three-two-degrees-<strong>of</strong>-separation-blast-<strong>of</strong>f-with-linked-in/.<br />
Two Degree <strong>of</strong> Separation website 2: http://www.postkiwi.com/2009/twodegrees-<strong>of</strong>-separation-in-nz/.<br />
Two Degree <strong>of</strong> Separation website 3: http://tvnz.co.nz/breakfast-news/breakfastwednesday-august-26-2946516/video?vid=2946900).<br />
Two Degree <strong>of</strong> Separation website 4: http://karldufresne.blogspot.com/<br />
2010/10/two-degrees-<strong>of</strong>-separation.html.<br />
Two Degree <strong>of</strong> Separation website 5: http://frugalkiwi.co.nz/2011/02/twodegrees-<strong>of</strong>-devastation-nz-earthquake/.<br />
439
Theunissen & Mersham<br />
Two Degree <strong>of</strong> Separation website 6: http://www.brad.net.nz/blog/ 2011/02/<br />
thoughts-and-feelings-on-the-christchurch-earthquake-from-australia/.<br />
Two Degree <strong>of</strong> Separation website 7: http://www.blogher.com/ two-degrees<br />
-devastation-new-zealand-earthquake.<br />
Two Degree <strong>of</strong> Separation website 8: http://www. scoop.co.nz/stories/<br />
AK1102/S00959/auckland-support-for-christchurch.htm.<br />
Yell S 2010. ‘Breakfast is now tea, toast and tissues’: Affect and the Media<br />
Coverage <strong>of</strong> Bushfires. Media International Australia 137: 109-119.<br />
Williams PN 1978. Investigative Reporting and Editing. Englewood Cliffs,<br />
NJ: Prentice-Hall.<br />
Zembylas M 2009. Making Sense <strong>of</strong> Traumatic Events: Toward a Politics <strong>of</strong><br />
Aporectic Mourning in Educational Theory and Pedagogy. Educational<br />
Theory 59,1: 85-104.<br />
440<br />
Petra Theunissen<br />
AUT <strong>University</strong><br />
Auckland, New Zealand<br />
petra.theunissen@aut.ac.nz<br />
Gary Mersham<br />
The Open Polytechnic<br />
Lower Hutt, New Zealand<br />
gary.mersham@openpolytechnic.ac.nz
Contributors <br />
Shamim Bodhanya holds PhD, an MBA, and a BSc. Electronic Engineering<br />
degrees. As a trained and practising engineer, Shamim worked in the<br />
corporate sector for nearly 14 years, where he served in a variety <strong>of</strong><br />
functional, pr<strong>of</strong>essional and managerial capacities before joining academia.<br />
He is now actively involved in research, supervision, programme and module<br />
development, lecturing, facilitation and consulting. He is based at the<br />
Leadership Centre, <strong>University</strong> <strong>of</strong> <strong>KwaZulu</strong>-<strong>Natal</strong>.He draws on interdisciplinary<br />
research to work with complex real world problems. This is<br />
reflected in the areas that he has researched, taught or consulted in. These<br />
include sugar cane supply chains, international business, globalisation,<br />
strategy development, scenario planning, cross cultural management and<br />
diversity, complexity theory, and system dynamics. Shamim serves as<br />
Chairman – Board <strong>of</strong> Directors <strong>of</strong> the Institute for Natural Resources.<br />
Contact details: bodhanyas1@ukzn.ac.za<br />
Harry Maishe Bopape is a Administrative Manager in the School <strong>of</strong><br />
Computing at the <strong>University</strong> <strong>of</strong> South Africa(UNISA). He holds a Masters <strong>of</strong><br />
Business Leadership degree from UNISA’s School <strong>of</strong> Business Leadership<br />
and currently studying towards his PhD in Information Systems. He is an<br />
emerging researcher with few publications. Contact details:<br />
bopaphm@unisa.ac.za<br />
Yvette Chetty works as a Faculty Officer (Access) at the <strong>University</strong> <strong>of</strong><br />
<strong>KwaZulu</strong>-<strong>Natal</strong>. She is involved in the selection <strong>of</strong> students from historically<br />
disadvantaged schools into the Science Access Programmes. Yvette is<br />
currently completing her Masters in Commerce, specialising in Marketing at<br />
the <strong>University</strong> <strong>of</strong> <strong>KwaZulu</strong>-<strong>Natal</strong> in Pietermaritzburg and is interested in<br />
researching how the Access Programmes are positioned within its target<br />
<strong>Alternation</strong> Special Edition 4 (2011) 441 - 449 441<br />
ISSN 1023-1757
Contributors<br />
market and what factors affect its enrolment targets being met. Contact<br />
details: VigarD@ukzn.ac.za<br />
Andrew Christison obtained his M.Com degree in Finance in 2008 and his<br />
LLB in 2009. He taught Finance for several years at the <strong>University</strong> <strong>of</strong><br />
<strong>KwaZulu</strong>-<strong>Natal</strong> before leaving to pursue a career in Law. Completing his<br />
pupilage in 2010 he was admitted to the Pietermaritzburg Bar and has been<br />
practicing as an advocate. He continues to supervise and teach part-time at<br />
the <strong>University</strong> <strong>of</strong> <strong>KwaZulu</strong>-<strong>Natal</strong>. Contact details: christison.a@gmail.com<br />
Ruth de Villiers is a Research Pr<strong>of</strong>essor in the School <strong>of</strong> Computing at<br />
UNISA. She has a PhD and holds masters degrees in Information Systems<br />
and Computer-integrated Education respectively. For more than twenty-five<br />
years, she has taught Computer Science and Informatics. Her main research<br />
interests are Human-Computer Interaction and e-Learning. She has<br />
combined the two domains by undertaking design and evaluation in the<br />
usage, user experience, and usability <strong>of</strong> a variety <strong>of</strong> e-learning and mlearning<br />
applications, educational web environments and e-training systems.<br />
She also publishes on Research Design and Methodology. Ruth supervises<br />
masters and doctoral students in the fields mentioned. Contact details:<br />
Dvillmr@unisa.ac.za<br />
Cecile Gerwel obtained her MCom (Leadership Studies) from the <strong>University</strong><br />
<strong>of</strong> <strong>KwaZulu</strong>-<strong>Natal</strong> (UKZN) in Durban, South Africa in 2009. She is currently<br />
a lecturer in the Leadership Centre at UKZN. Her research interests are<br />
focused on organisational behaviour, change management, leadership,<br />
learning, simulation and gaming, complexity theory, and systems<br />
thinking. Contact details: Gerwel@ukzn.ac.za<br />
Jeevarathnam P. Govender obtained his PhD in Marketing in 2003 at<br />
Potchefstroom <strong>University</strong>, South Africa. He is currently Senior Lecturer at<br />
the Durban <strong>University</strong> <strong>of</strong> Technology where he teaches Marketing,<br />
Marketing Research and Research Methodology. He was a schoolteacher for<br />
five years before moving into higher education. He has presented papers at<br />
local as well as international conferences and has an extensive post graduate<br />
supervision record. He has also taught on postgraduate programmes. Contact<br />
details: govendej@dut.ac.za<br />
442
443<br />
Contributors<br />
Krishna K. Govender obtained his PhD in 2000 from UCT. He is currently<br />
a pr<strong>of</strong>essor in the School <strong>of</strong> Management and Deputy Dean in the Faculty <strong>of</strong><br />
Management Studies at UKZN, responsible for higher degrees and postgraduate<br />
matters. His area <strong>of</strong> expertise is services marketing and service quality.<br />
Contact details: govenderkr@ukzn.ac.za<br />
Grant Royd Howard is an Information Systems lecturer in the School <strong>of</strong><br />
Computing at the <strong>University</strong> <strong>of</strong> South Africa. He is a PhD student at the<br />
North-West <strong>University</strong>, Mafikeng, South Africa. He obtained his Master <strong>of</strong><br />
Science degree in Information Systems at the <strong>University</strong> <strong>of</strong> South Africa. He<br />
has presented papers at a local and an international conference. Contact<br />
details: howargr@unisa.ac.za.<br />
<strong>Rembrandt</strong> <strong>Klopper</strong> is an Honorary Research Fellow in the School <strong>of</strong><br />
Information Systems & Technology at the <strong>University</strong> <strong>of</strong> <strong>KwaZulu</strong>-<strong>Natal</strong>. He<br />
supervises masters and doctoral students and is a special issues editor <strong>of</strong> the<br />
South African interdisciplinary scholarly journal, <strong>Alternation</strong>. Contact<br />
details: rklopper@gmail.com<br />
Hans Lehmann has some 40 years <strong>of</strong> technical, business and academic<br />
experience with information technology. After more than two decades in IT<br />
line management and as an international management consultant with<br />
Deloitte (in Africa, the United Kingdom, continental Europe, North America<br />
and Australasia) he joined the <strong>University</strong> <strong>of</strong> Auckland, New Zealand in 1991,<br />
focusing his research on the strategic management <strong>of</strong> information<br />
technology. He holds degrees from <strong>Natal</strong> (now UKZN), UNISA and a<br />
PhD from Auckland (2000). Now the Associate Pr<strong>of</strong>essor for Electronic<br />
Business at Victoria <strong>University</strong> <strong>of</strong> Wellington he specialises in the<br />
application <strong>of</strong> Grounded Theory to information systems research. Contact<br />
details: Hans.Lehmann@vuw.ac.nz<br />
Sam Lubbe is a pr<strong>of</strong>essor in the Department <strong>of</strong> Information Systems, NWU<br />
Mafikeng. He has a PhD from Wits and a MCom from UCT. He has<br />
published many articles, chapters in books and read papers at many<br />
international conferences. He has many postgraduate students that has<br />
passed. Contact details: sam.lubbe@nwu.ac.za
Contributors<br />
Manoj Maharaj obtained his PhD in Applied Mathematics (General<br />
Relativity) in 1995 at <strong>University</strong> <strong>of</strong> <strong>Natal</strong>, South Africa. He is currently<br />
Associate Pr<strong>of</strong>essor in Information Systems & Technology at the <strong>University</strong><br />
<strong>of</strong> <strong>KwaZulu</strong>-<strong>Natal</strong> where he teaches Information Security. He spent the first<br />
14 years <strong>of</strong> his academic career in the Department <strong>of</strong> Mathematics and<br />
Applied Mathematics where he was involved in research on Eintein's Theory<br />
<strong>of</strong> Relativity and latterly in Numerical Relativity. He has published widely<br />
on varying topics and currently supervises a large number <strong>of</strong> Masters and<br />
Doctoral candidates on topics within the field <strong>of</strong> Information<br />
Systems. Contact details: Maharajms@ukzn.ac.za<br />
Preesha Maharaj has recently completed a Master <strong>of</strong> Commerce degree in<br />
Management at the <strong>University</strong> <strong>of</strong> <strong>KwaZulu</strong>-<strong>Natal</strong>. She has also attained her<br />
Honours and undergrad degree in Management and Industrial Psychology at<br />
UKZN. Miss Maharaj takes interest in research fields such as international<br />
diversity, culture and general management. She currently works in the<br />
project management division for a Dbn-based Management Consultant where<br />
she is involved in business process re-engineering, strategic management and<br />
business analysis. Contact details: preesham@gmail.com<br />
Joao Matias completed his Honours degree in Finance in 2007. He is<br />
currently working as a Junior Wealth Manager for Barnard Jacobs Mellet.<br />
Contact details: joaom@bjm.co.za<br />
Gary Mersham obtained his PhD in Communication Science in 1989 at the<br />
<strong>University</strong> <strong>of</strong> South Africa. Currently he is an Associate Pr<strong>of</strong>essor at the<br />
Open Polytechnic where he teaches Organisational Communication,<br />
Communication Management and Global Communications. He has published<br />
widely, authoring eight books and numerous peer reviewed research articles.<br />
He has been a visiting pr<strong>of</strong>essor at institutions in Australia, the United States<br />
and Africa. He spent many years in broadcast and print media, has been a<br />
partner in a IT training and web development company and currently<br />
consults to a number <strong>of</strong> community, government and corporate clients.<br />
Contact details: gary.mersham@gmail.com<br />
Charles O’Neill obtained his PhD in Development Economics at Rhodes<br />
444
445<br />
Contributors<br />
<strong>University</strong>, South Africa. He is currently Pr<strong>of</strong>essor at the British university in<br />
Egypt where he teaches International Marketing and Retailing and Strategic<br />
Marketing. He spent the first 15 years <strong>of</strong> his career in industry where he<br />
worked for a trade union, managed an animal feed factory and worked as a<br />
small business consultant. He then held positions as Research fellow at the<br />
<strong>University</strong> <strong>of</strong> Ulster in Northern Ireland, Senior Lecturer at the <strong>University</strong> <strong>of</strong><br />
Stellenbosch and Associate Pr<strong>of</strong>essor at the <strong>University</strong> <strong>of</strong> <strong>KwaZulu</strong>-<strong>Natal</strong><br />
where he still holds the position <strong>of</strong> Senior Research Associate. He published<br />
widely in the area <strong>of</strong> Entrepreneurship and has been guest lecturer in<br />
Northern Ireland, Belgium and the DRC. Contact details:<br />
charles.oneill@bue.edu.eg<br />
Qi (David) Panis a Chinese national who obtained undergraduate<br />
qualifications in China and completed his Master’s degree in Marketing at<br />
the Durban <strong>University</strong> <strong>of</strong> Technology, South Africa in 2009. He has held<br />
various positions in the Chinese wholesale and retail sector for over 10 years.<br />
Contact details: qpan@gmail.com<br />
Rubeshan Perumal (MBChB) is a medical research fellow at the Centre for<br />
the AIDS Programme <strong>of</strong> Research in South Africa and is also a medical<br />
doctor in the public health service. Dr Perumal is passionate about TB-HIV<br />
research and his ongoing work on promoting annual HIV surveillance at TB<br />
facilities, as well the operational challenges in integrating TB and HIV<br />
services to optimize health outcomes. Other areas <strong>of</strong> interest include research<br />
methodology, public management, health economics, infectious disease<br />
epidemiology and behavioural medicine. Contact details:<br />
Perumal@ukzn.ac.za<br />
Sadhasivan (Ronnie) Perumal (BCom[Hons], MCom, DCom) is based in<br />
the School <strong>of</strong> Management at the <strong>University</strong> <strong>of</strong> <strong>KwaZulu</strong>-<strong>Natal</strong>. He has 18<br />
years <strong>of</strong> experience in the financial administration <strong>of</strong> the <strong>University</strong> and<br />
spent the past 18 years in academia lecturing in financial management,<br />
human resources, corporate governance, strategic management,<br />
entrepreneurship and marketing management. He has previously occupied<br />
the roles <strong>of</strong> Head <strong>of</strong> School, Deputy Head <strong>of</strong> School and Dean’s Assistant.<br />
He also serves on the National Regulator for Compliance Specifications. His
Contributors<br />
current research interests include managing diversity in the evolving sociopolitical<br />
climate <strong>of</strong> South Africa, workload equity amongst academics, and<br />
management education. Pr<strong>of</strong> Perumal is the Chairperson for the Freestate<br />
Treasury and Premier Cluster Audit Committee. Contact details:<br />
perumals@ukzn.ac.za<br />
Kiru Pillay obtained his Masters degree in Information Systems in 2010 at<br />
<strong>University</strong> <strong>of</strong> the Witwatersrand, South Africa. He is currently reading for<br />
his Doctorate in Information Systems & Technology at the <strong>University</strong> <strong>of</strong><br />
<strong>KwaZulu</strong>-<strong>Natal</strong>. He spent 22 years in industry as an information systems<br />
specialist in the telecommunications sector. His Doctoral research is on the<br />
role <strong>of</strong> Web2.0 in Social Advocacy. Contact details: kiru2010@gmail.com<br />
Rosemary D. Quilling is a Senior Lecturer at the <strong>University</strong> <strong>of</strong> <strong>KwaZulu</strong>-<br />
<strong>Natal</strong>, South Africa, in the School <strong>of</strong> Information Systems & Technology.<br />
Rose has been involved in Higher Education for the past 14 years, the<br />
first half <strong>of</strong> which was spent in historically disadvantaged<br />
institutions (HDIs). She is one <strong>of</strong> the founders <strong>of</strong> the NextEdprogramme,<br />
which seeks to facilitate the development <strong>of</strong> a worldwide virtual<br />
collaborative educational network. Current focus <strong>of</strong> NextEd is on connecting<br />
African faculty and students globally. The role <strong>of</strong> technology in education,<br />
team dynamics and online culture are keen areas <strong>of</strong> interest. She can also be<br />
located as RoseQ (twitter) and ResomyraFelwitch (Second Life). Contact<br />
details: quillingr@ukzn.ac.za<br />
Shaun Ramroop obtained his PhD in Statistics in 2008 at <strong>University</strong><br />
<strong>KwaZulu</strong>-<strong>Natal</strong>, South Africa. He currently is a Senior Lecturer at the<br />
<strong>University</strong> <strong>of</strong> <strong>KwaZulu</strong>-<strong>Natal</strong> where he teaches Statistics at undergraduate<br />
and postgraduate levels. He has also worked prior to joining the university as<br />
a Biometrician at the South African Sugar Experimentation Centre, Mount<br />
Edgecombe. He has focused on applying statistics and has published in<br />
statistical and non-statistical journals. Contact details: ramroops@ukzn.ac.za<br />
Mike Nyamazana Sikwila obtained his PhD in 1992 at <strong>University</strong> <strong>of</strong> Bath,<br />
England (UK). He is currently a senior lecturer in economics at North West<br />
<strong>University</strong> Mafikeng campus South Africa. He is also a director <strong>of</strong> the<br />
446
447<br />
Contributors<br />
School <strong>of</strong> Economics and Decision Sciences in the Faculty <strong>of</strong> Commerce and<br />
Administration North West <strong>University</strong>, Mafikeng Campus. He spent 6 years<br />
<strong>of</strong> his career working for the government <strong>of</strong> Zimbabwe as director <strong>of</strong> policy<br />
and plan formulation. He has worked for the Reserve Bank <strong>of</strong> Zimbabwe,<br />
taught at the <strong>University</strong> <strong>of</strong> Zimbabwe and the Zimbabwe Open <strong>University</strong>.<br />
Contact details: Mike.sikwila@nwu.ac.za<br />
Lesley Stainbank CA(SA) obtained her D. Com. from the <strong>University</strong> <strong>of</strong><br />
South Africa. She is a Pr<strong>of</strong>essor <strong>of</strong> Financial Accounting in the School <strong>of</strong><br />
Accounting, and is Dean <strong>of</strong> the Faculty <strong>of</strong> Management Studies at the<br />
<strong>University</strong> <strong>of</strong> <strong>KwaZulu</strong>-<strong>Natal</strong>. She teaches financial accounting mainly at<br />
the masters level. She is a co-author <strong>of</strong> the text book A Student's Guide to<br />
International Financial Reporting which is prescribed by seven universities in<br />
South Africa at either the third year- or honours level. She is serves on the<br />
editorial boards <strong>of</strong> the SA <strong>Journal</strong> <strong>of</strong> Accounting Research and the African<br />
<strong>Journal</strong> <strong>of</strong> Accounting, Economic, Finance and Banking Research and she is<br />
an Editorial Adviser to Accounting Education: An International <strong>Journal</strong>,<br />
representing the International Association for Accounting Education and<br />
Research. Contact details: Stainbankl@ukzn.ac.za<br />
Barry Strydom holds an Honours degree in Finance and an MBA degree<br />
from the <strong>University</strong> <strong>of</strong> <strong>Natal</strong>. He began teaching Finance in 1992 and has<br />
taught undergraduate and post-graduate modules in Corporate Finance,<br />
Investment management, Risk Management and Business Strategy. He is<br />
currently a senior lecturer in The School <strong>of</strong> Economics and Finance at the<br />
<strong>University</strong> <strong>of</strong> <strong>KwaZulu</strong>-<strong>Natal</strong>. Contact details: strydomb@ukzn.ac.za<br />
Sanjay Soni is a lecturer at the <strong>University</strong> <strong>of</strong> <strong>KwaZulu</strong>-<strong>Natal</strong> (UKZN) and<br />
has over 22 years full-time teaching experience at both undergraduate and<br />
postgraduate levels. He has lectured in the fields <strong>of</strong> Entrepreneurship,<br />
Marketing, Marketing Research, Services Marketing, General Management<br />
and Research Methodology. Contact details: Soni@ukzn.ac.za<br />
Mercy BihTafuh obtained her Masters in Accountancy in 2009 from the<br />
<strong>University</strong> <strong>of</strong> <strong>KwaZulu</strong>-<strong>Natal</strong>. She has a BSc. (Hons) Accounting from the<br />
<strong>University</strong> <strong>of</strong> Buea , Cameroon . She worked as an accountant in a financial
Contributors<br />
institution in Bamenda, Cameroon from 2002 to 2005. She is currently<br />
working as an accountant in a Non-Pr<strong>of</strong>it Organization in Johannesburg<br />
known as INERELA+. Contact details: Mtafuh@yahoo.com<br />
Petra Theunissen obtained her MA (cum laude) at the Rand Afrikaans<br />
<strong>University</strong>, Johannesburg, and her D.Phil. in Communication Management at<br />
the <strong>University</strong> <strong>of</strong> Pretoria, South Africa. She is currently a Senior Lecturer at<br />
the School <strong>of</strong> Communication Studies at AUT <strong>University</strong> in Auckland, New<br />
Zealand where she teaches, among others, public relations, human resource<br />
communication and knowledge management. She has published on a variety<br />
<strong>of</strong> topics ranging from change management to public relations, and is one <strong>of</strong><br />
the co-editors <strong>of</strong> Public Relations and Communication Management: An<br />
Aotearoa/New Zealand Perspective. Contact details: petra.theunissen@<br />
aut.ac.nz<br />
Mc Donald van der Merwe is a Senior Lecturer in the School <strong>of</strong> Computing<br />
at UNISAwhere he teaches Internet Programming and Information Systems<br />
Development. He received his PhD in Technology Educationfrom UNISA in<br />
2008. Fortunate to have open access to several web servers, he pursues an<br />
active research agenda that seeks to implement and evaluate innovative<br />
teaching and learning web-based tools in an Open Distance Learning<br />
Environment. Before he discovered computers, he lectured in the field <strong>of</strong><br />
Human Movement Science at various universities throughout South Africa.<br />
Contact details: Vdmertm@unisa.ac.za<br />
Debbie Vigar-Ellis is an Associate Pr<strong>of</strong>essor in Marketing in the School <strong>of</strong><br />
Management. She is coordinator <strong>of</strong> self-funded programmes for the<br />
Pietermaritzburg campus <strong>of</strong> the School. She is also programme director <strong>of</strong><br />
the Local Economic Development and Management Post Graduate Diplomas.<br />
In previous years she has headed up the Post Graduate Diplomas in<br />
Marketing and the MBA programme <strong>of</strong> the former <strong>University</strong> <strong>of</strong> <strong>Natal</strong>.<br />
Debbie has also been involved with a variety <strong>of</strong> similar programmes at other<br />
South African universities. Debbie is a graduate <strong>of</strong> the <strong>University</strong> <strong>of</strong> Cape<br />
Town and her primary areas <strong>of</strong> expertise are Strategic Marketing and<br />
Planning, Global Marketing, Green Marketing, Marketing and Education,<br />
areas which she has taught, consulted and published in for over 10 years.<br />
Contact details: VigarD@ukzn.ac.za<br />
448
449<br />
Contributors<br />
Patrick Kanyi Wamuyu obtained his PhD in Information Systems at<br />
<strong>University</strong> <strong>of</strong> <strong>KwaZulu</strong>-<strong>Natal</strong>, South Africa, in 2011. He is currently<br />
employed at Daystar <strong>University</strong> in Kenya where he teaches Information<br />
Systems. His research was on the role <strong>of</strong> wireless technologies in enabling<br />
SMMEs in rural Kenya. Contact details: kanyiwamuyu@yahoo.com
Editorial Associates <br />
(1994 – 2011)<br />
K<strong>of</strong>i Acheampong (Walter Sisulu)<br />
Catherine Addison (UZ)<br />
Fathima Ahmed (UKZN)<br />
Andrea Alcock (DUT)<br />
P.M. Alexander (UP)<br />
Dick Allwright (Lancaster)<br />
Nyna Amin (UKZN)<br />
Peter Anderson (UCT)<br />
Arlene Archer (UCT)<br />
Udo Averweg (UKZN)<br />
Richard Bailey (UKZN)<br />
Daryl Balia (U. Edinburgh)<br />
Ismail Banoo (CSIR)<br />
Lawrie Barnes (UNISA)<br />
Krish Baruthram (UKZN)<br />
Ahmed Bawa (DUT)<br />
Nigel Bell (UZ)<br />
Kantilal Bhowan (UKZN)<br />
S. Bhulungu (Wits)<br />
Stephen Bigger (U. Worcester)<br />
Sr. N. Gloria Irenata Biyela (SF)<br />
Mathew Blatchford (UFH)<br />
Craig Blewett (UKZN)<br />
Urmilla Bob (UKZN)<br />
Shamim Bodhanya (UKZN)<br />
Carole Boyce-Davies (Florida Int.)<br />
Patrick Bond (UKZN)<br />
David Boud (Sydney UT).<br />
Irwin Brown (UCT)<br />
Molly Brown (Pretoria)<br />
<strong>Alternation</strong> Special Edition 4 (2011) 450 – 454 450<br />
ISSN 1023-1757<br />
Denis Brutus (Pittsburgh)<br />
Gina Buijs (Walter Sisulu)<br />
Thabisile M. Buthelezi (UKZN)<br />
Teresa Carmichael (Wits)<br />
Jenni Case (UCT)<br />
Elias Cebekhulu (UKZN<br />
Noel Chellan (UKZN)<br />
Anthony Chennells (Pretoria)<br />
Anneline Chetty (eThekwini<br />
Munic.)<br />
Denzil Chetty (Unisa)<br />
Reuben Chirambo (UCT)<br />
Regis Chireshe (Walter Sisulu)<br />
Michel Clasquin (Unisa)<br />
Ampie Coetzee (UWC)<br />
David Cooper (UCT)<br />
Pamela Cooper (UNorth Carolina)<br />
Martin Combrinck (UKZN)<br />
Gareth Cornwall (Rhodes)<br />
Judith Lütge Coullie (UKZN)<br />
L. Dalvit (RU)<br />
Suleman Dangor (UKZN)<br />
Jay E. Darr (Ind. Researcher<br />
Houston)<br />
Roger Deacon (UKZN)<br />
Joseph de Beer(UJ)<br />
Marianne de Jong (Unisa)<br />
Elizabeth de Kadt (UJ)<br />
M.R. (Ruth) de Villiers (Unisa)
Mduduzi Dlamini (Poet)<br />
Malcolm Draper (UKZN)<br />
Musa W. Dube (U. Botswana)<br />
Yvonne du Plessis (UP)<br />
Simon During (Melbourne)<br />
Charlotte Engelbrecht (UKZN)<br />
Ge<strong>of</strong>f Erwin (CAPUT)<br />
Irina Filatova (UKZN)<br />
Miki Flockeman (UWC)<br />
Stanley Fore (UKZN)<br />
Annie Gagiano (US)<br />
Harry Garuba (UCT)<br />
Gerald Gaylard (Wits)<br />
Jeanne Gazel (Michigan State)<br />
Cecile Gerwel (UKZN)<br />
Paul Gifford (SOAS)<br />
Mandy Goedhals (UKZN)<br />
Danie Goosen (Unisa)<br />
Khaya Gqibitole (UZ)<br />
Louise Green (US)<br />
K. Govender (UKZN)<br />
Betty Govinden (UKZN)<br />
Dorian Haarh<strong>of</strong>f (Namibia)<br />
Sabry Hafez (SOAS)<br />
G.H. Haffajee (UN)<br />
K.J. Halland (Unisa)<br />
Ge<strong>of</strong>f Harris (UKZN)<br />
G. Hart (Berkeley <strong>University</strong>)<br />
Kalpana Hiralal (UKZN)<br />
Isabel H<strong>of</strong>meyr (Wits)<br />
Myrtle Hooper (UZ)<br />
Nancy Hornberger (Pennsylvania)<br />
Dirk Human (UP)<br />
451<br />
Anne Hutchings (UZ)<br />
Dan Izebaye (Ibadan)<br />
Editorial Associates<br />
RK Jain (Jawaharlal Nehru)<br />
Janet Jarvis (UKZN)<br />
Jeff Jawitz (UCT<br />
Deborah Johnson (Al Faisal Univ.)<br />
David Johnson (Open Univ.)<br />
Russell H. Kaschula (RhodesU)<br />
Rosemary Kalenga (UKZN)<br />
Sultan Khan (UKZN)<br />
Douglas Killam (Guelph)<br />
<strong>Rembrandt</strong> <strong>Klopper</strong> (UKZN)<br />
Kirstin Krauss (UP)<br />
Robbert Kriger (NRF)<br />
Kobus Kruger (Unisa)<br />
P Kumar (UKZN)<br />
Stephen Leech (UKZN)<br />
Andre Lefevere (Austin)<br />
Elmar Lehmann (Essen)<br />
Brenda Leibowitz (US)<br />
Chris le Roux (Unisa)<br />
David Lewis-Williams (Wits)<br />
Bernth Lindfors (Austin)<br />
Evert Louw (UNW)<br />
Pat Louw (UZ)<br />
Sam Lubbe (UNW)<br />
Craig MacKenzie (UJ)<br />
Mbulugeni Madiba (UCT)<br />
T.E. Madiba (UKZN)<br />
Ajiv Maharaj (PhD Grad. UKZN)<br />
Brij Maharaj (UKZN)<br />
Manoj Maharaj (UKZN)<br />
Sechaba Mahlomaholo (UNW)
Editorial Associates<br />
Lindelwa Mahonga (UNISA)<br />
Dianne Manning (Wits)<br />
David Maralack (UCT)<br />
Simon M. Mapadimeng (UKZN)<br />
V.M. Sisi Maqagi (UF)<br />
Maduray Marimuthu (UKZN)<br />
Ashley Marimuthu (UKZN)<br />
Julia Martin (UWC)<br />
P. Maseko (RU)<br />
Nontokozo Mashiya (UKZN)<br />
Mogomme Masoga (U. North)<br />
Travis V. Mason (Dalhousie U.)<br />
Nhlanhla N. Mathonsi (UKZN)<br />
Isaac Mathumba (Unisa)<br />
Christopher May (UT – Vaal Triangle)<br />
Gugulethu Mazibuko (UKZN)<br />
Thabile Mbatha (UKZN)<br />
Elsa Meihuizen (UZ)<br />
Nicholas Meihuizen (UZ)<br />
Godfrey Meintjes (Rhodes)<br />
Itumeleng Mekoa (UKZN)<br />
Fatima Mendonca (Eduardo Mondlane)<br />
Gary Mersham (NZ Open Polytech)<br />
Peter Merrington (UWC)<br />
Emmanuel M. Mgqwashu (UKZN)<br />
Tommaso Milani (Wits)<br />
Jabulani Mkhize (UFH)<br />
Sikhumbuzo Mngadi (UJ)<br />
Dianna Moodley (UKZN)<br />
Vadi Moodley (UKZN)<br />
Shane Moran (UKZN)<br />
Mabogo P. More (UKZN)<br />
Themba Moyo (UZ)<br />
Louis Molamu (Botswana)<br />
Sazile Mtshali (UZ)<br />
Katwiwa Mule (Pennsylvania)<br />
452<br />
Agnes Musyoki (Venda)<br />
Onnie Mutanga (UKZN)<br />
FS Mwesigwa (Chr. College,<br />
Malawi)<br />
Nirmala Naidoo (UKZN)<br />
Sershen Naidoo (UKZN)<br />
Maheshvari Naidu (UKZN)<br />
Priya Narismulu (UKZN)<br />
C.M.B. Naude (Unisa)<br />
Nobuhle Ndimande-Hlongwa<br />
(UKZN)<br />
Andreas Neergard (U. Copenhagen)<br />
Johan Nel (Indep. Inf. Systems<br />
Etienne Nel (Rhodes U.)<br />
Mtholeni N. Ngcobo (Unisa)<br />
Thengani Ngwenya (DUT)<br />
Vuyokazi Nomlomo (Unisa)<br />
Sihawukele Ngubane (UKZN)<br />
Leslie S. Nthoi (Univ. Zim)<br />
Pitika Ntuli (UKZN)<br />
Frances O’Brien (UKZN)<br />
Isidore Okpewho (Binghamton)<br />
Andries Oliphant (Unisa)<br />
Charles O'Neill (UKZN)<br />
G.C. Oosthuizen (UZ)<br />
Jeff Opland (Charterhouse)<br />
Karen Ortlepp (UKZN)<br />
Indira Padayachee (UKZN)<br />
Shaun Pather (CAPUT)<br />
Rob Pattman (UKZN)<br />
Graham Pechey (Hertfordshire)<br />
Yogi Penceliah (UKZN)<br />
Edwin Perry (Res. Consultant, Dbn)
Sadhasivan Perumal (UKZN)<br />
Vreda Pieterse (U. Pretoria)<br />
Kris Pillay (Unisa)<br />
Seeni Pillay (UKZN)<br />
Jan Platvoet (AASR)<br />
Jon Pocock (UKZN)<br />
Moorosi, Pontso (Warwick)<br />
Kasthuri Poovalingam (UKZN)<br />
Peter Plüddeman (UCT)<br />
Laurette Pretorius (UP)<br />
Julie Pridmore (Unisa)<br />
Paul Prinsloo (Unisa)<br />
Serban Proches (UKZN)<br />
Martin Prozeski (UKZN)<br />
Nceba Qgaleni (UKZN)<br />
Rose Quilling (UKZN)<br />
Susan Rakoczy (St Joseph’s)<br />
Aneel Ramcharan (Ind. Academic)<br />
Nisha Ramlutchman (DUT)<br />
Labby Ramrathan (UKZN)<br />
Sanjay Ranjeeth (UKZN)<br />
Thalo Raditlhalo (NMMU)<br />
Malini Ramsay-Brijball (UKZN)<br />
Risto Rasku (Jyvaskyla <strong>University</strong>)<br />
Erhard Reckwitz (Essen)<br />
P.S. Reddy (UKZN)<br />
Fanie Riekert (UFS)<br />
Hemduth Rugbeer (UZ)<br />
Yasmin Rugbeer (UZ)<br />
Denis Rugege (UKZN)<br />
Dino Ruta (Bocconi <strong>University</strong>)<br />
Rory Ryan (UJ)<br />
Toufique Samaai (Environmental<br />
Affairs and Tourism)<br />
453<br />
Editorial Associates<br />
Michael Samuel (UKZN)<br />
Corinne Sandwith (UKZN)<br />
R. Sathipersad (UKZN)<br />
Mark Sch<strong>of</strong>ield (Edge Hill<br />
<strong>University</strong>)<br />
Cecil Seethal (UFH)<br />
Anton Senekal (UJ)<br />
Thomas Sengani (Unisa)<br />
Maje Serudu (Unisa)<br />
Ayub Sheik (UKZN)<br />
Usha Devi Shukla (UKZN)<br />
Almon Shumba (Central UT)<br />
Marilet Sienaert (UCT)<br />
Anesh Singh (UKZN)<br />
Ari Sitas (UCT)<br />
Mpilo Pearl Sithole (UKZN)<br />
Tahir Sitoto (UKZN)<br />
Chris Skinner (UKZN)<br />
Johannes A. Smit (UKZN)<br />
Clive Smith (UJ)<br />
Dhiru Soni (UKZN)<br />
Reshma Sookrajh (UKZN)<br />
Rollo Sookraj (UKZN)<br />
Dorothy Spiller (Waikato)<br />
David Spurrett (UKZN)<br />
Marie Spruyt (UZ)<br />
Louw-Haardt Stears (UKZN)<br />
Graham Stewart (DUT)<br />
Lindy Stiebel (UKZN)<br />
Johan Strijdom (Unisa)<br />
Barry Strydom (UKZN)<br />
Mogie Subban (UKZN)<br />
Kamilla Swart (CAPUT)<br />
Etienne Terblanche (NWU)<br />
Collin Thakur (DUT)<br />
Liz Thompson (UZ)
Editorial Associates<br />
Cleopas Thosago (UNIN)<br />
Thabo Tsehloane (UJ)<br />
Doug Turco (Drexel <strong>University</strong>)<br />
Wilfred Ukpere (UJ)<br />
Goolam Vahed (UKZN)<br />
Hennie van der Mescht (Rhodes)<br />
André van der Poll (Unisa)<br />
Huibrecht van der Poll (Unisa)<br />
Kees van der Waal (SU)<br />
Johan van Loggerenberg (UP)<br />
Annemarié van Niekerk (Vista)<br />
Dewald van Niekerk (NWU)<br />
Mari Jansen van Rensburg (UNISA)<br />
Helize van Vuuren (NMMU)<br />
Johan van Wyk (UKZN)<br />
454<br />
Hildegard van Zweel (Unisa)<br />
D. Veersamy (DUT)<br />
Debbie Vigar-Ellis (UKZN)<br />
Shaun Viljoen (SU)<br />
Tony Voss (UKZN - Retired)<br />
Jean-Philippe Wade (UKZN)<br />
Dale Wallace (UKZN)<br />
Victor N. Webb (UFS)<br />
Gina Wisker (Brighton)<br />
B. White (UKZN)<br />
Rosemary Wildsmith (UKZN)<br />
Andrew Williams (U.Penn.)<br />
Sandra Williams (UKZN)<br />
Johan Zaaiman (U. North)<br />
Sylvia Zulu (DUT)<br />
Phyllis Zungu (UKZN)
<strong>Alternation</strong><br />
Guidelines for Contributors<br />
Manuscripts must be submitted in English (UK). If quotations from other languages appear in the<br />
manuscript, place the original in a footnote and a dynamic-equivalent translation in the body <strong>of</strong> the<br />
text or both in the text.<br />
Contributors must submit one computer-generated and three double-spaced printed copies <strong>of</strong> the<br />
manuscript. Up to 10 original <strong>of</strong>f-print copies <strong>of</strong> the article will be returned to the author after<br />
publication.<br />
Manuscripts should range between 5000-8000 and book reviews between 500-1000 words. However,<br />
longer articles may be considered for publication.<br />
Attach a cover page to one manuscript containing the following information: Author’s full name,<br />
address, e-mail address, position, department, university/ institution, telephone/ fax numbers as<br />
well as a list <strong>of</strong> previous publications. Authors must also submit a brief academic biographical<br />
sketch <strong>of</strong> about sixty words, indicating institutional affiliation, main scholarly focus, books<br />
published, significant articles, and/ or academic journals regularly contributing too.<br />
Maps, diagrams and posters must be presented in print-ready form. Clear black and white photos<br />
(postcard size) may also be submitted.<br />
Use footnotes sparingly. In order to enhance the value <strong>of</strong> the interaction between notes and text, we<br />
use footnotes and not endnotes.<br />
Authors may use their own numbering systems in the manuscript.<br />
Except for bibliographical references, abbreviations must include fullstops. The abbreviations (e.a.)<br />
= ‘emphasis added’; (e.i.o.) = ‘emphasis in original’; (i.a.) or [...] = ‘insertion added’ may be used.<br />
The full bibliographical details <strong>of</strong> sources are provided only once at the end <strong>of</strong> the manuscript<br />
under References. References in the body <strong>of</strong> the manuscript should follow the following convention:<br />
Dlodlo (1994:14) argues .... or at the end <strong>of</strong> a reference/ quotation: ... (Dlodlo 1994:14).<br />
The full name or initials <strong>of</strong> authors as it appears in the source must be used in the References<br />
section.<br />
Review articles and book reviews must include a title as well as the following information<br />
concerning the book reviewed: title, author, place <strong>of</strong> publication, publisher, date <strong>of</strong> publication,<br />
number <strong>of</strong> pages and the ISBN number.<br />
The format for the references section is as follows:<br />
Head, Bessie 1974. A Question <strong>of</strong> Power. Oxford: Heinemann Educational Publishers.<br />
Mhlophe, Gcina 1990. Nokulunga’s Wedding. In Van Niekerk, Annemarié (ed): Raising the Blinds.<br />
A Century <strong>of</strong> South African Women’s Stories. Parklands: Ad Donker.<br />
Mngadi, Sikhumbuzo 1994. ‘Popular Memory’ and Social Change in South African Historical<br />
Drama <strong>of</strong> the Seventies in English: The Case <strong>of</strong> Credo Mutwa’s Unosimela. <strong>Alternation</strong> 1,1:37-41.<br />
Fanon, Frantz 1986. Black Skin, White Masks. Markmann, Charles Lam (trans). London: Pluto<br />
Press.
<strong>Alternation</strong> Special Edition Number 4<br />
ISSN 1023-1757<br />
Interdisciplinary <strong>Journal</strong> for the Study <strong>of</strong> the<br />
Arts and Humanities in Southern Africa<br />
ARTICLES<br />
<strong>Rembrandt</strong> <strong>Klopper</strong> Editorial ..................................................................................................... 1<br />
K. Owusu-Ampomah The Quality <strong>of</strong> the Human Factor and its Implications for<br />
Network Dynamics and Small Business Growth and Development ......................................... 3<br />
Cecile Gerwel and Shamim Bodhanya An Orientation and Roadmap to Simulation and<br />
Gaming ................................................................................................................................... 30<br />
Yvette Chetty and Debbie Vigar-Ellis A Comparison <strong>of</strong> Staff and Student Expectations <strong>of</strong><br />
Service Quality in the UKZN Foundation Programme: Management Implications................. 48<br />
Lesley Stainbank and Mercy Tafuh The Threshold, Burden and Usefulness <strong>of</strong><br />
Financial Reporting for Small and Medium-Sized Entities in <strong>KwaZulu</strong>-<strong>Natal</strong> ...................... 69<br />
Lesley Stainbank The Suitability <strong>of</strong> International Financial Reporting Standards for<br />
Small and Medium-sized Entities ......................................................................................... 103<br />
Charles O’Neill and Sanjay Soni Reevaluation <strong>of</strong> an Experimental Model to<br />
Determine the Impact <strong>of</strong> Entrepreneurial Networking on Small Business Success .............. 128<br />
Barry Strydom, Andrew Christison, Joao Matias The Effect <strong>of</strong> Transaction Characteristics<br />
on the Market Response to Black Economic Empowerment Transactions .......................... 148<br />
Mike Nyamazana Sikwila Inflation Impact <strong>of</strong> an Exchange Rate Adjustment:<br />
The Case <strong>of</strong> Zimbabwe 1990 - 2006 ..................................................................................... 166<br />
Jeevarathnam P. Govender and Qi Pan Enhancement <strong>of</strong> Service Quality in the<br />
Intercity Bus Transport Industry ........................................................................................... 181<br />
Preesha Maharaj, Rubeshan Perumal and Sadhasivan Perumal Perceptions <strong>of</strong> International<br />
Students on the Challenges <strong>of</strong> Diversity Management at a S.A. <strong>University</strong> .......................... 203<br />
Krishna K. Govender and Shaun Ramroop The Postgraduate Service Experience,<br />
Service Satisfaction and Service Quality: A South African Case Study ............................... 228<br />
Sam Lubbe and Maishe Bopape The Social Impact <strong>of</strong> Information Systems at a<br />
Tertiary Institution ................................................................................................................ 251<br />
Grant Howard, Sam Lubbe and <strong>Rembrandt</strong> <strong>Klopper</strong> The Impact <strong>of</strong> Information<br />
Quality on Information Research ......................................................................................... 288<br />
Kiru J. Pillay and Manoj S. Maharaj Strategic Planning for Digital Convergence in<br />
South African Businesses .................................................................................................... 306<br />
Patrick Kanyi Wamuyu and Manoj S. Maharaj Using Mobile Technologies for<br />
eBusiness Infrastructure in Kenyan Rural Micro and Small Enterprises:<br />
Hype or Opportunity? ........................................................................................................... 334<br />
Hans Lehmann and Rosemary Quilling Why are There not More Grounded Theories in<br />
Information Systems Research? ........................................................................................... 350<br />
Mc Donald van der Merwe and Ruth de Villiers The Partial Approach to<br />
Grounded Theory Integrated with Activity Theory: A Generic Framework,<br />
Illustrated by a Base Study in an e-Learning Context ........................................................... 365<br />
<strong>Rembrandt</strong> <strong>Klopper</strong> and Sam Lubbe Using Matrix Analysis to Achieve Traction,<br />
Coherence, Progression and Closure in Problem-Solution Oriented Research ..................... 403<br />
Petra Theunissen and Gary Mersham ‘New Zealand’s Darkest Day’: The Representation <strong>of</strong><br />
National Grief in the Media: The Case <strong>of</strong> the Christchurch Earthquake ............................... 420<br />
Contributors ............................................................................................................................. 441<br />
Editorial Associates (1994 – 2011) .......................................................................................... 450<br />
PRINT CONNECTION Tel (031) 202-7766; 202-7766