Download annual report - About TELUS
Download annual report - About TELUS
Download annual report - About TELUS

You also want an ePaper? Increase the reach of your titles
YUMPU automatically turns print PDFs into web optimized ePapers that Google loves.
2012 ANNUAL REPORT<br />
putting<br />
Y U<br />
first
What’s inside<br />
Caution regarding forward-looking statements summary<br />
This document contains statements about expected future events and financial and operating performance of <strong>TELUS</strong> that are forward-looking.<br />
By their nature, forward-looking statements are subject to inherent risks and uncertainties and require the Company to make assumptions.<br />
There is significant risk that the assumptions, predictions and other forward-looking statements will not prove to be accurate. Readers are<br />
cautioned not to place undue reliance on forward-looking statements as a number of factors could cause assumptions, actual future performance<br />
and events to differ materially from those expressed in the forward-looking statements. Accordingly this document is subject to the disclaimer<br />
and qualified in its entirety by the assumptions (including assumptions for 2013 targets, semi-<strong>annual</strong> dividend increases to 2013 and CEO threeyear<br />
goals to 2013 for earnings per share and free cash flow growth to 2013 excluding any one-time items such as spectrum costs), qualifications<br />
and risk factors referred to in Management’s discussion and analysis starting on page 40 of this <strong>annual</strong> <strong>report</strong> and in other <strong>TELUS</strong> public disclosure<br />
documents and filings with securities commissions in Canada (on SEDAR at sedar.com) and in the United States (on EDGAR at sec.gov). In<br />
addition, there can be no assurance that the Company will initiate a normal course issuer bid in 2013 or maintain its dividend growth model beyond<br />
2013. <strong>TELUS</strong> disclaims any intention or obligation to update or revise forward-looking statements, except as required by law, and reserves the<br />
right to change, at any time at its sole discretion, its current practice of updating <strong>annual</strong> targets and guidance.<br />
All financial information is <strong>report</strong>ed in Canadian dollars unless otherwise specified.<br />
Copyright © 2013 <strong>TELUS</strong> Corporation. All rights reserved. Certain products and services named in this <strong>report</strong> are trademarks. The symbols and ®<br />
indicate those owned by <strong>TELUS</strong> Corporation or its subsidiaries. All other trademarks are the property of their respective owners.<br />
2 . <strong>TELUS</strong> 2012 ANNUAL REPORT<br />
Gatefold, 1-5<br />
Corporate overview<br />
Who we are, what<br />
we offer, and a look at<br />
our 2012 performance<br />
and 2013 targets<br />
6-13<br />
CEO letter to investors<br />
How <strong>TELUS</strong> is delivering<br />
on its proven growth<br />
strategy and focusing on<br />
putting customers first<br />
14-17<br />
Review of operations<br />
A snapshot of our<br />
wireless and wireline<br />
operations<br />
18-19<br />
Community investment<br />
How we give where<br />
we live ®<br />
20-28<br />
Leadership<br />
Our Executive Leadership<br />
Team, Board of Directors,<br />
and questions and answers<br />
29-172<br />
Financial review<br />
Detailed financial<br />
disclosure, including a<br />
letter from our CFO, and<br />
other investor resources<br />
Open to find<br />
out more<br />
about <strong>TELUS</strong><br />
1/2 INCH GETS TRIMMED OFF FOR GATEFOLD
1/2 INCH GETS TRIMMED OFF FOR GATEFOLD<br />
Who we are<br />
<strong>TELUS</strong> is a leading national telecommunications<br />
company in Canada, with $10.9 billion of <strong>annual</strong><br />
revenue and 13.1 million customer connections<br />
including 7.7 million wireless subscribers,<br />
3.4 million wireline network access lines, 1.4 million<br />
Internet subscribers and 678,000 <strong>TELUS</strong> TV ®<br />
customers. <strong>TELUS</strong> provides a wide range of<br />
communications products and services including<br />
wireless, data, Internet protocol (IP), voice,<br />
television, entertainment and video. In support<br />
of our philosophy to give where we live, <strong>TELUS</strong>,<br />
our team members and retirees have contributed<br />
more than $300 million to charitable and notfor-profit<br />
organizations and volunteered 4.8 million<br />
hours of service to local communities since 2000.<br />
A quick view <strong>TELUS</strong> wireless <strong>TELUS</strong> wireline<br />
2012 external revenue<br />
and <strong>annual</strong> growth $5.85 billion, an increase of 7.0% $5.08 billion, an increase of 2.9%<br />
Share of <strong>TELUS</strong><br />
consolidated revenue<br />
2012 EBITDA and<br />
<strong>annual</strong> growth<br />
Share of <strong>TELUS</strong><br />
consolidated EBITDA<br />
Industry drivers<br />
<strong>TELUS</strong> business drivers<br />
54% 46%<br />
$2.47 billion, an increase of 13% $1.51 billion, a decrease of 5.5%<br />
62% 38%<br />
. Growing wireless industry penetration (currently<br />
estimated at 80% in Canada)<br />
. Increasing smartphone adoption and usage<br />
driving data revenue growth<br />
. Accelerating growth of mobile commerce, machineto-machine,<br />
mobile video and roaming services<br />
. Continuing 4G LTE network roll-out to reach<br />
more Canadians<br />
. Offering Clear and Simple solutions<br />
. Increasing lifetime revenue through improved<br />
customer loyalty (lower churn) and higher usage<br />
. Enhancing efficiency to control costs while<br />
enhancing customer experience<br />
Our values<br />
We embrace change and initiate opportunity<br />
We have a passion for growth<br />
We believe in spirited teamwork<br />
We have the courage to innovate<br />
. Capturing growing share of consumer entertainment<br />
and Internet market with IP-based services<br />
. Delivering solutions for businesses with complex<br />
and changing technology needs<br />
. Mitigating the impacts of competition and<br />
technological substitution with cost efficiency<br />
. Bundling future friendly ® home services to enhance<br />
customer value<br />
. Optik TV TM and high-speed Internet services growth<br />
. Investing in broadband technology, innovative new<br />
services and cost efficiency<br />
. Satisfying business clients’ evolving needs for cloud<br />
computing, security and managed hosting solutions
Our products and services<br />
Wireless<br />
Across Canada, <strong>TELUS</strong> provides Clear & Simple © voice and data solutions<br />
to 7.7 million customers on world-class nationwide wireless networks.<br />
Leading networks and devices: Total coverage of 99% of Canadians over a coast-to-coast<br />
4G network, including 4G LTE and nationwide HSPA+, as well as CDMA and Mike ® iDEN network<br />
technologies. We offer leading-edge smartphones, mobile Internet keys, mobile Wi-Fi devices<br />
and tablets<br />
Digital voice: Postpaid, prepaid and <strong>TELUS</strong> Push to Talk ® , and international roaming to more<br />
than 200 countries<br />
Data: Web browsing, social networking, messaging (text, picture and video), <strong>TELUS</strong> mobile TV ® ,<br />
video on demand and the latest mobile applications.<br />
Wireline<br />
In British Columbia, Alberta and Eastern Quebec, <strong>TELUS</strong> is the established full-service local exchange carrier<br />
offering a wide range of telecommunications products to consumers, including residential phone, Internet access,<br />
and television and entertainment services. Nationally, we provide telecommunications and IT solutions for small<br />
to large businesses, including IP, voice, video, data and managed solutions, as well as contact centre outsourcing<br />
solutions for domestic and international businesses.<br />
Voice: Reliable home phone service with long distance and<br />
advanced calling features<br />
Internet: High-speed Internet service with email and<br />
a comprehensive suite of security solutions<br />
<strong>TELUS</strong> TV: High-definition entertainment service with Optik TV<br />
and <strong>TELUS</strong> Satellite TV ® . Optik TV offers extensive content<br />
options and innovative features such as PVR Anywhere, Remote<br />
Recording, OptikTM Smart Remote channel browsing with an<br />
iPad or iPhone, use of Xbox 360 as a set-top box<br />
and Optik on the go<br />
IP networks and applications: Leading-edge IP networks that<br />
offer converged voice, video, data or Internet access on a secure,<br />
high-performing network<br />
Conferencing and collaboration: Full range of equipment and<br />
application solutions to support meetings and webcasts by means<br />
of phone, video and Internet<br />
Contact centre and outsourcing solutions: Managed solutions<br />
providing secure, low-cost and scalable infrastructure. <strong>TELUS</strong><br />
International is a leading service provider with sophisticated contact<br />
centres in North America, Central America, Europe and Asia<br />
Hosting, managed IT, and cloud-based services: Ongoing<br />
assured availability of telecommunications, networks, servers,<br />
databases, files and applications, with critical applications stored<br />
in <strong>TELUS</strong>’ intelligent Internet data centres across Canada<br />
Healthcare: Claims management solutions, hospital and hospitalto-home<br />
technology, electronic health records and other healthcare<br />
solutions through <strong>TELUS</strong> Health.
Our customer declaration<br />
Y U<br />
told us what you want and we listened.<br />
We’re not perfect, but our employees are deeply<br />
motivated to consistently delight our customers.<br />
We know that getting better means making sure<br />
we’re listening to you. That’s why we’re embracing<br />
new ideas that will make your <strong>TELUS</strong> experience<br />
better, every day. We’re on a journey to build on<br />
your trust by being clear, helpful and dependable.<br />
In other words, at <strong>TELUS</strong>, we put you first.<br />
<strong>TELUS</strong> 2012 ANNUAL REPORT . 1
2012 performance highlights<br />
You want shareholder value.<br />
We delivered in 2012.<br />
Income<br />
Operating revenues<br />
2012: $10.9 billion<br />
2011: $10.4 billion +5.0%<br />
EBITDA 1<br />
2012: $4.0 billion<br />
2011: $3.8 billion +5.1%<br />
Earnings per share (EPS) – basic<br />
2012: $4.05<br />
2011: $3.76 +7.7%<br />
Dividends declared per share<br />
2012: $2.44<br />
2011: $2.205 +10.7%<br />
Consolidated revenues ($ billions)<br />
10 12<br />
09 11<br />
08 10<br />
10 12<br />
09 11<br />
08 10<br />
07<br />
2 . <strong>TELUS</strong> 2012 ANNUAL REPORT<br />
Liquidity and<br />
capital resources<br />
9.8<br />
10.4<br />
10.9<br />
EPS – basic ($)<br />
Cash from operations<br />
2012: $3.2 billion<br />
2011: $2.6 billion +26%<br />
Capital expenditures<br />
2012: $2.0 billion<br />
2011: $1.8 billion +7.3%<br />
Free cash flow1 2012: $1.3 billion<br />
2011: $1.0 billion +34%<br />
Net debt to EBITDA ratio<br />
2012: 1.6 times<br />
2011: 1.8 times -0.2 times<br />
3.27<br />
3.76<br />
4.05<br />
Consolidated EBITDA 1 ($ billions)<br />
12 10<br />
11 09<br />
10 08<br />
10* 07<br />
Free cash flow 1 ($ billions)<br />
12<br />
11 10<br />
10 09<br />
09 08<br />
Customer connections<br />
Wireless subscribers<br />
2012: 7.7 million<br />
2011: 7.3 million +4.5%<br />
Network access lines<br />
2012: 3.4 million<br />
2011: 3.6 million -5.2%<br />
Internet subscribers<br />
2012: 1.4 million<br />
2011: 1.3 million +5.7%<br />
TV subscribers<br />
2012: 678,000<br />
2011: 509,000 +33%<br />
0.9<br />
1.0<br />
3.8<br />
3.7<br />
4.0<br />
1.3
2012 financial and operating highlights<br />
($ in millions except per share amounts) 2012 2011 % change<br />
Income<br />
Operating revenues $ß10,921 $ß10,397 5.0<br />
Earnings before interest, taxes, depreciation and amortization (EBITDA) 1 $ß 3,972 $ß 3,778 5.1<br />
EBITDA margin (%) 36.4 36.3 –<br />
Operating income $ß 2,107 $ß 1,968 7.1<br />
Operating margin (%) 19.3 18.9 –<br />
Net income attributable to common and non-voting shares $ß 1,318 $ß 1,219 8.1<br />
EPS – basic $ß 4.05 $ß 3.76 7.7<br />
EPS – basic, as adjusted 2 $ß 3.99 $ß 3.66 9.0<br />
Dividends declared per share $ß 2.44 $ß 2.205 10.7<br />
Dividend payout ratio (%) 1 63 62 –<br />
Financial position<br />
Total assets $ß20,445 $ß19,931 2.6<br />
Net debt 1 $ß 6,577 $ß 6,959 (5.5)<br />
Total capitalization1 $ß14,223 $ß14,461 (1.6)<br />
Net debt to total capitalization (%) 46.2 48.1 –<br />
Return on common equity (%) 3 17.0 15.5 –<br />
Market capitalization of equity 4 $ß21,157 $ß18,274 15.8<br />
Liquidity and capital resources<br />
Cash from operations $ß 3,219 $ß 2,550 26.2<br />
Capital expenditures excluding spectrum licences $ß 1,981 $ß 1,847 7.3<br />
Free cash flow (before dividends) 1 $ß 1,331 $ß 997 33.5<br />
Net debt to EBITDA ratio1 1.6 1.8 –<br />
Wireless segment<br />
External revenue $ß 5,845 $ß 5,462 7.0<br />
EBITDA1 $ß 2,467 $ß 2,186 12.9<br />
EBITDA margin on total revenue (%) 41.9 39.7 –<br />
Wireline segment<br />
External revenue $ß 5,076 $ß 4,935 2.9<br />
EBITDA1 $ß 1,505 $ß 1,592 (5.5)<br />
EBITDA margin on total revenue (%) 28.7 31.2 –<br />
Customer connections (in thousands at December 31)<br />
Wireless subscribers 7,670 7,340 4.5<br />
Network access lines 3,406 3,593 (5.2)<br />
Internet subscribers 1,359 1,286 5.7<br />
Total TV subscribers 678 509 33.2<br />
Total customer connections 13,113 12,728 3.0<br />
1 For definitions of these measures (which are non-GAAP) see Section 11 of Management’s discussion and analysis in this <strong>report</strong>.<br />
2 Excludes in 2012 positive income tax-related adjustments of four cents per share and net gain on <strong>TELUS</strong> Garden residential real estate redevelopment<br />
project of two cents per share. Excludes in 2011 positive income tax-related adjustments of six cents per share and gain on acquisition of Transactel<br />
of four cents per share.<br />
3 Common share and non-voting share income divided by the average quarterly common share and non-voting share equity for the year.<br />
4 Market value based on year-end closing share prices and shares outstanding.<br />
<strong>TELUS</strong> 2012 ANNUAL REPORT . 3
2012 scorecard<br />
You want results.<br />
We’re keeping score.<br />
At <strong>TELUS</strong>, we believe in setting <strong>annual</strong> financial targets and having policies that provide<br />
clarity for investors and help drive organizational performance.<br />
This scorecard shows <strong>TELUS</strong>’ 2012 performance against our original consolidated targets.<br />
The achievement of three of the four targets reflects strong growth in wireless and data<br />
revenues and higher wireless margins. Capital expenditures did not meet the target due to<br />
higher investments in growing and sustaining our networks, including investments supporting<br />
customer growth.<br />
Consolidated<br />
<strong>TELUS</strong> continues to adhere to its financial objectives,<br />
policies and guidelines, which include generally maintaining<br />
a minimum of $1 billion of unutilized liquidity, a Net debt to<br />
EBITDA (excluding restructuring costs) ratio in the range of<br />
1.5 to 2.0 times, and a revised dividend payout ratio guideline<br />
of 65 to 75% of sustainable earnings on a prospective basis.<br />
4 . <strong>TELUS</strong> 2012 ANNUAL REPORT<br />
2012 results<br />
and growth<br />
Revenues $10.92 billion<br />
5.0%<br />
EBITDA $3.97 billion<br />
5.1%<br />
Earnings per share (EPS) – basic $4.05<br />
7.7%<br />
Capital expenditures $1.98 billion<br />
7.3%<br />
Met target Did not meet target<br />
2012 original targets<br />
and growth Result<br />
$10.7 to $11.0 billion<br />
3 to 6%<br />
$3.8 to $4.0 billion<br />
1 to 6%<br />
$3.75 to $4.15<br />
0 to 10%<br />
<strong>TELUS</strong> revised its dividend payout ratio guideline, effective<br />
for dividends declared in 2013, due to applying an amended<br />
accounting standard.<br />
For further information, including performance against<br />
segmented targets, see Section 1.4 of Management’s discussion<br />
and analysis in this <strong>report</strong>.<br />
<br />
<br />
<br />
$1.85 billion approximately
2013 targets<br />
<strong>TELUS</strong>’ 2013 consolidated financial targets reflect continued execution of our long-standing and<br />
successful national growth strategy focused on wireless and data. In each of the past three years,<br />
we have met three of four consolidated financial targets. For more information and a complete set<br />
of 2013 financial targets and assumptions, see Section 1.5 of Management’s discussion and analysis<br />
in this <strong>report</strong>.<br />
Revenues ($ billions)<br />
13 target<br />
12<br />
11<br />
11.4 to 11.6<br />
10.92<br />
10.40<br />
Targeting 4 to 6%<br />
increase, driven<br />
by strong growth<br />
in wireless and<br />
wireline data<br />
EPS – basic ($)<br />
13 target<br />
12<br />
11<br />
3.80 to 4.20<br />
3.48<br />
3.69<br />
Targeting 3 to 14%<br />
increase, driven by<br />
EBITDA growth<br />
EBITDA ($ billions)<br />
13 target<br />
The 2013 targets are qualified in their entirety by the Caution regarding forward-looking statements on page 40 of this <strong>report</strong>.<br />
The 2013 targets and comparative figures for 2012 EBITDA and EPS include the effects of applying the amended IAS 19 employee<br />
benefits accounting standard.<br />
12<br />
11<br />
3.95 to 4.15<br />
3.86<br />
3.67<br />
Targeting 2 to 8%<br />
growth, generated<br />
primarily by wireless<br />
Capital expenditures ($ billions)<br />
13 target<br />
12<br />
11<br />
approx. 1.95<br />
1.85<br />
1.98<br />
Continuing investments<br />
in networks<br />
to support customer<br />
growth and new<br />
technologies<br />
<strong>TELUS</strong> 2012 ANNUAL REPORT . 5
Putting you first<br />
We put customers first in our culture,<br />
investment priorities and operational decision-making.<br />
Across all lines of business, team members<br />
are rallying together to deliver future friendly<br />
experiences to our customers that are<br />
differentiating us from the competition.
CEO letter to investors<br />
You want results.<br />
We put you first, every day.<br />
Looking back, 2012 was another exceptional year for<br />
your Company. Indeed, <strong>TELUS</strong> realized many achievements<br />
whilst also overcoming various challenges. Our strategic<br />
investments in broadband wireless and wireline technology<br />
and services, coupled with our team’s unwavering commitment<br />
to putting customers first, are clearly differentiating<br />
us from the competition. The result is strong operational<br />
execution and financial performance, which in turn is creating<br />
exceptional value for our investors, customers, team<br />
members and the communities we serve.<br />
Creating value for investors<br />
<strong>TELUS</strong>’ performance has generated three years of<br />
significant share price and dividend growth. Notably, during<br />
this period, our total shareholder return of 121 per cent<br />
signifi cantly outpaced both our Canadian and global peers,<br />
whose average return was only 23 per cent, as well as<br />
the Toronto Stock Exchange, whose average return was<br />
15 per cent.<br />
Our superior performance was achieved by a determined<br />
focus on our valued customers. In 2012, we had an<br />
increase of 385,000 total customer connections, which<br />
grew to 13.1 million. This included adding 331,000 wireless<br />
customers, 169,000 TV clients and 84,000 high-speed<br />
Internet connections. Our customers are also demonstrating<br />
an increased loyalty to <strong>TELUS</strong>, as evidenced by our<br />
industry-low 1.09 per cent postpaid wireless monthly churn,<br />
excellent loyalty in our TV and Internet services, and a<br />
slower rate of telephone access line losses.<br />
In 2012, our performance delivered five per cent total<br />
revenue growth (driven by double-digit wireless and wireline<br />
data revenue growth), eight per cent earnings per share<br />
(EPS) growth and very strong 34 per cent free cash flow<br />
growth. Notably, we led the Canadian industry in wireless<br />
revenue growth and lifetime revenue per customer, and in<br />
wireline data revenue growth, new TV subscribers and<br />
high-speed Internet additions.<br />
Darren Entwistle with the Chairs of our <strong>TELUS</strong> Community Boards –<br />
Nini Baird, Vancouver, Mel Cooper, Victoria and Nancy Greene Raine,<br />
Thompson Okanagan. In 2012, our 11 <strong>TELUS</strong> Community Boards<br />
in Canada and three international boards contributed $5.6 million to<br />
500 grassroots charitable projects like Jeneece Place, founded by<br />
youth philanthropist Jeneece Edroff.<br />
Our strong free cash flow of $1.3 billion supports the realization<br />
of the dividend growth model announced in May 2011.<br />
At that time, we committed to continuing with two dividend<br />
increases per year to the end of 2013, in the range of circa<br />
10 per cent <strong>annual</strong>ly, subject to determination by the Board of<br />
Directors. We have made four of the six targeted increases<br />
and our dividend is now at $2.56 <strong>annual</strong>ly – up 10.3 per cent<br />
from a year ago. At our upcoming shareholder meeting in<br />
May, we plan to provide additional clarity on <strong>TELUS</strong>’ dividend<br />
growth model for the next three years and our intentions with<br />
respect to multi-year share repurchase programs.<br />
Earning your trust through transparency,<br />
fairness and good governance<br />
I want to express my sincere gratitude to our shareholders for<br />
their overwhelming support of our non-voting share exchange.<br />
Our share proposal was highly responsive to shareholders,<br />
providing enhanced marketability and liquidity, and adding to<br />
<strong>TELUS</strong> 2012 ANNUAL REPORT . 7
our track record of excellent corporate governance with all<br />
shareholders being offered full voting rights.<br />
When we first announced the proposal in February 2012,<br />
the value of both share classes increased by a combined<br />
$678 million in a single day, clearly indicating investor support.<br />
After announcing our proposal, New York-based hedge fund<br />
Mason Capital quietly acquired 19 per cent of <strong>TELUS</strong> common<br />
shares, while at the same time borrowing and selling short<br />
an almost equal amount of non-voting and common shares.<br />
This tactic, known as empty voting, gave Mason significant<br />
voting power despite having almost no economic interest in<br />
<strong>TELUS</strong>. It also put Mason in a position to make millions of<br />
dollars if it could significantly widen the share price between<br />
the two classes of shares by defeating the proposal.<br />
At our meeting in May, in the face of Mason’s emptyvoting<br />
tactic, <strong>TELUS</strong> withdrew the proposal. We committed<br />
Putting customers first<br />
8 . <strong>TELUS</strong> 2012 ANNUAL REPORT<br />
to introducing another proposal for a one-for-one exchange,<br />
which we did in August, so as to retain the increased<br />
value. This second proposal required approvals by 50 per<br />
cent of common shares and two-thirds of non-voting<br />
shares. In October, at our second shareholder meeting,<br />
we achieved record participation and the exchange was<br />
approved by 62.9 per cent of common shares voted<br />
and 99.5 per cent of non-voting shares voted. Excluding<br />
Mason’s voting block, 84.4 per cent of common shares<br />
voted for the exchange.<br />
In December, the Supreme Court of B.C. gave its<br />
approval and in January, Mason abandoned its legal opposition,<br />
allowing us to successfully complete the exchange<br />
in early February 2013. We now have a single class of<br />
326 million common shares, which are trading on the New<br />
York Stock Exchange for the first time.<br />
Putting customers first remains your Company’s top priority. We are looking to provide<br />
the best client experience in our industry as measured by our customers’ likelihood<br />
to recommend our products, services and people. Our goal is to become the most<br />
recommended company in the markets we serve.<br />
We are making tremendous progress as we listen to our customers and act on their<br />
feedback. Notably, at year-end, 72 per cent of both our consumer customers and<br />
our small and medium business clients said they were likely to recommend <strong>TELUS</strong>,<br />
up two and 16 percentage points, respectively, from the previous year.<br />
Our Clear and Simple customer approach<br />
Our dedicated team continues to work hard to learn from<br />
customer feedback and take action to get better, every day.<br />
As part of our commitment to improve our clients’<br />
experience, we have evolved our Clear and Simple philosophy,<br />
implementing a number of innovative plans and features<br />
that deliver the value customers want and make buying a<br />
phone from <strong>TELUS</strong> simpler, fairer and more future friendly.<br />
This included introducing a suite of unlimited talk and text<br />
plans, as well as data sharing plans that enable customers<br />
to share their plan allocations between subscribers and<br />
devices. We were also the first to eliminate activation fees<br />
for both new and renewing customers, and we dramatically<br />
simplified our entire fee schedule, delivering on our promise<br />
to provide fair and transparent pricing.<br />
As well, customers are leveraging our team’s expertise<br />
by participating in free one-to-one sessions at the <strong>TELUS</strong><br />
Learning CentreTM , where they can discover the full scope<br />
of what their smartphones offer.<br />
These enhancements are in addition to the many other<br />
improvements we have made, which include eliminating<br />
extra administrative fees on all our Clear & Simple rate plans,<br />
introducing flex data plans, data notifications and worry-free<br />
travel plans, and adding caller ID and voice mail as standard<br />
on all <strong>TELUS</strong> rate plans. We also simplified device pricing
in our multi-year contracts with anytime upgrades that<br />
allow customers to pay off their device balance and upgrade<br />
to a new phone.<br />
Providing advanced networks, facilities and devices<br />
Our 4G long-term evolution (LTE) network, launched in early<br />
2012, is a prime example of our commitment to provide<br />
customers with the fastest wireless service available in the<br />
world today on the latest devices such as the iPhone 5,<br />
Samsung Galaxy S III and BlackBerry Z10. Throughout 2012,<br />
<strong>TELUS</strong> continued expanding the coverage of our 4G LTE<br />
network to more than two-thirds of Canadians.<br />
We also continued expanding and upgrading our wireline<br />
broadband network, bringing greater capacity, speed<br />
and coverage to more communities. By the end of 2012,<br />
our broadband high-definition (HD) Optik TV coverage<br />
reached more than 2.4 million households in B.C., Alberta<br />
and Eastern Quebec.<br />
Additionally, we invested in two new intelligent Internet<br />
data centres (IDCs) to support growth opportunities in<br />
cloud computing for wireline and wireless clients. The IDC<br />
in Rimouski, Quebec opened in 2012 and the IDC in<br />
Kamloops, B.C. is scheduled to open in mid-2013. With<br />
energy efficiency ratings that are more than 80 per cent<br />
better than most conventional data centres, our new<br />
IDC facilities are among the top performing globally and<br />
provide industry-leading reliability and security.<br />
Advancing Optik TV service<br />
Through 2012, we added many new HD channels and<br />
several innovative apps that provide a superior TV experience<br />
for our customers. As a result, we continue to see healthy<br />
We are looking to provide the best<br />
client experience in our industry as measured<br />
by our customers’ likelihood to recommend<br />
our products, services and people.
demand for Optik TV and excellent pull-through sales for<br />
our complementary high-speed Internet service. We are also<br />
generating positive momentum in the overall economics of<br />
these services.<br />
<strong>TELUS</strong> is Canada’s fastest-growing TV service provider<br />
and a global industry leader in offering new innovative<br />
applications such as:<br />
. Optik TV Smart Remote, enabling customers to surf<br />
available TV programming on their smartphone or tablet<br />
instead of using the regular TV guide<br />
. Remote record, which allows subscribers to schedule<br />
and manage their PVR recordings when they are away<br />
from home with a tablet, laptop or smartphone<br />
. Optik on the go, which provides customers the ability<br />
to view TV programs and On Demand shows whilst on<br />
their mobile devices, tablets and laptops<br />
. Multi-View, which allows customers to watch four shows<br />
at once with one displayed in a main window and three<br />
others shown in smaller windows.<br />
Applications like these, as well as the ability to use Twitter<br />
and Facebook while watching TV without interruption,<br />
demonstrate the value of integrating wireless and wireline<br />
services and help to differentiate us in the market.<br />
Delivering solutions for small and medium businesses<br />
At <strong>TELUS</strong>, putting small and medium business (SMB)<br />
customers first is helping them reach new levels of business<br />
success. Our focus is on delivering simple, reliable and<br />
integrated solutions to our 250,000 SMB customers<br />
across Canada.<br />
Our customers first<br />
commitments<br />
We take ownership of every customer experience<br />
We work as a team to deliver on our promises<br />
We learn from customer feedback and<br />
take action to get better, every day<br />
We are friendly, helpful and thoughtful.<br />
In May, we introduced the Business FreedomTM Guarantee,<br />
which gives clients assurance that their business will stay<br />
connected. It provides high-speed 4G wireless backup in<br />
the event of a service interruption, crystal-clear phone lines<br />
on our reliable nationwide network, the freedom to modify<br />
or upgrade their services, and 24/7 support.<br />
The Guarantee builds on the <strong>TELUS</strong> Business Freedom ®<br />
bundle, which lets customers combine their office phone,<br />
Internet and wireless services in one flexible, simple and<br />
cost-effective solution. Launched in late 2010 in response to<br />
customer feedback, these bundles simplify the rate plans<br />
we offer and include anytime device upgrades, no long-term<br />
commitments and all services on one bill.<br />
To further simplify wireless pricing, we introduced the<br />
<strong>TELUS</strong> Team Share plans that enable SMB clients to optimize<br />
voice and data usage by having their employees share a<br />
pool of voice and long distance minutes and data megabytes.<br />
Recognizing the unique needs of SMB clients, we<br />
launched 10 <strong>TELUS</strong> Business Stores in 2012 in locations<br />
such as Victoria, Vancouver and Toronto, with plans for<br />
more in 2013. These stores showcase our fully integrated
wireline and wireless solutions and enable business owners<br />
to experience innovative products and services on the spot,<br />
with one-on-one assistance.<br />
Addressing healthcare opportunities and challenges<br />
The <strong>TELUS</strong> team is dedicated to transforming healthcare<br />
through technology innovation that will crack the code on<br />
affordability for governments and Canadians, deliver better<br />
patient outcomes and drive the prevention of disease.<br />
We have invested more than $1 billion in the past five years,<br />
including a series of large and small acquisitions, and we<br />
now employ more than 1,500 team members in this area.<br />
We have created momentum in this important industry<br />
and have become a leader in telehomecare, electronic<br />
medical and personal health records, and consumer health,<br />
benefits and pharmacy management services. In 2012,<br />
we generated about $500 million in revenue with plans for<br />
continued growth.<br />
Throughout the year, we furthered our strategy with two<br />
notable acquisitions. In October, <strong>TELUS</strong> acquired KinLogix,<br />
Quebec’s largest and fastest-growing provider of cloudbased<br />
electronic medical records (EMR). This followed<br />
the February acquisition of Wolf Medical Systems, Western<br />
Canada’s leading cloud-based EMR solution provider.<br />
These acquisitions are part of <strong>TELUS</strong> Physician Solutions,<br />
our line of business that helps doctors quickly and securely<br />
coordin ate and share information with their extended<br />
healthcare teams, their patients and patients’ families.<br />
Additionally in 2012, <strong>TELUS</strong> signed an agreement with<br />
Alberta Health Services, the first of its kind in Canada, to<br />
support an electronic personal health record (PHR) solution<br />
for all Alberta residents. This solution enables Albertans to<br />
easily collect, store and manage their health information and<br />
that of their families in a safe, secure online environment.<br />
It also provides the ability to quickly move PHR information<br />
across the healthcare continuum, whether that be in the<br />
medical clinic, in the hospital or in the home.<br />
To further support our investment in the health sector,<br />
in 2013, <strong>TELUS</strong> Ventures will be exploring more opportunities<br />
for small startup investments that can complement our<br />
transformation agenda in healthcare.<br />
Enhancing the team member experience<br />
For the second consecutive year, we have realized a<br />
remarkable increase in our team’s overall engagement score<br />
– up 10 percentage points to 80 per cent, as measured<br />
in our <strong>annual</strong> survey. This follows an outstanding 13-point<br />
increase in 2011. According to our independent survey<br />
administrator, <strong>TELUS</strong>’ engagement ranks number one in<br />
Canada and in the top one per cent globally for employers<br />
with more than 15,000 employees.<br />
In addition, your Company was again recognized<br />
by Waterstone Human Capital as having one of Canada’s<br />
10 most admired corporate cultures, qualifying us for<br />
induction into its prestigious Hall of Fame, one of only six<br />
Canadian companies ever to be so recognized.<br />
We believe that enhanced team engagement results in<br />
positive customer experiences and increases the likelihood<br />
that customers will recommend us. Notably, for 2012,<br />
<strong>TELUS</strong> customer complaints were down 13 per cent, whilst<br />
the overall number of complaints across the industry was<br />
up 35 per cent, according to the Federal Commissioner for<br />
Complaints for Telecommunications Services.<br />
These achievements are reflective of the momentum we<br />
have created in the marketplace, our dedication to embracing<br />
our team values, taking action on front-line team member<br />
suggestions and our customers first commitments, which<br />
are shown in the sidebar.<br />
Supporting our communities<br />
Our team continues to demonstrate an incredible dedication<br />
to building healthy, strong and sustainable communities.<br />
We are guided by a simple philosophy – we give where we<br />
live. In 2012, <strong>TELUS</strong>, team members and retirees donated<br />
$44 million to community and charitable organizations and<br />
volunteered 570,000 hours to local communities. Since<br />
2000, <strong>TELUS</strong>, team members and retirees have contributed<br />
more than $300 million to charitable and not-for-profit<br />
organizations and volunteered 4.8 million hours of service<br />
to local communities. Notably, since 2005, our 11 <strong>TELUS</strong><br />
Community Boards in Canada and three international<br />
boards have contributed $36 million to 2,800 grassroots<br />
charitable projects.<br />
In line with giving where we live, whilst sustaining<br />
our business success, many customers helped us give<br />
back through our Phones for Good ® and TV for Good ®<br />
campaigns where, in select markets, we offer donations<br />
<strong>TELUS</strong> 2012 ANNUAL REPORT . 11
to local charities based on the sale of smartphones and<br />
Optik TV service. Together with the support of our customers,<br />
we have contributed more than $9.5 million through these<br />
campaigns to local community projects since 2010.<br />
In 2012, we continued our efforts to focus on educating<br />
and empowering youth so they can reach their full potential<br />
and help lead positive change in their communities. By way<br />
of example, <strong>TELUS</strong> supports We Day, a series of <strong>annual</strong><br />
youth empowerment events held by the Free the Children<br />
organization that unite young people with world-renowned<br />
speakers and performers, and inspire them to give back<br />
to their communities. We have supported We Day since its<br />
first year, and have contributed more than $3 million to<br />
Free the Children initiatives since 2006. We advanced our<br />
commitment in 2012 by becoming the national co-title<br />
sponsor of We Day.<br />
In 2013, we are expanding our partnership with Free<br />
the Children to begin the national roll-out of a high-school<br />
curriculum that teachers can use to educate students on<br />
the importance to society of giving back, thereby inspiring<br />
them to take action and make a difference in their local<br />
communities.<br />
In recognition of efforts like these, we were honoured in<br />
2012 to receive one of the first-ever Prime Minister’s Volunteer<br />
Awards and the inaugural Philanthropic Company of the<br />
Year Award from the Quebec Chapter of the Association of<br />
Fundraising Professionals (AFP). These acknowledgements<br />
follow on <strong>TELUS</strong> being the first ever Canadian company<br />
recognized by the international AFP as the Most Outstanding<br />
Philanthropic Corporation globally for 2010.<br />
Opportunities and challenges<br />
Your Company is well positioned to take advantage of<br />
future opportunities as we continue to build momentum<br />
in a rapidly evolving and competitive environment.<br />
As a major industry player, we must remain focused<br />
on government and regulatory developments. <strong>TELUS</strong><br />
is recognized in Ottawa as a credible advocate, one that<br />
strives to take balanced, industry-wide and customerfirst<br />
approaches to issues.<br />
We look forward to acquiring additional wireless<br />
spectrum in the upcoming Industry Canada auctions to<br />
meet our customers’ growing needs for communications<br />
services. Our ability to purchase 700 MHz spectrum is<br />
critical to supporting our growth and providing high-speed<br />
4G LTE service to rural Canada, which will help to bridge<br />
the nation’s rural / urban digital divide. Our strong balance<br />
sheet and access to low-cost debt positions us strongly<br />
for the expected spectrum auctions in 2013 and 2014.<br />
Whilst wireline data revenues are increasing, traditional<br />
high-margin voice revenues are decreasing. We are<br />
leveraging the momentum of Optik TV and Internet services<br />
to offset this decline, however, we continue to lose telephone<br />
lines due to wireless substitution and competition.<br />
Accordingly, operating efficiency is an ongoing way of<br />
We strive to consistently deliver<br />
excellent customer service and truly differentiate<br />
ourselves from the competition.
2013 corporate priorities<br />
Our corporate priorities help guide our team to advance our national growth strategy.<br />
For 2013, we are:<br />
. Delivering on <strong>TELUS</strong>’ future friendly brand promise by putting customers first and earning<br />
our way to industry leadership in “likelihood to recommend” from our clients<br />
. Further strengthening our operational efficiency and effectiveness, thereby fuelling our<br />
capacity to invest for future growth<br />
. Continuing to foster our culture for sustained competitive advantage<br />
. Increasing our competitive advantage through technology leadership across cohesive<br />
broadband networks, Internet data centres, information technology and client applications<br />
. Driving <strong>TELUS</strong>’ leadership position in its chosen business and public sector markets<br />
through an intense focus on high-quality execution and economics<br />
. Elevating <strong>TELUS</strong>’ leadership position in healthcare information by leveraging technology<br />
to deliver better health outcomes for Canadians.<br />
life at <strong>TELUS</strong> and in February this year we announced<br />
the implementation of an earnings enhancement program<br />
to drive incremental improvements in <strong>annual</strong> EBITDA of<br />
$250 million by 2015. For 2013, this program is reflected<br />
in the 56 per cent increase in our restructuring costs<br />
to $75 million and in our earnings targets, which include<br />
a significant improvement in our wireline EBITDA trend.<br />
To help us address the opportunities and challenges<br />
inherent in our industry, your Company has set six corporate<br />
priorities for 2013, which are shown above.<br />
Putting you first<br />
We know that customers have choices and we are committed<br />
to being the most recommended company in the markets<br />
we serve. We strive to consistently deliver excellent customer<br />
service and truly differentiate ourselves from the competition.<br />
The outlook for 2013 is positive as we target growth in<br />
the mid-single digits for revenue, and up to eight per cent<br />
for EBITDA and 14 per cent for EPS at the top end of the<br />
guidance ranges. We also expect strong cash flow, which<br />
underpins the affordability of capital investments, spectrum<br />
purchases and future dividend increases. These targets<br />
are subject to important assumptions and are fully qualified<br />
by the Caution regarding forward-looking statements in<br />
Management’s discussion and analysis.<br />
Two years ago, I shared my personal goals through to<br />
2013 – that <strong>TELUS</strong> has the potential to generate low doubledigit<br />
<strong>annual</strong>ized growth in EPS and even greater free cash<br />
flow growth, excluding any one-time items such as spectrum<br />
purchases. These goals have been achieved to the end of<br />
2012. In addition, for the fourth consecutive year, I am taking<br />
the entirety of my 2013 <strong>annual</strong> cash salary compensation<br />
in <strong>TELUS</strong> shares, in alignment with the interests of our more<br />
than 300,000 shareholders.<br />
I remain confident that our focus on putting customers<br />
first, coupled with an unwavering commitment to our national<br />
growth strategy and Company-wide efficiency initiatives,<br />
should help enable us to continue delivering strong operational<br />
and financial results, thereby creating additional long-term<br />
value for our investors, customers, team members and the<br />
communities we serve.<br />
Thank you for your continued support.<br />
Darren Entwistle<br />
Member of the <strong>TELUS</strong> Team<br />
February 27, 2013<br />
<strong>TELUS</strong> 2012 ANNUAL REPORT . 13
Review of operations – wireless<br />
You want simple solutions.<br />
We’re listening.<br />
2012 snapshot<br />
Revenue<br />
+7%<br />
14 . <strong>TELUS</strong> 2012 ANNUAL REPORT<br />
Subscribers<br />
+331,000<br />
Industry highlights<br />
. The Canadian wireless industry continued to grow in 2012<br />
with more than 1.2 million new subscribers and a five per cent<br />
increase in revenue<br />
. Key growth drivers include the continued adoption of<br />
smartphones and increase in usage of data services such<br />
as social networking, web browsing and video-streaming<br />
. In 2012, estimated wireless data revenue in Canada increased<br />
by more than 25 per cent to exceed $6.8 billion, offsetting<br />
the voice revenue decline resulting from a reduction in voice<br />
usage and competitive pricing<br />
. Industry capital expenditures are continuing as established<br />
carriers expand long-term evolution (LTE) urban networks<br />
and build additional cell sites to accommodate increasing<br />
data demand<br />
. The continued market shift toward higher-value smartphones<br />
is pressuring acquisition and retention costs<br />
. Competition in the postpaid segment remains intense.<br />
Established carriers and their flanker brands are expanding<br />
device lineups and introducing new offers, including unlimited<br />
voice and data sharing plans. Newer carriers continue to<br />
expand coverage and use heavily discounted pricing to attract<br />
new subscribers.<br />
EBITDA<br />
+13%<br />
Lifetime revenue<br />
per customer<br />
+$590<br />
<strong>TELUS</strong> performance<br />
. We delivered strong results in this competitive market with<br />
our Clear and Simple customer approach, which includes<br />
attractive offers and advanced smartphones that leverage<br />
Canada’s extensive coast-to-coast 4G network<br />
. Our wireless revenue grew seven per cent in 2012, reflecting<br />
331,000 subscriber net additions and a 2.2 per cent<br />
improvement in average revenue per subscriber<br />
. Our wireless data revenue increased by 27 per cent to exceed<br />
$2.1 billion<br />
. We increased the proportion of our postpaid customers who<br />
use a smartphone to 66 per cent from 53 per cent in 2011<br />
. Operating earnings strengthened due to revenue growth,<br />
a reduction in our postpaid churn rate to industry-low levels<br />
of 1.09 per cent and continued focus on efficiency<br />
. We generated industry-leading lifetime revenue per customer<br />
of more than $4,100<br />
. Our wireless EBITDA margin improved to 42 per cent.
In 2012, we:<br />
. Continued to deliver on <strong>TELUS</strong>’ future friendly brand<br />
promise with our Clear & Simple rate plans and focus<br />
on enhancing the customer experience<br />
. Offered even faster data speeds and a broader device<br />
portfolio by rolling out 4G LTE technology to nearly<br />
24 million Canadians<br />
. Added to the number and quality of distribution channels<br />
through acquisitions and our next-generation concept stores<br />
. Expanded the <strong>TELUS</strong> Learning Centre program to help<br />
customers get the most from their smartphones<br />
. Improved our customers’ roaming experiences through<br />
more flexible and transparent offerings, including usage<br />
notifications and more partner agreements<br />
. Enhanced Koodo ® branded service offerings with a wider<br />
selection of smartphones and simplified rate plans, resulting<br />
in top ranking by J.D. Power for customer satisfaction<br />
. Added 414,000 higher-value postpaid customers to total<br />
6.54 million.<br />
In 2013, we are:<br />
. Continuing to put customers first and enhance their<br />
experience, as measured by their likelihood to recommend<br />
<strong>TELUS</strong> services<br />
. Rolling out 4G LTE technology to additional markets<br />
across Canada<br />
. Continuing to drive smartphone adoption and growth<br />
in demand for applications and data services through our<br />
Clear and Simple approach, including anytime upgrades<br />
and <strong>TELUS</strong> Learning Centre sessions<br />
. Growing national market share in the small and medium<br />
business space<br />
. Increasing roaming revenue by building on international<br />
relationships, enhancing our capabilities and improving<br />
affordability<br />
. Targeting revenue growth of up to eight per cent and EBITDA<br />
growth of up to nine per cent in our wireless operations.<br />
2012 results – wireless<br />
(share of <strong>TELUS</strong> consolidated)<br />
54%<br />
share<br />
revenue (external)<br />
$5.85 billion<br />
2013 targets – wireless 1<br />
(share of <strong>TELUS</strong> consolidated)<br />
54%<br />
share<br />
revenue (external)<br />
$6.2 to $6.3 billion<br />
62%<br />
share<br />
EBITDA<br />
$2.47 billion<br />
65%<br />
share<br />
EBITDA<br />
$2.575 to $2.675 billion<br />
1 See Caution regarding forward-looking statements on page 40 of this <strong>report</strong>.<br />
Learn how to get the most from your smartphone at telusmobility.com/learn<br />
<strong>TELUS</strong> 2012 ANNUAL REPORT . 15
Review of operations – wireline<br />
You want the best for your home.<br />
Let us entertain you.<br />
2012 snapshot<br />
Revenue<br />
+3%<br />
Industry highlights<br />
. In 2012, the wireline communications market remained<br />
intensively competitive. Revenues from high-margin legacy<br />
services, such as local and long distance telephony, continued<br />
to decline due to migration to wireless, data and voice over IP<br />
(VoIP) services. This was offset by growth in newer data and<br />
Internet services<br />
. IP TV entertainment continues to be a key area of growth for<br />
telecom companies, with market share gains at the expense<br />
of cable and satellite TV companies<br />
. Over-the-top competitors, such as Netflix, are emerging<br />
as technology advances, raising the prospect of possible<br />
TV cord-cutting<br />
. Cable-TV and other companies continue to increase the<br />
speed and availability of their data offerings, raising the level<br />
of competitive intensity in consumer and small and medium<br />
business (SMB) markets<br />
. In response, telecom companies are expanding fibre<br />
networks, increasing their speed and coverage in support of<br />
their entertainment business, and implementing innovative<br />
IP-based solutions for the business market<br />
. In the large enterprise segment, migration to integrated and<br />
managed IP-based cloud computing services continues<br />
. Established telcos face ongoing pressure for cost efficiency<br />
to offset declining legacy margins.<br />
16 . <strong>TELUS</strong> 2012 ANNUAL REPORT<br />
Data revenue<br />
+12%<br />
TV subscribers<br />
+169,000<br />
High-speed Internet<br />
subscribers<br />
+84,000<br />
<strong>TELUS</strong> performance<br />
. In the residential market, our significant technology<br />
investments have allowed us to offer customers a superior<br />
home entertainment experience through Optik TV, delivered<br />
over our advanced broadband networks<br />
. Our service bundle provides us with key competitive<br />
differentiation and, in 2012, drove very successful Optik TV<br />
and high-speed Internet service loading, while also slowing<br />
residential access line losses. However, aggressive introductory<br />
promotions and discounting on service bundles remain<br />
typical as our cable-TV rivals defend their subscriber bases<br />
. We are offering business solutions that target specific<br />
high-value enterprise and public sector segments across<br />
the country. In SMB markets, we are successfully delivering<br />
reliable integrated wireless and wireline solutions<br />
. <strong>TELUS</strong> wireline revenue increased by three per cent in 2012<br />
due to data service growth and bundling success. <strong>TELUS</strong> is<br />
one of the few established telcos in the world that generated<br />
positive wireline revenue growth in 2012<br />
. A decline in high-margin legacy revenues led to a decrease<br />
in wireline EBITDA margin to 29 per cent.
In 2012, we:<br />
. Expanded our broadband network to reach more than<br />
2.4 million households in B.C., Alberta and Eastern Quebec,<br />
with the vast majority covered by technology that delivers<br />
Internet service of up to 25 megabits per second (Mbps) and<br />
four simultaneous TV channels<br />
. Introduced more innovative features on Optik TV, including<br />
Optik on the go, Multi-View and Optik Smart Remote, while<br />
expanding our content offering<br />
. Increased our TV subscriber base by 33 per cent or 169,000<br />
customers, to reach a total of 678,000<br />
. Simplified our integrated SMB product offerings, including<br />
the launch of employee sharing plans, and strengthened our<br />
distribution with 10 new <strong>TELUS</strong> Business Stores<br />
. Acquired two leading cloud-based electronic medical record<br />
(EMR) providers to accelerate the adoption of EMR solutions<br />
to improve Canada’s healthcare system<br />
. Opened a new intelligent Internet data centre in Quebec and<br />
are building a second one in B.C. to support cloud computing<br />
services nationally, at a combined investment of $150 million<br />
. Grew wireline data revenue by $318 million or 12 per cent.<br />
In 2013, we are:<br />
. Continuing to enhance the customer experience by simplifying<br />
products and improving customer service and quality<br />
. Enhancing our advanced broadband network speed and<br />
capabilities<br />
. Introducing more innovative services to support the growth<br />
of Optik TV and Internet services, while growing data revenue<br />
and profitability<br />
. Driving sales in the enterprise and SMB markets through<br />
enhanced coverage and connectivity, simple and targeted<br />
offers, and high-quality customer service<br />
. Increasing the number of Canadians using our innovative<br />
healthcare technology solutions such as patient, hospital<br />
and physician EMRs<br />
. Targeting revenue growth of up to four per cent and EBITDA<br />
growth of up to five per cent in our wireline operations.<br />
2012 results – wireline<br />
(share of <strong>TELUS</strong> consolidated)<br />
46%<br />
share<br />
revenue (external)<br />
$5.08 billion<br />
2013 targets – wireline 1<br />
(share of <strong>TELUS</strong> consolidated)<br />
46%<br />
share<br />
revenue (external)<br />
$5.2 to $5.3 billion<br />
38%<br />
share<br />
EBITDA<br />
$1.51 billion<br />
35%<br />
share<br />
EBITDA<br />
$1.375 to $1.475 billion<br />
1 See Caution regarding forward-looking statements on page 40 of this <strong>report</strong>.<br />
Watch TV on your computer, tablet or smartphone – anytime, anywhere –<br />
with Optik on the go. Visit telus.com/tvonthego.<br />
<strong>TELUS</strong> 2012 ANNUAL REPORT . 17
Community investment<br />
You think giving is important.<br />
We wholeheartedly agree.<br />
Our community investment philosophy – we give where we live –<br />
enables us to put our communities first by investing in programs<br />
that make a positive and lasting difference in the lives of others.<br />
Our strategy focuses on educating and empowering youth to<br />
improve their quality of life and enable them to reach their full<br />
potential. We are creating a legacy of giving that is based on<br />
innovation and supporting youth through technology.<br />
We are empowering youth to create change<br />
<strong>TELUS</strong> expanded its partnership with Free the Children through<br />
a five-year national co-title sponsorship of We Day, a series<br />
of events held across Canada to inspire youth to create change<br />
in their communities and around the world. More than 90,000<br />
youth are expected to participate in We Day events in seven<br />
cities across Canada throughout the 2012–2013 school year.<br />
In addition, <strong>TELUS</strong> contributed $750,000 to Free the Children<br />
through its Phones for Good campaign by donating $25 from<br />
the sale of every Samsung Galaxy S III or Samsung Ace Q<br />
smartphone in certain communities.<br />
You told us that giving locally was important<br />
<strong>TELUS</strong> Community Boards put philanthropic decision-making<br />
in the hands of local leaders who know their communities<br />
and can best determine how to make a positive difference.<br />
Their focus is to provide grants to grassroots<br />
charities that support local youth. Preference is<br />
given to projects that also demonstrate tangible<br />
technological or social innovation.<br />
Last year, the 11 <strong>TELUS</strong> Community Boards<br />
across Canada contributed $5.3 million to<br />
local charities and supported 466 projects.<br />
Additionally, our three international Community<br />
Boards – in Guatemala, El Salvador and<br />
18 . <strong>TELUS</strong> 2012 ANNUAL REPORT<br />
18,663<br />
meals served to<br />
those in need<br />
the Philippines – contributed $300,000 to local charities and<br />
supported 40 community projects.<br />
We give our time to the community<br />
The seventh <strong>annual</strong> <strong>TELUS</strong> Day of Giving ® brought together a<br />
record 12,500 team members, retirees, family and friends across<br />
Canada to volunteer in 400 activities that included providing<br />
meals for homeless people, sorting food bank donations<br />
and planting trees in local parks. Since its inception in 2006,<br />
<strong>TELUS</strong> Day of Giving has mobilized 65,000 volunteers at<br />
1,650 <strong>TELUS</strong>-organized activities that benefit their communities.<br />
The <strong>TELUS</strong> Day of Giving also took place in the Philippines,<br />
El Salvador, Guatemala, the United States and the United<br />
Kingdom. More than 5,900 team members participated in eight<br />
events, including refurbishing schools in impoverished areas,<br />
building homes, coordinating medical missions and planting trees.<br />
<strong>TELUS</strong> Day of Giving<br />
7,170<br />
trees and<br />
shrubs planted<br />
9,660<br />
Kits for Kids<br />
assembled<br />
for students
Giving in 2012<br />
Team <strong>TELUS</strong><br />
Charitable Giving<br />
program<br />
$6.8<br />
million<br />
The <strong>TELUS</strong> Community Ambassadors ® invest their time<br />
and talent in providing support to those in need. In 2012, our<br />
Ambassadors, including <strong>TELUS</strong> retirees and team members<br />
who volunteer at 21 clubs across Canada, contributed<br />
67,000 care items, including school kits for kids and baby<br />
bags filled with essential infant care items.<br />
Our team also thinks giving is important<br />
<strong>TELUS</strong> is a long-time Imagine Canada Caring Company,<br />
meaning we donate more than one per cent of our pre-tax<br />
profits to charitable organizations each year. In 2012,<br />
<strong>TELUS</strong>, our team members and retirees gave $44 million,<br />
or 2.5 per cent of our pre-tax profit, to charitable and<br />
not-for-profit organizations.<br />
A key aspect of <strong>TELUS</strong>’ philanthropic initiatives is the<br />
involvement and engagement of its team. Through the Team<br />
<strong>TELUS</strong> Charitable Giving program, team members, retirees,<br />
board members and retail dealers donate funds to the<br />
organizations they care most about, which <strong>TELUS</strong> matches<br />
dollar for dollar. In 2012, we donated $6.8 million through<br />
this program to more than 2,800 charities.<br />
$3.8<br />
million<br />
$5.6<br />
million<br />
TV for Good and<br />
Phones for Good<br />
<strong>TELUS</strong><br />
Community<br />
Boards<br />
Through the Dollars for Doers program, when team members<br />
and retirees volunteer more than 50 hours in a year, <strong>TELUS</strong><br />
contributes $200 to a charity of their choice. Also, when a retiree<br />
volunteers more than 200 hours, <strong>TELUS</strong> donates $400. In 2012,<br />
<strong>TELUS</strong> donated $660,000 to Canadian charities or not-forprofit<br />
sports organizations through this program, and our team<br />
members and retirees volunteered 570,000 hours.<br />
We help make it easy for you to give too<br />
At <strong>TELUS</strong>, we believe that to do well in business, we must do<br />
good in the community. Accordingly, we make business decisions<br />
that benefit the environment, enhance our communities and<br />
support youth, while sustaining our own business success.<br />
We also apply innovative cause marketing initiatives that<br />
enable our customers to support local organizations in specific<br />
communities when subscribing to Optik TV or purchasing<br />
smartphones and other devices. In 2012, <strong>TELUS</strong> contributed<br />
$1.7 million to 19 local community projects in B.C. and Alberta<br />
through its TV for Good campaigns. We also donated $2.1 million<br />
to 22 projects across B.C., Alberta, Ontario and Atlantic Canada<br />
through our Phones for Good campaigns.<br />
For more details about corporate social responsibility (CSR) at <strong>TELUS</strong>,<br />
visit telus.com/csr.<br />
<strong>TELUS</strong> 2012 ANNUAL REPORT . 19
Questions and answers<br />
You have questions.<br />
We have the answers.<br />
How are you and your team putting customers first?<br />
Our Human Resources team’s top priority continues to be<br />
fostering our customers first philosophy into all aspects of <strong>TELUS</strong>’<br />
corporate culture. By understanding our customers’ needs,<br />
focusing our incentive and recognition programs and developing<br />
a future friendly workplace to attract and retain the best team,<br />
we are leading <strong>TELUS</strong>’ transformational journey to become the<br />
most recommended company in the markets we serve.<br />
How do you learn about your customers’ needs?<br />
One example is our Closer to the Customer program, an <strong>annual</strong><br />
job-shadowing program in which senior leaders work with<br />
customer-facing team members to experience front-line service<br />
interactions. In 2012, the program was expanded to include<br />
3,600 managers and, in the past three years, more than 6,900<br />
leaders have participated. We know this is yielding continuous<br />
improvement and positively influencing both customer and<br />
team member experiences.<br />
Tell us how team members are motivated<br />
to put customers first?<br />
The <strong>TELUS</strong> corporate balanced scorecard provides a critically<br />
important set of measurements that gauge how we are<br />
performing and determines a portion of each team member’s<br />
compensation. Sixty per cent of our scorecard is weighted<br />
towards customers first initiatives, which motivates all team<br />
members, regardless of their role or title, to focus on achieving<br />
our likelihood to recommend objectives.<br />
20 . <strong>TELUS</strong> 2012 ANNUAL REPORT<br />
JOSH BLAIR<br />
Executive Vice-President, Human Resources and Chief Corporate Officer<br />
How are they recognized in this regard?<br />
Our Customers First Champions program recognizes customerfacing<br />
team members who provide exceptional service to our<br />
customers. Team members are nominated and evaluated by their<br />
colleagues. The program highlights customer experience wins,<br />
celebrates those who go above and beyond, and enhances<br />
understanding by sharing examples of exceptional service.<br />
Are we making the necessary progress?<br />
Yes, and a key indicator of that progress is our team’s overall<br />
engagement score. By enhancing the team member experience,<br />
making work fulfilling, elevating morale and giving our team<br />
the tools to take ownership of each interaction, we can enhance<br />
our clients’ experience. We have seen a remarkable increase<br />
in our team’s overall engagement score – up 10 percentage points<br />
in 2012 to 80 per cent – putting <strong>TELUS</strong> in the top one per cent<br />
worldwide for companies of our size. This reflects the outstanding<br />
momentum we have created in the marketplace by embracing<br />
our values and customers first commitments.<br />
A final thought?<br />
These are just some examples of programs that are fostering<br />
our customers first philosophy and making sure it is embedded<br />
throughout the Company. Based on our team’s engagement,<br />
the gains we are making in achieving our likelihood to recommend<br />
objectives and the external recognition we receive, I am<br />
confident we are on the right track. We know that, to provide<br />
excellent customer service, we need the best and most engaged<br />
team in the global telecom industry.
JOE NATALE<br />
Executive Vice-President and Chief Commercial Officer<br />
How are you and your team putting customers first?<br />
Across <strong>TELUS</strong>, we are striving to put customers at the centre<br />
of everything we do. Every day, our team members are embracing<br />
new ideas that are helping to create an exceptional experience<br />
for our customers. Our commitment – at <strong>TELUS</strong>, we put you<br />
first – is anchored by our actions. We are committed to listening,<br />
learning and improving.<br />
What are some of the steps you have taken?<br />
Our customers have told us they want things to be clear,<br />
simple and fair. So we have eliminated activation fees, created<br />
an easy approach to upgrading devices, created new simple<br />
and flexible rate plans, and introduced data usage notifications<br />
to help customers manage their accounts. In our stores, The<br />
<strong>TELUS</strong> Learning Centre helps customers choose the right device<br />
and teaches them how to use it effectively.<br />
We continue to invest in our network to offer faster Internet<br />
service and to evolve and enhance our premium Optik TV<br />
service. We are providing TV customers with more content and<br />
innovative applications such as Optik on the go, Multi-View<br />
and Optik Smart Remote.<br />
Our commitment – at <strong>TELUS</strong>, we put you first –<br />
is anchored by our actions. We are committed<br />
to listening, learning and improving.<br />
How about business customers?<br />
Our small and medium business teams are focused on<br />
delivering an exceptional experience by providing integrated<br />
solutions with plan flexibility, voice and data sharing, and<br />
reliability guarantees. Our large enterprise teams are taking a<br />
renewed approach to implementing integrated solutions and<br />
information and communications technology and services.<br />
How have you changed customer service interactions?<br />
We have continued to invest in our customer-facing teams<br />
and in championing a culture where we take ownership of each<br />
customer experience. We strive to treat every interaction as<br />
an opportunity to enhance customer satisfaction and loyalty.<br />
We have augmented our online self-serve capabilities, and<br />
customers can contact us through messaging or social media<br />
channels such as Twitter and Facebook. We offer two-hour<br />
appointment windows for Optik installation and service calls.<br />
And, our new next-generation stores provide customers with<br />
an interactive and engaging experience.<br />
How have these efforts translated into results?<br />
Our focus on an enhanced customer experience is generating<br />
measurable benefits and increasing our customers’ likelihood to<br />
recommend <strong>TELUS</strong>. We have industry-leading customer loyalty<br />
as measured by wireless churn. This, alongside steadily<br />
increasing average revenue per customer, supports our leading<br />
wireless subscriber economics. And, our TV and Internet<br />
subscriber growth and loyalty are best in class.<br />
Our customers aren’t the only ones taking notice. In 2012,<br />
J.D. Power and Associates ranked Koodo highest in customer<br />
satisfaction among stand-alone wireless providers,<br />
and ranked <strong>TELUS</strong> second only to SaskTel among full-service<br />
providers and significantly ahead of the other two major<br />
national providers.<br />
What is your view going forward?<br />
Improving the customer experience is a journey. In our business,<br />
we know that what delights customers today will become the<br />
industry standard tomorrow, so we must keep raising the bar.<br />
From a position of strength and inspired by our progress to<br />
date, our highly engaged team is focusing relentlessly on<br />
our number one priority to continually improve the customer<br />
experience.
EROS SPADOTTO<br />
Executive Vice-President, Technology Strategy and Operations<br />
How are you and your team putting customers first?<br />
The biggest opportunity and responsibility we have is to deliver<br />
the best network experience for our customers. The speed,<br />
reliability and evolution of our network is the foundation for the<br />
experiences our customers have with <strong>TELUS</strong> products and<br />
services, so we take that very seriously by building a network<br />
that enables them to work and connect reliably and consistently.<br />
What role do networks play?<br />
Our customers count on our services and networks to be working<br />
each moment of every day. As a result, we focus relentlessly<br />
on delivering superior services and continued enhancements<br />
to make the experience better.<br />
In 2012, we launched the largest 4G long-term evolution (LTE)<br />
network in Canada with 1,800 LTE sites covering more than<br />
two-thirds of Canadians. Coupled with our 97 per cent HSPA+<br />
coverage, and some of the industry’s most innovative smartphones<br />
and data applications, we are enabling customers to<br />
do more.<br />
In addition, we’re getting customers involved in improving their<br />
experience through the <strong>TELUS</strong> Network Experience app, which<br />
enables them to <strong>report</strong> network issues on the go in real time.<br />
We are expanding and enhancing the speed and capabilities<br />
of our advanced wireline broadband network now covering<br />
more than 2.4 million households. Our hybrid network approach<br />
includes VDSL2 technology, fibre to the home in new areas<br />
and fibre to the suite in multi-unit dwellings. We are now overlaying<br />
VDSL2 bonding technology that can double speeds<br />
up to 50 megabits per second (Mbps). And, we are testing new<br />
technologies in our labs, offering further potential speed and<br />
capability enhancements.<br />
These investments, and ongoing innovations, allow us to<br />
offer a superior entertainment experience. For instance, <strong>TELUS</strong><br />
was the first carrier globally to give customers the ability to<br />
control their TV with hand gestures and voice commands using<br />
an Xbox 360 with Kinect.<br />
What other things are you doing?<br />
Everything we do is centred on ensuring customers get what<br />
they want, when they want it. Our Manage my channels app lets<br />
customers make programming changes directly from their TV.<br />
The <strong>TELUS</strong> My Account app, which had 500,000 downloads in<br />
its first three months, enables wireless customers to manage their<br />
accounts. We have also made roaming easier with an app that<br />
helps customers manage and troubleshoot services when abroad.<br />
We are intensely focused on improving installation, service<br />
quality and reliability. In 2012, we enhanced diagnostic tools that<br />
allow us to detect and proactively resolve factors impacting the<br />
quality of Optik TV service, resulting in a 50 per cent reduction<br />
in TV and Internet service calls.<br />
Looking forward, what do you see?<br />
Our industry continues to evolve and technology does not<br />
stand still. More importantly, our customers’ needs don’t stand<br />
still. As broadband connections become more pervasive, we<br />
are focused on enhancing the customer experience by augmenting<br />
network capabilities and performance, and delivering<br />
the latest in IP innovation. We plan to acquire a share of the<br />
700 MHz spectrum, extend our LTE network in rural areas, build<br />
new value-add applications for Optik TV, and utilize <strong>TELUS</strong>’<br />
intelligent Internet data centres to develop next generation cloud<br />
computing and unified communication solutions.<br />
Ultimately, we will keep building and evolving our networks<br />
and solutions that transform the way our customers live, work<br />
and play.
PAUL LEPAGE<br />
Senior Vice-President and<br />
President, <strong>TELUS</strong> Health<br />
How are you and your team putting customers first?<br />
At <strong>TELUS</strong> Health, we are putting patients at the centre of<br />
everything we do to address the challenges of the Canadian<br />
healthcare system. <strong>TELUS</strong> is driving solutions that organize<br />
health information and make it more meaningful, move it securely<br />
and connect it to all stakeholders, thereby turning information<br />
into better health outcomes for all Canadians.<br />
How is <strong>TELUS</strong> improving the Canadian healthcare system?<br />
<strong>TELUS</strong> technology can enhance patient satisfaction, increase<br />
patient safety, improve clinical access and decrease healthcare<br />
costs. <strong>TELUS</strong> Health is doing this by:<br />
. Empowering healthcare teams to coordinate and share<br />
information to provide integrated care efficiently and<br />
cost-effectively<br />
. Offering doctors, patients and their families the ability to<br />
share information anytime, anywhere so as to better involve<br />
patients in the management of their health<br />
. Enabling pharmacists to provide better medication<br />
management and healthcare services for clients through<br />
our pharmacy management solutions<br />
. Improving benefit claims management to make the<br />
process more efficient for employees, companies and<br />
insurance providers<br />
. Providing tools to hospitals, governments and healthcare<br />
professionals to analyze information and identify best practices,<br />
evidence-based treatments and quality improvements.<br />
At <strong>TELUS</strong> Health, we are putting patients at<br />
the centre of everything we do to address the<br />
challenges of the Canadian healthcare system.<br />
Can you talk about electronic medical records (EMRs)?<br />
EMRs are systems that physicians use to manage their clinics<br />
and patient interactions. EMRs provide tremendous benefits:<br />
physicians have all relevant information in one place during a<br />
visit, and can access care plans, see medication histories and<br />
get help when prescribing to avoid conflicts between drugs.<br />
<strong>TELUS</strong> has made several recent acquisitions to strengthen our<br />
leadership in the EMR space and to further our efforts in<br />
accelerating the adoption of EMR solutions across Canada.<br />
What about solutions for consumers?<br />
<strong>TELUS</strong> Health offers personal health records (PHRs) to<br />
electronically track and securely share health data between<br />
patients and healthcare professionals. In addition, remote<br />
patient monitoring allows physicians or nurses to closely<br />
monitor patients, no matter where they are located.<br />
How do you view the use of technology in<br />
our healthcare system?<br />
Canada lags behind in providing tools and technology that<br />
support patient self-management and inform patients about<br />
their lifestyle choices, medication and treatments. For EMR<br />
adoption, Canada ranks second last in Organization for Economic<br />
Co-operation and Development (OECD) countries. Although<br />
the system is falling short, Canadians want this technology:<br />
66 per cent want remote and home monitoring technologies<br />
that can help them make more informed decisions, and more<br />
than 60 per cent want a PHR. We, of course, want to help<br />
address this situation.<br />
Where else can <strong>TELUS</strong> help?<br />
We know that the Canadian healthcare system, as it operates<br />
today, is unsustainable. Much-needed change and efficiency<br />
can be achieved through technology innovation. That is why<br />
<strong>TELUS</strong> Health is:<br />
. Extending our reach to healthcare providers<br />
. Developing advanced health collaboration services that span<br />
the care continuum and allow fundamental transformation<br />
in the way care is delivered<br />
. Ensuring the healthcare data that is gathered is meaningful<br />
in order to drive better outcomes for all Canadians.<br />
<strong>TELUS</strong> 2012 ANNUAL REPORT . 23
Our strategic intent<br />
To unleash the power of the Internet to deliver the best solutions<br />
to Canadians at home, in the workplace and on the move.<br />
Our strategic imperatives<br />
Focusing relentlessly on growth markets of data, IP and wireless<br />
Providing integrated solutions that differentiate <strong>TELUS</strong> from our competitors<br />
Building national capabilities across data, IP, voice and wireless<br />
Partnering, acquiring and divesting to accelerate the implementation<br />
of our strategy and focus our resources on core business<br />
Going to market as one team, under a common brand,<br />
executing a single strategy<br />
Investing in internal capabilities to build a high-performance<br />
culture and efficient operation.
Executive leadership team<br />
You want leadership.<br />
We are advancing our strategy.<br />
Josh Blair François Côté John Gossling Monique Mercier Joe Natale Bill Sayles<br />
Eros Spadotto<br />
Josh Blair<br />
Executive Vice-President (EVP), Human<br />
Resources and Chief Corporate Officer<br />
Location: Vancouver, British Columbia<br />
Joined <strong>TELUS</strong>: 1995<br />
Executive: 2007<br />
Education: Bachelor of Engineering<br />
(Electrical – Distinction), University of Victoria;<br />
and Executive Program, Queen’s School<br />
of Business<br />
Boards and affiliations: The Sandbox Project;<br />
Board of Advisors for Cures for Kids<br />
Foundation; and Vice-Chair of <strong>TELUS</strong><br />
Vancouver Community Board<br />
<strong>TELUS</strong> shareholdings: 96,629<br />
<strong>TELUS</strong> options: 73,707<br />
François Côté<br />
EVP, <strong>TELUS</strong> and Vice-Chair, <strong>TELUS</strong> Québec,<br />
<strong>TELUS</strong> Health and <strong>TELUS</strong> Ventures<br />
Location: Montreal, Quebec<br />
Joined <strong>TELUS</strong>: 2008 (Emergis: 1998)<br />
Executive: 2009<br />
Education: Bachelor of Social Sciences<br />
(Industrial Relations), Laval University<br />
Boards and affiliations: Institut de Cardiologie<br />
de Montréal (Montreal Heart Institute) and<br />
Acti-Menu; member of the Board of Governors<br />
for the Fondation de la tolérance (Tolerance<br />
Foundation); and Chair of FitSpirit<br />
<strong>TELUS</strong> shareholdings: 67,898<br />
<strong>TELUS</strong> options: 52,880<br />
Darren Entwistle<br />
President and Chief Executive Officer<br />
Biography can be found on page 27.<br />
For further information,<br />
visit telus.com/bios.<br />
John Gossling<br />
EVP and Chief Financial Officer<br />
Location: Vancouver, British Columbia<br />
Joined <strong>TELUS</strong>: 2012<br />
Executive: 2012<br />
Education: Bachelor of Mathematics<br />
(Honours), University of Waterloo; and<br />
Chartered Accountant (Canada)<br />
Boards and affiliations: Chair of Audit<br />
Committee, Vitran Corporation; and<br />
Fellow of the Institute of Chartered<br />
Accountants of Ontario<br />
<strong>TELUS</strong> shareholdings: 93<br />
<strong>TELUS</strong> options: –<br />
Monique Mercier<br />
Senior Vice-President, Chief Legal Officer<br />
and Corporate Secretary<br />
Location: Vancouver, British Columbia<br />
Joined <strong>TELUS</strong>: 2008 (Emergis: 1999)<br />
Executive: 2011<br />
Education: Bachelor of Laws, University of<br />
Montreal Law School; and Masters in Political<br />
Science, Oxford University<br />
Boards and affiliations: Management<br />
Committee of the L.R. Wilson Chair in<br />
Information Technology and E-Commerce<br />
Law, University of Montreal; Director and<br />
Chair of Compensation Committee, Stornoway<br />
Diamond Corporation; and member of the<br />
Quebec Bar, Canadian Bar Association and<br />
Association of Canadian General Counsel<br />
<strong>TELUS</strong> shareholdings: 12,913<br />
<strong>TELUS</strong> options: 12,040<br />
<strong>TELUS</strong> shareholdings represent the total common<br />
and non-voting shares and restricted stock units held<br />
as at December 31, 2012. <strong>TELUS</strong> options held as at<br />
December 31, 2012.<br />
Joe Natale<br />
EVP and Chief Commercial Officer<br />
Location: Toronto, Ontario<br />
Joined <strong>TELUS</strong>: 2003<br />
Executive: 2003<br />
Education: Bachelor of Applied Science<br />
(Electrical Engineering), University of Waterloo<br />
Boards and affiliations: Celestica, United<br />
Way Toronto and Soulpepper Theatre<br />
<strong>TELUS</strong> shareholdings: 163,850<br />
<strong>TELUS</strong> options: 125,036<br />
Bill Sayles<br />
EVP, Business Transformation<br />
Location: Vancouver, British Columbia<br />
Joined <strong>TELUS</strong>: 2008<br />
Executive: 2012<br />
Education: Bachelor of Science, Portland<br />
State University<br />
Boards and affiliations: Teradici Corporation<br />
and British Columbia Technology Industry<br />
Association; and Chair of the MIS Board of<br />
Advisors, Sauder School of Business,<br />
University of British Columbia<br />
<strong>TELUS</strong> shareholdings: 17,361<br />
<strong>TELUS</strong> options: 16,212<br />
Eros Spadotto<br />
EVP, Technology Strategy and Operations<br />
Location: Toronto, Ontario<br />
Joined <strong>TELUS</strong>: 2000 (Clearnet: 1995)<br />
Executive: 2005<br />
Education: Bachelor of Applied Science<br />
(Electrical Engineering), University of Windsor;<br />
and MBA, Richard Ivey School of Business,<br />
Western University<br />
Boards and affiliations: Vice-Chair, Digital ID<br />
and Authentication Council of Canada<br />
<strong>TELUS</strong> shareholdings: 78,309<br />
<strong>TELUS</strong> options: 194,700<br />
<strong>TELUS</strong> 2012 ANNUAL REPORT . 25
Board of directors<br />
You want accountability.<br />
We strive for the highest integrity.<br />
R.H. (Dick) Auchinleck<br />
Residence: Victoria, British Columbia<br />
Principal occupation: Corporate Director<br />
Director since: 2003<br />
Education: Bachelor of Applied Science<br />
(Chemical Engineering), University of British<br />
Columbia<br />
Other boards and affiliations: ConocoPhillips<br />
Inc. and Enbridge Income Fund Holdings Inc.<br />
<strong>TELUS</strong> Committees: Human Resources and<br />
Compensation, and Corporate Governance<br />
<strong>TELUS</strong> shareholdings: 60,710<br />
A. Charles Baillie<br />
Residence: Toronto, Ontario<br />
Principal occupation: Chair, Alberta<br />
Investment Management Corporation<br />
Director since: 2003<br />
Education: Bachelor of Arts, Political Science<br />
and Economics (Honours), University of<br />
Toronto; MBA, Harvard Business School;<br />
Honorary Doctorate of Laws, Queen’s<br />
University; and Honorary Diploma, Royal<br />
Conservatory of Music<br />
Other boards and affiliations: Canadian<br />
National Railway Company, George Weston<br />
Limited, Royal Conservatory of Music and<br />
Luminato; Chair of the Art Gallery of Ontario’s<br />
Board of Trustees; President of the Authors<br />
at Harbourfront Centre; Officer of Order of<br />
Canada; Chancellor Emeritus of Queen’s<br />
University; and Companion of the Canadian<br />
Business Hall of Fame<br />
<strong>TELUS</strong> Committees: Pension; and Chair,<br />
Human Resources and Compensation<br />
<strong>TELUS</strong> shareholdings: 118,410<br />
26 . <strong>TELUS</strong> 2012 ANNUAL REPORT<br />
Micheline Bouchard<br />
Residence: Montreal, Quebec<br />
Principal occupation: Corporate Director<br />
Director since: 2004<br />
Education: Bachelor of Applied Science<br />
(Engineering Physics) and Master of Applied<br />
Science (Electrical Engineering), École<br />
Polytechnique; and Honorary Doctorates from<br />
Université de Montréal (HEC), University of<br />
Waterloo, University of Ottawa, Ryerson<br />
Polytechnic University and McMaster University<br />
Other boards and affiliations: Harry Winston<br />
Diamond Corporation and Public Sector<br />
Pension Investment Board; Member of the<br />
Honorary Committee of Telefilm Canada;<br />
Certified Member of the Institute of Corporate<br />
Directors; and Member of Order of Canada<br />
and of National Order of Quebec<br />
<strong>TELUS</strong> Committees: Pension, and Human<br />
Resources and Compensation<br />
<strong>TELUS</strong> shareholdings: 35,379<br />
R. John Butler, Q.C.<br />
Residence: Edmonton, Alberta<br />
Principal occupation: Counsel, Bryan<br />
& Company<br />
Director since: 1995<br />
Education: Bachelor of Arts and Bachelor<br />
of Law, University of Alberta<br />
Other boards and affiliations: Liquor Stores<br />
N.A. Ltd.; Chair of the Canadian Football<br />
League Board of Governors; and Member<br />
of Law Society of Alberta<br />
<strong>TELUS</strong> Committee: Audit<br />
<strong>TELUS</strong> shareholdings: 40,545<br />
Brian A. Canfield<br />
Residence: Point Roberts, Washington<br />
Principal occupation: Chair, <strong>TELUS</strong><br />
Corporation<br />
Director since: 1989<br />
Education: Banff School of Advanced<br />
Management; and Honorary Doctorate<br />
in Technology, British Columbia Institute<br />
of Technology<br />
Other boards and affiliations: Westshore<br />
Terminals Investment Corporation; Member<br />
of Order of Canada and of Order of British<br />
Columbia; and Fellow of the Institute of<br />
Corporate Directors<br />
<strong>TELUS</strong> shareholdings: 86,471<br />
Stockwell Day<br />
Residence: Kelowna, British Columbia<br />
Principal occupation: Advisor/Consultant<br />
Director since: 2011<br />
Education: University of Victoria; Honorary<br />
Doctorate, University of St. Petersburg, Russia;<br />
and Honorary Ph.D., Trinity Western University<br />
Other boards and affiliations: Canada China<br />
Business Council, Canada-India Business<br />
Council, Canada Korea Foundation, Centre<br />
for Israel and Jewish Affairs, International<br />
Fellowship of Christians and Jews, and Prion<br />
Foundation for Brain Research; Senior Strategic<br />
Advisor of McMillan LLP, Advisor of RCI<br />
Capital Group Inc. and Advisor of Eminata<br />
Group; and Distinguished Fellow of Asia<br />
Pacific Foundation of Canada<br />
<strong>TELUS</strong> Committee: Audit<br />
<strong>TELUS</strong> shareholdings: 3,751<br />
Pierre Ducros<br />
Residence: Montreal, Quebec<br />
Principal occupation: President, P. Ducros<br />
& Associés Inc.<br />
Director since: 2005<br />
Education: Bachelor of Arts, Université de<br />
Paris at Collège Stanislas, Montreal; Royal<br />
Military College of Canada; and Bachelor<br />
of Engineering (Communications), McGill<br />
University<br />
Other boards and affiliations: Canadian<br />
Institute for Advanced Research; Chairman<br />
of Medical.MD EHR Inc.; Member of Order<br />
of Canada; and Officer of Order of Belgium<br />
<strong>TELUS</strong> Committees: Corporate Governance,<br />
and Human Resources and Compensation<br />
<strong>TELUS</strong> shareholdings: 37,651
Dick Auchinleck Charles Baillie Micheline Bouchard John Butler Brian Canfield Stockwell Day<br />
Pierre Ducros<br />
Darren Entwistle<br />
Residence: Vancouver, British Columbia<br />
Principal occupation: President and Chief<br />
Executive Officer, <strong>TELUS</strong> Corporation<br />
Director since: 2000<br />
Education: Bachelor of Economics (Honours),<br />
Concordia University; MBA (Finance), McGill<br />
University; Diploma (Network Engineering),<br />
University of Toronto; Honorary Doctorate of<br />
Laws, Concordia University; and Honorary<br />
Degree in Business Administration, Northern<br />
Alberta Institute of Technology<br />
Other boards and affiliations: Canadian<br />
Board Diversity Council, George Weston<br />
Limited and Canadian Council of Chief<br />
Executives; and Honorary Fellow of the<br />
Royal Conservatory<br />
<strong>TELUS</strong> shareholdings: 797,860<br />
<strong>TELUS</strong> options: 303,180<br />
R.E.T. (Rusty) Goepel<br />
Residence: Vancouver, British Columbia<br />
Principal occupation: Senior Vice-President,<br />
Raymond James Financial Ltd.<br />
Director since: 2004<br />
Education: Bachelor of Commerce, University<br />
of British Columbia<br />
Other boards and affiliations: Amerigo<br />
Resources Ltd., Baytex Energy Corp.,<br />
Vancouver Airport Authority and Lift<br />
Philanthropy Partners; Governor of Business<br />
Council of B.C.; Chair of Vancouver 2010<br />
Olympic Organizing Committee; and Chairman<br />
of Yellow Point Equity Partners<br />
<strong>TELUS</strong> Committees: Pension; and Chair,<br />
Corporate Governance<br />
<strong>TELUS</strong> shareholdings: 46,786<br />
Rusty Goepel John Lacey Bill MacKinnon John Manley Donald Woodley<br />
John S. Lacey<br />
Residence: Thornhill, Ontario<br />
Principal occupation: Chairman, Advisory<br />
Board of Brookfield Private Equity Fund<br />
(formerly Brookfield Special Situations<br />
Partners Ltd.)<br />
Director since: 2000<br />
Education: Program for Management<br />
Development, Harvard Business School<br />
Other boards and affiliations: Ainsworth<br />
Lumber Co. Ltd., George Weston Limited and<br />
Loblaw Companies Limited; and Chairman<br />
of Doncaster Consolidated Ltd.<br />
<strong>TELUS</strong> Committee: Audit<br />
<strong>TELUS</strong> shareholdings: 57,887<br />
William (Bill) A. MacKinnon<br />
Residence: Toronto, Ontario<br />
Principal occupation: Corporate Director<br />
Director since: 2009<br />
Education: Bachelor of Commerce (Honours),<br />
University of Manitoba; and Chartered<br />
Accountant (Canada)<br />
Other boards and affiliations: Osisko Mining<br />
Corporation, Novadaq Technologies Inc.,<br />
Pioneer Petroleum Limited, Public Sector<br />
Pension Investment Board, Toronto<br />
Community Foundation, St. Stephen<br />
Community House and Roy Thomson Hall;<br />
Chair of Toronto Board of Trade; Chair of<br />
Toronto East General Hospital; and Fellow<br />
of the Institute of Chartered Accountants<br />
of Ontario<br />
<strong>TELUS</strong> Committee: Chair, Audit<br />
<strong>TELUS</strong> shareholdings: 24,320<br />
For further information, visit telus.com/bios.<br />
John Manley<br />
Residence: Ottawa, Ontario<br />
Principal occupation: President and<br />
Chief Executive Officer, Canadian Council<br />
of Chief Executives<br />
Director since: 2012<br />
Education: Bachelor of Arts, Carleton<br />
University; Juris Doctorate, University of<br />
Ottawa; Chartered Director, McMaster<br />
University; and Honorary Doctorates from<br />
Carleton University, University of Toronto,<br />
Western University and University of Ottawa<br />
Other boards and affiliations: CIBC,<br />
Canadian Pacific Railway Limited, CAE Inc.,<br />
CARE Canada, Institute for Research and<br />
Public Policy, MaRS Discovery District,<br />
National Arts Centre (NAC) Foundation<br />
and the Conference Board of Canada<br />
<strong>TELUS</strong> Committee: Audit<br />
<strong>TELUS</strong> shareholdings: 2,245<br />
Donald Woodley<br />
Residence: Mono Township, Ontario<br />
Principal occupation: Corporate Director<br />
Director since: 1998<br />
Education: Bachelor of Commerce, University<br />
of Saskatchewan; and MBA, Richard Ivey<br />
School of Business, Western University<br />
Other boards and affiliations: Canada Post<br />
Corporation and Steam Whistle Brewing Inc.<br />
<strong>TELUS</strong> Committees: Corporate Governance;<br />
and Chair, Pension<br />
<strong>TELUS</strong> shareholdings: 44,840<br />
<strong>TELUS</strong> shareholdings represent the total common<br />
and non-voting shares and deferred stock units<br />
(restricted stock units for Darren Entwistle) held as<br />
at December 31, 2012. <strong>TELUS</strong> options held as at<br />
December 31, 2012.<br />
<strong>TELUS</strong> 2012 ANNUAL REPORT . 27
Where we are<br />
You asked for more.<br />
We are investing for growth.<br />
We continue to invest in infrastructure and technology to bring world-class wireless services to Canadians<br />
and to expand IP service to businesses and Optik TV and high-speed Internet services to more homes across<br />
B.C., Alberta and Eastern Quebec. Traditional telephony, data services and IP-based solutions are delivered<br />
through our national fibre-optic backbone. We are also dedicated to investing in local community organizations<br />
where we live, work and serve.<br />
More than 42,000 <strong>TELUS</strong> team members are committed to putting customers first from locations<br />
across Canada and internationally.<br />
<strong>TELUS</strong> network coverage<br />
Wireless network coverage<br />
Optical and IP network<br />
Carrier interconnections<br />
Switching centres<br />
Internet data centres<br />
Network infrastructure and coverage<br />
areas are approximate as of<br />
December 2012. Actual coverage<br />
and network services may vary<br />
and are subject to change. To see<br />
our wireless network coverage,<br />
visit telusmobility.com/coverage.<br />
Location<br />
Wireless<br />
market share 1<br />
28 . <strong>TELUS</strong> 2012 ANNUAL REPORT<br />
British<br />
Columbia<br />
Wireline local<br />
market share 1<br />
Alberta<br />
Manitoba<br />
Saskatchewan<br />
Team<br />
members<br />
Ontario<br />
Quebec<br />
2010 to 2012 capital<br />
expenditures <strong>TELUS</strong> Community Boards<br />
British Columbia 39% 65% 8,200 $2.1 billion Victoria, Vancouver and Thompson Okanagan<br />
Alberta 49% 67% 6,300 $2.0 billion Calgary and Edmonton<br />
Ontario 19% n.a. 7,600 $517 million Toronto and Ottawa<br />
Quebec 28% n.a. 5,500 $862 million Montreal, Rimouski and Quebec City<br />
Atlantic and<br />
other Canada<br />
16% n.a. 500 $53 million Atlantic Canada<br />
International – – 14,300 $55 million The Philippines, Guatemala and El Salvador<br />
Total – – 42,400 $5.5 billion 14 Community Boards<br />
1 Calculations are based on <strong>TELUS</strong>’ percentage of total subscribers for wireless and retail local access n.a. – Not available<br />
lines for wireline. Source: CRTC’s Communications Monitoring Report, September 2012.<br />
Atlantic<br />
Canada
Financial<br />
review<br />
What’s inside<br />
30-31<br />
CFO letter to investors<br />
A look at <strong>TELUS</strong>’ financial<br />
performance and how<br />
we create value for our<br />
shareholders<br />
32-33<br />
Corporate governance<br />
Our commitment to<br />
governance excellence<br />
and fair disclosure<br />
34-39<br />
Financial and<br />
operating statistics<br />
Annual and quarterly<br />
financial, operating and<br />
segmented information<br />
40-106<br />
Management’s<br />
discussion and analysis<br />
A discussion of our<br />
financial position,<br />
performance and targets<br />
107-165<br />
Financial statements<br />
and notes<br />
2012 consolidated<br />
financial statements and<br />
accompanying notes<br />
Back<br />
166- cover<br />
Additional investor<br />
resources<br />
Glossary, investor<br />
information and reasons<br />
to invest in <strong>TELUS</strong><br />
<strong>TELUS</strong> 2012 ANNUAL REPORT . 29
CFO letter to investors<br />
You want financial growth.<br />
We have a strategy that delivers.<br />
For <strong>TELUS</strong>, 2012 was an outstanding year in which we achieved<br />
great financial performance and, for the third consecutive year,<br />
created significant value for our shareholders. Our focus on<br />
putting customers first is generating solid financial results. Last<br />
year, our shareholders enjoyed a total return, including dividends,<br />
of 20 per cent, compared to an average return of seven per cent<br />
for companies listed on the Toronto Stock Exchange. With strong<br />
cash flow and an enviable financial foundation, we are firmly<br />
positioned for ongoing success.<br />
Strong financial and operational results<br />
A consistent focus on our long-term strategy continues to position<br />
us strongly for realizing our goals. Our strategic investments in<br />
new wireless and wireline technology and services, combined<br />
with our commitment to improve the customer experience, have<br />
produced great results.<br />
30 . <strong>TELUS</strong> 2012 ANNUAL REPORT<br />
During the year, we generated revenue growth of five per cent<br />
to $10.9 billion, and earnings per share (EPS) growth of almost<br />
eight per cent to $4.05, reflecting the increases in wireless network<br />
revenue and wireline data revenue. Of particular note is free cash<br />
flow, which was up 34 per cent due to the increase in EBITDA<br />
(earnings before interest, taxes, depreciation and amortization)<br />
and a reduction in discretionary pension contributions.<br />
We are implementing the amended IAS 19 employee benefits<br />
accounting standard, which will cause a non-cash decrease to<br />
<strong>report</strong>ed earnings in 2013, including EBITDA and EPS. Our 2013<br />
results will be shown against lower restated 2012 figures.<br />
Our 2013 financial targets build on the positive trends of 2012.<br />
The target ranges also incorporate our strong focus on cost<br />
efficiency, particularly in the wireline legacy side of our business.<br />
<strong>TELUS</strong> is targeting growth of up to six per cent in revenue, up to<br />
eight per cent in EBITDA, and between three and 14 per cent<br />
in EPS. These targets are subject to important assumptions<br />
Consolidated and segmented 2013 targets<br />
Revenues<br />
$11.4 to<br />
$11.6 billion<br />
4 to 6%<br />
Wireless<br />
revenues<br />
$6.2 to<br />
$6.3 billion<br />
6 to 8%<br />
1, 2 EBITDA<br />
$3.95 to<br />
$4.15 billion<br />
2 to 8%<br />
Wireless<br />
1, 2 EBITDA<br />
$2.575 to<br />
$2.675 billion<br />
5 to 9%<br />
1 For definitions of these measures (which are non-GAAP) see Section 11 of Management’s discussion and analysis.<br />
2 Presented after applying the amended accounting standard IAS 19 for employee benefits.<br />
3 Excluding payments for spectrum.<br />
Earnings per<br />
share (EPS) 2<br />
$3.80 to $4.20<br />
3 to 14%<br />
Wireline<br />
revenues<br />
$5.2 to<br />
$5.3 billion<br />
2 to 4%<br />
Capital<br />
expenditures 3<br />
Approximately<br />
$1.95 billion<br />
–<br />
Wireline<br />
1, 2 EBITDA<br />
$1.375 to<br />
$1.475 billion<br />
(2) to 5%
and are fully qualified by the caution regarding forward-looking<br />
statements in Management’s discussion and analysis.<br />
As an outcome of our targets, free cash flow1 (before dividends<br />
and spectrum) in 2013 is anticipated to remain strong at<br />
$1.2 bil lion to $1.4 billion, as the targeted increase in EBITDA<br />
is offset by higher cash income taxes.<br />
Putting investors first<br />
Our solid financial position and adherence to our public financial<br />
policies allow <strong>TELUS</strong> to pursue opportunities and create<br />
value for investors. At the end of 2012, our net debt to EBITDA<br />
ratio was 1.6 times, well within our long-term target policy<br />
range of 1.5 to 2.0 times, and we had in excess of $1.9 billion<br />
in unutilized liquidity, well above our policy of maintaining<br />
more than $1 billion.<br />
We have a proven track record of maintaining low-cost<br />
access to capital markets based on optimal investment grade<br />
credit ratings. We finished 2012 with a well-received issue of<br />
$500 million of 10-year notes at a historically low rate of 3.35 per<br />
cent. The proceeds were used to pay down our commercial<br />
paper (short-term floating rate debt). This increases our available<br />
liquidity and strongly positions us to repay or refinance the<br />
modest $300 million of debt that matures in 2013.<br />
With our leverage at the lowest level since early 2000,<br />
we have a strong balance sheet and ample room for additional<br />
commercial paper issuance. We are in an excellent position to<br />
bid for and secure spectrum in the important government<br />
auctions later this year and next, which is key to supporting<br />
our ongoing wireless investment and performance.<br />
Under our dividend growth model, announced in May 2011,<br />
we committed to delivering two increases of circa 10 per cent<br />
each year to the end of 2013. To date, we have delivered four of<br />
those six dividend increases, and the current dividend is an<br />
<strong>annual</strong>ized $2.56, up 10.3 per cent from a year earlier. In addition,<br />
for 2013, our dividend payout ratio guideline has been adjusted<br />
upward by 10 points to a range of 65 to 75 per cent of prospective<br />
EPS. This adjustment is due to the amended IAS 19 employee<br />
JOHN GOSSLING<br />
Executive Vice-President and Chief Financial Officer<br />
benefits accounting standard, which decreases <strong>report</strong>ed EPS<br />
going forward but has no impact on cash flow.<br />
We put shareholders first in 2012 with our persistence to<br />
complete the non-voting share exchange, despite the prolonged<br />
opposition of a New York-based hedge fund. The proposed<br />
exchange created significant shareholder value when it was first<br />
announced. Effective on February 4, 2013, the share exchange<br />
resulted in our common shares being listed for the first time on the<br />
New York Stock Exchange and provided enhanced liquidity with<br />
a single class of 326 million shares that is now 86 per cent larger.<br />
Our financial achievements and initiatives are definitely<br />
paying off for shareholders – the market value of our equity has<br />
surpassed $20 billion for the first time, up by $2 billion in 2012.<br />
As well, our share price continued to advance in 2013 and<br />
reached new all-time highs in February.<br />
We believe that our success in creating value is founded in<br />
part on providing fair and transparent disclosure to help reduce<br />
uncertainty for investors. The Canadian Institute of Chartered<br />
Accountants recognized our disclosure in December with its<br />
overall award of excellence in corporate <strong>report</strong>ing.<br />
Positioned for ongoing success<br />
This is definitely an exciting time for <strong>TELUS</strong> as we work<br />
to realize the benefits of putting customers first. We have the<br />
financial strength, strategic focus and financial policies that<br />
should con tinue to position us exceedingly well for the future.<br />
I am keen to play an integral role in our ongoing success as<br />
we strive to create long-term value for <strong>TELUS</strong> investors.<br />
Best regards,<br />
John Gossling<br />
Executive Vice-President and Chief Financial Officer<br />
February 27, 2013<br />
<strong>TELUS</strong> 2012 ANNUAL REPORT . 31
Corporate governance<br />
You want fairness and<br />
transparency.<br />
That is our commitment.<br />
At <strong>TELUS</strong>, we are dedicated to excellence in corporate<br />
governance and full and fair disclosure. We continue to put<br />
stakeholders first as we pursue greater transparency, seek<br />
ideas for improvement and ensure integrity in our actions.<br />
Committed to doing the right things<br />
Each year, we implement new initiatives that enhance good<br />
corporate governance, some of which are listed below.<br />
. We obtained strong approval from shareholders for our<br />
proposal to exchange non-voting shares into common shares<br />
so as to enhance the liquidity and marketability of <strong>TELUS</strong><br />
shares and provide full voting rights to all <strong>TELUS</strong> shareholders.<br />
We accomplished this despite the opposition of a New Yorkbased<br />
hedge fund. After a year-long process, the share<br />
exchange was completed in February 2013.<br />
32 . <strong>TELUS</strong> 2012 ANNUAL REPORT<br />
. To help ensure the objectivity, independence and availability<br />
of all Board members, and to formalize the Company’s<br />
expectations of directors, the Board adopted policies that:<br />
. Limit the number of boards, other than <strong>TELUS</strong>’ Board,<br />
of which directors can be members to four or, if a director<br />
is employed full-time as an executive at a public company,<br />
to two<br />
. Limit interlocking board memberships to two, meaning<br />
that no more than two <strong>TELUS</strong> directors can sit on the<br />
same outside board. The policy grandfathers existing<br />
interlocks on two boards<br />
. Limit the number of directors currently serving as CEOs<br />
who can be members of our Compensation Committee<br />
. Limit the ability of our CEO to sit on the board of a<br />
company whose CEO sits on our Board.<br />
Best practices in corporate governance<br />
We take a proactive approach to ensuring best practices in corporate governance.<br />
Some of these practices include:<br />
. Holding our second <strong>annual</strong> say-on-pay vote on executive compensation, which received<br />
97 per cent approval from common shareholders, up from 80 per cent the year before<br />
. Having and disclosing a majority voting policy for the election of directors since 2007<br />
. Continuously improving our leading enterprise risk governance framework and assessment<br />
process, which includes evaluating perceptions of risk resiliency and tolerance, integrating<br />
risk considerations into key decisions, and holding risk mitigation strategy discussions<br />
with executives on key risks<br />
. Strengthening our risk assessment and mitigation efforts by having a Fraud Governance<br />
Committee and tax conduct and risk management policy<br />
. Complying with the independence definition provisions of the New York Stock Exchange<br />
(NYSE) governance standards.
. To better align the interests of management with those<br />
of shareholders, we enhanced our executive compensation<br />
practices. Executives whose shareholdings are below their<br />
share ownership requirements must take 50 per cent of their<br />
net equity award in shares for any equity vesting and hold<br />
them until their ownership requirements are met. Executives<br />
retiring from the Company must hold shares at their required<br />
share ownership level for one year after retiring.<br />
Striving for integrity<br />
At <strong>TELUS</strong>, we know that having a shared understanding and<br />
a commitment to integrity sets the foundation that enables<br />
our organization to put our customers first.<br />
Each year, we update our ethics policy to ensure it remains<br />
relevant. In 2012, we added information regarding bribery<br />
and corruption, the environment and team members’ use of<br />
networks, as well as guidelines around supplier-funded incentive<br />
programs. We then updated our mandatory online learning<br />
course, which helps our team members and contractors<br />
make appropriate decisions on ethical, respectful workplace,<br />
security and privacy issues.<br />
In early 2012, our new supplier code of conduct was<br />
success fully rolled out after extensive benchmarking. The code<br />
is based upon generally accepted standards of ethical busi-<br />
ness conduct.<br />
We continue to provide an Ethics Line for anonymous and<br />
confidential questions or complaints on accounting, internal<br />
control or ethical issues. Calls are handled by an independent<br />
agency 24 hours a day, offering multi-language services<br />
to internal and external callers. For the 10th consecutive year,<br />
of all calls made to the Ethics Office in 2012, none involved<br />
fraud by team members with a significant role in internal control<br />
over financial <strong>report</strong>ing.<br />
To provide shareholder feedback or comments<br />
to our Board, email board@telus.com.<br />
At <strong>TELUS</strong>, we know<br />
that having a shared<br />
understanding and a<br />
commitment to integrity<br />
sets the foundation that<br />
enables our organization to<br />
put our customers first.<br />
Increasing investor confidence<br />
We actively communicate with investors to help them make<br />
informed decisions. In 2012, we participated in four conference<br />
calls and simultaneous webcasts, and seven conference<br />
presentations and tours. To view past and upcoming events,<br />
visit telus.com/investors. <strong>TELUS</strong> executives also met with<br />
more than 130 institutional investors in Canada and the U.S.<br />
In relation to the two contested share exchange proposals,<br />
<strong>TELUS</strong> engaged a proxy solicitation firm, sent numerous<br />
mail-outs and undertook multiple call-out programs to inform<br />
shareholders. As a result, we had record-high shareholder<br />
participation at the May and October shareholder meetings.<br />
In 2012, we continued to be recognized for excellence<br />
in corporate governance and <strong>report</strong>ing.<br />
. <strong>TELUS</strong> was ranked as the best in Canada for overall corporate<br />
<strong>report</strong>ing (financial <strong>report</strong>ing, corporate gover nance<br />
disclosure, sustainable development <strong>report</strong>ing and website)<br />
by the Canadian Institute of Chartered Accountants for<br />
the fifth time in the past six years. Also, <strong>TELUS</strong>’ corporate<br />
governance and sustainable development dis closures were<br />
given honourable mention for being second best<br />
. <strong>TELUS</strong> was given an A rating and was recognized for having<br />
the 14th best <strong>annual</strong> <strong>report</strong> in the world by the Annual Report<br />
on Annual Reports in an international ranking of the top<br />
500 <strong>report</strong>s.<br />
For a full statement of <strong>TELUS</strong>’ corporate governance practices, including our Board policy manual<br />
and disclosure regarding our governance practices compared to those required by the NYSE,<br />
refer to the <strong>TELUS</strong> 2013 information circular or visit telus.com/governance.<br />
<strong>TELUS</strong> 2012 ANNUAL REPORT . 33
Annual consolidated financials<br />
Consolidated After transition to IFRS 1 Prior to transition to IFRS<br />
Statement of income (millions) 2012 2011 2010 2010 2009 2008 2007 2006<br />
Operating revenues 2 $ß10,921 $ß10,397 $ß 9,792 $ß 9,779 $ß 9,606 $ß 9,653 $ß 9,074 $ß 8,681<br />
Operating expenses before restructuring costs,<br />
depreciation and amortization 3 6,901 6,584 6,062 6,062 5,925 5,815 5,465 4,998<br />
Restructuring costs 48 35 80 74 190 59 20 68<br />
EBITDA 4 3,972 3,778 3,650 3,643 3,491 3,779 3,589 3,615<br />
Depreciation and amortization 1,865 1,810 1,741 1,735 1,722 1,713 1,615 1,576<br />
Operating income 2,107 1,968 1,909 1,908 1,769 2,066 1,974 2,039<br />
Other expense, net – – – 32 32 36 36 28<br />
Financing costs before debt redemption loss 332 377 470 458 433 463 440 505<br />
Debt redemption loss – – 52 52 99 – – –<br />
Income before income taxes 1,775 1,591 1,387 1,366 1,205 1,567 1,498 1,506<br />
Income taxes 457 376 335 328 203 436 233 353<br />
Net income $ß 1,318 $ß 1,215 $ß 1,052 $ß 1,038 $ß 1,002 $ß 1,131 $ß 1,265 $ß 1,153<br />
Net income attributable to common shares<br />
and non-voting shares $ß 1,318 $ß 1,219 $ß 1,048 $ß 1,034 $ß 998 $ß 1,128 $ß 1,258 $ß 1,145<br />
Share information 5 2012 2011 2010 2010 2009 2008 2007 2006<br />
Average shares outstanding – basic (millions) 326 324 320 320 318 320 332 344<br />
Year-end shares outstanding (millions) 326 325 322 322 318 318 324 338<br />
Earnings per share (EPS) – basic $ß 4.05 $ß 3.76 $ß 3.27 $ß 3.23 $ß 3.14 $ß 3.52 $ß 3.79 $ß 3.33<br />
Dividends declared per share 2.44 2.205 2.00 2.00 1.90 1.825 1.575 1.20<br />
Financial position (millions) 2012 2011 2010 2010 2009 2008 2007 2006<br />
Capital assets, at cost 6 $ß37,189 $ß36,586 $ß35,203 $ß35,100 $ß34,357 $ß32,581 $ß30,129 $ß28,661<br />
Accumulated depreciation and amortization 6 22,843 22,469 21,220 22,244 21,480 20,098 19,007 17,679<br />
Total assets 20,445 19,931 19,624 19,599 19,219 19,021 16,849 16,522<br />
Net debt 7 6,577 6,959 6,869 6,869 7,312 7,286 6,141 6,278<br />
Total capitalization 8 14,223 14,461 14,649 15,088 14,959 14,524 13,100 13,253<br />
Long-term debt 5,711 5,508 5,209 5,313 6,090 6,348 4,584 3,475<br />
Owners’ equity 7,686 7,513 7,781 8,201 7,575 7,108 6,855 6,975<br />
Operating revenues and EBITDA 9 margin ($ billions and %)<br />
12<br />
11<br />
10<br />
10<br />
09<br />
08<br />
07<br />
06<br />
Prior to transition to IFRS<br />
36.4<br />
36.3<br />
37.3<br />
37.3<br />
36.3<br />
39.1<br />
41.4<br />
41.6<br />
EBITDA margin (%)<br />
34 . <strong>TELUS</strong> 2012 ANNUAL REPORT<br />
8.7<br />
9.1<br />
9.8<br />
9.8<br />
9.6<br />
9.7<br />
10.4<br />
10.9<br />
EPS – basic and dividends declared per share ($)<br />
12<br />
11<br />
10<br />
10<br />
09<br />
08<br />
07<br />
06<br />
1.20<br />
Prior to transition to IFRS<br />
1.575<br />
2.00<br />
2.00<br />
1.90<br />
1.825<br />
2.44<br />
2.205<br />
3.23<br />
3.14<br />
3.27<br />
3.33<br />
Dividends declared per share<br />
3.52<br />
3.76<br />
3.79<br />
4.05
Quarterly consolidated financials<br />
Consolidated<br />
Statement of income (millions) Q4 2012 Q3 2012 Q2 2012 Q1 2012 Q4 2011 Q3 2011 Q2 2011 Q1 2011<br />
Operating revenues 2 Operating expenses before restructuring costs,<br />
$ß2,851 $ß2,774 $ß2,665 $ß2,631 $ß2,690 $ß2,622 $ß2,554 $ß2,531<br />
depreciation and amortization 1,885 1,753 1,654 1,609 1,800 1,651 1,592 1,541<br />
Restructuring costs 19 3 13 13 16 3 12 4<br />
EBITDA4 947 1,018 998 1,009 874 968 950 986<br />
Depreciation and amortization 478 461 456 470 481 443 442 444<br />
Operating income 469 557 542 539 393 525 508 542<br />
Other expense, net – – – – – – – –<br />
Financing costs 86 86 85 75 87 92 94 104<br />
Debt redemption loss – – – – – – – –<br />
Income before income taxes 383 471 457 464 306 433 414 438<br />
Income taxes 92 120 129 116 69 107 90 110<br />
Net income<br />
Net income attributable to common shares<br />
$ß 291 $ß 351 $ß 328 $ß 348 $ß 237 $ß 326 $ß 324 $ß 328<br />
and non-voting shares $ß 291 $ß 351 $ß 328 $ß 348 $ß 246 $ß 325 $ß 321 $ß 327<br />
Share information 5 Q4 2012 Q3 2012 Q2 2012 Q1 2012 Q4 2011 Q3 2011 Q2 2011 Q1 2011<br />
Average shares outstanding – basic (millions) 326 326 326 325 325 325 324 324<br />
Period-end shares outstanding (millions) 326 326 326 325 325 325 324 324<br />
EPS – basic $ß 0.89 $ß 1.08 $ß 1.01 $ß 1.07 $ß 0.76 $ß 1.00 $ß 0.99 $ß 1.01<br />
Dividends declared per share 0.64 0.61 – 1.19 0.58 0.55 0.55 0.525<br />
1 International Financial Reporting Standards (IFRS) as issued by the International Accounting Standards Board (IASB). The Company’s date of transition to IFRS-IASB<br />
was January 1, 2010 and its date of adoption was January 1, 2011.<br />
2 IFRS includes certain revenues that, prior to the transition to IFRS, were classified as expense recoveries or Other expense, net.<br />
3 In 2007, <strong>TELUS</strong> introduced a net-cash settlement feature for share option awards granted prior to 2005, which resulted in an incremental pre-tax charge of $169 million<br />
for that year.<br />
4 For a definition of this measure (which is non-GAAP) see Section 11 of Management’s discussion and analysis.<br />
5 Common shares and non-voting shares.<br />
6 Includes Property, plant and equipment and Intangible assets.<br />
7 The summation of Long-term debt excluding unamortized debt issuance cost, current maturities of Long-term debt, net deferred hedging liability related to<br />
U.S. dollar Notes (prior to 2011) and short-term borrowings, less Cash and temporary investments.<br />
8 Net debt plus Owners’ equity excluding Accumulated other comprehensive income (loss).<br />
9 The 2007 EBITDA margin has been adjusted to exclude an incremental charge of $169 million related to the introduction of a net-cash settlement feature for share<br />
option awards granted prior to 2005.<br />
Note: Certain comparative information has been restated to conform with the 2012 presentation.<br />
EBITDA 4 ($ millions)<br />
Q4 12<br />
Q3 12<br />
Q2 12<br />
Q1 12<br />
Q4 11<br />
Q3 11<br />
Q2 11<br />
Q1 11<br />
874<br />
947<br />
968<br />
950<br />
986<br />
1,018<br />
998<br />
1,009<br />
EPS – basic ($)<br />
Q4 12<br />
Q3 12<br />
Q2 12<br />
Q1 12<br />
Q4 11<br />
Q3 11<br />
Q2 11<br />
Q1 11<br />
0.76<br />
0.89<br />
1.01<br />
1.00<br />
0.99<br />
1.01<br />
1.08<br />
1.07<br />
<strong>TELUS</strong> 2012 ANNUAL REPORT . 35
Annual operating statistics<br />
Consolidated After transition to IFRS 1 Prior to transition to IFRS<br />
36 . <strong>TELUS</strong> 2012 ANNUAL REPORT<br />
2012 2011 2010 2010 2009 2008 2007 2006<br />
Cash flow statement information<br />
Cash provided by operating activities (millions) $ß 3,219 $ß 2,550 $ß 2,670 $ß 2,570 $ß 2,904 $ß 2,819 $ß 3,172 $ß 2,804<br />
Cash used by investing activities (millions) (2,058) (1,968) (1,731) (1,731) (2,128) (3,433) (1,772) (1,675)<br />
Cash provided (used) by financing activities (millions)<br />
Profitability ratios<br />
(1,100) (553) (963) (863) (739) 598 (1,369) (1,149)<br />
Dividend payout2 63% 62% 64% 65% 61% 54% 47% 45%<br />
Return on common equity 3 17.0% 15.5% 13.8% 13.1% 13.6% 16.3% 18.6% 16.6%<br />
Return on assets4 Debt and coverage ratios<br />
15.7% 12.8% 13.6% 13.1% 15.1% 14.8% 18.8% 17.0%<br />
EBITDA interest coverage ratio5 12.1 10.1 7.1 7.3 6.9 8.3 8.2 7.3<br />
Net debt to EBITDA ratio6 1.6 1.8 1.8 1.8 2.0 1.9 1.7 1.7<br />
Net debt to total capitalization<br />
Other metrics<br />
46.2% 48.1% 46.9% 45.5% 48.9% 50.2% 46.9% 47.4%<br />
Free cash flow (millions) 7 $ß 1,331 $ß 997 $ß 939 $ß 947 $ß 485 $ß 361 $ß 1,388 $ß 1,443<br />
Capital expenditures (millions) $ß 1,981 $ß 1,847 $ß 1,721 $ß 1,721 $ß 2,103 $ß 1,859 $ß 1,770 $ß 1,618<br />
Payment for auctioned wireless spectrum (millions) – – – – – $ß 882 – –<br />
Capex intensity 8 18% 18% 18% 18% 22% 19% 20% 19%<br />
Total customer connections (000s) 9 Employee-related information<br />
13,113 12,728 12,253 12,253 11,875 11,603 11,111 10,715<br />
Total salaries and benefits (millions) 10 $ß 2,474 $ß 2,258 $ß 2,205 $ß 2,233 $ß 2,303 $ß 2,326 $ß 2,329 $ß 2,028<br />
Total active employees11 42,400 41,100 34,800 34,800 36,400 36,600 34,200 31,900<br />
Full-time equivalent (FTE) employees 41,400 40,100 33,900 33,900 35,300 35,900 33,400 31,100<br />
EBITDA per average FTE employee (000s) 12 $ß 101 $ß 102 $ß 109 $ß 109 $ß 106 $ß 111 $ß 117 $ß 126<br />
Return on common equity (%)<br />
12<br />
11<br />
10<br />
10<br />
09<br />
08<br />
07<br />
06<br />
Prior to transition to IFRS<br />
13.1<br />
13.8<br />
13.6<br />
15.5<br />
16.3<br />
17.0<br />
16.6<br />
18.6<br />
Free cash flow 7 ($ millions)<br />
12<br />
11<br />
10<br />
10<br />
09<br />
08<br />
07<br />
06<br />
361<br />
485<br />
Prior to transition to IFRS<br />
939<br />
947<br />
997<br />
1,331<br />
1,388<br />
1,443
Quarterly operating statistics<br />
Consolidated<br />
Q4 2012 Q3 2012 Q2 2012 Q1 2012 Q4 2011 Q3 2011 Q2 2011 Q1 2011<br />
Cash flow statement information<br />
Cash provided by operating activities (millions) $ 703 $ 965 $ 788 $ 763 $ 742 $ 837 $ 517 $ 454<br />
Cash used by investing activities (millions) (514) (490) (540) (514) (548) (438) (466) (516)<br />
Cash provided (used) by financing activities (millions)<br />
Profitability ratios<br />
(127) (502) (244) (227) (204) (364) (53) 68<br />
Dividend payout2 63% 62% 64% 61% 62% 59% 63% 61%<br />
Return on common equity 3 17.0% 16.4% 16.0% 15.9% 15.5% 15.1% 14.3% 14.3%<br />
Return on assets4 Debt and coverage ratios<br />
15.7% 16.1% 15.6% 14.3% 12.8% 12.2% 12.5% 12.6%<br />
EBITDA interest coverage ratio5 12.1 11.8 11.5 11.0 10.1 9.6 7.8 7.4<br />
Net debt to EBITDA ratio6 1.6 1.7 1.8 1.8 1.8 1.8 1.9 1.9<br />
Net debt to total capitalization<br />
Other metrics<br />
46.2% 45.0% 46.8% 47.5% 48.1% 47.0% 47.1% 46.4%<br />
Free cash flow (millions) 7 $ 263 $ 426 $ 284 $ 358 $ 204 $ 345 $ 286 $ 162<br />
Capital expenditures (millions) $ 521 $ 471 $ 548 $ 441 $ 512 $ 470 $ 456 $ 409<br />
Payment for auctioned wireless spectrum (millions) – – – – – – – –<br />
Capex intensity 8 18% 17% 21% 17% 19% 18% 18% 16%<br />
Total customer connections (000s) 9 Employee-related information<br />
13,113 12,981 12,844 12,749 12,728 12,571 12,431 12,308<br />
Total salaries and benefits (millions) $ 589 $ 608 $ 621 $ 656 $ 595 $ 569 $ 560 $ 534<br />
1 IFRS as issued by the IASB. The Company’s date of transition to IFRS-IASB was January 1, 2010 and its date of adoption was January 1, 2011.<br />
2 Last quarterly dividend declared per share, in the respective <strong>report</strong>ing period, <strong>annual</strong>ized, divided by the sum of Basic earnings per share <strong>report</strong>ed in the most recent<br />
four quarters.<br />
3 Common share and non-voting share income divided by the average quarterly common share and non-voting share equity for the 12-month period. Quarterly ratios<br />
are calculated on a 12-month trailing basis.<br />
4 Cash provided by operating activities divided by total assets. Quarterly ratios are based on a 12-month trailing cash flow provided by operating activities.<br />
5 EBITDA excluding restructuring costs, divided by Financing costs before gains on redemption and repayment of debt, calculated on a 12-month trailing basis.<br />
6 Net debt at the end of the period divided by 12-month trailing EBITDA excluding restructuring costs.<br />
7 EBITDA as <strong>report</strong>ed, adjusted for payments in excess of expense for share-based compensation, restructuring initiatives and defined benefit plans, and deducting cash<br />
interest, cash income taxes, capital expenditures and payment for auctioned wireless spectrum (non-GAAP measure). In 2011, <strong>TELUS</strong> also deducted the Transactel gain<br />
of $17 million from EBITDA.<br />
8 Capital expenditures divided by Operating revenues.<br />
9 The sum of wireless subscribers, network access lines, Internet access subscribers and TV subscribers (<strong>TELUS</strong> Optik TV and <strong>TELUS</strong> Satellite TV).<br />
10 Includes net-cash settlement feature expense of $169 million in 2007.<br />
11 Excluding employees in <strong>TELUS</strong> International, total active employees were 28,000 in 2012, 27,800 in 2011, 26,400 in 2010, 27,700 in 2009, 28,700 in 2008, 27,500 in 2007<br />
and 27,100 in 2006. In 2009, <strong>TELUS</strong> acquired Black’s Photo, which added 1,250 total employees.<br />
12 EBITDA excluding restructuring costs, divided by average FTE employees. For 2007, EBITDA excluded the net-cash settlement feature expense of $169 million.<br />
Note: Certain comparative information has been restated to conform with the 2012 presentation.<br />
Net debt to EBITDA ratio 6<br />
Q4 12<br />
Q3 12<br />
Q2 12<br />
Q1 12<br />
Q4 11<br />
Q3 11<br />
Q2 11<br />
Q1 11<br />
1.6<br />
1.7<br />
1.8<br />
1.8<br />
1.8<br />
1.8<br />
1.9<br />
1.9<br />
Total customer connections (millions)<br />
Q4 12<br />
Q3 12<br />
Q2 12<br />
Q1 12<br />
Q4 11<br />
Q3 11<br />
Q2 11<br />
Q1 11<br />
Wireless Wireline<br />
12.4<br />
12.3<br />
13.1<br />
13.0<br />
12.8<br />
12.7<br />
12.7<br />
12.6<br />
<strong>TELUS</strong> 2012 ANNUAL REPORT . 37
Annual segmented statistics<br />
38 . <strong>TELUS</strong> 2012 ANNUAL REPORT<br />
After transition to IFRS 1 Prior to transition to IFRS<br />
2012 2011 2010 2010 2009 2008 2007 2006<br />
Wireless segment<br />
Operating revenues (millions) 2 Operating expenses before restructuring costs,<br />
$ß 5,886 $ß 5,500 $ß 5,045 $ß 5,047 $ß 4,735 $ß 4,660 $ß 4,291 $ß 3,881<br />
depreciation and amortization (millions) 3 3,406 3,312 3,021 3,012 2,790 2,647 2,384 2,122<br />
Restructuring costs (millions) 13 2 4 4 12 8 1 6<br />
EBITDA (millions) $ß 2,467 $ß 2,186 $ß 2,020 $ß 2,031 $ß 1,933 $ß 2,005 $ß 1,906 $ß 1,753<br />
EBITDA 4 excluding cost of acquisition (COA) (millions) $ß 3,138 $ß 2,880 $ß 2,618 $ß 2,629 $ß 2,472 $ß 2,587 $ß 2,495 $ß 2,286<br />
EBITDA margin4 41.9% 39.7% 40.0% 40.2% 40.8% 43.0% 45.0% 45.2%<br />
Capital expenditures (millions) $ß 711 $ß 508 $ß 463 $ß 463 $ß 770 $ß 548 $ß 551 $ß 427<br />
Payment for auctioned wireless spectrum (millions) – – – – – $ß 882 – –<br />
Cash flow (millions) 4,5 $ß 1,756 $ß 1,678 $ß 1,557 $ß 1,568 $ß 1,163 $ß 1,457 $ß 1,379 $ß 1,326<br />
Subscriber gross additions (000s) 1,646 1,798 1,710 1,710 1,599 1,655 1,434 1,293<br />
Subscriber net additions (000s) 331 369 447 447 406 561 515 535<br />
Subscribers (000s) 7,670 7,340 6,971 6,971 6,524 6,129 5,568 5,056<br />
Wireless market share, subscriber-based<br />
Average monthly revenue per<br />
28% 28% 28% 28% 28% 28% 27% 27%<br />
subscriber unit (ARPU) $ß 60 $ß 59 $ß 58 $ß 58 $ß 58 $ß 63 $ß 64 $ß 63<br />
Data ARPU<br />
Average minutes of use (MOU)<br />
$ß 24 $ß 20 $ß 14 $ß 14 $ß 12 $ß 10 $ß 7 $ß 5<br />
per subscriber per month 336 332 361 361 392 411 404 403<br />
COA, per gross subscriber addition $ß 408 $ß 386 $ß 350 $ß 350 $ß 337 $ß 351 $ß 395 $ß 412<br />
Monthly churn rate 1.47% 1.68% 1.57% 1.57% 1.58% 1.57% 1.45% 1.33%<br />
Population coverage – digital (millions) 6 Wireline segment<br />
34.7 34.4 33.8 33.8 33.1 32.6 31.6 31.0<br />
Operating revenues (millions) 2 Operating expenses before restructuring costs,<br />
$ß 5,246 $ß 5,099 $ß 4,935 $ß 4,920 $ß 5,033 $ß 5,152 $ß 4,924 $ß 4,921<br />
depreciation and amortization (millions) 3 3,706 3,474 3,229 3,238 3,297 3,327 3,222 2,997<br />
Restructuring costs (millions) 35 33 76 70 178 51 19 62<br />
EBITDA (millions) $ß 1,505 $ß 1,592 $ß 1,630 $ß 1,612 $ß 1,558 $ß 1,774 $ß 1,683 $ß 1,862<br />
EBITDA margin4 28.7% 31.2% 33.0% 32.8% 31.0% 34.4% 37.1% 37.8%<br />
Capital expenditures (millions) $ß 1,270 $ß 1,339 $ß 1,258 $ß 1,258 $ß 1,333 $ß 1,311 $ß 1,219 $ß 1,191<br />
Cash flow (millions) 4,5 $ß 235 $ß 253 $ß 372 $ß 354 $ß 225 $ß 463 $ß 609 $ß 671<br />
Network access lines (NALs) in service (000s) 3,406 3,593 3,739 3,739 3,966 4,176 4,333 4,548<br />
High-speed Internet subscribers (000s) 1,326 1,242 1,167 1,167 1,128 1,096 1,020 917<br />
Dial-up Internet subscribers (000s) 33 44 62 62 87 124 155 194<br />
Total TV subscribers (000s) 678 509 314 314 170 78 35 –<br />
Total wireless subscribers (000s)<br />
12<br />
11<br />
10<br />
09<br />
08<br />
07<br />
06<br />
06Postpaid Prepaid<br />
5,056<br />
6,129<br />
5,568<br />
6,524<br />
7,340<br />
6,971<br />
7,670<br />
Total wireline subscribers (000s)<br />
12<br />
11<br />
10<br />
09<br />
08<br />
07<br />
06<br />
06<br />
Internet subscribers TV subscribers NALs in service<br />
5,443<br />
5,388<br />
5,282<br />
5,351<br />
5,474<br />
5,543<br />
5,659
Quarterly segmented statistics<br />
Q4 2012 Q3 2012 Q2 2012 Q1 2012 Q4 2011 Q3 2011 Q2 2011 Q1 2011<br />
Wireless segment<br />
Operating revenues (millions) 2 Operating expenses before restructuring costs,<br />
$ß1,544 $ß1,511 $ß1,438 $ß1,393 $ß1,433 $ß1,407 $ß1,343 $ß1,317<br />
depreciation and amortization (millions) 971 870 798 767 933 836 777 766<br />
Restructuring costs (millions) 4 1 4 4 – 1 1 –<br />
EBITDA (millions) $ß 569 $ß 640 $ß 636 $ß 622 $ß 500 $ß 570 $ß 565 $ß 551<br />
EBITDA excluding COA (millions) $ß 775 $ß 815 $ß 795 $ß 753 $ß 707 $ß 757 $ß 730 $ß 686<br />
EBITDA margin 36.9% 42.4% 44.2% 44.7% 34.9% 40.5% 42.1% 41.8%<br />
Capital expenditures (millions) $ß 191 $ß 175 $ß 194 $ß 151 $ß 168 $ß 157 $ß 107 $ß 76<br />
Payment for auctioned wireless spectrum (millions) – – – – – – – –<br />
Cash flow (millions) 5 $ß 378 $ß 465 $ß 442 $ß 471 $ß 332 $ß 413 $ß 458 $ß 475<br />
Subscriber gross additions (000s) 455 434 394 363 491 472 447 388<br />
Subscriber net additions (000s) 112 111 86 22 129 114 94 32<br />
Subscribers (000s) 7,670 7,558 7,447 7,362 7,340 7,211 7,097 7,003<br />
Wireless market share, subscriber-based 28% 27% 28% 28% 28% 28% 28% 28%<br />
ARPU $ß 61 $ß 61 $ß 60 $ß 59 $ß 59 $ß 61 $ß 59 $ß 58<br />
Data ARPU $ß 25 $ß 25 $ß 23 $ß 23 $ß 22 $ß 21 $ß 19 $ß 18<br />
Average MOU per subscriber per month 341 338 341 324 334 332 337 324<br />
COA, per gross subscriber addition $ß 453 $ß 402 $ß 404 $ß 362 $ß 421 $ß 397 $ß 370 $ß 348<br />
Monthly churn rate 1.51% 1.44% 1.39% 1.55% 1.67% 1.67% 1.67% 1.70%<br />
Population coverage – digital (millions) 6 Wireline segment<br />
34.7 34.7 34.7 34.4 34.4 34.3 34.1 33.8<br />
Operating revenues (millions) 2 Operating expenses before restructuring costs,<br />
$ß1,361 $ß1,316 $ß1,280 $ß1,289 $ß1,308 $ß1,267 $ß1,261 $ß1,263<br />
depreciation and amortization (millions) 968 936 909 893 918 867 865 824<br />
Restructuring costs (millions) 15 2 9 9 16 2 11 4<br />
EBITDA (millions) $ß 378 $ß 378 $ß 362 $ß 387 $ß 374 $ß 398 $ß 385 $ß 435<br />
EBITDA margin 27.8% 28.7% 28.3% 30.0% 28.6% 31.4% 30.5% 34.4%<br />
Capital expenditures (millions) $ß 330 $ß 296 $ß 354 $ß 290 $ß 344 $ß 313 $ß 349 $ß 333<br />
Cash flow (millions) 5 $ß 48 $ß 82 $ß 8 $ß 97 $ß 30 $ß 85 $ß 36 $ß 102<br />
NALs in service (000s) 3,406 3,448 3,487 3,536 3,593 3,641 3,684 3,708<br />
High-speed Internet subscribers (000s) 1,326 1,303 1,277 1,257 1,242 1,218 1,196 1,183<br />
Dial-up Internet subscribers (000s) 33 35 38 41 44 48 51 56<br />
Total TV subscribers (000s) 678 637 595 553 509 453 403 358<br />
1 IFRS as issued by the IASB. The Company’s date of transition to IFRS-IASB was January 1, 2010 and its date of adoption was January 1, 2011.<br />
2 Includes intersegment revenue.<br />
3 In 2007, <strong>TELUS</strong> introduced a net-cash settlement feature for share option awards granted prior to 2005, which resulted in an incremental pre-tax charge of $24 million<br />
for that year for the wireless segment and $145 million for the wireline segment.<br />
4 EBITDA for 2007 excludes the net-cash settlement feature expense of $24 million for the wireless segment and $145 million for the wireline segment.<br />
5 EBITDA less capital expenditures.<br />
6 Includes expanded coverage resulting from roaming/resale and network sharing agreements principally with Bell Canada.<br />
Note: Certain comparative information has been restated to conform with the 2012 presentation.<br />
<strong>TELUS</strong> 2012 ANNUAL REPORT . 39
Management’s discussion and analysis<br />
Caution regarding forward-looking statements<br />
This document contains forward-looking statements about expected future<br />
events and financial and operating performance of <strong>TELUS</strong> Corporation. The<br />
terms <strong>TELUS</strong>, the Company, “we,” “us” or “our” refer to <strong>TELUS</strong> Corporation<br />
and where the context of the narrative permits or requires, its subsidiaries.<br />
By their nature, forward-looking statements are subject to inherent risks and<br />
uncertainties, and require us to make assumptions. There is significant risk that<br />
assumptions, predictions and other forward-looking statements will not prove<br />
to be accurate. Readers are cautioned not to place undue reliance on forwardlooking<br />
statements as a number of factors could cause future performance,<br />
conditions, actions or events to differ materially from the targets, expectations,<br />
estimates or intentions expressed. Except as required by law, we disclaim any<br />
intention or obligation to update or revise any forward-looking statements,<br />
and reserve the right to change, at any time at our sole discretion, our current<br />
practice of updating <strong>annual</strong> targets and guidance. Annual targets for 2013 and<br />
related assumptions are described in Sections 1.4 and 1.5. Factors that could<br />
cause actual performance to differ materially include, but are not limited to:<br />
. Competition including: continued intense competitive rivalry across all<br />
services among established telecommunications companies, advanced<br />
wireless services (AWS) entrants, cable-TV providers, other communications<br />
companies and emerging over-the-top (OTT) services; active price<br />
and brand competition; our ability to offer an enhanced customer service<br />
experience; industry growth rates including wireless penetration gain;<br />
network access line losses; subscriber additions and subscriber retention<br />
experience for wireless, <strong>TELUS</strong> TV ® and <strong>TELUS</strong> high-speed Internet services;<br />
costs of subscriber acquisition and retention; pressures on wireless<br />
average revenue per subscriber unit per month (ARPU) such as through<br />
flat-rate pricing trends for voice and data, inclusive long distance plans<br />
for voice, and increasing availability of Wi-Fi networks for data; levels of<br />
smartphone sales and associated subsidy levels; and ability to obtain and<br />
offer data content across multiple devices on wireless and TV platforms.<br />
. Technological substitution including: reduced utilization and increased<br />
commoditization of traditional wireline voice local and long distance<br />
services; increasing numbers of households that have only wireless telephone<br />
services; continuation of wireless voice ARPU declines such as<br />
through substitution to messaging and OTT applications like Skype; and<br />
OTT IP services that may cannibalize TV and entertainment services.<br />
. Technology including: subscriber demand for data that could challenge<br />
wireless network and spectrum capacity, and service levels; reliance on<br />
systems and information technology; broadband and wireless technology<br />
options, evolution paths and roll-out plans; reliance on wireless network<br />
access agreements; choice of suppliers and suppliers’ ability to maintain<br />
and service their product lines; wireless handset supplier concentration<br />
and market power; the expected benefits and performance of long-term<br />
evolution (LTE) wireless technology; dependence of rural LTE roll-out<br />
strategy on ability to acquire spectrum in the 700 MHz band; successful<br />
deployment and operation of new wireless networks and successful<br />
introduction of new products, new services and supporting systems;<br />
network reliability and change management (including risk of migration<br />
to new, more efficient Internet data centres (IDCs) and realizing the<br />
expected benefits); timing of future decommissioning of iDEN and CDMA<br />
wireless networks to redeploy spectrum and reduce operating costs,<br />
and the associated subscriber migration and retention risks; and successful<br />
upgrades and evolution of <strong>TELUS</strong> TV technology, which depends<br />
on third-party suppliers.<br />
. Economic growth and fluctuations including: the strength and persistence<br />
of economic growth in Canada that may be influenced by economic<br />
developments in the United States, Europe, Asia and elsewhere; future<br />
interest rates; and pension investment returns and funding.<br />
. Capital expenditure and spectrum licence expenditure levels in<br />
2013 and beyond due to our wireless deployment strategy for LTE and<br />
future technologies, wireline broadband initiatives, new IDC initiatives,<br />
and Industry Canada wireless spectrum auctions, including auction of<br />
spectrum in the 700 MHz band expected in the second half of 2013<br />
and the 2,500–2,690 MHz bands expected in 2014.<br />
40 . <strong>TELUS</strong> 2012 ANNUAL REPORT<br />
. Financing and debt requirements including ability to carry out<br />
refinancing activities.<br />
. Ability to sustain growth objectives through 2013 including: dividend<br />
growth of circa 10% per annum and CEO goals of generating low doubledigit<br />
percentage <strong>annual</strong>ized growth in earnings per share (EPS) and<br />
greater growth in free cash flow, excluding spectrum costs. The growth<br />
objectives may be affected by factors such as regulatory and government<br />
developments and decisions, competitive environment, reasonable<br />
economic performance in Canada, and capital expenditure and spectrum<br />
auction requirements. The growth objectives are not necessarily indicative<br />
of earnings, dividends and free cash flow beyond 2013. There can be no<br />
assurance that we will initiate a normal course issuer bid in 2013 or that<br />
we will maintain a dividend growth model after 2013.<br />
. Regulatory approvals and developments including: future spectrum<br />
auctions and rules for the 700 MHz and 2,500–2,690 MHz bands<br />
(including the amount and cost of spectrum acquired) or other spectrum<br />
purchases; whether application and ongoing enforcement of new regulatory<br />
safeguards regarding vertical integration by competitors into<br />
broadcast content ownership prove to be effective; compliance with<br />
restrictions on non-Canadian ownership of <strong>TELUS</strong> Common Shares;<br />
developments and changes in foreign ownership levels of <strong>TELUS</strong>;<br />
increased foreign control of certain AWS wireless entrants; interpretation<br />
and application of tower sharing and roaming rules; and amendments<br />
to consumer protection legislation by several provinces and a new<br />
Canadian Radio-television and Telecommunications Commission (CRTC)<br />
proceeding to establish a mandatory code and clarity for consumers<br />
in respect of terms and conditions of wireless services, where nonharmonized<br />
provincial rules create risk of significant compliance costs.<br />
. Human resource matters including employee retention and recruitment.<br />
. Ability to successfully implement cost reduction initiatives and realize<br />
expected savings net of restructuring costs, such as from business<br />
integrations, business process outsourcing, internal offshoring and reorganizations,<br />
procurement initiatives and administrative office consolidation,<br />
without losing customer service focus or negatively impacting client care.<br />
. Process risks including: reliance on legacy systems and ability to implement<br />
and support new products and services; implementation of large<br />
enterprise deals that may be adversely impacted by available resources<br />
and degree of co-operation from other service providers; and real estate<br />
joint venture development risks.<br />
. Tax matters including: a general tendency by tax collection authorities to<br />
adopt more aggressive auditing practices; possible higher than currently<br />
forecast corporate income tax rates in the future; the Canadian federal<br />
government’s enacted policy change that eliminates the ability to defer<br />
income taxes through the use of different tax year-ends for operating partnerships<br />
and corporate partners, which is expected to increase income tax<br />
payments commencing in 2014; costs and complexity of complying with<br />
the Province of British Columbia’s reversal of its harmonized sales tax back<br />
to a sepa rate provincial sales tax and federal goods and services tax, as<br />
well as the Province of Quebec’s sales tax harmonization; and international<br />
tax complexity and compliance.<br />
. Business continuity events including: human-caused threats such as<br />
electronic attacks and human errors; equipment failures; supply chain<br />
disruptions; natural disaster threats; and effectiveness of business<br />
continuity and disaster recovery plans and responses.<br />
. Acquisitions or divestitures including realizing expected strategic benefits.<br />
. Health, safety and environmental developments; Litigation and legal<br />
matters; and other risk factors discussed herein and listed from time to<br />
time in our <strong>report</strong>s and public disclosure documents including our <strong>annual</strong><br />
<strong>report</strong>, <strong>annual</strong> information form, and other filings with securities commissions<br />
in Canada (on SEDAR at sedar.com) and in our filings in the United<br />
States, including Form 40-F (on EDGAR at sec.gov). For further information,<br />
see Section 10: Risks and risk management.
MANAGEMENT’S DISCUSSION & ANALYSIS<br />
February 27, 2013<br />
The following sections are a discussion of the consolidated financial position and financial performance of<br />
<strong>TELUS</strong> Corporation for the year ended December 31, 2012, and should be read together with <strong>TELUS</strong>’ audited<br />
Consolidated financial statements dated December 31, 2012 (subsequently referred to as the Consolidated<br />
financial statements). This discussion contains forward-looking information qualified by reference to, and should<br />
be read together with, the Caution regarding forward-looking statements.<br />
The generally accepted accounting principles (GAAP) we use are<br />
International Financial Reporting Standards (IFRS) as issued by the<br />
International Accounting Standards Board (IASB) in compliance<br />
Management’s discussion and analysis contents<br />
with Canadian GAAP. The terms IFRS-IASB and IFRS used subsequently<br />
in this document refer to these standards. All amounts are in Canadian<br />
dollars unless otherwise specified.<br />
Section Page Section Page<br />
1 Introduction<br />
A summary of <strong>TELUS</strong>’ consolidated results,<br />
performance against our 2012 targets<br />
and presentation of our 2013 targets<br />
2 Core<br />
business and strategy<br />
A discussion of our core business<br />
and strategy, including examples of<br />
activities in support of our six<br />
strategic imperatives<br />
3<br />
Key performance drivers<br />
A <strong>report</strong> on our 2012 corporate priorities<br />
and an outline of our 2013 priorities<br />
4 Capabilities<br />
Factors that affect our capability to execute<br />
strategies, manage key performance drivers<br />
and deliver results<br />
5 Discussion<br />
6 Changes<br />
of operations<br />
A discussion of consolidated and segmented<br />
operating performance<br />
in financial position<br />
A discussion of changes in the Consolidated<br />
statements of financial position for the year<br />
ended December 31, 2012<br />
42<br />
50<br />
52<br />
54<br />
59<br />
68<br />
7 Liquidity<br />
8 Critical<br />
9 General<br />
10<br />
11<br />
and capital resources<br />
A discussion of operating cash flows,<br />
investing and financing activities,<br />
as well as liquidity, credit facilities<br />
and other disclosures<br />
accounting estimates and<br />
accounting policy developments<br />
Accounting estimates that are critical<br />
to determining financial results and<br />
effects in 2013 of applying amended<br />
and new accounting standards<br />
outlook<br />
Trends and expectations for the<br />
telecommunications industry<br />
Risks and risk management<br />
Risks and uncertainties facing us<br />
and how we manage these risks<br />
Definitions and reconciliations<br />
Definitions of operating, liquidity and<br />
capital resource measures, including<br />
calculation and reconciliation of<br />
certain non-GAAP measures that<br />
we use<br />
70<br />
78<br />
83<br />
86<br />
104<br />
<strong>TELUS</strong> 2012 ANNUAL REPORT . 41
1<br />
Introduction<br />
A summary of <strong>TELUS</strong>’ consolidated results, performance against our 2012 targets<br />
and presentation of our 2013 targets<br />
Our discussion in this section is qualified in its entirety by the Caution<br />
regarding forward-looking statements at the beginning of Management’s<br />
discussion and analysis (MD&A).<br />
1.1 Preparation of the MD&A<br />
Our disclosure controls and procedures are designed to provide<br />
reasonable assurance that all relevant information is gathered and<br />
<strong>report</strong>ed to senior management on a timely basis, so that appropriate<br />
decisions can be made regarding public disclosure. We determine<br />
whether or not information is material based on whether we believe<br />
a reasonable investor’s decision to buy, sell or hold <strong>TELUS</strong> securities<br />
would likely be influenced or changed if the information were omitted<br />
or misstated. The MD&A and the Consolidated financial statements<br />
were reviewed by <strong>TELUS</strong>’ Audit Committee and approved by <strong>TELUS</strong>’<br />
Board of Directors.<br />
We have issued guidance on, and <strong>report</strong> on, certain non-GAAP<br />
measures used to evaluate the performance of <strong>TELUS</strong> and its segments.<br />
Non-GAAP measures are also used to determine compliance with debt<br />
covenants and to manage the capital structure. As non-GAAP measures<br />
do not generally have a standardized meaning, securities regulations<br />
require such measures to be clearly defined, qualified and reconciled<br />
with their nearest GAAP measure (see Section 11). The term EBITDA<br />
(earnings before interest, taxes, depreciation and amortization) used in<br />
this document means standardized EBITDA as defined by the Canadian<br />
Performance Reporting Board of the Canadian Institute of Chartered<br />
Accountants (CICA). Adjusted EBITDA used in this document deducts<br />
from standardized EBITDA items of an unusual nature that do not reflect<br />
our ongoing operations. See Section 11.1 for the definition, calculation<br />
and reconciliation of EBITDA.<br />
42 . <strong>TELUS</strong> 2012 ANNUAL REPORT<br />
1.2 Canada’s economy and telecommunications industry<br />
Economic environment<br />
We estimate economic growth in Canada was 1.9% in 2012 (2.5% in<br />
2011) and the Bank of Canada’s January 2013 Monetary Policy Report<br />
projected growth of 2.0% in 2013 and 2.7% in 2014. In addition, Statistics<br />
Canada’s Labour Force Survey <strong>report</strong>ed the December 2012 national<br />
unemployment rate was the lowest in four years at 7.1%, down from 7.5%<br />
in December 2011. (See Section 10.11 Economic growth and fluctuations.)<br />
Telecommunications industry<br />
We estimate that growth in Canadian telecommunications industry<br />
revenue (including TV revenue and excluding media revenue) was<br />
approximately 3% in 2012 (3% in 2011), driven by continued wireless<br />
sector growth. (See Section 9: General outlook.)<br />
In addition, based on publicly <strong>report</strong>ed competitors’ results,<br />
we estimate Canadian wireless industry revenue and EBITDA growth<br />
in 2012 to be approximately 5% and 8%, respectively, as compared<br />
to revenue and EBITDA growth in 2011 of 4.5% and 2%, respectively.<br />
Increased competitive intensity from established national competitors<br />
and AWS entrants, as well as new smartphones and tablets, attracted<br />
more than 1.2 million new industry subscribers in 2012, or an increase<br />
in penetration of approximately 2.6 percentage points to 80% of<br />
the population. The wireless penetration rate in Canada is expected to<br />
increase further in 2013 by between two and three percentage points.<br />
We expect the Canadian wireline sector to continue to face pressure<br />
on legacy voice services from strong competitive intensity and technological<br />
substitution to growing data and wireless services. Growth<br />
opportunities remain for <strong>TELUS</strong> in wireline data, including Internet,<br />
IP-based TV and entertainment services, health solutions and business<br />
process outsourcing services.
1.3 Consolidated highlights<br />
Highlights<br />
Years ended December 31<br />
($ millions, unless noted otherwise) 2012 2011 Change<br />
Consolidated statements of income<br />
Operating revenues 10,921 10,397 5.0%<br />
Operating income 2,107 1,968 7.1%<br />
Income before income taxes 1,775 1,591 11.6%<br />
Net income 1,318 1,215 8.5%<br />
Net income per share (1)<br />
Basic (basic EPS) ($) 4.05 3.76 7.7%<br />
Diluted ($) 4.03 3.74 7.8%<br />
Cash dividends declared per share (1) ($) 2.44 2.205 10.7%<br />
Basic weighted-average shares (1)<br />
outstanding (millions) 326 324 0.4%<br />
Consolidated statements of cash flows<br />
Cash provided by operating activities 3,219 2,550 26.2%<br />
Cash used by investing activities 2,058 1,968 4.6%<br />
Capital expenditures (2) 1,981 1,847 7.3%<br />
Cash used by financing activities 1,100 553 98.9%<br />
Other highlights<br />
Subscriber connections (3) (thousands) 13,113 12,728 3.0%<br />
EBITDA (4) 3,972 3,778 5.1%<br />
Adjusted EBITDA (4)(5) 3,965 3,761 5.4%<br />
Adjusted EBITDA margin (6) (%) 36.3 36.2 0.1 pts.<br />
Free cash flow (4) 1,331 997 33.5%<br />
Net debt to EBITDA – excluding<br />
restructuring costs (4) (times) 1.6 1.8 (0.2)<br />
Notations used in MD&A: n/a – Not applicable; n/m – Not meaningful;<br />
pts. – Percentage points.<br />
(1) Common Shares and Non-Voting Shares.<br />
(2) Capital expenditures exclude changes in associated non-cash investing working<br />
capital, and consequently differ from cash payments for capital assets on the<br />
Consolidated statements of cash flows.<br />
(3) The sum of wireless subscribers, network access lines (NALs), Internet access<br />
subscribers and <strong>TELUS</strong> TV subscribers (Optik TV TM subscribers and <strong>TELUS</strong><br />
Satellite TV ® subscribers), measured at the end of the respective periods based<br />
on information in billing and other systems.<br />
(4) Non-GAAP measures. See Section 11.1 EBITDA, Section 11.2 Free cash flow and<br />
Section 11.4 Definitions of liquidity and capital resource measures.<br />
(5) Adjusted EBITDA for 2012 excludes equity losses of $2 million for the <strong>TELUS</strong> Garden<br />
residential real estate partnership and a $9 million pre-tax gain on land contributed<br />
to the residential partnership. We do not plan to retain an ownership interest in this<br />
residential partnership after completion of construction. Adjusted EBITDA for 2011<br />
excludes a $17 million non-cash gain on Transactel (Barbados) Inc. that resulted from<br />
re-measurement of our 51% interest in Transactel at fair value when we exercised<br />
our purchased call option and asserted control.<br />
(6) EBITDA margin is EBITDA divided by Operating revenues. The calculation of Adjusted<br />
EBITDA margin for 2012 excludes equity losses for the <strong>TELUS</strong> Garden residential<br />
real estate partnership and the gain on contributed land from both EBITDA and<br />
Operating revenues. The calculation of Adjusted EBITDA margin for 2011 excludes<br />
the non-cash gain on Transactel from both EBITDA and Operating revenues.<br />
MANAGEMENT’S DISCUSSION & ANALYSIS: 1<br />
Operating highlights<br />
. Operating revenues increased by $524 million in 2012.<br />
Service and equipment revenues increased by $527 million<br />
or 5.1% in 2012, mainly due to growth in wireless network revenue<br />
reflecting subscriber and ARPU growth, as well as wireline data<br />
revenue growth, which exceeded declines in legacy voice revenues.<br />
Growth in wireline data revenue resulted primarily from Optik TV,<br />
enhanced data and Internet services, data equipment sales and<br />
managed workplace services.<br />
Other operating income decreased by $3 million in 2012.<br />
A $9 million gain on land contributed to the <strong>TELUS</strong> Garden residential<br />
real estate partnership in 2012 and increased drawdowns<br />
from the regulatory price cap deferral account for provisioning<br />
broadband Internet service to a number of qualifying rural and remote<br />
communities were more than offset by the $17 million non-cash<br />
re-measurement gain on Transactel (Barbados) Inc. in 2011.<br />
. Subscriber connections increased by 385,000 in 2012, reflecting 4.5%<br />
growth in wireless subscribers, 33% growth in <strong>TELUS</strong> TV sub scribers<br />
and 5.7% growth in total Internet subscriptions, partly offset by a<br />
5.2% decline in total network access lines (NALs). Wireless net subscriber<br />
additions were 331,000 in 2012, while <strong>TELUS</strong> TV and <strong>TELUS</strong><br />
high-speed Internet subscriber net additions totalled 253,000 in 2012.<br />
Wireless monthly blended ARPU was $60.39 in 2012, up $1.29<br />
or 2.2% from 2011. The increase reflects 21% growth in data ARPU<br />
resulting from increased use of data services, greater penetration<br />
by smartphones and increased roaming, partly offset by lower voice<br />
pricing. Quarterly blended ARPU has increased year over year for<br />
nine consecutive quarters.<br />
The wireless postpaid subscriber monthly churn rate was 1.09%<br />
in 2012, down 0.22 percentage points from 2011. Improvement in the<br />
churn rate can be attributed to our customer-first initiatives, retention<br />
efforts, and higher prior-year levels of churn resulting from the loss<br />
of a federal government wireless service contract to a low-priced bid<br />
from an established competitor.<br />
. Operating income increased by $139 million in 2012, reflecting an<br />
increase of $194 million in EBITDA, which was partly offset by higher<br />
total depreciation and amortization expenses. Wireless EBITDA<br />
increased by $281 million, mainly due to growth in network revenue<br />
and a 2.3 percentage point increase in network revenue flow through<br />
to EBITDA. Wireline EBITDA decreased by $87 million as growth in<br />
wireline data services was more than offset by higher content and<br />
support costs for the growing Optik TV service and ongoing declines<br />
in higher-margin legacy voice services. Notably, wireline EBITDA<br />
increased year over year by $4 million in the fourth quarter due to<br />
higher margins on <strong>TELUS</strong> high-speed Internet and Optik TV.<br />
Adjusted EBITDA increased by $204 million in 2012, while<br />
the adjusted EBITDA margin increased slightly from 2011, as<br />
a 2.2 percentage point increase in the wireless margin was offset<br />
by a 2.4 percentage point decline in the wireline margin.<br />
. Income before income taxes increased by $184 million in 2012,<br />
reflecting growth in EBITDA and a decrease in financing costs, partly<br />
offset by higher total depreciation and amortization expenses.<br />
. Income taxes increased by $81 million in 2012, mainly due to 12%<br />
growth in pre-tax income and the effects of income tax revaluations<br />
and adjustments, partly offset by decreasing blended statutory<br />
income tax rates.<br />
<strong>TELUS</strong> 2012 ANNUAL REPORT . 43
. Net income increased by $103 million or 8.5% in 2012. Excluding<br />
income tax-related adjustments, the gain net of equity losses for the<br />
residential real estate redevelopment partnership and the 2011 gain<br />
on Transactel, Net income increased by 10%.<br />
Analysis of Net income<br />
Years ended December 31 ($ millions) 2012 2011 Change<br />
Net income<br />
Deduct after-tax gain net of equity<br />
losses related to the <strong>TELUS</strong><br />
1,318 1,215 103<br />
Garden residential partnership (6) – (6)<br />
Deduct after-tax Transactel gain<br />
Deduct net favourable income<br />
tax-related adjustments,<br />
including any related interest<br />
– (12) 12<br />
income (see Section 5.2) (12) (21) 9<br />
Net income before above items 1,300 1,182 118<br />
. Basic EPS increased by 29 cents or 7.7% in 2012. Excluding income<br />
tax-related adjustments, the gain net of equity losses for the residential<br />
real estate redevelopment project and the 2011 gain on Transactel,<br />
basic EPS increased by 9.0%.<br />
Analysis of basic EPS<br />
Years ended December 31 ($) 2012 2011 Change<br />
Basic EPS<br />
Deduct after-tax gain net of equity<br />
losses related to the <strong>TELUS</strong><br />
Garden residential real estate<br />
4.05 3.76 0.29<br />
partnership, per share<br />
Deduct after-tax Transactel gain<br />
(0.02) – (0.02)<br />
per share<br />
Deduct net favourable income<br />
tax-related adjustments<br />
– (0.04) 0.04<br />
per share (see Section 5.2) (0.04) (0.06) 0.02<br />
Basic EPS before above items 3.99 3.66 0.33<br />
. Cash dividends declared per share totalled $2.44 in 2012, up<br />
10.7% from 2011. On February 13, 2013, the Board of Directors<br />
declared a quarterly dividend of 64 cents per share on the issued<br />
and outstanding Common Shares of the Company, payable on<br />
April 1, 2013, to shareholders of record at the close of business on<br />
March 11, 2013. The 64 cent per share dividend declared for the first<br />
quarter of 2013 reflects an increase of six cents or 10.3% from the<br />
first quarter dividend paid in April 2012, consistent with our dividend<br />
growth policy described in Section 4.3.<br />
Share exchange<br />
On February 21, 2012, we announced that holders of <strong>TELUS</strong> Common<br />
Shares and Non-Voting Shares would have the opportunity to decide<br />
whether to eliminate the Non-Voting Share class at our <strong>annual</strong> and special<br />
meeting to be held May 9, 2012. In the face of the opposition of New Yorkbased<br />
hedge fund manager Mason Capital Management LLC (Mason), we<br />
withdrew the plan on May 8, 2012, and announced that we intended to<br />
reintroduce a new proposal in due course. We announced the new share<br />
exchange proposal on August 21, 2012, which involved an interim courtapproved<br />
plan of arrangement that provided for a one-time exchange<br />
of all the issued and outstanding <strong>TELUS</strong> Non-Voting Shares for <strong>TELUS</strong><br />
44 . <strong>TELUS</strong> 2012 ANNUAL REPORT<br />
Common Shares on a one-for-one basis. Approval of the new proposal<br />
would be subject to a simple majority of the votes cast by the holders of<br />
<strong>TELUS</strong> Common Shares and a two-thirds majority of the votes cast by the<br />
holders of <strong>TELUS</strong> Non-Voting Shares, each voting separately as a class.<br />
On August 2, 2012, Mason delivered a requisition and four resolutions<br />
to <strong>TELUS</strong> in respect of a general meeting of shareholders to establish<br />
conditions under which any future share conversion could be completed.<br />
On October 15, 2012, <strong>TELUS</strong> obtained an order from the Supreme Court<br />
of British Columbia directing that the meeting to consider <strong>TELUS</strong>’ new<br />
proposal and Mason’s meeting to consider its business proceed jointly on<br />
October 17, 2012. At the joint meeting, the <strong>TELUS</strong> plan of arrangement<br />
obtained the required shareholder approvals, while the Mason resolutions<br />
were not approved.<br />
After a hearing in November, on December 18, 2012, the Supreme<br />
Court of British Columbia gave final approval of the share exchange<br />
proposal and dismissed all appeals raised by Mason. Subsequently,<br />
Mason filed notice with the Court of Appeal of British Columbia and<br />
obtained a stay preventing completion of the plan of arrangement.<br />
On January 25, 2013, <strong>TELUS</strong> and Mason agreed to abandon all litigation,<br />
allowing the share exchange to be completed effective February 4, 2013.<br />
The agreement did not involve the payment of funds to either party.<br />
Liquidity and capital resource highlights<br />
. We had unutilized credit facilities of $1.8 billion at December 31, 2012,<br />
as well as $100 million availability under our trade receivables securitization<br />
program, consistent with our objective of generally maintaining<br />
more than $1 billion of unutilized liquidity.<br />
. Net debt to EBITDA – excluding restructuring costs was 1.6 times<br />
at December 31, 2012, down from 1.8 times at December 31, 2011.<br />
The ratio remains within our long-term target policy range of 1.5 to<br />
2.0 times.<br />
. Cash provided by operating activities increased by $669 million<br />
in 2012. The increase was mainly due to growth in adjusted EBITDA,<br />
comparative working capital changes, a reduction in discretionary<br />
employer contributions to defined benefit plans, the absence in 2012<br />
of the one-time mandated regulatory rebates to residential subscribers<br />
made in 2011, and decreases in net restructuring payments and net<br />
interest payments.<br />
. Cash used by investing activities increased by $90 million in<br />
2012. The increase resulted mainly from $134 million higher capital<br />
expenditures, including investments in our wireless LTE network<br />
and two state-of-the-art intelligent IDCs, partly offset by reductions<br />
in the amounts for acquisitions and related investments.<br />
. Cash used by financing activities increased by $547 million in<br />
2012, mainly due to a reduction in long-term debt and an increase<br />
in dividends. The increase in dividend payments reflected a dividend<br />
rate that is more than 10% higher and a slightly larger number of<br />
shares outstanding, as well as a change to purchasing shares in the<br />
open market rather than issuing shares from treasury for reinvested<br />
dividends after March 1, 2011. These increases were partially offset<br />
by the acquisition in the second quarter of 2011 of an additional<br />
equity interest in Transactel (Barbados) Inc.<br />
. Free cash flow increased by $334 million or 34% in 2012, mainly<br />
due to growth in EBITDA and a reduction in contributions to defined<br />
benefit plans, as well as decreases in restructuring, interest and<br />
share-based compensation payments, partly offset by higher capital<br />
expenditures.
1.4 Performance scorecard (key performance measures)<br />
We achieved three of four original consolidated targets and achieved or<br />
exceeded all four original 2012 segment targets, which were announced<br />
on December 16, 2011. We achieved our revenue targets due to strong<br />
growth in wireless network revenues and wireline data revenues. We met<br />
the target for consolidated EBITDA and exceeded the target for wireless<br />
EBITDA due to a 2.3 percentage point increase in flow through of wireless<br />
network revenues to EBITDA. Wireline revenue was near the top end of<br />
the target range, while EBITDA was in the low end of the target range, as<br />
growth in data services was offset by ongoing declines in higher-margin<br />
legacy voice services. We did not meet our target for consolidated capital<br />
expenditures due to higher expenditures for sustaining and growing our<br />
networks, and investments to support customer growth.<br />
Our financial objectives, policies and guidelines include generally<br />
maintaining a minimum of $1 billion of unutilized liquidity, a Net debt to<br />
EBITDA – excluding restructuring costs ratio in the range of 1.5 to<br />
2.0 times, and a dividend payout ratio guideline. Under the dividend<br />
growth model, and subject to the Board of Directors’ assessment and<br />
determination, we plan to continue with two dividend increases per<br />
MANAGEMENT’S DISCUSSION & ANALYSIS: 1<br />
year through 2013, which would on an <strong>annual</strong> basis provide an increase<br />
of circa 10%. The dividend growth model is not necessarily indicative<br />
of dividends declared beyond 2013. The Board of Directors has approved<br />
a 10 percentage point increase in the dividend payout ratio guideline to a<br />
range of 65 to 75% of sustainable net earnings on a prospective basis for<br />
dividends declared in 2013 onward. The change results from the noncash<br />
effects of applying in 2013 the amended accounting standard IAS 19<br />
Employee benefits (2011), including reductions of EBITDA, Net income<br />
and EPS (see Section 8.2 Accounting policy developments).<br />
The following Scorecard compares <strong>TELUS</strong>’ performance to our<br />
original 2012 targets and also presents our 2013 targets. These targets<br />
are prior to application of IAS 19 Employee benefits (2011). See<br />
Section 1.5 Financial and operating targets for 2013 for the targets<br />
after application of IAS 19 Employee benefits (2011) announced<br />
on February 15, 2013, in our 2012 fourth quarter results news release<br />
and accompanying investor conference call and webcast. Section 1.5<br />
also has our assumptions. Our 2013 targets and assumptions are<br />
fully qualified by the Caution regarding forward-looking statements<br />
at the beginning of the MD&A.<br />
Scorecard<br />
Prior to application<br />
2012 performance<br />
of amended IAS 19 Actual results and growth Original targets and growth Result 2013 targets and growth<br />
Consolidated<br />
Revenues (1) $10.921 billion $10.7 to $11.0 billion ✓ $11.4 to $11.6 billion<br />
5.0% 3 to 6% 4 to 6%<br />
EBITDA (1)(2)(3) $3.972 billion $3.8 to $4.0 billion ✓ $4.075 to $4.275 billion<br />
5.1% 1 to 6% 3 to 8%<br />
Basic EPS (3) $4.05 $3.75 to $4.15 ✓ $4.20 to $4.60<br />
7.7% 0 to 10% 4 to 14%<br />
Capital expenditures (1)(4) Wireless segment<br />
$1.981 billion<br />
7.3%<br />
Approx. $1.85 billion ✗ Approx. $1.95 billion<br />
Revenue (external) $5.845 billion $5.75 to $5.9 billion ✓ $6.2 to $6.3 billion<br />
7.0% 5 to 8% 6 to 8%<br />
EBITDA (1)(3) $2.467 billion $2.3 to $2.4 billion ✓✓ $2.575 to $2.675 billion<br />
Wireline segment<br />
12.9% 5 to 10% 4 to 8%<br />
Revenue (external) (1) $5.076 billion $4.95 to $5.1 billion ✓ $5.2 to $5.3 billion<br />
2.9% 0 to 3% 2 to 4%<br />
EBITDA (1)(3) $1.505 billion $1.5 to $1.6 billion ✓ $1.5 to $1.6 billion<br />
(5.5)% (6) to 1% flat to 6%<br />
(1) On August 3, 2012, we revised full-year guidance for 2012 to: consolidated revenues of $10.75 to $11.05 billion ✓✓ Exceeded target<br />
(3 to 6% increase over 2011); consolidated EBITDA of $3.9 to $4.05 billion (3 to 7% increase over 2011); ✓ Met target<br />
consolidated capital expenditures of approximately $1.95 billion (6% increase over 2011); wireless EBITDA ✗ Missed target<br />
of $2.4 to $2.5 billion (10 to 14% increase over 2011); wireline revenue of $5.0 to $5.15 billion (1 to 4% increase<br />
over 2011); and wireline EBITDA of $1.5 to $1.55 billion (6 to 3% decrease over 2011), while the original<br />
targets for basic EPS and wireless revenues were reaffirmed. We achieved the revised guidance, except<br />
for capital expenditures.<br />
(2) EBITDA is a non-GAAP measure. See definition in Section 11.1.<br />
(3) Prior to application of the amended accounting standard IAS 19 Employee benefits (2011) in fiscal 2013<br />
with required retrospective application to prior periods.<br />
(4) The capital expenditure target for 2013 does not include expenditures for spectrum licences.<br />
<strong>TELUS</strong> 2012 ANNUAL REPORT . 45
We made the following key assumptions when we announced the 2012 targets in December 2011.<br />
Assumptions for 2012 original targets Result<br />
Ongoing intense wireless and wireline competition<br />
in both business and consumer markets<br />
46 . <strong>TELUS</strong> 2012 ANNUAL REPORT<br />
Our lower total gross and net wireless additions in 2012, as compared to 2011, reflect slower<br />
market growth as well as heightened competitive intensity, including price competition and<br />
an increase in the number of promotional rate plan offers, port-in credits and in-store credits<br />
from both established national competitors and AWS entrants.<br />
We experienced elevated levels of residential network access line (NAL) losses early in the first<br />
quarter of 2012, resulting from Shaw Communications’ public advertising of heavily discounted<br />
home phone, high-speed Internet and cable-TV promotions in Alberta and B.C. that were<br />
introduced in November 2011 and extended into early 2012.<br />
Business NAL losses in 2012 continue to reflect more intense competition in the small and<br />
medium business (SMB) market, as well as technological substitution of voice lines for more<br />
efficient IP services.<br />
Continued downward re-pricing of legacy services Wireless and wireline voice service revenues continue to decline due to price competition and<br />
technological substitution to data and IP services. Wireless voice revenue decreased by 2.6%<br />
in 2012, resulting from a 7.2% decline in voice ARPU. Wireline local and long distance revenues<br />
declined by 6.5% and 11%, respectively, in 2012.<br />
Wireless industry penetration of the Canadian<br />
population to increase between 4.0 and 4.5 percentage<br />
points, with wireless industry subscriber growth to<br />
remain robust due to a combination of increased<br />
competition and accelerated adoption of smartphones,<br />
tablets and data applications<br />
<strong>TELUS</strong> wireless domestic voice ARPU erosion<br />
offset by increased data and international roaming<br />
ARPU growth<br />
Wireless acquisition and retention expenses to<br />
increase due to increased loading of more expensive<br />
smartphones, including upgrades, and to support<br />
a larger subscriber base<br />
Ongoing investments for deployment of<br />
LTE wireless technology in urban markets<br />
Wireline data revenue growth greater than legacy<br />
revenue declines due to continued wireline broadband<br />
expansion and upgrades supporting Optik TV and<br />
high-speed Internet subscriber sales. Legacy revenue<br />
declines reflect continued erosion in NALs and long<br />
distance revenue<br />
Approximately $25 million in restructuring costs<br />
to support operating and capital efficiency initiatives,<br />
supplemented by value-for-money initiatives to<br />
improve efficiency and effectiveness that do not<br />
involve restructuring charges<br />
Financing costs of approximately $350 million<br />
($377 million in 2011)<br />
Statutory income tax rate of approximately<br />
25 to 26% (27.2% in 2011)<br />
Cash income taxes of approximately<br />
$150 to $200 million ($150 million in 2011).<br />
Growth in wireless industry market penetration is estimated at approximately 2.6 percentage<br />
points for 2012.<br />
Our original goal was for slightly positive growth in blended ARPU. Wireless blended ARPU<br />
increased by 2.2% in 2012, as growth of 21% in data ARPU more than offset the decline in<br />
voice ARPU. Roaming revenues have also increased.<br />
Acquisition and retention expenses totalled $1,290 million in 2012, a decrease of $30 million<br />
when compared to the same period in 2011, due to favourable postpaid churn. The decrease<br />
also reflects lower acquisition volumes resulting from slower market growth and intense<br />
competitive activity, as well as lower retention volumes resulting from successful retention<br />
efforts throughout 2011. Smartphone subscribers represented 66% of our postpaid subscriber<br />
base at the end of 2012, as compared to 53% one year earlier.<br />
We launched LTE services in 14 metropolitan areas in February 2012 and expanded coverage<br />
to reach more than two-thirds of Canadians by the end of 2012.<br />
Wireline data revenue increased by 12%, which exceeded the aggregate 7.5% decline in<br />
voice local and long distance revenues. In 2012, <strong>TELUS</strong> TV net additions were 169,000 and<br />
high-speed Internet net additions were 84,000, exceeding the 198,000 aggregate decline<br />
in total NALs and dial-up Internet subscriptions.<br />
Our assumption was revised to approximately $50 million on August 3, 2012. Actual<br />
restructuring costs of $48 million for 2012 were composed of $38 million for employeerelated<br />
initiatives and $10 million for the consolidation of administrative office space.<br />
Financing costs of $332 million in 2012 were net of $15 million interest income resulting<br />
mainly from the settlement of prior years’ income tax matters, as well as foreign exchange<br />
gains of $8 million.<br />
The blended statutory income tax rate and the effective tax rate for 2012 were both 25.7%.<br />
Elimination in June 2012 of previously enacted Ontario corporate income tax rate reductions<br />
did not affect our assumption significantly.<br />
Cash income taxes paid net of recoveries received were $150 million in 2012, composed of final<br />
payments in respect of the 2011 tax year and instalments for 2012, net of refunds received.
Assumptions for 2012 original targets Result<br />
A pension accounting discount rate was set at 4.5%<br />
(75 basis points lower than 2011)<br />
The preliminary assumption for the expected long-term<br />
return on defined benefit pension plan assets was<br />
6.5% (December 2011 targets announcement) and<br />
was subsequently set at 6.75% (25 basis points lower<br />
than 2011), as disclosed in <strong>TELUS</strong>’ 2011 MD&A<br />
A discretionary one-time pension contribution of<br />
$100 million to be made in early 2012 (a discretionary<br />
one-time contribution of $200 million was made in<br />
January 2011)<br />
1.5 Financial and operating targets for 2013<br />
MANAGEMENT’S DISCUSSION & ANALYSIS: 1<br />
The pension accounting discount rate changed at the end of 2012 to 3.9%, which resulted<br />
in an actuarial loss being recorded in Other comprehensive income for the year.<br />
The expected long-term rate of return remained at 6.75%.<br />
The discretionary $100 million contribution was made in January 2012.<br />
The following targets for 2013 and comparatives for 2012 are presented including application of the amended accounting standard IAS 19 Employee<br />
benefits (2011). Our 2013 targets and assumptions are fully qualified by the Caution regarding forward-looking statements at the beginning of the MD&A.<br />
2013 targets and adjusted results for 2012<br />
After application of amended IAS 19 2012 adjusted results and growth 2013 targets and growth<br />
Consolidated<br />
Revenues $10.921 billion $11.4 to $11.6 billion<br />
5.0% 4 to 6%<br />
EBITDA adjusted for IAS 19 (2011) (1)(2) $3.859 billion $3.95 to $4.15 billion<br />
5.3% 2 to 8%<br />
Basic EPS adjusted for IAS 19 (2011) (2) $3.69 $3.80 to $4.20<br />
6.0% 3 to 14%<br />
Capital expenditures (3) Wireless segment<br />
$1.981 billion<br />
7.3%<br />
Approx. $1.95 billion<br />
Revenue (external) $5.845 billion $6.2 to $6.3 billion<br />
7.0% 6 to 8%<br />
EBITDA adjusted for IAS 19 (2011) (1)(2) $2.458 billion $2.575 to $2.675 billion<br />
Wireline segment<br />
12.9% 5 to 9%<br />
Revenue (external) $5.076 billion $5.2 to $5.3 billion<br />
2.9% 2 to 4%<br />
EBITDA adjusted for IAS 19 (2011) (1)(2) $1.401 billion $1.375 to $1.475 billion<br />
(5.8)% (2) to 5%<br />
(1) EBITDA is a non-GAAP measure. See definition in Section 11.1.<br />
(2) Includes non-cash effects of applying the amended accounting standard IAS 19 Employee benefits (2011) in fiscal 2013 with required retrospective application to prior periods.<br />
(3) The capital expenditure target for 2013 does not include expenditures for spectrum licences.<br />
Consolidated revenues and EBITDA should benefit from continued<br />
strong execution in wireless and data services. Basic EPS is targeted<br />
to be up to 14% higher, due to operating earnings growth.<br />
Wireless revenue is forecast to increase as a result of modest subscriber<br />
and ARPU growth. We should continue to benefit from our 4G LTE<br />
network investments, resulting in continued growth in data and roaming<br />
revenues and helping to offset moderating declines in voice ARPU.<br />
Wireless EBITDA is targeted to be higher by 5 to 9%.<br />
Wireline revenue is targeted to increase due to continued data revenue<br />
growth from Optik TV and high-speed Internet services, as well as from<br />
business services, partially offset by continued decreases in legacy voice<br />
revenues. The wireline EBITDA range is targeted to increase by up to 5%.<br />
We assume margin improvements from TV and Internet services, large<br />
enterprise business and efficiency initiatives, partially offset by the ongoing<br />
industry trend of revenue losses from higher-margin legacy voice services.<br />
Consolidated capital expenditures are targeted to remain at approxi-<br />
mately $1.95 billion, which excludes purchases of spectrum licences, such<br />
as, but not limited to, the cost for 700 MHz spectrum from a planned<br />
national auction in the second half of 2013. We plan to continue investing<br />
in wireless capacity and network growth, while investments for urban<br />
deployment of 4G LTE are planned to decline. We intend to continue<br />
broadband infrastructure expansion and upgrades to support Optik TV<br />
and Internet subscriber growth and faster Internet broadband speeds.<br />
In addition, we plan to complete the new advanced IDC in Kamloops, B.C.<br />
Capital intensity as a percentage of consolidated revenue is targeted to<br />
decline to approximately 17% from 18% in the past three years.<br />
<strong>TELUS</strong> 2012 ANNUAL REPORT . 47
The 2013 targets are based on many assumptions including:<br />
. Ongoing intense wireless and wireline competition in both consumer<br />
and business markets<br />
. Wireless industry penetration of the Canadian population to increase<br />
between two and three percentage points with subscriber growth<br />
due to a combination of intense competition and adoption and<br />
upgrade of smartphones, tablets and data applications<br />
. <strong>TELUS</strong> wireless ARPU to be flat to slightly higher as increased data<br />
and international roaming ARPU growth is offset by ongoing voice<br />
revenue declines<br />
. Wireless acquisition and retention expenses to be flat to higher due<br />
to loading of more expensive smartphones, including upgrades<br />
. Capital expenditures impacted by ongoing investments to support<br />
continued wireless and wireline customer growth and technology<br />
enhancements<br />
. Wireline data revenue growth to be partially offset by continued<br />
declines in legacy voice revenue<br />
. A pension accounting discount rate of 3.9% (the final rate for<br />
2012 and 60 basis points lower than estimated at the start of 2012)<br />
. Total defined benefit pension expense for 2013 estimated to be<br />
approximately $160 million, of which approximately $110 million is<br />
operating expenses (employee benefits expense) and $50 million<br />
is financing costs. We recorded a defined benefit pension recovery in<br />
employee benefits of $11 million in 2012 prior to applying the amended<br />
standard IAS 19 (an adjusted defined benefit pension expense of<br />
$102 million for 2012 and an additional $42 million in financing costs<br />
in 2012 after retrospective application of the amended standard)<br />
. Stable defined benefit pension plan funding of $195 million<br />
($171 million in 2012)<br />
. Approximately $75 million in restructuring costs to support ongoing<br />
operating and capital efficiency initiatives, supplemented by initiatives<br />
that do not involve restructuring charges<br />
. Net financing costs of approximately $400 million including $50 million<br />
related to pension plans resulting from applying IAS 19 (2011)<br />
(adjusted net financing costs of $374 million in 2012)<br />
. Consolidated depreciation and amortization expense of approximately<br />
$1.9 billion ($1.865 billion in 2012)<br />
. Statutory income tax rate of 25 to 26% (25.7% in 2012)<br />
. Cash income taxes of $390 to $440 million ($150 million in 2012).<br />
Cash tax payments are increasing due to higher income levels,<br />
a large final payment due for 2012 in the first quarter of 2013,<br />
and higher instalment payments based on 2012 income.<br />
48 . <strong>TELUS</strong> 2012 ANNUAL REPORT<br />
Consolidated 2013 targets<br />
See Caution regarding forward-looking statements at the beginning of<br />
the MD&A.<br />
Consolidated revenue ($ millions)<br />
13 target 11,400 to 11,600<br />
10 12<br />
09 11<br />
08 10<br />
07 11<br />
12 10<br />
11 09<br />
10 08<br />
EBITDA 11 07 is a non-GAAP measure.<br />
Adjusted figures for 2010 to 2012<br />
10 06<br />
9,792<br />
10,921<br />
10,397<br />
Consolidated EBITDA ($ millions)<br />
13 target 3,950 to 4,150<br />
12 10<br />
11 09<br />
10 08<br />
Adjusted 11 07 figures for 2010 to 2012<br />
3,665<br />
3,568<br />
3,859<br />
Basic earnings per share ($)<br />
13 target 3.80 to 4.20<br />
12 10<br />
11 09<br />
10 08<br />
*Excluding 11 07 spectrum licences.<br />
3.07<br />
3.48<br />
3.69<br />
Consolidated capital expenditures* ($ millions)<br />
13 target approx. 1,950<br />
1,721<br />
1,847<br />
1,981
1.6 <strong>TELUS</strong> segment targets<br />
Our operating segments and <strong>report</strong>able segments are wireless and<br />
wireline. Segmented information in Note 5 of the Consolidated financial<br />
statements is regularly <strong>report</strong>ed to our Chief Executive Officer<br />
Wireless external revenue ($ millions)<br />
13 target 6,200 to 6,300<br />
12 10<br />
11 09<br />
10 08<br />
11 07<br />
12 10<br />
11 09<br />
10 08<br />
EBITDA 11 07 is a non-GAAP measure.<br />
Adjusted figures for 2010 to 2012<br />
10 06<br />
5,012<br />
5,462<br />
5,845<br />
Wireless EBITDA ($ millions)<br />
13 target 2,575 to 2,675<br />
2,014<br />
2,177<br />
2,458<br />
MANAGEMENT’S DISCUSSION & ANALYSIS: 1<br />
(the chief operating decision-maker). See Section 4.1 Principal markets<br />
addressed and competition for additional information on each segment.<br />
See Caution regarding forward-looking statements at the beginning of<br />
the MD&A.<br />
Wireline external revenue ($ millions)<br />
13 target 5,200 to 5,300<br />
10 12<br />
09 11<br />
08 10<br />
07 11<br />
12 10<br />
11 09<br />
10 10 08<br />
EBITDA 11 07 is a non-GAAP measure.<br />
Adjusted figures for 2010 to 2012<br />
10 06<br />
4,780<br />
5,076<br />
4,935<br />
Wireline EBITDA ($ millions)<br />
13 target 1,375 to 1,475<br />
1,401<br />
1,488<br />
1,554<br />
<strong>TELUS</strong> 2012 ANNUAL REPORT . 49
2 Core<br />
Our discussion in this section is qualified in its entirety by the Caution<br />
regarding forward-looking statements at the beginning of the MD&A.<br />
2.1 Core business<br />
business and strategy<br />
A discussion of our core business and strategy, including examples of activities<br />
in support of our six strategic imperatives<br />
We are one of Canada’s largest telecommunications companies.<br />
We provide a full range of telecommunications services and products,<br />
including wireless, data (including IP, information technology managed<br />
services and television) and voice. We earn the majority of our revenue<br />
from access to, and the usage of, our telecommunications infrastructure,<br />
or from providing services and products that facilitate access to and<br />
usage of our infrastructure.<br />
2.2 Strategic imperatives<br />
Our strategic intent is to unleash the power of the Internet to deliver<br />
the best solutions to Canadians at home, in the workplace and on the<br />
move. Our growth strategy is to focus on our core telecommunications<br />
business in Canada, supported by our international contact centre<br />
and outsourcing capabilities.<br />
In 2000, we developed six strategic imperatives that remain<br />
relevant for future growth, despite changing regulatory, technological<br />
and competitive environments. We believe that a consistent focus<br />
on the imperatives guides our actions and contributes to the achievement<br />
of our financial goals. To advance these long-term strategic<br />
initiatives and address near-term opportunities and challenges, we set<br />
new corporate priorities each year, as further described in Section 3.<br />
Building national capabilities across data, IP,<br />
voice and wireless<br />
In 2012, our efforts were focused on wireless capacity upgrades, ongoing<br />
deployment of a new LTE wireless network in urban markets and investments<br />
in new state-of-the-art IDCs, as well as continued investments<br />
in broad band infrastructure expansion and upgrades to support growth<br />
in Optik TV and Internet services. Our broadband investments included<br />
overlaying VDSL2 technology in Western Canada and Eastern Quebec,<br />
deploying fibre to the home in new residential areas and deploying<br />
fibre to the building in new multi-dwelling units.<br />
. We launched LTE network service in 14 metropolitan areas across<br />
Canada in February 2012. By the end of 2012, coverage reached<br />
more than 85% of British Columbians and 83% of Albertans, and<br />
nationally, more than two-thirds of Canadians. Our urban LTE network<br />
operates on AWS spectrum that we acquired in Industry Canada’s<br />
2008 auction. LTE supports manufacturer-rated peak data download<br />
speeds of up to 75 Mbps (typical speeds of 12 to 25 Mbps expected;<br />
actual speed may vary by device used, topography and environmental<br />
conditions, network congestion, signal strength and other factors).<br />
Outside of LTE coverage areas, LTE devices we offer also work on<br />
our HSPA+ network, which covered more than 97% of the population<br />
at December 31, 2012.<br />
50 . <strong>TELUS</strong> 2012 ANNUAL REPORT<br />
. We extended wireless coverage along 455 km of primary and<br />
secondary highways in B.C. and upgraded 129 B.C. schools from<br />
legacy copper services to fibre optic Internet connections, under<br />
a 10-year agreement with the Government of B.C. to provide<br />
telecommunications and strategic services to the government<br />
and its public sector partners.<br />
. We continued investing in our wireline broadband network to<br />
expand capacity and coverage. At the end of 2012, our broadband<br />
VDSL2 and ADSL2+ high-definition (HD) coverage reached more<br />
than 2.4 million households in B.C., Alberta and Eastern Quebec,<br />
as compared to nearly 2.3 million households one year earlier.<br />
. We are enhancing our national capability to support cloud<br />
computing services and internal requirements by investing a total<br />
of approximately $150 million for new state-of-the-art intelligent<br />
IDCs in Rimouski, Quebec and Kamloops, B.C. Phase I of the<br />
Rimouski facility opened in 2012 and is in service. The Kamloops<br />
facility is planned to go into service in mid-2013. These facilities<br />
have been designed to Uptime Institute Tier III standards for reliability<br />
and security, and to the leadership in energy and environmental<br />
design (LEED) gold standard for sustainability. A modular design<br />
approach facilitates scalable expansion in the future.<br />
Aided by hydro-electrically generated power and natural cooling,<br />
the new IDCs are expected to be among the most environmentally<br />
sustainable and top performing operations of their type in the world.<br />
They connect directly to our national IP network and interconnect with<br />
our existing data centres across the country, creating an advanced<br />
and regionally diverse computing infrastructure in Canada.<br />
Focusing relentlessly on the growth markets of data,<br />
IP and wireless<br />
Our focus on growth markets is reflected in wireline data revenue<br />
and wireless service and equipment revenue of $8.74 billion in 2012,<br />
an increase of $701 million or 8.7% when compared to 2011. This<br />
increase exceeds the $174 million decline in legacy wireline voice and<br />
other service and equipment revenues in 2012. Data and wireless<br />
revenues represented approximately 80% of total service and equipment<br />
revenues in 2012 (77% in 2011).<br />
We introduced prepaid services to the Koodo ® brand for the first time,<br />
to complement existing Koodo postpaid offerings. Basic prepaid plans<br />
include call display, voicemail, unlimited text and picture messaging<br />
(excluding premium messages and subscription-based messages) and<br />
per-minute charges for talk minutes. Talk Booster TM and Data Booster TM<br />
add-ons are available that do not expire if the customer’s basic plan<br />
remains active.<br />
We unveiled <strong>TELUS</strong>Health.com, a new online hub for healthcare<br />
professionals. The site offers solutions such as eClaims, personal health<br />
records and home care monitoring, as well as educational resources,<br />
news, events and publications to assist healthcare professionals. <strong>TELUS</strong><br />
Health provides technologies and applications that connect professionals<br />
to the right information and enable more rapid acceptance and adoption<br />
of health information technology solutions. Information is moved securely<br />
on our telecommunications infrastructure.
Providing integrated solutions that differentiate<br />
<strong>TELUS</strong> from its competitors<br />
Our top priority is to put customers first and improve the likelihood that<br />
<strong>TELUS</strong> is recommended as a service provider. In addition to our existing<br />
comprehensive customer-focused initiatives, on October 15, 2012, we<br />
announced that we would no longer charge a $35 activation fee for new<br />
wireless service customers or charge a $25 equipment exchange fee for<br />
renewing customers who purchase a new device. However, beginning<br />
in November 2012, we began charging $10 for a SIM card, when needed,<br />
which was previously included in the activation or renewal fee. Our clients<br />
are now realizing net activation or renewal savings even when a SIM card<br />
is required.<br />
This latest change builds upon a series of improvements over the<br />
past several years, including: elimination of carrier 911 fees and system<br />
access fees on all of our Clear & Simple ® rate plans; introduction of<br />
data flex plans, data notifications and worry-free travel; adding caller ID<br />
and voicemail as standard on all <strong>TELUS</strong> rate plans; simplified device<br />
pricing with anytime upgrades through the Clear and Simple Device<br />
Upgrade program; replacing contract termination fees with a declining<br />
initial device subsidy balance; e.bills; enhanced international roaming<br />
notifications; large reductions in international voice and data roaming<br />
costs for customers without the requirement to subscribe to a roaming<br />
plan; and wireless device unlocking.<br />
We enhanced Optik TV in 2012 by:<br />
. Expanding the channel lineup by 20 HD channels. We now offer<br />
over 550 channels including more than 135 HD channels and<br />
50 commercial-free music channels.<br />
. Expanding the selection of commercial-free TV On Demand shows<br />
and movies for OptikTM on the go, which provides Optik TV customers<br />
in B.C. and Alberta with the capability to view these programs<br />
on their mobile devices, tablets and laptops, using <strong>TELUS</strong>’ 4G LTE<br />
wireless network or Wi-Fi. When our customers travel outside of<br />
our 4G LTE network coverage area, the service moves seamlessly<br />
onto our existing 4G HSPA+ network.<br />
. Introducing the free Optik Smart Remote app that Optik TV customers<br />
can download to their mobile phones or tablets. The app enables<br />
customers to navigate the interactive program guide on a mobile<br />
device without interrupting the show they are watching on the TV.<br />
The app also provides access to program-related information from<br />
sources like IMDb (Internet Movie Database), Wikipedia and YouTube.<br />
. Adding Multi-View on Optik TV, which allows customers to watch<br />
up to four channels at once on the same screen, and The Weather<br />
Network app on Optik TV, which allows users to check weather<br />
at any time.<br />
. Adding the capability to control both live and recorded TV with hand<br />
gestures and voice commands with the addition of an Xbox 360<br />
Kinect sensor for our customers who use an Xbox 360 as their settop<br />
box.<br />
. Introducing a free Twitter app that provides access to Twitter features<br />
and content while watching Optik TV.<br />
We introduced <strong>TELUS</strong> Managed Mobility Services powered by Vox<br />
Mobile – a service offering that manages a company’s mobile infrastructure<br />
and devices from procurement to payment and leverages a growing<br />
trend among businesses to adopt “bring your own device” policies for<br />
their employees. <strong>TELUS</strong> Managed Mobility Services offers enterprises<br />
a series of six individual integrated service modules that provide an<br />
end-to-end service option for managing wireless devices from multiple<br />
carriers, on multiple platforms.<br />
MANAGEMENT’S DISCUSSION & ANALYSIS: 2<br />
Partnering, acquiring and divesting to accelerate<br />
the implementation of our strategy and focus our<br />
resources on the core business<br />
We made several small business acquisitions and related investments<br />
complementary to our existing lines of business in 2012. This includes<br />
two acquisitions that enhance our capabilities in respect of cloud-based<br />
electronic medical records (EMR) solutions. We added to the number<br />
of international business process outsourcing contact centre operations<br />
to provide geographic diversity, expand service language capabilities<br />
and obtain new business customers. We also acquired more <strong>TELUS</strong>branded<br />
wireless dealership businesses to ensure we provide a focused<br />
and consistent customer experience.<br />
Investing in internal capabilities to build a high-performance<br />
culture and efficient operation<br />
In late November 2012, the membership of the Syndicat des agents de<br />
maîtrise de <strong>TELUS</strong> (SAMT) strongly endorsed a new collective agreement.<br />
The new agreement is in effect through March 31, 2017, and covers<br />
approximately 620 professional and supervisory employees in the <strong>TELUS</strong><br />
Quebec operating region.<br />
In our <strong>annual</strong> Pulsecheck survey of team members administered by<br />
Aon Hewitt, our employee engagement score increased by 10 points to<br />
80% in 2012, following a 13-point increase in 2011. Significant improvements<br />
were noted in several areas including our work processes, career<br />
opportunities, performance development, recognition and compensation.<br />
We expect to maintain focus on these important areas and continue to<br />
use fair process to implement improvements. These substantial increases<br />
in employee engagement in each of the last two years have helped us<br />
focus on putting customers first.<br />
Going to the market as one team under a common brand,<br />
executing a single strategy<br />
Since mid-2010, when we united customer-facing business units under<br />
common leadership in <strong>TELUS</strong> Customer Solutions, we continue to<br />
refine our processes and structure to own the end-to-end customer<br />
experience.<br />
In 2012, we collected more than 1,000 improvement ideas from team<br />
members from all levels of <strong>TELUS</strong> as part of an extensive fair process<br />
exercise. The insights gained led to the development of four customer<br />
commitments that underpin our internal goals and corporate priorities<br />
to serve our customers better:<br />
. We take ownership of every customer experience<br />
. We work as a team to deliver on our promises<br />
. We learn from customer feedback and take action to get better,<br />
every day<br />
. We are friendly, helpful and thoughtful.<br />
<strong>TELUS</strong> 2012 ANNUAL REPORT . 51
3 Key<br />
performance drivers<br />
A <strong>report</strong> on our 2012 corporate priorities and an outline of our 2013 priorities<br />
Our discussion in this section is qualified in its entirety by the Caution<br />
regarding forward-looking statements at the beginning of the MD&A.<br />
We confirm or set new corporate priorities each year to both advance<br />
<strong>TELUS</strong>’ long-term strategic priorities (see Section 2.2) and address<br />
52 . <strong>TELUS</strong> 2012 ANNUAL REPORT<br />
near-term opportunities and challenges. Corporate priorities are<br />
key performance drivers that help achieve performance measures<br />
quantified in our public financial targets disclosed in Sections 1.4<br />
and 1.5.<br />
Corporate priorities<br />
2012 (see progress in the following table) 2013<br />
Deliver on <strong>TELUS</strong>’ future friendly ® brand promise by putting customers first Deliver on <strong>TELUS</strong>’ future friendly brand promise by putting customers first<br />
and earning our way to industry leadership in “likelihood to recommend”<br />
from our clients<br />
Increase our competitive advantage through technology leadership<br />
Further strengthen our operational efficiency and effectiveness, thereby<br />
fuelling our capacity to invest for future growth<br />
Drive <strong>TELUS</strong>’ leadership position in its chosen business and public<br />
Continue to foster our culture for sustained competitive advantage<br />
sector markets<br />
Accelerate <strong>TELUS</strong>’ leadership position in healthcare information technology<br />
Strive to further improve our operational efficiency and effectiveness<br />
Build our culture for sustained competitive advantage.<br />
Progress on 2012 corporate priorities<br />
Deliver on <strong>TELUS</strong>’ future friendly brand promise by putting customers first<br />
Increase our competitive advantage through technology leadership<br />
across cohesive broadband networks, Internet data centres, information<br />
technology and client applications<br />
Drive <strong>TELUS</strong>’ leadership position in its chosen business and public<br />
sector markets through an intense focus on high-quality execution<br />
and economics<br />
Elevate <strong>TELUS</strong>’ leadership position in healthcare information by leveraging<br />
technology to deliver better health outcomes for Canadians.<br />
. Our ongoing initiatives, including those described in Section 2.2, helped increase likelihood-to-recommend scores in 2012 for consumer, SMB,<br />
enterprise business and <strong>TELUS</strong> Québec business.<br />
. We realized a 13% decrease in customer complaints as <strong>report</strong>ed in the Commissioner for Complaints for Telecommunications Services’ 2011–2012<br />
<strong>report</strong>, while complaints across the industry rose 35%.<br />
. We simplified our Optik TV packages and now include all corresponding HD channels with each plan. We continue to provide more choice, including<br />
the option to subscribe to sports theme packages.<br />
. For wireless clients, in November we introduced a suite of unlimited talk and family share plans featuring unlimited talk and text and the ability to share<br />
data with others on the same account.<br />
. We are working with the Canadian Wireless Telecommunications Association and other wireless providers to create a national registry of stolen<br />
handsets that will be part of an international registry. The registry is expected to reduce the street value of stolen handsets and make them less<br />
attractive to thieves. Theft of a smartphone can have serious consequences for its owner, including risks of having personal information in the<br />
hands of criminals.<br />
. We give where we live to help our fellow citizens in need, build stronger communities and create a stronger bond with our clients. We accomplish<br />
this through the efforts of our 14 <strong>TELUS</strong> Community Boards in Canada and internationally, <strong>TELUS</strong> Community Ambassadors ® , cause marketing<br />
(where we make a contribution to a local cause for new subscribers of certain products over a given timeframe) and programs such as the <strong>TELUS</strong><br />
Day of Giving ® , Team <strong>TELUS</strong> Charitable Giving, Dollars for Doers and fundraising grants. See our corporate social responsibility (CSR) <strong>report</strong><br />
at telus.com/csr.
Progress on 2012 corporate priorities<br />
Increase our competitive advantage through technology leadership<br />
MANAGEMENT’S DISCUSSION & ANALYSIS: 3<br />
. We introduced LTE devices and services on our new and faster LTE wireless network in February 2012 and expanded LTE coverage to more than<br />
two-thirds of Canadians by the end of the year. We also expanded capacity and coverage of our wireless HSPA network, which reached more than<br />
97% of Canadians at the end of 2012.<br />
. We expanded broadband coverage supporting Optik TV and <strong>TELUS</strong> high-speed Internet services, reaching more than 2.4 million homes at the end<br />
of 2012 in B.C., Alberta and Eastern Quebec.<br />
. Our new Optik TV diagnostic detection tools are positively impacting the customer experience, and have reduced TV and Internet service calls by<br />
approximately 50%.<br />
. We also introduced several applications and features on Optik TV (see Providing integrated solutions in Section 2.2).<br />
. We enhanced our national capability to support cloud computing services and internal requirements by opening a new state-of-the-art intelligent IDC<br />
in Rimouski, Quebec, built to high standards for reliability, security, efficiency and sustainability. Its modular design facilitates scalable expansion in the<br />
future. This facility and one under construction in Kamloops, B.C. connect directly to our national IP network and interconnect with our existing data<br />
centres across the country, creating an advanced and regionally diverse computing infrastructure in Canada.<br />
Drive <strong>TELUS</strong>’ leadership position in its chosen business and public sector markets<br />
. We opened 10 <strong>TELUS</strong> Business Stores in locations such as Victoria, Vancouver, Saskatoon and Toronto that are designed to meet the specific needs<br />
of SMB clients. Business clients have the opportunity to try out technologies with one-on-one assistance from our experts. The stores also have learning<br />
centres that offer tutorials to help clients learn how to get the most out of their communications technology. We plan to open more stores across<br />
Canada in 2013.<br />
. We introduced <strong>TELUS</strong> Team Share plans for businesses, where voice minutes and data can be shared across multiple devices used by one person<br />
or an entire team. This enables businesses to optimize usage at an account level and easily add devices to share the voice and data pools.<br />
. We expanded the number of business processing outsourcing geographic locations to offer more service opportunities and diversify language<br />
capabilities, and signed nine new business clients for <strong>TELUS</strong> International business process outsourcing services.<br />
Accelerate <strong>TELUS</strong>’ leadership position in healthcare information technology<br />
. In 2012, we acquired electronic medical record (EMR) providers to complement our range of solutions.<br />
. We announced agreements with Sun Life Assurance Company of Canada, Standard Life and Desjardins Financial Security to provide nationwide<br />
electronic benefit claims solutions using <strong>TELUS</strong> Health eClaims.<br />
. A consortium including <strong>TELUS</strong> Health was awarded a contract to provide the Province of Alberta with Microsoft HealthVault for the development<br />
of a personal health records solution.<br />
. We announced a two-year extension to our agreement with the Ontario Ministry of Health and Long-Term Care in May. Under the agreement,<br />
we manage, operate and maintain electronic processing systems and technology support services, which enable online, real-time processing<br />
of drug benefit claims under the Ontario Public Drug programs.<br />
. <strong>TELUS</strong> Health launched Emergency Profile on myhealthreference.com, a free and secure personal online profile for Canadians including information<br />
about medications, allergies and health conditions that can be shared with family or healthcare providers for medical emergencies. Emergency Profile is<br />
an integral part of <strong>TELUS</strong> Health Space ® , powered by Microsoft HealthVault. We also unveiled a new online healthcare hub for healthcare professionals,<br />
<strong>TELUS</strong>Health.com.<br />
Strive to further improve our operational efficiency and effectiveness<br />
. We leveraged our technology platforms and services to increase average lifetime revenue per client in the wireless and Future Friendly Home portfolios,<br />
as wireless, TV and Internet subscriber churn rates were reduced and the respective average monthly revenues increased.<br />
. Team members from across the organization are actively involved in identifying and implementing improvements using fair process tools.<br />
. We increased our restructuring initiatives in 2012, originally planned to be approximately $25 million, to reach a total of $48 million, which included<br />
$38 million for workforce-related initiatives and $10 million for other initiatives including consolidation of administrative real estate.<br />
Build our culture for sustained competitive advantage<br />
. Our team member engagement score in the 2012 Aon Hewitt-administered PulseCheck survey increased by 10 points to 80%, following a 13-point<br />
improvement in 2011. The 2012 score places <strong>TELUS</strong> first in Canada for organizations of 15,000 employees or more.<br />
. We reached a new collective agreement with the Syndicat des agents de maîtrise de <strong>TELUS</strong> (SAMT), representing approximately 620 team members<br />
in the <strong>TELUS</strong> Quebec region.<br />
<strong>TELUS</strong> 2012 ANNUAL REPORT . 53
4<br />
Capabilities<br />
Factors that affect our capability to execute strategies, manage key<br />
performance drivers and deliver results<br />
Our discussion in this section is qualified in its entirety by the Caution regarding forward-looking statements at the beginning of the MD&A.<br />
4.1 Principal markets addressed and competition<br />
Wireless: Services for consumers and businesses<br />
Our capabilities Competition overview<br />
We provide Clear & Simple voice and data solutions.<br />
We have licensed national wireless spectrum and four networks<br />
that covered 99% of the Canadian population at December 31, 2012,<br />
including network access agreements and roaming/resale agreements.<br />
Our coast-to-coast digital LTE 4G network:<br />
. Was launched in 14 urban areas in February 2012<br />
. Covered more than two-thirds of Canada’s population at<br />
December 31, 2012, including a reciprocal network access<br />
agreement with Bell Canada<br />
. Provides manufacturer-rated peak data download speeds<br />
of up to 75 Mbps (typical speeds of 12 to 25 Mbps expected<br />
with a compatible device1 )<br />
. Roams on the HSPA+ network outside LTE urban coverage area.<br />
Our coast-to-coast digital 4G HSPA+ network launched in<br />
November 2009:<br />
. Covered more than 97% of the Canadian population at<br />
December 31, 2012, facilitated by network access agreements<br />
with Bell Canada and SaskTel<br />
. Has dual-cell capability, on which services were launched in<br />
March 2011, with manufacturer-rated peak data download speeds<br />
of up to 42 Mbps (typical speeds of 7 to 14 Mbps expected with<br />
a compatible device1 )<br />
. Provides international roaming capabilities that deliver excellent<br />
customer connectivity in 216 countries through 540 partners<br />
. Improves capability for international roaming revenue, previously<br />
limited under CDMA and Mike ® services<br />
. Enables an optimal transition to LTE technology and services.<br />
Mature networks include our digital PCS (CDMA) network with a<br />
3G high-speed evolution data optimized (EVDO) Revision A overlay,<br />
and our iDEN network supporting Mike service, a push-to-talk<br />
service focused on the commercial marketplace.<br />
Interconnection with <strong>TELUS</strong>’ wireline networks.<br />
Services and products we offer:<br />
. Data – Web browsing, social networking, messaging (text, picture<br />
and video), <strong>TELUS</strong> mobile TV ® , video on demand and the latest<br />
mobile applications<br />
. Digital voice – Postpaid, prepaid and <strong>TELUS</strong> Push to Talk ®<br />
. Devices – Leading smartphones, mobile Internet keys, mobile<br />
Wi-Fi devices and tablets.<br />
54 . <strong>TELUS</strong> 2012 ANNUAL REPORT<br />
Facilities-based national competitors Rogers Wireless and Bell Mobility,<br />
and provincial telecommunications companies SaskTel and MTS Mobility.<br />
Resellers of competitors’ wireless networks.<br />
AWS entrants:<br />
. Mobilicity, Public Mobile, Quebecor (Videotron) and Wind Mobile<br />
. Eastlink launched service in Nova Scotia and Prince Edward Island<br />
in February 2013<br />
. Shaw chose to build metropolitan Wi-Fi networks rather than build<br />
and launch conventional wireless services using its AWS spectrum,<br />
and has sold an option to Rogers to purchase its AWS spectrum<br />
in 2014, subject to Industry Canada approval<br />
. Possible alliances and integrations among the AWS entrants<br />
. Others who acquired regional licences for AWS spectrum in 2008<br />
have not entered the market.<br />
Entertainment services offered by cable-TV and wireless competitors<br />
over wireless and metropolitan Wi-Fi networks.<br />
1 Actual speed may vary by device being used, topography and environmental conditions, network congestion, signal strength and other factors.
Wireline: Residential services in British Columbia, Alberta and Eastern Quebec<br />
Business services across Canada; contact centre and outsourcing solutions internationally<br />
Our capabilities Competition overview<br />
We have an IP-based national network overlaying an extensive<br />
switched network in B.C., Alberta and Eastern Quebec, as well as<br />
global interconnection arrangements.<br />
We have fibre to the home initiatives in new neighbourhoods.<br />
We have 10 data centres in six communities directly connected to<br />
the national <strong>TELUS</strong> IP network, creating an advanced and regionally<br />
diverse computing infrastructure in Canada. We opened a new<br />
energy-efficient intelligent IDC in Rimouski, Quebec in 2012 and plan<br />
to open another in Kamloops, B.C. in mid-2013.<br />
We have access to most urban and rural homes in B.C., Alberta and<br />
Eastern Quebec. We provide wireline residential access line services<br />
to an estimated 45% of households in B.C. and Alberta, and over<br />
two-thirds of households in Eastern Quebec.<br />
We have access to businesses across Canada through our networks,<br />
as well as competitive local exchange carrier status.<br />
Our broadband ADSL2+ or VDSL2 coverage reaches more than<br />
2.4 million households in B.C., Alberta and Eastern Quebec.<br />
We have broadcasting distribution licences to offer digital television<br />
services in incumbent territories and licences to offer commercial<br />
video-on-demand services.<br />
Services and products we offer:<br />
. Voice – Reliable phone service with long distance and advanced<br />
calling features<br />
. Internet – Secure <strong>TELUS</strong> high-speed Internet access service<br />
with email and a comprehensive suite of security solutions<br />
. <strong>TELUS</strong> TV – HD entertainment service with Optik TV and <strong>TELUS</strong><br />
Satellite TV. Optik TV offers extensive content options and innovative<br />
features such as PVR Anywhere, Remote Recording, Smart Remote<br />
channel browsing with an iPad or iPhone, use of Xbox 360 as a<br />
set-top box and Optik on the go<br />
. IP networks and applications – IP networks that offer converged<br />
voice, video, data or Internet access on a secure, high-performing<br />
network<br />
. Conferencing and collaboration – Full range of equipment and<br />
application solutions to support meetings and webcasts by means<br />
of phone, video and Internet<br />
. Contact centre and outsourcing solutions in English, Spanish, French<br />
and many other languages – Managed solutions providing secure,<br />
stable, low-cost and scalable infrastructure in North America,<br />
Central America, Europe and the Asia-Pacific region<br />
. Hosting and managed information technology (IT) – Ongoing assured<br />
availability of telecommunications services, networks, servers,<br />
databases, files and applications, with critical applications stored<br />
in our IDCs across Canada<br />
. Healthcare – Claims management solutions, hospital and hospitalto-home<br />
technology, electronic health records and other healthcare<br />
solutions through <strong>TELUS</strong> Health.<br />
MANAGEMENT’S DISCUSSION & ANALYSIS: 4<br />
Substitution of wireless services, including our own wireless offerings, for<br />
residential local and long distance services. Households with wireless-only<br />
telephone services (among all providers, including <strong>TELUS</strong>) are estimated<br />
to be 24% in B.C. and Alberta, and 6% in Eastern Quebec.<br />
Cable-TV providers that have access to urban and suburban homes provide<br />
Internet, entertainment and VoIP-based telephony services, including:<br />
. Shaw Communications in B.C. and Alberta<br />
. Cogeco Cable in Eastern Quebec.<br />
Rogers Communications, Bell Canada and Shaw Communications,<br />
providing combinations of local, long distance, Internet and entertainment<br />
services in various regions. Rogers and Bell also provide wireless services.<br />
Various others (e.g. Vonage) that offer resale or VoIP-based local,<br />
long distance and Internet services.<br />
Over-the-top voice and entertainment services such as Skype and Netflix.<br />
Entertainment services offered by cable-TV and wireless competitors<br />
over wireless and metropolitan Wi-Fi networks.<br />
Satellite-based entertainment and Internet services (Bell Canada,<br />
Shaw Communications and Xplornet).<br />
Business data and voice services:<br />
. Bell Canada, MTS Allstream and cable-TV companies compete<br />
with their own infrastructures<br />
. Substitution to wireless services, including those offered by <strong>TELUS</strong>.<br />
Competitors for contact centre services include Convergys, Sykes and<br />
Verizon LiveSource.<br />
Competitors for customized managed outsourcing solutions include<br />
system integrators CGI Group Inc., EDS division of HP Enterprise Services<br />
and IBM.<br />
Competitors for <strong>TELUS</strong> Health include system integrators, BCE<br />
and others.<br />
<strong>TELUS</strong> 2012 ANNUAL REPORT . 55
4.2 Operational resources<br />
Resources<br />
Our people<br />
Key operational risk categories and risk management<br />
Our team members numbered approximately 42,400 (41,400 full-<br />
Employee retention and related risks (see Section 10.4 Human resources):<br />
time equivalent or FTE employees) at the end of 2012, across a wide<br />
. We aim to attract and retain key employees through both monetary<br />
range of operational functions domestically (28,100) and certain<br />
and non-monetary approaches, striving to protect and improve<br />
functions internationally (14,300).<br />
engagement levels<br />
Our contact centre operations at Canadian and international locations<br />
support business process outsourcing services for external wholesale<br />
customers. We also use offshore services for certain internal operations<br />
to improve efficiency and to allow onshore operations to focus on<br />
value-added services.<br />
.<br />
.<br />
We expect retention and hiring issues to remain due to a larger number<br />
of competitors<br />
Approximately 12,585 of our team members are covered by a collective<br />
agreement. The agreement with the Telecommunications Workers<br />
Union (TWU) covers approximately 11,000 employees and is in effect<br />
through 2015. A new collective agreement with the Syndicat des agents<br />
Our employee compensation programs support a high-performance<br />
de maîtrise de <strong>TELUS</strong> (SAMT), representing approximately 620 team<br />
culture and contain market-driven and performance-based (bonus and<br />
members in the <strong>TELUS</strong> Quebec region, is in effect through March 2017.<br />
equity) components.<br />
Foreign operations – See Section 10.5 Process risks.<br />
We expect that we have adequate employee resources to cover<br />
ongoing retirement, and ready access to labour in Canada and,<br />
for contact centres and specific support functions, various locations<br />
internationally. We use a small number of external contractors<br />
or consultants.<br />
We have training, mentoring and development programs in place.<br />
For example, Connections – the <strong>TELUS</strong> women’s network is a national<br />
initiative that supports the advancement of business expertise,<br />
mentoring and networking opportunities for women.<br />
General safety risks – See Section 10.8 Health, safety and environment.<br />
Our brand and distribution<br />
We have a well-established and recognizable national brand (<strong>TELUS</strong>,<br />
the future is friendly ® ) that is supported by extensive advertising across<br />
all media.<br />
Our <strong>TELUS</strong> Health brand offers solutions for healthcare providers<br />
and consumers.<br />
Our Optik TV brand was launched in mid-2010.<br />
Our Koodo Mobile ® basic wireless brand and postpaid service were<br />
introduced in March 2008; and Koodo prepaid service launched<br />
in mid-2012 to complement Koodo postpaid services.<br />
Our sales and support distribution:<br />
. Wireless services are supported through a broad network<br />
of <strong>TELUS</strong>-owned and branded stores, an extensive distribution<br />
network of exclusive dealers and large third-party electronics<br />
retailers (e.g. Future Shop / Best Buy, Wal-Mart and London Drugs),<br />
as well as online self-serve applications and white label brands<br />
. <strong>TELUS</strong>-owned niche market channels include Black’s Photo stores<br />
and CAYA ® (come as you are) stores for lesbian, gay, bisexual and<br />
transgender customers, among others<br />
. Wireline residential services are supported through mass-marketing<br />
campaigns, client care telephone agents and online and TV-based<br />
self-serve applications<br />
. Business services across wireless and wireline are supported through<br />
<strong>TELUS</strong> sales representatives, SMB zones within certain corporate<br />
stores, 21 <strong>TELUS</strong> Business Stores, independent dealers and online<br />
self-serve applications for SMBs.<br />
56 . <strong>TELUS</strong> 2012 ANNUAL REPORT<br />
Competition overview – See Section 4.1.<br />
Competition risks – See Section 10.1.<br />
Regulatory risks (see Section 10.3) include:<br />
. Our competitors in the broadcasting distribution industry own<br />
broadcasting content, while we do not. In 2011, the CRTC enacted<br />
a vertical integration framework that set safeguards to ensure<br />
competition and prohibit TV offerings on an exclusive basis on all<br />
platforms. However, we believe that since these safeguards have<br />
not proven to be fully effective or been enforced in a timely manner,<br />
further safeguards are required.<br />
. <strong>TELUS</strong> is subject to restrictions on foreign ownership, which apply<br />
to telecommunications carriers with a Canadian revenue market<br />
share of more than 10%. Telecommunications carriers with a market<br />
share of less than 10% are permitted to be foreign owned and<br />
controlled. Relaxation of restrictions on foreign ownership does<br />
not apply to broadcasting distribution undertakings.
MANAGEMENT’S DISCUSSION & ANALYSIS: 4<br />
Resources Key operational risk categories and risk management<br />
Our technology, systems and properties<br />
<strong>TELUS</strong> is a highly complex technology-dependent company with a<br />
multitude of interconnected wireless and wireline telecommunications<br />
networks, IT systems and processes.<br />
Our real estate properties (owned or leased) include administrative<br />
office space, work centres and space for telecommunications<br />
equipment. Some buildings are constructed on leasehold land and<br />
the majority of radio towers are situated on lands or buildings held<br />
under leases or licences for varying terms.<br />
Network facilities are constructed under or along streets and highways,<br />
pursuant to rights-of-way granted by the owners of land such as<br />
municipalities and the Crown, or on freehold land owned by <strong>TELUS</strong>.<br />
Our intangible assets include wireless spectrum licensed from Industry<br />
Canada, which is essential to providing wireless services.<br />
<strong>TELUS</strong> International provides contact centre and business process<br />
and IT outsourcing by utilizing sophisticated on-site facilities including<br />
contact centre solutions, and by utilizing international data networks<br />
and reliable data centres with rigorous privacy and security standards.<br />
Global rerouting and geographic diversity are provided through facilities<br />
in North America, Central America, Europe and Asia.<br />
<strong>TELUS</strong> Health is uniquely positioned to facilitate integration of electronic<br />
health records from the home to the doctor’s office to the hospital,<br />
making critical health information available to care providers over secure<br />
wireline and wireless broadband networks.<br />
4.3 Liquidity and capital resources<br />
Capital structure financial policies<br />
Our objective when managing capital is to maintain a flexible<br />
capital structure that optimizes the cost and availability of capital<br />
at acceptable risk.<br />
In the management and definition of capital, we include Common<br />
Share and Non-Voting Share equity (excluding accumulated other<br />
comprehensive income), long-term debt (including any associated<br />
hedging assets or liabilities, net of amounts recognized in accumulated<br />
other comprehensive income), cash and temporary investments<br />
and securitized trade receivables.<br />
Financing and capital structure management plans<br />
Report on 2012 financing and capital structure management plans<br />
Pay dividends to the holders of <strong>TELUS</strong> Common Shares and Non-Voting Shares<br />
Technology risks (see Section 10.2):<br />
. Wireless spectrum congestion is being experienced in urban markets,<br />
requiring ongoing investments in technology and participation in<br />
spectrum auctions in 2013 and 2014<br />
. IP-based technology that is replacing legacy technology may not<br />
be feasible or economical in many areas for some time and we will<br />
need to support both systems. Convergence of wireless and wireline<br />
voice, Internet and video to a common IP-based application is<br />
very complex and could be accompanied by implementation errors<br />
and system instability.<br />
Process risks – See Section 10.5.<br />
Health, safety and environment risks (see Section 10.8):<br />
. Increasing adoption of wireless services and expanding wireless<br />
competition have resulted in more public scrutiny of, and opposition<br />
to, new radio towers. Public concerns include aesthetics and<br />
perceived health risks<br />
. Increasing stakeholder interest in environmental issues.<br />
See Section 10.9 Litigation and legal matters for risks associated<br />
with legal and regulatory compliance, defects in software and failures<br />
in data and transaction processing, and intellectual property and<br />
proprietary rights.<br />
Human-caused and natural threats to <strong>TELUS</strong> infrastructure and<br />
operations – See Section 10.10.<br />
We manage our capital structure and make adjustments to it<br />
in light of changes in economic conditions and the risk characteristics<br />
of the underlying assets. In order to maintain or adjust our capital<br />
structure, we may adjust the amount of dividends paid to holders of<br />
<strong>TELUS</strong> Corporation shares, purchase shares for cancellation pursuant<br />
to normal course issuer bids, issue new shares, issue new debt,<br />
issue new debt to replace existing debt with different characteristics<br />
and/or increase or decrease the amount of trade receivables sold<br />
to an arm’s-length securitization trust.<br />
We monitor capital utilizing a number of measures, including the<br />
net debt to EBITDA – excluding restructuring costs ratio and the dividend<br />
payout ratio. See Section 7.4 Liquidity and capital resource measures.<br />
Dividends declared in 2012 totalled $2.44 per share, or an increase of 10.7% over 2011. On February 13, 2013, a first quarter dividend of 64 cents per share<br />
was declared, payable on April 1, 2013, to shareholders of record at the close of business on March 11, 2013. The first quarter dividend for 2013 reflects<br />
an increase of 10.3% from the 58 cent per share dividend paid in April 2012. This is consistent with our dividend growth model discussed in 2013 financing<br />
and capital structure management plans, which follows.<br />
Use proceeds from securitized trade receivables (presented as Short-term borrowings), bank facilities, commercial paper and dividend<br />
reinvestment, as needed, to supplement free cash flow and meet other cash requirements<br />
Proceeds from securitized trade receivables were unchanged at $400 million throughout 2012.<br />
Commercial paper was reduced by $521 million in 2012 to $245 million at the end of the year.<br />
Cash provided by operating activities exceeded the use of cash for investing activities by more than $1.1 billion in 2012.<br />
<strong>TELUS</strong> 2012 ANNUAL REPORT . 57
Report on 2012 financing and capital structure management plans<br />
Maintain compliance with financial objectives, policies and guidelines<br />
Maintain a minimum $1 billion in unutilized liquidity – We had unutilized credit facilities of $1.8 billion at December 31, 2012, as well as $100 million<br />
additional availability under the trade receivables securitization program.<br />
Net debt to EBITDA excluding restructuring costs ratio of 1.5 to 2.0 times – Actual result of 1.6 times at December 31, 2012. See Section 7.4.<br />
Dividend payout ratio guideline of sustainable net earnings on a prospective basis – See Section 7.4.<br />
Preserve access to the capital markets at a reasonable cost by maintaining investment grade credit ratings in the range of BBB+ to A–,<br />
or the equivalent<br />
At February 27, 2013, investment grade credit ratings from the four rating agencies that cover <strong>TELUS</strong> were in the desired range.<br />
2013 financing and capital structure management plans<br />
At December 31, 2012, we had access to undrawn credit facilities<br />
of $1.8 billion and availability of $100 million under our trade receivables<br />
securitization program. We also have access to a shelf prospectus<br />
pursuant to which we can issue up to $2.0 billion of debt or equity.<br />
We believe our investment grade credit ratings contribute to reasonable<br />
access to capital markets to facilitate future debt issuance.<br />
Our long-term debt principal maturities are illustrated in the chart.<br />
At the end of 2012, 90% of <strong>TELUS</strong>’ total debt was on a fixed-rate basis<br />
and the weighted average term to maturity was approximately 5.5 years.<br />
We plan to generate free cash flow in 2013, which would be available<br />
to, among other things, pay dividends to our shareholders. We plan to<br />
continue with two dividend increases per year in 2013, normally declared<br />
in May and November, and expect the <strong>annual</strong> increase to continue to<br />
be circa 10%. The dividend growth model is not necessarily indicative of<br />
dividend increases declared beyond 2013. Notwithstanding this, dividend<br />
decisions will continue to be subject to the Board’s assessment and<br />
determination of our financial situation and outlook on a quarterly basis.<br />
The Board of Directors has approved a 10 percentage point increase in<br />
the dividend payout ratio guideline to a range of 65 to 75% of sustainable<br />
net earnings on a prospective basis for dividends declared in 2013<br />
onward. The change results from the non-cash effects of applying the<br />
amended accounting standard IAS 19 Employee benefits (2011) in 2013,<br />
Long-term debt principal maturities<br />
as at December 31, 2012 ($ millions)<br />
2025<br />
2024<br />
200<br />
2023<br />
500<br />
2022 249<br />
2021<br />
2020<br />
2019<br />
2018<br />
175<br />
2017<br />
700<br />
2016 600<br />
2015<br />
625<br />
2014<br />
2013<br />
300 245<br />
545<br />
Commercial paper<br />
The average term to maturity is 5.5 years.<br />
700<br />
58 . <strong>TELUS</strong> 2012 ANNUAL REPORT<br />
1,000<br />
1,000<br />
which include a reduction of Net income and earnings per share, as<br />
discussed in Section 8.2.<br />
We expect cash flows to be more than sufficient to meet current<br />
requirements and remain in compliance with our financial policies.<br />
However, these intentions could constrain our ability to invest in operations<br />
for future growth. As described in Section 1.5, payment of cash<br />
income taxes and funds required for the spectrum licence auction in<br />
the second half of 2013 are expected to reduce the after-tax cash flow<br />
otherwise available to return capital to our shareholders. If actual results<br />
are different from our expectations, there can be no assurance that<br />
we will not need to change our financing plans, or our intention to pay<br />
dividends according to the target payout guideline. For the related risk<br />
discussion, see Section 10.6 Financing and debt requirements.<br />
4.4 Disclosure controls and procedures<br />
and internal control over financial <strong>report</strong>ing<br />
Disclosure controls and procedures<br />
Disclosure controls and procedures are designed to provide reasonable<br />
assurance that all relevant information is gathered and <strong>report</strong>ed to senior<br />
management, including the President and Chief Executive Officer (CEO)<br />
and the Executive Vice-President and Chief Financial Officer (CFO),<br />
on a timely basis so that appropriate decisions can be made regarding<br />
public disclosure.<br />
The CEO and the CFO have evaluated the effectiveness of our disclosure<br />
controls and procedures related to the preparation of the MD&A<br />
and the Consolidated financial statements dated December 31, 2012.<br />
They have concluded that our disclosure controls and procedures<br />
were effective, at a reasonable assurance level, to ensure that material<br />
information relating to <strong>TELUS</strong> and its consolidated subsidiaries would<br />
be made known to them by others within those entities, particularly<br />
during the period in which the MD&A and the Consolidated financial<br />
statements contained in this <strong>report</strong> were being prepared.<br />
Internal control over financial <strong>report</strong>ing<br />
Internal control over financial <strong>report</strong>ing is designed to provide reasonable<br />
assurance regarding the reliability of financial <strong>report</strong>ing and the preparation<br />
of financial statements in accordance with IFRS-IASB and the requirements<br />
of the Securities and Exchange Commission in the United States, as applicable.<br />
<strong>TELUS</strong>’ CEO and CFO have assessed the effectiveness of our internal<br />
control over financial <strong>report</strong>ing at December 31, 2012, in accordance<br />
with Internal Control – Integrated Framework, issued by the Committee<br />
of Sponsoring Organizations of the Treadway Commission (COSO).
Based on this assessment, <strong>TELUS</strong>’ CEO and CFO have concluded<br />
that our internal control over financial <strong>report</strong>ing is effective at December<br />
31, 2012, and expect to certify <strong>TELUS</strong>’ <strong>annual</strong> filings with the U.S.<br />
Securities and Exchange Commission on Form 40-F, as required by<br />
the United States Sarbanes-Oxley Act, and with Canadian securities<br />
regulatory authorities.<br />
5 Discussion<br />
Our discussion in this section is qualified in its entirety by the Caution<br />
regarding forward-looking statements at the beginning of the MD&A.<br />
5.1 Selected <strong>annual</strong> information<br />
The selected information presented below has been derived from and<br />
should be read in conjunction with the audited Consolidated financial<br />
statements of <strong>TELUS</strong> dated December 31, 2012, and the audited<br />
Consolidated financial statements of <strong>TELUS</strong> dated December 31, 2011.<br />
Selected <strong>annual</strong> information<br />
of operations<br />
A discussion of consolidated and segmented operating performance<br />
Years ended December 31<br />
($ in millions, except per share amounts) 2012 2011 2010<br />
Operating revenues 10,921 10,397 9,792<br />
Net income<br />
Net income attributable to Common<br />
1,318 1,215 1,052<br />
Shares and Non-Voting Shares<br />
Net income per Common Share<br />
and Non-Voting Share<br />
1,318 1,219 1,048<br />
– Basic 4.05 3.76 3.27<br />
– Diluted<br />
Cash dividends declared per Common<br />
4.03 3.74 3.27<br />
Share and Non-Voting Share 2.44 2.205 2.00<br />
At December 31 ($ millions) 2012 2011 2010<br />
Total assets 20,445 19,931 19,624<br />
Current maturities of long-term debt 545 1,066 847<br />
Current portion of derivative liabilities<br />
Non-current financial liabilities<br />
– – 419<br />
(1)<br />
Provisions (2) 64 29 12<br />
Long-term debt 5,711 5,508 5,209<br />
Other long-term financial liabilities (2) 116 116 123<br />
5,891 5,653 5,344<br />
Deferred income taxes<br />
Owners’ equity<br />
Common Share and<br />
1,624 1,600 1,683<br />
Non-Voting Share equity 7,686 7,513 7,759<br />
Non-controlling interests – – 22<br />
(1) In our specific current instance, financial liabilities do not include liabilities that<br />
are excluded by definition (e.g. employee benefits and share-based compensation<br />
liabilities) or liabilities that do not involve a future outlay of economic resources<br />
(IAS 32.11) (e.g. deferred recognition of customer activation and connection fees;<br />
deferred gains on sale-leaseback of buildings).<br />
(2) Comparative information for 2011 and 2010 has been restated.<br />
2012 revenue mix –<br />
80% wireless and data<br />
34%<br />
19%<br />
MANAGEMENT’S DISCUSSION & ANALYSIS: 5<br />
Deloitte LLP, our auditor, has audited internal controls over financial<br />
<strong>report</strong>ing of <strong>TELUS</strong> Corporation at December 31, 2012.<br />
Changes in internal control over financial <strong>report</strong>ing<br />
There were no changes in internal control over financial <strong>report</strong>ing that<br />
have materially affected, or are reasonably likely to materially affect, our<br />
internal control over financial <strong>report</strong>ing.<br />
20%<br />
Wireless voice and other<br />
Wireless data<br />
Wireline voice and other<br />
Wireline data<br />
27%<br />
. Operating revenues:<br />
Combined wireless revenue<br />
and wireline data revenue<br />
represents approximately 80%<br />
of consolidated revenues in<br />
2012 (77% in 2011 and 74%<br />
in 2010). Legacy wireline voice<br />
revenues continue to be<br />
eroded by competition and<br />
technological substitution.<br />
. Net income includes income<br />
tax-related adjustments<br />
resulting from legislated income<br />
tax changes, settlements<br />
and tax reassessments for prior<br />
years, including any related<br />
interest. These adjustments<br />
positively impacted Net income by $12 million (four cents per share)<br />
in 2012, by $21 million (six cents per share) in 2011 and by $30 million<br />
(nine cents per share) in 2010.<br />
. Long-term debt, current maturities: The decrease in 2012 reflects<br />
the repayment of commercial paper, mainly with the proceeds of a<br />
$500 million long-term debt issue in December 2012, while repayment<br />
of $300 million of Notes in March 2012 was offset by reclassification<br />
of $300 million of Notes maturing in 2013. The increase in 2011<br />
included $300 million of Notes due in March 2012 and an increase<br />
in commercial paper, net of repayment of matured U.S. dollar Notes<br />
in June 2011.<br />
. Long-term debt, non-current portion: The increase in 2012 reflects<br />
the issue of $500 million of Notes in December 2012, partly offset by<br />
reclassification of $300 million of Notes that became current. The<br />
increase in 2011 reflected the $600 million Note issue in May 2011<br />
to partially fund the repayment of U.S. dollar Notes, net of the<br />
$300 mil lion Notes that became current.<br />
. Current portion of derivative liabilities: The decrease in 2011<br />
reflected settlement of cross-currency interest rate swap agreements<br />
associated with repayment of U.S. dollar Notes in June 2011.<br />
<strong>TELUS</strong> 2012 ANNUAL REPORT . 59
5.2 Summary of quarterly results, trends and fourth quarter recap<br />
Summary of quarterly results<br />
($ in millions,<br />
except per share amounts) 2012 Q4 2012 Q3 2012 Q2 2012 Q1 2011 Q4 2011 Q3 2011 Q2 2011 Q1<br />
Operating revenues<br />
Operating expenses<br />
2,851 2,774 2,665 2,631 2,690 2,622 2,554 2,531<br />
Goods and services purchased 1,330 1,222 1,152 1,116 1,316 1,178 1,134 1,098<br />
Employee benefits expense 574 534 515 506 500 476 470 447<br />
Depreciation and amortization 478 461 456 470 481 443 442 444<br />
2,382 2,217 2,123 2,092 2,297 2,097 2,046 1,989<br />
Operating income 469 557 542 539 393 525 508 542<br />
Financing costs 86 86 85 75 87 92 94 104<br />
Income before income taxes 383 471 457 464 306 433 414 438<br />
Income taxes 92 120 129 116 69 107 90 110<br />
Net income<br />
Net income attributable to<br />
Common Shares and<br />
291 351 328 348 237 326 324 328<br />
Non-Voting Shares<br />
Net Income per share<br />
291 351 328 348 246 325 321 327<br />
(1)<br />
– Basic 0.89 1.08 1.01 1.07 0.76 1.00 0.99 1.01<br />
– Diluted<br />
Cash dividends declared<br />
0.89 1.07 1.00 1.06 0.75 1.00 0.98 1.00<br />
per share (1)(2) Additional information<br />
0.64 0.61 – 1.19 0.58 0.55 0.55 0.525<br />
EBITDA (3) Restructuring costs<br />
included in EBITDA<br />
947 1,018 998 1,009 874 968 950 986<br />
and Operating income 19 3 13 13 16 3 12 4<br />
(1) Includes Common Shares and Non-Voting Shares.<br />
(2) Dividends declared in 2012 Q1 include the first quarter dividend (58 cents per share) and the second quarter dividend (61 cents per share).<br />
(3) EBITDA is equivalent to Operating income before depreciation and amortization expenses. See description in Section 11.1 EBITDA.<br />
Trends<br />
The consolidated revenue trend principally reflects: year-over-year growth<br />
in wireless network revenues generated from a growing subscriber<br />
base and higher ARPU; wireless equipment revenue that has generally<br />
increased year-over-year; and year-over-year growth in wireline data<br />
revenues driven by TV and high-speed Internet, which now more than<br />
offsets declining legacy wireline voice and other service and equipment<br />
revenues.<br />
Increasing wireless network revenue reflects growing data revenue<br />
(27% growth in 2012), partly offset by declining voice revenues (a 2.6%<br />
decrease in 2012). Data growth reflects increased use of data plans<br />
and growth in data consumption driven by ongoing smartphone adoption,<br />
as well as higher roaming revenues. Blended ARPU has increased<br />
year over year for nine consecutive quarters following several years of<br />
declines, as growth in data ARPU has more than offset the ongoing,<br />
but moderating, declines in voice ARPU. Some moderation in the data<br />
ARPU growth trend is the result of competitive pressures driving growth<br />
in the size of included-data buckets in rate plans and larger numbers<br />
of unlimited messaging rate plans, as well as off-loading of data traffic<br />
to increasingly available Wi-Fi hotspots. Voice ARPU declines have<br />
slowed in recent quarters; the moderation includes the effect of subscribers<br />
adopting new bundled and promotional rate plans with more<br />
included minutes.<br />
60 . <strong>TELUS</strong> 2012 ANNUAL REPORT<br />
Wireless equipment revenues have generally increased year over<br />
year due to ongoing growth in the proportion of more expensive smartphones<br />
and device upgrade revenues, offset by lower acquisition and<br />
retention volumes.<br />
There is some third and fourth quarter seasonality with respect<br />
to higher wireless subscriber additions, related acquisition costs and<br />
equipment sales, and higher retention costs due to contract renewals.<br />
These impacts can also typically be more pronounced around iconic<br />
device launches. Subscriber additions have typically been lowest in the<br />
first quarter. In addition, wireless ARPU has generally risen sequentially<br />
in the second and third quarters, and declined sequentially in the<br />
fourth and first quarters.<br />
The growth trend in wireline revenue reflects data revenue growth<br />
resulting from the continuing expansion of the <strong>TELUS</strong> TV subscriber<br />
base (up 33% in 2012), as well as increases in enhanced data, Internet<br />
and managed workplace revenues. Growth in Internet revenues reflects<br />
expansion of the <strong>TELUS</strong> high-speed Internet subscriber base (6.8%<br />
growth in 2012) as a result of bundling offers with Optik TV, as well as<br />
rate increases. A general trend of declining wireline voice revenues and<br />
NALs is due to substitution to wireless and IP-based services and applications,<br />
as well as competition from VoIP service providers (including<br />
cable-TV competitors), resellers and facilities-based com petitors. Shaw<br />
Communications Inc. increased its promotional activity and marketing<br />
incentives from late 2011 into the first quarter of 2012 to win back and
Revenue ($ millions)<br />
Q4 12<br />
Q3 12<br />
Q2 12<br />
Q1 12<br />
Q4 11<br />
Q3 11<br />
Q2 11<br />
Q1 11<br />
protect its subscriber base and subsequently reduced its promotional<br />
activity in the latter part of the first quarter. We observed a sequential<br />
increase in residential NAL losses in the first quarter of 2012 due to<br />
this increased promotional activity. Except for the first quarter of 2012,<br />
the rate of residential NAL losses has moderated from mid-2010 through<br />
the end of 2012 due to the positive impact of Optik TV and <strong>TELUS</strong><br />
high-speed Internet services and improved bundle offers. The general<br />
trend for business NALs is a decline due to increased com petition<br />
in the small and medium business (SMB) market, as well as conversion<br />
of voice lines to IP services. Business NALs increased in the first two<br />
quarters of 2011 due to the implementation of wholesale services for<br />
enterprise customers.<br />
The trend in the Goods and services purchased expense reflects<br />
higher content and support costs for the growing Optik TV subscriber<br />
base, as well as fourth quarter wireless expense seasonality<br />
described above.<br />
The trend in Employee benefits expense reflects compensation<br />
increases; increases in full-time equivalent (FTE) staff resulting from<br />
Income tax-related adjustments<br />
2,631<br />
2,554<br />
2,531<br />
2,851<br />
2,774<br />
2,665<br />
2,690<br />
2,622<br />
MANAGEMENT’S DISCUSSION & ANALYSIS: 5<br />
EBITDA ($ millions)<br />
several small acquisitions as well as targeted hiring to support Optik TV,<br />
business and wireless growth; and higher employee-related restructuring<br />
costs in 2012.<br />
The sequential increase in depreciation and amortization expenses<br />
in the fourth quarter of 2011 resulted from a $19 million write-down of<br />
goodwill in a foreign operation held for sale at December 31, 2011, and<br />
sold in 2012, as well as from additions to wireline and wireless broadband<br />
capital assets due to subscriber growth.<br />
Quarterly financing costs have generally decreased due to a lower<br />
effective interest rate from refinancing activities in the second quarter<br />
of 2011. Financing costs are net of varying amounts of interest income<br />
and include varying amounts of foreign exchange gains or losses.<br />
Notably, interest from the settlement of prior years’ income tax-related<br />
matters reduced financing costs by $10 million in the first quarter of 2012.<br />
The trends in Net income and basic EPS reflect the items noted<br />
above, as well as adjustments arising from legislated income tax changes,<br />
settlements and tax reassessments for prior years, including any related<br />
after-tax interest on reassessments.<br />
($ in millions,<br />
except EPS amounts) 2012 Q4 2012 Q3 2012 Q2 2012 Q1 2011 Q4 2011 Q3 2011 Q2 2011 Q1<br />
Net income impact 10 3 (11) 10 10 – 11 –<br />
EPS impact<br />
EPS excluding<br />
0.03 0.01 (0.03) 0.03 0.03 – 0.03 –<br />
income tax-related impacts 0.86 1.07 1.04 1.04 0.73 1.00 0.96 1.01<br />
Fourth quarter recap<br />
Results for the fourth quarter of 2012 were discussed in Management’s<br />
review of operations contained in our February 15, 2013, news release.<br />
. Consolidated Operating revenues increased by $161 million in the<br />
fourth quarter of 2012 when compared to the fourth quarter of 2011.<br />
Service and equipment revenues increased by $171 million due to<br />
factors discussed for full-year results in Section 1.3, while Other operating<br />
income decreased by $10 million mainly due to a decrease in<br />
recoveries of employee costs under eligible government-sponsored<br />
employment programs.<br />
. In the fourth quarter of 2012, Net income increased by $54 million<br />
and basic EPS increased by 13 cents when compared to the<br />
fourth quarter of 2011.<br />
Q4 12<br />
Q3 12<br />
Q2 12<br />
Q1 12<br />
Q4 11<br />
Q3 11<br />
Q2 11<br />
Q1 11<br />
EBITDA is a non-GAAP measure.<br />
874<br />
947<br />
968<br />
950<br />
986<br />
1,018<br />
998<br />
1,009<br />
. Cash provided by operating activities decreased by $39 million<br />
in the fourth quarter of 2012 when compared to the same period in<br />
2011, principally due to comparative changes in non-cash working<br />
capital and higher fourth quarter income tax payments net of<br />
refunds received.<br />
. Cash used by investing activities decreased by $34 million in the<br />
fourth quarter of 2012 when compared to the same period in 2011,<br />
mainly due to payment timing differences for capital assets and<br />
less spending on acquisitions.<br />
. Cash used by financing activities decreased by $77 million in the<br />
fourth quarter of 2012 when compared to the same period in 2011,<br />
mainly due to the successful $500 million long-term debt issue<br />
in December 2012 and use of the proceeds to reduce commercial<br />
paper, as well as a prior-year reduction in short-term borrowings,<br />
partly offset by higher dividend payments.<br />
<strong>TELUS</strong> 2012 ANNUAL REPORT . 61
5.3 Consolidated operations<br />
The following is a discussion of our consolidated financial performance.<br />
We discuss the performance of our segments in Section 5.4 Wireless<br />
segment, Section 5.5 Wireline segment and Section 7.2 Cash used by<br />
investing activities – capital expenditures.<br />
Operating revenues<br />
Years ended December 31 ($ millions) 2012 2011 Change<br />
Service 10,079 9,606 4.9%<br />
Equipment 773 719 7.5%<br />
Service and equipment revenues 10,852 10,325 5.1%<br />
Other operating income 69 72 (4.2)%<br />
10,921 10,397 5.0%<br />
Operating revenues increased by $524 million in 2012, as follows:<br />
. Service revenues increased by $473 million in 2012. Wireless network<br />
and other service revenue increased by $369 million or 7.3%, principally<br />
due to growth in wireless data network revenues that reflects<br />
subscriber growth, accelerated smartphone adoption and greater<br />
roaming volumes, which exceeded the decline in voice network<br />
revenue. Wireline service revenue increased by $104 million or 2.3%,<br />
as growth in data services, including Optik TV, Internet and managed<br />
workplace services, exceeded the decline in legacy voice local,<br />
long distance and other services.<br />
. Equipment revenues increased by $54 million in 2012, primarily<br />
reflecting growth in wireline data equipment sales, and to a lesser<br />
extent, an increase in wireless equipment revenues.<br />
. Other operating income is composed of regulatory high cost<br />
serving area subsidies, recovery of employee costs under eligible<br />
government-sponsored programs and recognition of amounts<br />
from the regulatory price cap deferral account, as well as any investment<br />
gains, income or losses, and any gains or losses on disposal<br />
of real estate assets.<br />
Other operating income decreased by $3 million in 2012.<br />
A $9 million gain on land contributed to the <strong>TELUS</strong> Garden residential<br />
real estate partnership in 2012 and larger drawdowns from<br />
the regulatory price cap deferral account for provisioning broadband<br />
Internet service to a number of qualifying rural and remote<br />
communi ties were more than offset by the $17 million non-cash<br />
re-measurement gain on Transactel (Barbados) Inc. in 2011. In respect<br />
of the gain on land contributed to the <strong>TELUS</strong> Garden residential<br />
partnership, the gain was $18 million in full and recognition of<br />
$9 million has been deferred until ownership of the condominium<br />
units is transferred after construction is completed.<br />
62 . <strong>TELUS</strong> 2012 ANNUAL REPORT<br />
Operating expenses<br />
Years ended December 31 ($ millions) 2012 2011 Change<br />
Goods and services purchased 4,820 4,726 2.0%<br />
Employee benefits expense 2,129 1,893 12.5%<br />
Depreciation 1,422 1,331 6.8%<br />
Amortization of intangible assets 443 479 (7.5)%<br />
8,814 8,429 4.6%<br />
Consolidated operating expenses increased by $385 million in 2012.<br />
. Goods and services purchased increased by $94 million in 2012,<br />
mainly due to increases in content and support costs to grow and<br />
manage Optik TV services, higher costs of sales related to growth in<br />
wireline data equipment revenues, and costs to support a wireless<br />
subscriber base that is now 4.5% larger. These increases were partly<br />
offset by a decrease in restructuring provisions related to real estate<br />
consolidation.<br />
. Employee benefits expense increased by $236 million in 2012.<br />
This reflects an increase in wage and salary expenses of $162 million<br />
due to compensation increases, full inclusion in 2012 of operations<br />
of certain <strong>TELUS</strong>-branded wireless dealership businesses acquired<br />
throughout 2011, smaller acquisitions in 2012, hiring over the past<br />
year to support the growing Optik TV subscriber base, and one additional<br />
month of expenses in 2012 from the consolidation of Transactel<br />
operations since February 2011. Recoveries in respect of employee<br />
defined benefit pension plans decreased by $23 million and employeerelated<br />
restructuring costs increased by $25 million. Share-based<br />
compensa tion increased by $23 million as expense recoveries in 2011<br />
associated with the net-cash settlement feature were non-recurring.<br />
These increases were partly offset by a $5 million increase in<br />
capitalized labour costs.<br />
. Depreciation expense increased by $91 million in 2012, mainly due<br />
to ongoing network investments to support growth, as well as retirements,<br />
partly offset by an increase in fully depreciated computer<br />
and digital cell site equipment.<br />
. Amortization of intangible assets decreased by $36 million in 2012,<br />
mainly due to an increase in longer-life assets and absence in 2012 of<br />
a $19 million fourth quarter 2011 write-down of a foreign operation’s<br />
goodwill, whose assets were held for sale at December 31, 2011.<br />
The decrease was partly offset by retirements, further investment<br />
in network and other software assets, and acquisitions.<br />
Operating income<br />
Years ended December 31 ($ millions) 2012 2011 Change<br />
Operating income 2,107 1,968 7.1%<br />
Operating income increased by $139 million in 2012 when compared to<br />
2011. The increase was primarily due to growth of $281 million in wireless<br />
EBITDA, resulting from an increase in data network revenue and higher<br />
margins, partly offset by an $87 million decline in wireline EBITDA as<br />
wireline data revenue growth was more than offset by ongoing declines<br />
in higher-margin legacy voice revenues. In addition, total depreciation<br />
and amortization expenses increased.
Operating income ($ millions)<br />
12 2,107<br />
10 11<br />
09 10<br />
08 10<br />
10 11<br />
09 10<br />
08 10 Loss on redemption of debt<br />
1,968<br />
1,909<br />
Interest expense ($ millions)<br />
12 355<br />
Financing costs<br />
Years ended December 31 ($ millions) 2012 2011 Change<br />
Interest expense 355 389 (8.7)%<br />
Interest income and foreign exchange (23) (12) (91.7)%<br />
332 377 (11.9)%<br />
Financing costs decreased by $45 million in 2012. Interest expense<br />
decreased by $34 million in 2012 primarily due to a lower effective interest<br />
rate. The lower effective interest rate resulted mainly from refinancing<br />
activities in the second quarter of 2011, when the remaining U.S. dollar<br />
Notes matured on June 1 and associated cross-currency interest rate<br />
swap agreements were settled (combined effective interest rate of 8.5%),<br />
funded by a May 2011, 3.65% debt issue and low-rate commercial<br />
paper issues.<br />
Interest income and foreign exchange includes interest income for<br />
the settlement of income tax-related matters of $14 million in 2012 and<br />
$2 million in 2011. The remaining amount in each year was primarily<br />
foreign exchange gains.<br />
Income taxes<br />
Years ended December 31<br />
($ millions, except tax rates) 2012 2011 Change<br />
Basic blended income tax expense<br />
at weighted average statutory<br />
income tax rates<br />
Tax rate differential on, and<br />
consequential adjustments from,<br />
reassessments of prior years’<br />
456 433 5.3%<br />
tax issues<br />
Revaluation of deferred income tax<br />
liability to reflect future statutory<br />
(13) (20) n/m<br />
income tax rates 12 (37) n/m<br />
Share option award compensation 2 (1) n/m<br />
Other – 1 n/m<br />
Blended federal and provincial<br />
457 376 21.5%<br />
statutory tax rates (%) 25.7 27.2 (1.5) pts.<br />
Effective tax rates (%) 25.7 23.6 2.1 pts.<br />
389<br />
475<br />
52<br />
527<br />
MANAGEMENT’S DISCUSSION & ANALYSIS: 5<br />
Basic blended statutory income taxes increased by $23 million in 2012<br />
due to a 12% increase in pre-tax income, partly offset by a lower blended<br />
statutory income tax rate. The effective tax rate in 2011 was lower than the<br />
statutory tax rates due to revaluations of deferred income tax liabilities;<br />
the tax rate differential on, and consequential adjustments from, reassessments<br />
of prior years’ tax issues; and other taxable income differences.<br />
Revaluation of deferred income tax liabilities in 2012 includes the effect<br />
of Ontario’s elimination of previously enacted corporate income tax rate<br />
reductions, while in 2011 an overall declining tax rate environment existed.<br />
Net income ($ millions)<br />
12 1,318<br />
12 10<br />
11 09<br />
11 08<br />
10 07<br />
10 06<br />
1,052<br />
10 Net income Income before income taxes<br />
Comprehensive income<br />
1,215<br />
1,387<br />
1,591<br />
1,775<br />
Years ended December 31 ($ millions) 2012 2011 Change<br />
Net income<br />
Other comprehensive income (loss):<br />
Items that may be subsequently<br />
1,318 1,215 8.5%<br />
reclassified to income<br />
Item never subsequently<br />
29 10 n/m<br />
reclassified to income (400) (851) 53.0%<br />
Comprehensive income 947 374 153.2%<br />
Comprehensive income increased by $573 million in 2012.<br />
. Net income increased by $103 million (see Section 1.3 Highlights).<br />
. Other comprehensive income – items that may be subsequently<br />
reclassified to income are composed of changes in unrealized fair<br />
value of derivatives designated as cash flow hedges and foreign<br />
currency translation adjustments arising from translating financial<br />
statements of foreign operations in both 2012 and 2011, as well as a<br />
$33 million after-tax increase in the unrealized fair value of availablefor-sale<br />
venture capital investments in 2012.<br />
. Other comprehensive loss – item never subsequently reclas sified<br />
to income is in respect of after-tax actuarial losses (or gains) on<br />
defined benefit plans, which are likely to fluctuate from period to<br />
period, and arose from decreases in the defined benefit pension plan<br />
discount rate, partly offset by funding and return on plan assets.<br />
Effective with the fiscal year beginning January 1, 2013, application<br />
of the amended accounting standard IAS 19 Employee benefits (2011)<br />
will result in retrospective changes to the Consolidated statements<br />
of income and other comprehensive income. Changes to Net income<br />
will be exactly offset by changes in Other comprehensive loss – Item<br />
never subsequently reclassified to income. See Section 8.2 Accounting<br />
policy developments.<br />
<strong>TELUS</strong> 2012 ANNUAL REPORT . 63
5.4 Wireless segment<br />
Wireless segment revenues increased by $386 million in 2012.<br />
Operating revenues – wireless segment<br />
Years ended December 31<br />
($ in millions, except ratios) 2012 2011 Change<br />
Voice 3,241 3,326 (2.6)%<br />
Data 2,126 1,678 26.7%<br />
Network revenue 5,367 5,004 7.3%<br />
Equipment and other 478 458 4.4%<br />
External operating revenues 5,845 5,462 7.0%<br />
Intersegment revenue 41 38 7.9%<br />
Total operating revenues 5,886 5,500 7.0%<br />
Data revenue to network revenue (%) 40 34 6 pts.<br />
Network revenue increased by $363 million in 2012.<br />
. Voice revenue decreased by $85 million in 2012 due to the ongoing,<br />
but moderating, trend of declining voice ARPU. The moderation is due<br />
to subscriber adoption of new bundled and promotional rate plans<br />
with more included minutes, rate increases for certain out-of-bucket<br />
minutes implemented in the fourth quarter of 2012, and a reduction in<br />
billing credits resulting from our focus on Clear & Simple initiatives<br />
to improve the customer experience. The decline in voice ARPU was<br />
due to the growing volume of mobile Internet connection devices and<br />
tablet subscriptions where there are no voice revenues, greater use<br />
of included-minute plans for both local and long distance calling, and<br />
greater penetration of the lower ARPU Koodo brand, partly offset<br />
by growth in roaming volumes and rate increases for out-of-bucket<br />
minutes. Voice ARPU was $36.39 in 2012, reflecting a decrease of<br />
$2.81 or 7.2%. Average minutes of use were up 1.2% in 2012.<br />
. Data revenue increased by $448 million in 2012. Higher data revenues<br />
reflect subscriber growth, strength in smartphone service revenues<br />
and text messaging driven by greater smartphone penetration, an<br />
increase in data roaming revenues due to greater volumes despite<br />
lower roaming prices, wider adoption of data plans, growth in mobile<br />
Internet connection devices and tablets, and higher rates for payper-use<br />
text messaging, as well as a reduction in billing credits. Data<br />
ARPU was $24.00 in 2012, reflecting an increase of $4.10 or 21%<br />
from 2011.<br />
. Blended ARPU was $60.39 in 2012, up $1.29 or 2.2% from 2011,<br />
mainly due to growth in roaming and data usage, partly offset<br />
by declining voice ARPU. Blended ARPU has increased year over<br />
year for nine consecutive quarters.<br />
. Gross subscriber additions decreased by 152,000 or 8.5% in 2012.<br />
Heightened competitive intensity was reflected in price competition<br />
for devices, more promotional rate plan offers, and our elimination<br />
of activation and renewal fees, as well as port-in credits and in-store<br />
credits from both established national com petitors and newer entrants.<br />
Postpaid gross additions decreased by 112,000 or 8.7%, partly due<br />
to heightened competitive intensity as well as disci plined acquisition<br />
spending and tightened credit policies. Prepaid gross additions<br />
decreased by 40,000 or 7.8%. The launch of prepaid services under<br />
the Koodo brand in August 2012 slowed the decline in prepaid<br />
activations from earlier in the year.<br />
64 . <strong>TELUS</strong> 2012 ANNUAL REPORT<br />
. Net subscriber additions decreased by 38,000 or 10% in 2012.<br />
Postpaid net additions decreased by 11,000 or 2.6%. Postpaid net<br />
additions in the first half of 2012 and during 2011 were impacted<br />
by the loss of subscribers from a federal government wireless contract<br />
to a low bid by an established national competitor. While postpaid<br />
gross additions decreased by 112,000, a net reduction of 11,000 postpaid<br />
net additions has been achieved by strong performance on<br />
reducing rates of postpaid churn. Prepaid net subscriber losses<br />
were 83,000 in 2012, as compared to net losses of 56,000 in 2011.<br />
Prepaid subscriber losses reflect conversions to postpaid as part<br />
of retention efforts, as well as heightened competitive intensity in the<br />
lower-value market segments and our choice to not match certain<br />
competitive offers. Prepaid subscriber losses moderated after the<br />
August 2012 launch of prepaid services under the Koodo brand.<br />
. The blended monthly wireless subscriber churn rate was 1.47% in<br />
2012, as compared to 1.68% in 2011, while the postpaid churn rate<br />
was 1.09% in 2012, down from 1.31% in 2011. Churn rates in 2011<br />
included effects from the loss of a federal government wireless<br />
contract, however, improved churn rates in 2012 can be attributed<br />
to our continued focus on the customer experience, including the<br />
Clear and Simple Device Upgrade program and elimination of activation<br />
and renewal fees, which makes it easy for postpaid clients to<br />
upgrade to new devices before the end of their contracts, as well as<br />
our focus on retaining high-value clients, and tightened credit policies.<br />
. The smartphone adoption rate was at 76% of postpaid gross<br />
additions in the fourth quarter of 2012, as compared to 74% in the<br />
fourth quarter of 2011. Smartphone subscribers represented 66%<br />
of the postpaid subscriber base at December 31, 2012, as compared<br />
to 53% one year earlier. Smartphone subscribers generate significantly<br />
higher ARPU and have lower rates of churn than those with<br />
messaging and voice-only devices, but the costs of acquisition<br />
and retention are higher because of the large device subsidies for<br />
multiple-year contract sales or renewals. A greater proportion of<br />
smartphones in the sales mix is expected to continue to positively<br />
impact future data revenue growth, ARPU and churn rates, which<br />
increase expected lifetime revenue. The greater proportion of<br />
smartphones is also expected to increase future costs of retention<br />
and network usage, and will require ongoing network capacity<br />
investments.<br />
Equipment and other revenues increased by $20 million in 2012<br />
when compared to 2011. This was principally due to growth in wireless<br />
equipment revenues resulting from a greater proportion of smartphones<br />
in the sales mix driving higher average handset prices, partly offset by<br />
lower acquisition and retention volumes and the elimination of activation<br />
and renewal fees. Retention volumes decreased in 2012 as significant<br />
numbers of postpaid clients upgraded their devices in 2011 under the<br />
Clear and Simple Device Upgrade program.<br />
Intersegment revenue represents services provided by the wireless<br />
segment to the wireline segment and is eliminated upon consolidation<br />
along with the associated expense in the wireline segment.
Wireless operating indicators<br />
At December 31 2012 2011 Change<br />
Subscribers (000s):<br />
Postpaid 6,543 6,130 6.7%<br />
Prepaid 1,127 1,210 (6.9)%<br />
Total 7,670 7,340 4.5%<br />
Postpaid proportion of subscriber base (%) 85.3 83.5 1.8 pts.<br />
Total population coverage (1) (millions) 34.7 34.4 0.9%<br />
HSPA+ population coverage (2) (millions) 34.3 33.8 1.5%<br />
LTE population coverage (2) (millions) 23.9 – n/m<br />
Years ended December 31 2012 2011 Change<br />
Subscriber gross additions (000s):<br />
Postpaid 1,174 1,286 (8.7)%<br />
Prepaid 472 512 (7.8)%<br />
Total 1,646 1,798 (8.5)%<br />
Subscriber net additions (000s):<br />
Postpaid 414 425 (2.6)%<br />
Prepaid (83) (56) (48.2)%<br />
Total 331 369 (10.3)%<br />
ARPU (3) ($)<br />
Churn, per month<br />
60.39 59.10 2.2%<br />
(3) (%)<br />
Blended 1.47 1.68 (0.21) pts.<br />
Postpaid<br />
Average monthly minutes<br />
1.09 1.31 (0.22) pts.<br />
of use per subscriber (MOU) 336 332 1.2%<br />
COA (4) per gross subscriber addition (3) ($) 408 386 5.7%<br />
Retention spend to network revenue (3) (%) 11.4 12.4 (1.0) pts.<br />
(1) Including roaming/resale and network access agreements.<br />
(2) Including network access agreements.<br />
(3) See Section 11.3 Definitions of key wireless operating indicators. These are industry<br />
measures useful in assessing operating performance of a wireless company, but are<br />
not measures defined under IFRS-IASB.<br />
(4) Cost of acquisition.<br />
Wireless segment expenses increased by $105 million in 2012.<br />
Operating expenses – wireless segment<br />
Years ended December 31 ($ in millions) 2012 2011 Change<br />
Equipment sales expenses 1,257 1,237 1.6%<br />
Network operating expenses 674 662 1.8%<br />
Marketing expenses<br />
General and administration (G&A) expenses:<br />
431 464 (7.1)%<br />
Employee benefits 596 540 10.4%<br />
Other 461 411 12.2%<br />
Total operating expenses 3,419 3,314 3.2%<br />
Equipment sales expenses increased by $20 million in 2012, due to<br />
higher per-unit costs resulting from an increase in the proportion of smart-<br />
phones purchased by existing clients and new subscribers, including<br />
strong demand for the iPhone 5, partly offset by lower acquisition and<br />
retention volumes. Retention volumes decreased due to successful<br />
retention efforts in 2011.<br />
MANAGEMENT’S DISCUSSION & ANALYSIS: 5<br />
. Retention costs as a percentage of network revenue were 11.4% in<br />
2012, or a decrease of 1.0 percentage point, from 2011. The decrease<br />
in retention costs as a percentage of network revenue was primarily<br />
due to lower retention volumes resulting from strong retention efforts<br />
in 2011, as postpaid clients took advantage of the Clear and Simple<br />
Device Upgrade program. The decrease also resulted from strong<br />
network revenue growth, as well as commission savings from <strong>TELUS</strong>branded<br />
wireless dealership acquisitions. These savings were partly<br />
offset by higher per-unit subsidy costs as a larger number of clients<br />
migrated to more costly smartphones, including the iPhone 5.<br />
. COA per gross subscriber addition increased by $22 in 2012. The<br />
increase was primarily due to higher per-unit subsidy costs driven by<br />
a greater proportion of smartphones in the mix and competitive pressures<br />
on handset pricing that drove deeper subsidies, as well as<br />
higher commission rates to support a growing number of higher-value<br />
smartphone devices, partly offset by reductions in advertising and<br />
promotions expenses.<br />
Network operating expenses increased by $12 million in 2012, resulting<br />
from higher roaming costs due to larger volumes despite lower roaming<br />
rates, as well as increases in operating costs associated with LTE and<br />
HSPA network expansion, offset by lower negotiated revenue-share and<br />
licensing costs.<br />
Marketing expenses decreased by $33 million in 2012 due to a reduction<br />
in commissions as a result of <strong>TELUS</strong>-branded wireless dealership business<br />
acquisitions, as well as reductions in advertising and promotions<br />
expenses.<br />
Total G&A expenses increased by $106 million in 2012.<br />
. Employee benefits expense increased by $56 million due to an<br />
increase in compensation expenses, including higher performance<br />
bonus accruals and the full inclusion of certain <strong>TELUS</strong>-branded<br />
wireless dealership businesses acquired throughout 2011, higher<br />
employee-related restructuring costs, and for the full year, hiring<br />
to support the growing wireless subscriber base, partly offset by<br />
increased capitalization of labour costs.<br />
. Other G&A expenses increased by $50 million, mainly due to<br />
higher costs to support the growing subscriber base, restructuring<br />
costs in 2012 associated with administrative office consolidation,<br />
and $11 million of one-time supplier credits in the second quarter<br />
of 2011.<br />
EBITDA – wireless segment<br />
Years ended December 31<br />
($ millions, except margins) 2012 2011 Change<br />
EBITDA 2,467 2,186 12.9%<br />
EBITDA to network revenue (%) 46.0 43.7 2.3 pts.<br />
EBITDA margin (%) 41.9 39.7 2.2 pts.<br />
The wireless segment EBITDA increased by $281 million in 2012 when<br />
compared to 2011. The increase reflects strong data revenue growth<br />
and overall expense management, which resulted in a 2.3 percentage<br />
point increase in flow through of network revenue to EBITDA, and<br />
improved EBITDA margins.<br />
<strong>TELUS</strong> 2012 ANNUAL REPORT . 65
5.5 Wireline segment<br />
Total wireline segment revenues increased by $147 million in 2012 when<br />
compared to 2011.<br />
Operating revenues – wireline segment<br />
Years ended December 31 ($ in millions) 2012 2011 Change<br />
Data service and equipment 2,896 2,578 12.3%<br />
Voice local service 1,416 1,514 (6.5)%<br />
Voice long distance service 425 477 (10.9)%<br />
Other services and equipment 272 296 (8.1)%<br />
Service and equipment revenues 5,009 4,865 3.0%<br />
Other operating income 67 70 (4.3)%<br />
External operating revenues 5,076 4,935 2.9%<br />
Intersegment revenue 170 164 3.7%<br />
Total operating revenues 5,246 5,099 2.9%<br />
Service and equipment revenues increased by $144 million in 2012<br />
when compared to 2011.<br />
. Data service and equipment revenues increased by $318 million.<br />
The increase resulted principally from: (i) continued strong subscriber<br />
growth in Optik TV services and rate increases for the basic TV<br />
service and theme packs; (ii) growth in Internet and enhanced data<br />
services, reflecting implementation of large enterprise deals, the<br />
pull-through effect of bundle offers including <strong>TELUS</strong> high-speed<br />
Internet services that enable us to win and retain subscribers, and<br />
high-speed Internet rate increases; (iii) increases in data equipment<br />
sales to business customers; and (iv) an increase in managed<br />
workplace revenues resulting from the provision of business process<br />
outsourcing services for business customers.<br />
66 . <strong>TELUS</strong> 2012 ANNUAL REPORT<br />
Wireline operating indicators<br />
At December 31 (000s) 2012 2011 Change<br />
Internet subscribers<br />
High-speed 1,326 1,242 6.8%<br />
Dial-up 33 44 (25.0)%<br />
Total 1,359 1,286 5.7%<br />
<strong>TELUS</strong> TV subscribers 678 509 33.2%<br />
Years ended December 31 (000s) 2012 2011 Change<br />
Internet subscriber<br />
net additions (losses)<br />
High-speed 84 75 12.0%<br />
Dial-up (11) (18) 38.9%<br />
Total<br />
<strong>TELUS</strong> TV subscriber<br />
73 57 28.1%<br />
net additions 169 196 (13.8)%<br />
. We provide Optik TV and high-speed Internet services in B.C.,<br />
Alberta and Eastern Quebec, as well as <strong>TELUS</strong> Satellite TV in B.C.<br />
and Alberta. Net additions of high-speed Internet subscribers were<br />
strong in 2012 due to continued loading for bundled TV and Internet.<br />
Net additions of <strong>TELUS</strong> TV subscribers were lower in 2012 due<br />
to lower growth in new TV subscribers, partly offset by significantly<br />
lower churn rates.<br />
. Voice local service revenue decreased by $98 million in 2012. The<br />
decrease reflects a continuing decline in basic access and enhanced<br />
voice service revenues caused by technological substitution to<br />
wireless and Internet-based services, competition for residential<br />
subscribers, the consequent decline in local residential access lines<br />
and matching of competitive offers and service bundle offers in<br />
deregulated markets. The decrease also reflects the decline in business<br />
voice lines from technological substitution to data services and<br />
competitor activity, including price reductions. These factors were<br />
partly offset by increases in monthly local rates in the third quarters<br />
of 2012 and 2011.
Wireline operating indicators<br />
At December 31 (000s) 2012 2011 Change<br />
Network access lines (NALs)<br />
Residential 1,767 1,915 (7.7)%<br />
Business 1,639 1,678 (2.3)%<br />
Total 3,406 3,593 (5.2)%<br />
Years ended December 31 (000s) 2012 2011 Change<br />
Net NAL losses<br />
Residential (148) (131) (13.0)%<br />
Business (39) (15) n/m<br />
Total (187) (146) (28.1)%<br />
We provide residential voice services in B.C., Alberta and Eastern<br />
Quebec. Residential NALs continue to be affected by wireless and<br />
Internet-based technological substitution for local services, as well<br />
as promotional activity by primary cable-TV competitors. Residential<br />
NAL losses increased by 17,000 as compared to 2011, largely due<br />
to heavily discounted home phone promotions from Shaw in B.C. and<br />
Alberta that began in November 2011, continued into the early part<br />
of the first quarter of 2012 and subsequently moderated.<br />
We provide business network access services nationally. Business<br />
NAL losses reflect the continuing trend of increased competition in<br />
the SMB market and conversion of voice lines to more efficient IP<br />
services, as growth in data services such as private IP networks is not<br />
measured by business NAL counts and conversion of legacy voice<br />
services to IP services causes a decrease in business NALs. Of note,<br />
2011 business NAL losses were reduced by the implementation of<br />
voice and data services for wholesale customers.<br />
. Voice long distance service revenue decreased by $52 million<br />
in 2012. The decrease reflects ongoing industry-wide price and<br />
bundling competition, losses of local subscribers, and technological<br />
substitution to wireless and OTT Internet-based services.<br />
. Other service and equipment revenues decreased by $24 million<br />
in 2012 mainly due to a decline in the sales of voice equipment.<br />
Other operating income decreased by $3 million in 2012. A $9 million<br />
gain on land contributed to the <strong>TELUS</strong> Garden residential real estate<br />
partnership in 2012 and larger drawdowns from the regulatory price cap<br />
deferral account for provisioning broadband Internet service to a number<br />
of qualifying rural and remote communities were more than offset by<br />
the $17 million non-cash re-measurement gain on Transactel in 2011,<br />
and a reduction in the recoveries of employee costs under eligible<br />
government-sponsored programs in 2012.<br />
Intersegment revenue represents services provided by the wireline<br />
segment to the wireless segment and is eliminated upon consolidation<br />
together with the associated expense in the wireless segment.<br />
MANAGEMENT’S DISCUSSION & ANALYSIS: 5<br />
Operating expenses – wireline segment<br />
Years ended December 31 ($ millions) 2012 2011 Change<br />
Goods and services purchased 2,208 2,154 2.5%<br />
Employee benefits expense 1,533 1,353 13.3%<br />
Total operating expenses 3,741 3,507 6.7%<br />
Total operating expenses increased by $234 million in 2012.<br />
. Goods and services expenses increased by $54 million in 2012,<br />
including higher content and support costs related to <strong>TELUS</strong> TV<br />
growth (33% increase in the subscriber base in 2012), and to a lesser<br />
extent, increases in advertising and promotions expenses as a result<br />
of heightened competitive intensity in the first half of the year, partly<br />
offset by a decrease in external labour costs, reductions in office<br />
building lease expenses resulting from administrative office consolidation<br />
efforts and higher related restructuring costs in the prior year.<br />
. Employee benefits expense increased by $180 million in 2012.<br />
This resulted from increases in compensation, additions to full-time<br />
equivalent staff supporting growing international business process<br />
outsourcing services for business clients, hiring to support the<br />
growing TV subscriber base, a decrease in the employee defined<br />
benefit pension recovery, higher employee-related restructuring<br />
costs, lower capitalization of labour costs, a one-time benefit liability<br />
recovery recognized in 2011 and one month of additional expenses<br />
in 2012 from the consolidation of Transactel operations beginning in<br />
February 2011.<br />
EBITDA – wireline segment<br />
Years ended December 31 ($ millions) 2012 2011 Change<br />
EBITDA<br />
Deduct gain net of equity losses<br />
related to the <strong>TELUS</strong> Garden<br />
1,505 1,592 (5.5)%<br />
residential real estate partnership (7) – n/m<br />
Deduct Transactel gain – (17) n/m<br />
Adjusted EBITDA 1,498 1,575 (4.9)%<br />
Adjusted EBITDA margin (%) 28.6 31.0 (2.4) pts.<br />
Wireline EBITDA decreased by $87 million in 2012, while adjusted<br />
EBITDA decreased by $77 million. Decreases in adjusted EBITDA and<br />
adjusted EBITDA margins reflect declines in higher-margin legacy voice<br />
services, partly offset by growth in data services such as <strong>TELUS</strong> highspeed<br />
Internet and Optik TV as well as lower-margin equipment sales.<br />
Notably, EBITDA for the fourth quarter of 2012 increased year over year<br />
by $4 million. This resulted from improving high-speed Internet and<br />
Optik TV margins due to price increases, subscriber growth and a lower<br />
cost of subscriber acquisition.<br />
<strong>TELUS</strong> 2012 ANNUAL REPORT . 67
6 Changes<br />
Financial position at December 31 Change Change<br />
($ in millions) 2012 2011 ($ millions) (%) Explanation of changes<br />
Current assets<br />
Cash and temporary investments, net 107 46 61 133 See Section 7: Liquidity and capital resources<br />
Accounts receivable 1,541 1,428 113 8 Results mainly from an increase in days outstanding<br />
in wireline receivables, wireline revenue growth and an<br />
increase in wireless postpaid subscribers and ARPU,<br />
partly offset by a decrease in receivables from<br />
wireless dealers and a decrease in days outstanding<br />
in wireless postpaid receivables<br />
Income and other taxes receivable 25 66 (41) (62) Reflects refunds received and additional<br />
recoveries recorded<br />
Inventories 350 353 (3) (1) Mainly due to a decrease in work-in-progress for wireline<br />
business customers, partly offset by a small increase<br />
in wireless handset inventory<br />
Prepaid expenses 178 144 34 24 Includes prepayments for construction of the<br />
Kamloops IDC<br />
Derivative assets 9 14 (5) (36) –<br />
Current liabilities<br />
in financial position<br />
A discussion of changes in the Consolidated statements of financial position<br />
for the year ended December 31, 2012<br />
Short-term borrowings 402 404 (2) – Amounts in both periods are composed of $400 million<br />
received by <strong>TELUS</strong> from an arm’s-length securitization trust<br />
in respect of securitized trade receivables (see Section 7.6),<br />
and minor amounts drawn on credit facilities<br />
Accounts payable and accrued liabilities 1,511 1,419 92 6 Includes increases in payroll-related liabilities including<br />
variable compensation, higher payables for wireless<br />
handset inventory and increases due to higher capital<br />
expenditures<br />
Income and other taxes payable 102 25 77 n/m Reflects differences in current income tax expense<br />
and instalment payments<br />
Dividends payable 208 188 20 11 Primarily an increase in the dividend rate<br />
Advance billings and customer deposits 703 655 48 7 Primarily an increase in wireless revenue billed in<br />
advance due to growth in postpaid subscribers, as well<br />
as an increase in advance billings for wireline business<br />
and Optik TV services<br />
Provisions 49 88 (39) (44) Includes payment of certain amounts in dispute and<br />
reclassification of $17 million of restructuring provisions<br />
from current to non-current<br />
Current maturities of long-term debt 545 1,066 (521) (49) Reflects a $521 million decrease in commercial paper and<br />
repayment of $300 million of 4.5% Notes in March 2012,<br />
net of $300 million of 5.0% Notes due June 2013<br />
reclassified from Long-term debt<br />
Working capital (1,310) (1,794) 484 27 Includes reduction of commercial paper funded with<br />
(Current assets subtracting Current liabilities) a $500 million long-term debt issue<br />
68 . <strong>TELUS</strong> 2012 ANNUAL REPORT
Financial position at December 31 Change Change<br />
($ in millions) 2012 2011 ($ millions) (%) Explanation of changes<br />
Non-current assets<br />
MANAGEMENT’S DISCUSSION & ANALYSIS: 6<br />
Property, plant and equipment, net 8,165 7,964 201 3 See Capital expenditures in Section 7.2 Cash used<br />
by investing activities and Depreciation in Section 5.3<br />
Intangible assets, net 6,181 6,153 28 – See Capital expenditures in Section 7.2 Cash used<br />
by investing activities and Amortization in Section 5.3.<br />
Included in the balances are spectrum licences of<br />
$4,876 million for 2012 and $4,867 million for 2011<br />
Goodwill, net 3,702 3,661 41 1 Results from several small acquisitions<br />
Real estate joint venture 11 – 11 n/m <strong>TELUS</strong> Garden. See Transactions between related parties<br />
in Section 7.10<br />
Other long-term assets 118 81 37 46 Primarily long-term receivables related to the<br />
<strong>TELUS</strong> Garden joint venture<br />
Investments 58 21 37 176 Mainly an unrealized fair value adjustment for availablefor-sale<br />
assets recorded through Other comprehensive<br />
income<br />
Non-current liabilities<br />
Provisions 222 122 100 82 Includes a $52 million increase in asset retirement<br />
obligations mainly from a lower discount rate, put<br />
liabilities in respect of acquisitions and a reclassification<br />
of restructuring provisions from current to non-current<br />
Long-term debt 5,711 5,508 203 4 Mainly the December 2012 issue of $500 million, 3.35%<br />
Series CJ <strong>TELUS</strong> Corp. Notes, net of a reclassification<br />
of $300 million, 5.0% Series CB <strong>TELUS</strong> Corp. Notes to<br />
Current liabilities<br />
Other long-term liabilities 1,682 1,343 339 25 Primarily an increase in pension and post-retirement<br />
liabilities resulting from changes in actuarial assumptions,<br />
partly offset by pension funding<br />
Deferred income taxes 1,624 1,600 24 2 Includes deferred income taxes related to a revaluation<br />
to reflect future Ontario provincial income tax rates,<br />
temporary differences arising in the year, as well as<br />
reassessments for prior years’ issues, net of a recovery<br />
from unrealized losses on pension plan liabilities<br />
and derivatives<br />
Owners’ equity<br />
Common Share and Non-Voting 7,686 7,513 173 2 Principally Net income of $1,318 million, net of dividend<br />
Share equity declarations of $794 million and an Other comprehensive<br />
loss of $371 million<br />
<strong>TELUS</strong> 2012 ANNUAL REPORT . 69
7 Liquidity<br />
and capital resources<br />
A discussion of operating cash flows, investing and financing activities,<br />
as well as liquidity, credit facilities and other disclosures<br />
Our discussion in this section is qualified by the Caution regarding<br />
forward-looking statements at the beginning of the MD&A.<br />
Our capital structure financial policies, financing plan and results<br />
are described in Section 4.3. In 2012 and 2011, we generated <strong>annual</strong><br />
cash flow from operations exceeding <strong>annual</strong> capital investment needed<br />
to support business growth and reinvest in technology. We reduced<br />
debt in 2012 and increased dividend payments in both 2012 and 2011.<br />
Summary information – Consolidated statements of cash flows<br />
Years ended December 31 ($ millions) 2012 2011 Change<br />
Cash provided by operating activities<br />
Less:<br />
3,219 2,550 26.2%<br />
Cash used by investing activities 2,058 1,968 4.6%<br />
Cash used by financing activities<br />
Increase in cash and temporary<br />
1,100 553 98.9%<br />
investments, net<br />
Cash and temporary investments,<br />
61 29 –<br />
net, beginning of period<br />
Cash and temporary investments,<br />
46 17 –<br />
net, end of period 107 46 132.6%<br />
7.1 Cash provided by operating activities<br />
Cash provided by operating activities increased by $669 million in 2012.<br />
Analysis of changes in cash provided by operating activities<br />
Years ended December 31 ($ millions)<br />
Adjusted EBITDA (see Section 5.4<br />
2012 2011 Change<br />
and Section 5.5)<br />
Employer contributions to defined<br />
benefit plans, net of Employee<br />
3,965 3,761 204<br />
defined benefit plans expense<br />
Non-recurring regulatory rebates<br />
(183) (330) 147<br />
to residential subscribers<br />
Restructuring disbursements,<br />
– (53) 53<br />
net of restructuring costs (4) (48) 44<br />
Interest paid (337) (378) 41<br />
Interest received<br />
Income taxes paid,<br />
13 1 12<br />
net of refunds received<br />
Decreased (increased)<br />
(150) (150) –<br />
investment in inventories 3 (69) 72<br />
Other working capital changes (88) (184) 96<br />
Cash provided by operating activities 3,219 2,550 669<br />
. Changes in employer contributions to defined benefit plans, net of<br />
defined benefit plans expense, were principally due to discretionary<br />
contributions of $100 million made in January 2012 and $200 million<br />
made in January 2011.<br />
70 . <strong>TELUS</strong> 2012 ANNUAL REPORT<br />
. Non-recurring rebates to residential subscribers were made<br />
primarily in 2011, determined in accordance with CRTC Telecom<br />
Decision 2010-639, in respect of the price cap deferral account.<br />
Payment of the rebates did not affect Net income because these<br />
amounts recorded in the price cap deferral account did not<br />
previously receive income statement recognition.<br />
. Interest paid decreased in 2012 mainly due to lower effective interest<br />
rates resulting from refinancing activities in 2011, while interest<br />
received increased in 2012 principally due to the settlement of<br />
prior years’ income tax-related matters.<br />
. Income taxes paid, net of refunds received were unchanged,<br />
as higher instalment payments resulting from income growth were<br />
offset by an increase in recoveries related to settlement of prior<br />
years’ income tax-related matters.<br />
Cash provided by operating activities ($ millions)<br />
12 3,219<br />
10 11<br />
09 10<br />
08 10<br />
11 10<br />
10 09<br />
10 08<br />
2,550<br />
2,670<br />
Cash used by investing activities ($ millions)<br />
12 2,058<br />
1,731<br />
1,968<br />
7.2 Cash used by investing activities<br />
Cash used by investing activities increased by $90 million in 2012.<br />
The increase included the following:<br />
. In 2012, we made several business acquisitions and related invest-<br />
ments of $53 million that complement our existing lines of business.<br />
Except for one acquisition of 55% of the shares of a business, all<br />
acquisitions were for 100% ownership of other businesses. In 2011,<br />
$81 million was used to acquire certain independent <strong>TELUS</strong>branded<br />
wireless dealership businesses, and $20 million was used<br />
to increase <strong>TELUS</strong>’ equity interest in Transactel (Barbados) Inc.<br />
(also see Acquisition of additional equity interest in subsidiary from<br />
non-controlling interest in Section 7.3).<br />
. In 2012, we invested $73 million in the <strong>TELUS</strong> Garden real estate<br />
joint venture, including the contribution of <strong>TELUS</strong>-owned land.<br />
In addition, we received distributions of $47 million from the <strong>TELUS</strong><br />
Garden real estate joint venture.
. In 2012, we received proceeds of $20 million from the sale of land<br />
and minor investments, including $14 million from foreign assets<br />
that were held for sale at December 31, 2011.<br />
. Payment timing differences in respect of capital assets resulted<br />
in a $51 million reduction in cash outflows in 2012.<br />
. Capital expenditures increased by $134 million in 2012, while<br />
capital intensity was consistent at approximately 18% of revenues<br />
in 2012 and 2011.<br />
Capital expenditures<br />
Years ended December 31<br />
($ millions, except capital intensity) 2012 2011 Change<br />
Capital expenditures (1)<br />
Wireless segment 711 508 40.0%<br />
Wireline segment 1,270 1,339 (5.2)%<br />
1,981 1,847 7.3%<br />
Adjusted EBITDA less<br />
capital expenditures (2) 1,984 1,914 3.7%<br />
Capital intensity (3) (%) 18 18 –<br />
(1) Capital expenditures do not include changes in associated non-cash investing<br />
working capital, and therefore differ from Cash payments for capital assets, as<br />
presented on the Consolidated statements of cash flows. See Note 24(b) of the<br />
Consolidated financial statements.<br />
(2) A proxy for cash flow. See calculation and description in Section 11.1 EBITDA.<br />
(3) Capital intensity is calculated as capital expenditures divided by operating revenues.<br />
This measure provides a basis for comparing the level of capital expenditures to<br />
those of other companies of varying size within the same industry.<br />
. Wireless capital expenditures, excluding spectrum licences,<br />
increased by $203 million in 2012. The increase was principally<br />
due to expansion of coverage of our urban 4G LTE network<br />
and expansion of coverage and capacity of our 4G HSPA+ network.<br />
The increase also includes investments in common network<br />
components and IDCs to support growth.<br />
Wireless capital intensity was 12% in 2012, up from 9% in 2011,<br />
while wireless cash flow was $1,756 million in 2012, up $78 million<br />
or 4.6% from 2011.<br />
. Wireline capital expenditures decreased by $69 million in 2012.<br />
The decrease reflects lower investments in broadband due to the<br />
substantial network build in 2011, as well as a decrease in expenditures<br />
supporting business growth. These decreases were partly<br />
offset by higher expenditures for common network growth and<br />
sustainment.<br />
Wireline capital intensity was 24% in 2012, down from 26% in 2011.<br />
Wireline cash flow was $228 million in 2012, relatively flat to 2011.<br />
7.3 Cash used by financing activities<br />
Cash used by financing activities increased by $547 million in 2012.<br />
The increase was mainly due to the following.<br />
Non-Voting Shares issued<br />
Cash proceeds received from the issue of Non-Voting Shares were<br />
$1 million in 2012 and $24 million in 2011, in respect of exercised<br />
share options.<br />
MANAGEMENT’S DISCUSSION & ANALYSIS: 7<br />
Dividends paid to the holders of Common Shares<br />
and Non-Voting Shares<br />
Cash dividends paid to the holders of <strong>TELUS</strong> Common Shares and<br />
Non-Voting Shares were $774 million in 2012 and $642 million in 2011.<br />
The $132 million increase in 2012 included:<br />
. $78 million resulting from higher dividend rates, as well as a slightly<br />
higher number of shares outstanding.<br />
. $54 million reflecting an increase in cash outflows in respect of<br />
reinvested dividends resulting from our switch to purchasing <strong>TELUS</strong><br />
Non-Voting Shares on the open market with no discount, rather<br />
than issuing shares from treasury at a 3% discount, effective for<br />
dividends declared after March 1, 2011.<br />
Short-term borrowing<br />
Short-term borrowings are composed primarily of amounts advanced<br />
to us from an arm’s-length securitization trust pursuant to transfer of<br />
receivables securitization transactions (see Section 7.6 Sale of trade<br />
receivables). These proceeds were $400 million throughout 2012 and<br />
2011. Changes in short-term borrowings in 2012 and 2011 were small<br />
amounts drawn on bank credit facilities.<br />
Long-term debt<br />
No amounts were drawn against our five-year credit facility in 2012 or<br />
2011. Our commercial paper program provides low-cost funds and is<br />
fully backed up by this five-year committed credit facility. (See Section 7.5<br />
Credit facilities.)<br />
Net repayments of $321 million in 2012 were composed of:<br />
. A $521 million decrease in commercial paper to a balance of<br />
$245 million at December 31, 2012, partly funded from the issue<br />
of 10-year Notes in December.<br />
. Repayment in March of $300 million of matured 4.5% Series CC Notes.<br />
. A $500 million public offering of 3.35% Series CJ Notes in December.<br />
The net proceeds were used to repay outstanding commercial paper.<br />
These Notes mature in March 2023, may be redeemed in whole<br />
at any time, or in part from time to time, and contain certain change<br />
of control provisions.<br />
Net issues of $122 million in 2011 were composed of:<br />
. A $662 million increase in commercial paper to a balance of<br />
$766 million at December 31, 2011. A net increase of $878 million<br />
in the first half of 2011 was used to partially fund the June 1 repayment<br />
of matured U.S. dollar Notes and settle related cross-currency<br />
interest rate swap agreements, as well as fund a discretionary<br />
contribution to defined benefit pension plans, acquire certain independent<br />
<strong>TELUS</strong>-branded wireless dealership businesses and increase<br />
<strong>TELUS</strong>’ economic interest in Transactel. Commercial paper was<br />
reduced by $216 million in the second half of 2011.<br />
. A $600 million public offering of 3.65% Series CI five-year Notes in<br />
May. The net proceeds of the offering, combined with commercial<br />
paper issues, were applied to repayment of the June 1, 2011, maturity<br />
of U.S.$741 million, 8% Notes and accrued interest, as well as to<br />
the settlement of associated cross-currency interest rate swap<br />
agreements. The effective interest rate on the matured Notes and<br />
cross-currency interest rate swap agreements was 8.5%.<br />
<strong>TELUS</strong> 2012 ANNUAL REPORT . 71
Acquisition of additional equity interest in subsidiary<br />
from non-controlling interest<br />
In 2011, we exercised our second purchased call option in respect of<br />
Transactel. The effects of exercising the second purchased call option<br />
included that we recorded a second quarter 2011, post-acquisition<br />
equity transaction with the vendor for the incremental 44% economic<br />
interest for $51 million cash. Cash flows that are changes in investments<br />
in controlled entities, and which do not also result in a change<br />
in control, are presented as financing activities in the consolidated<br />
statement of cash flows when applying the entity concept of<br />
consolidation theory required by IFRS.<br />
Dividends declared ($ millions)<br />
12 794<br />
11 10<br />
10 09<br />
10 08<br />
Increase (decrease) in long-term debt<br />
and short-term borrowings ($ millions)<br />
12 (323)<br />
11 10<br />
10 09<br />
10 08<br />
(494)<br />
7.4 Liquidity and capital resource measures<br />
Net debt decreased by $382 million in 2012 mainly due to a reduction<br />
in long-term debt and an increase in cash. Fixed-rate debt as a proportion<br />
of total indebtedness was 90% at December 31, 2012, up from<br />
83% at December 31, 2011, mainly due to the December 2012 issue of<br />
$500 million of Notes maturing in 2023 and use of the net proceeds<br />
to reduce commercial paper.<br />
Total capitalization – book value decreased by $238 million in 2012<br />
mainly due to lower net debt, partly offset by an increase in retained<br />
earnings.<br />
72 . <strong>TELUS</strong> 2012 ANNUAL REPORT<br />
126<br />
642<br />
715<br />
Liquidity and capital resource measures<br />
As at, or years ended, December 31 2012 2011 Change<br />
Components of debt and<br />
coverage ratios (1) ($ millions)<br />
Net debt 6,577 6,959 (382)<br />
Total capitalization – book value<br />
EBITDA – excluding<br />
14,223 14,461 (238)<br />
restructuring costs 4,020 3,813 207<br />
Net interest cost<br />
Debt ratios<br />
Fixed-rate debt as a proportion<br />
332 377 (45)<br />
of total indebtedness (%) 90 83 7 pts.<br />
Average term to maturity of debt (years) 5.5 5.6 (0.1)<br />
Net debt to total capitalization (1) (%)<br />
Net debt to EBITDA – excluding<br />
46.2 48.1 (1.9) pts.<br />
restructuring costs (1) Coverage ratios<br />
1.6 1.8 (0.2)<br />
(1) (times)<br />
Earnings coverage<br />
EBITDA – excluding restructuring<br />
6.0 5.1 0.9<br />
costs interest coverage<br />
Other measures<br />
12.1 10.1 2.0<br />
Free cash flow (2) ($ millions)<br />
Dividend payout ratio<br />
1,331 997 334<br />
of adjusted net earnings (1) (%) 64 64 –<br />
Dividend payout ratio (1) (%) 63 62 1 pt.<br />
(1) See Section 11.4 Definitions of liquidity and capital resource measures.<br />
(2) See Section 11.2 Free cash flow for the definition.<br />
Earnings coverage was 6.0 times in 2012, up from 5.1 times in 2011.<br />
A reduction in gross interest expenses in 2012 increased the ratio by 0.5<br />
and growth in income before gross interest and income taxes in 2012<br />
increased the ratio by 0.4.<br />
EBITDA – excluding restructuring costs interest coverage was<br />
12.1 times in 2012, up from 10.1 times in 2011. Growth in EBITDA before<br />
restructuring costs in 2012 increased the ratio by 1.4 and lower net<br />
interest costs in 2012 increased the ratio by 0.6.<br />
Free cash flow was $1,331 million in 2012, up $334 million from 2011.<br />
The increase resulted mainly from growth in EBITDA and a reduction<br />
in contributions to defined benefit plans, as well as lower restructuring,<br />
interest and share-based compensation payments, partly offset by<br />
an increase in capital expenditures.<br />
EBITDA (excluding restructuring costs)<br />
interest coverage (times)<br />
12 12.1<br />
10 11<br />
09 10<br />
08 10<br />
Free cash flow ($ millions)<br />
11 10<br />
10 09<br />
10<br />
08<br />
7.1<br />
10.1<br />
12 1,331<br />
939<br />
997
Long-term financial policies and guidelines<br />
Our strategy is to maintain the financial policies and guidelines set out<br />
below. We believe that these measures are currently at the optimal level<br />
and by maintaining credit ratings in the range of BBB+ to A-, or the<br />
equivalent, are expected to continue to provide reasonable access to<br />
capital markets.<br />
. Net debt to EBITDA – excluding restructuring costs<br />
of 1.5 to 2.0 times<br />
The ratio was 1.6 times at December 31, 2012, down from<br />
1.8 times at December 31, 2011, due to lower Net debt and<br />
growth in EBITDA before restructuring costs.<br />
MANAGEMENT’S DISCUSSION & ANALYSIS: 7<br />
. Dividend payout ratio target guideline of 55 to 65%<br />
of sustainable net earnings on a prospective basis,<br />
revised effective in 2013 to 65 to 75%<br />
The Board of Directors has approved the revised dividend<br />
payout ratio target guideline effective for dividend declarations<br />
in 2013 onwards. The change results from applying the<br />
amended accounting standard IAS 19 Employee benefits (2011)<br />
in fiscal 2013 and the non-cash effects that reduce Net income<br />
and EPS. See Section 8.2 Accounting policy developments.<br />
The payout ratio is seen as appropriate to our current expectations<br />
for earnings, cash flow and capital expenditure investments.<br />
7.5 Credit facilities<br />
We have a $2 billion (or U.S. dollar equivalent) revolving credit facility with a syndicate of 15 financial institutions that expires on November 3, 2016.<br />
The credit facility is used for general corporate purposes including the backstop of commercial paper.<br />
At December 31, 2012, we had available liquidity of $1.8 billion from unutilized credit facilities, as well as $100 million available under our trade<br />
receivables securitization program (see Section 7.6). This is con sistent with our objective of generally maintaining at least $1 billion of available liquidity.<br />
<strong>TELUS</strong> credit facilities<br />
Outstanding Backstop<br />
At December 31, 2012 undrawn letters for commercial Available<br />
($ in millions) Expiry Size Drawn of credit paper program liquidity<br />
Five-year revolving facility (1) November 3, 2016 2,000 – – (245) 1,755<br />
Other bank facilities – 169 (2) (120) – 47<br />
Total – 2,169 (2) (120) (245) 1,802<br />
(1) Canadian dollars or U.S. dollar equivalent.<br />
Our revolving credit facility contains customary covenants, including<br />
a requirement that we not permit <strong>TELUS</strong>’ consolidated Leverage Ratio<br />
(debt to trailing 12-month EBITDA) to exceed 4 to 1 (approximately<br />
1.6 to 1 at December 31, 2012) and not permit <strong>TELUS</strong>’ consolidated<br />
Coverage Ratio (EBITDA to interest expense on a trailing 12-month basis)<br />
to be less than 2 to 1 (approximately 12.1 to 1 at December 31, 2012)<br />
at the end of any financial quarter. There are certain minor differences<br />
in the calculation of the Leverage Ratio and Coverage Ratio under<br />
the credit agreements as compared with the calculation of Net debt to<br />
EBITDA – excluding restructuring costs and EBITDA – excluding restructuring<br />
costs interest coverage. Historically, the calculations have not<br />
been materially different. The covenants are not impacted by revaluation<br />
of property, plant and equipment, intangible assets or goodwill for<br />
accounting purposes. Continued access to our credit facilities is not<br />
contingent on maintaining a specific <strong>TELUS</strong> credit rating.<br />
7.6 Sale of trade receivables<br />
Effective August 1, 2011, <strong>TELUS</strong> Communications Inc. (TCI), a wholly<br />
owned subsidiary of <strong>TELUS</strong>, amended an agreement with an arm’slength<br />
securitization trust associated with a major Schedule I Canadian<br />
bank, under which TCI is able to sell an interest in certain of its trade<br />
receivables, for an amount up to a maximum of $500 million. The<br />
amendment resulted in the term of the revolving period securitization<br />
agreement being extended to August 1, 2014. Available liquidity under<br />
this agreement was $100 million at December 31, 2012. (See Note 18<br />
of the Consolidated financial statements.)<br />
TCI is required to maintain at least a BBB (low) credit rating by<br />
DBRS Ltd. or the securitization trust may require the sale program to<br />
be wound down. The necessary credit rating was exceeded as of<br />
February 27, 2013.<br />
7.7 Credit ratings<br />
There were no changes to our investment grade credit ratings during<br />
2012 or as of February 27, 2013. We believe adherence to our stated<br />
financial policies and the resulting investment grade credit ratings,<br />
coupled with our efforts to maintain a constructive relationship with<br />
banks, investors and credit rating agencies, continue to provide reason-<br />
able access to capital markets. (See Section 10.6 Financing and<br />
debt requirements.)<br />
<strong>TELUS</strong> 2012 ANNUAL REPORT . 73
7.8 Financial instruments, commitments and contingent liabilities<br />
Financial instruments<br />
Our financial instruments and the nature of certain risks that they may be subject to are set out in the following table and are described in Note 4 of<br />
the Consolidated financial statements. Our policies in respect of the recognition and measurement of financial instruments are described in Note 1(c)<br />
of the Consolidated financial statements.<br />
Risks<br />
Recognition and measurement<br />
Market risks<br />
Financial instrument accounting classification Credit Liquidity Currency Interest rate Other price<br />
Measured at cost or amortized cost<br />
Accounts receivable<br />
Construction credit facilities advances<br />
Loans and receivables X X<br />
to real estate joint venture Loans and receivables X<br />
Short-term obligations Amortized cost X X X<br />
Accounts payable Amortized cost X X<br />
Provisions Amortized cost X X X<br />
Long-term debt Amortized cost X X X<br />
Measured at fair value<br />
Cash and temporary investments Fair value through net income X X X<br />
Short-term investments<br />
Long-term investments<br />
Fair value through net income X X<br />
(not subject to significant influence) (1) Available-for-sale X X<br />
Foreign exchange derivatives (2) Fair value through net income; part<br />
of a cash flow hedging relationship X X X<br />
Share-based compensation derivatives (2) Fair value through net income; part<br />
of a cash flow hedging relationship X X X<br />
Cross-currency interest rate swap derivatives (2)(3) Part of a cash flow hedging relationship X X X X<br />
(1) Long-term investments over which we do not have significant influence are measured at fair value if the fair values can be reliably measured.<br />
(2) Use of derivative financial instruments is subject to a policy which requires that no derivative transaction is to be entered into for the purpose of establishing a speculative or leveraged<br />
position (the corollary being that all derivative transactions are to be entered into for risk management purposes only) and sets criteria for the creditworthiness of the transaction<br />
counterparties.<br />
(3) The cross-currency interest rate swap derivatives matured in fiscal 2011.<br />
Credit risk<br />
. Cash and temporary investments – Credit risk associated with<br />
cash and temporary investments is managed by ensuring that these<br />
financial assets are placed with: governments; major financial institutions<br />
that have been accorded strong investment grade ratings<br />
by a primary rating agency; and/or other creditworthy counterparties.<br />
An ongoing review is performed to evaluate changes in the status<br />
of counterparties.<br />
. Accounts receivable – Credit risk associated with accounts<br />
receivable is inherently managed by our large and diverse customer<br />
base, which covers substantially all consumer and business sectors<br />
in Canada. We follow a program of credit evaluations of customers<br />
and limit the amount of credit extended when deemed necessary.<br />
At December 31, 2012, the weighted average life of past-due customer<br />
accounts receivable was 63 days (2011 – 61 days).<br />
We maintain allowances for potential credit losses related to<br />
doubtful accounts. Current economic conditions, historical information,<br />
reasons for the accounts being past-due and line of business<br />
from which the customer accounts receivable arose are all considered<br />
when determining whether allowances should be made for pastdue<br />
accounts; the same factors are considered when determining<br />
whether to write off amounts charged to the allowance account<br />
against the customer accounts receivable. The doubtful accounts<br />
expense is calculated on a specific-identification basis for customer<br />
accounts receivable over a specific balance threshold and on a<br />
statistically derived allowance basis for the remainder. No customer<br />
accounts receivable are written off directly to the doubtful<br />
accounts expense.<br />
74 . <strong>TELUS</strong> 2012 ANNUAL REPORT<br />
. Derivative assets (and derivative liabilities) – Counterparties to<br />
our share-based compensation cash-settled equity forward agreements<br />
and foreign exchange derivatives are major financial institutions<br />
that have all been accorded investment grade ratings by a primary<br />
rating agency. The dollar amount of credit exposure under contracts<br />
with any one financial institution is limited and counterparties’ credit<br />
ratings are monitored. We do not give or receive collateral on swap<br />
agreements and hedging items due to our credit rating and those of<br />
our counterparties. While we are exposed to potential credit losses<br />
due to the possible non-performance of our counterparties, we<br />
consider the risk of this remote. Our derivative liabilities do not have<br />
credit risk-related contingent features.<br />
Liquidity risk<br />
As a component of our capital structure financial policies, discussed in<br />
Section 4.3 Liquidity and capital resources, we manage liquidity risk by:<br />
maintaining a daily cash pooling process that enables us to manage our<br />
liquidity surplus and liquidity requirements according to our actual needs<br />
and those of our subsidiaries; maintaining bilateral bank facilities and a<br />
syndicated credit facility; the sales of trade receivables to an arm’s-length<br />
securitization trust; maintaining a commercial paper program; continuously<br />
monitoring forecast and actual cash flows; and managing maturity<br />
profiles of financial assets and financial liabilities.<br />
We have significant debt maturities in future years (see the longterm<br />
debt principal maturities chart in Section 4.3 Liquidity and<br />
capital resources). At December 31, 2012, we have access to a shelf<br />
prospectus, in effect until November 2013, pursuant to which we can<br />
offer $2.0 billion of debt or equity securities. We have credit facilities<br />
available, including a $2 billion facility expiring in November 2016
(see Section 7.5 Credit facilities). We believe that our investment grade<br />
credit ratings contribute to reasonable access to capital markets.<br />
We closely match the derivative financial liability contractual maturities<br />
with those of the risk exposures they are being used to manage. Our<br />
undiscounted financial liability expected maturities do not differ significantly<br />
from the contractual maturities, other than as noted in Note 4(c)<br />
of the Consolidated financial statements.<br />
Currency risk<br />
Our functional currency is the Canadian dollar, but certain routine<br />
revenues and operating costs are denominated in U.S. dollars and<br />
some inventory purchases and capital asset acquisitions are sourced<br />
internationally. The U.S. dollar is the only foreign currency to which<br />
we have a significant exposure.<br />
Our foreign exchange risk management includes the use of foreigncurrency<br />
forward contracts and currency options to fix the exchange rates<br />
on short-term U.S. dollar denominated transactions and commitments.<br />
Hedge accounting is applied to these short-term foreign-currency forward<br />
contracts and currency options only on a limited basis.<br />
Net income and comprehensive income for the years ended<br />
December 31, 2012 and 2011 could have varied if Canadian dollar:<br />
U.S. dollar exchange rates varied from the actual transaction date rates,<br />
as shown in Note 4(d) of the Consolidated financial statements.<br />
Interest rate risk<br />
Changes in market interest rates will cause fluctuations in the fair value<br />
or future cash flows of temporary investments, short-term investments,<br />
construction credit facility advances made to the real estate joint venture,<br />
short-term obligations, long-term debt and interest rate swap derivatives.<br />
When we have temporary investments, they have short maturities<br />
and fixed rates, thus their fair value will fluctuate with changes in market<br />
interest rates; absent monetization prior to maturity, the related future<br />
cash flows will not change due to changes in market interest rates.<br />
If the balance of short-term investments includes debt instruments<br />
and/or dividend-paying equity instruments, we could be exposed to<br />
interest rate risks.<br />
Due to the short-term nature of the applicable rates of interest charged,<br />
the fair value of the construction credit facilities advances made to the<br />
real estate joint venture are not materially affected by changes in market<br />
interest rates; associated cash flows representing interest payments<br />
will be affected until such advances are repaid.<br />
As short-term obligations arising from bilateral bank facilities, which<br />
typically have variable interest rates, are rarely outstanding for periods that<br />
exceed one calendar week, interest rate risk associated with this item is<br />
not material.<br />
Short-term borrowings arising from the sales of trade receivables<br />
to an arm’s-length securitization trust are fixed-rate debt. Due to the short<br />
maturities of these borrowings, interest rate risk associated with this item<br />
is not material.<br />
In respect of our currently outstanding long-term debt, other than<br />
for commercial paper and amounts drawn on our credit facilities, it is all<br />
fixed-rate debt. The fair value of fixed-rate debt fluctuates with changes<br />
in market interest rates; absent early redemption, the related future cash<br />
flows will not change. Due to the short maturities of commercial paper,<br />
its fair value is not materially affected by changes in market interest rates<br />
but its cash flows representing interest payments may be if the commercial<br />
paper is rolled over.<br />
MANAGEMENT’S DISCUSSION & ANALYSIS: 7<br />
Amounts drawn on our short-term and long-term credit facilities<br />
will be affected by changes in market interest rates in a manner similar<br />
to commercial paper.<br />
Similar to fixed-rate debt, the fair value of our interest rate swap<br />
derivatives fluctuated with changes in market interest rates as the<br />
interest rate swapped to is fixed; absent early redemption, the related<br />
future cash flows would not have changed due to changes in market<br />
interest rates.<br />
Other price risk<br />
. Provisions – We are exposed to other price risk arising from written<br />
put options provided for non-controlling interests, as discussed<br />
further in Note 16(e) of the Consolidated financial statements.<br />
. Short-term investments – If the balance of the short-term investments<br />
line item on the statement of financial position includes equity<br />
instruments, we would be exposed to equity price risks.<br />
. Long-term investments – We are exposed to equity price risks arising<br />
from investments classified as available-for-sale. Such investments<br />
are held for strategic rather than trading purposes.<br />
. Share-based compensation derivatives – We are exposed to<br />
other price risk arising from cash-settled share-based compensation<br />
(appreciating Non-Voting Share prices increase both the expense<br />
and the potential cash outflow). Certain cash-settled equity swap<br />
agreements were entered into that established a cap on our cost<br />
associated with our net cash-settled share options (Note 13(b) of<br />
the Consolidated financial statements) and others have been entered<br />
into that fix our cost associated with our restricted stock units<br />
(Note 13(c) of the Consolidated financial statements).<br />
Market risk<br />
Net income and other comprehensive income for the years ended<br />
December 31, 2012 and 2011, could have varied if the Canadian dollar:<br />
U.S. dollar exchange rates, market interest rates and our Common Share<br />
and Non-Voting Share prices varied by reasonably possible amounts<br />
from their actual statement of financial position date values.<br />
The sensitivity analysis of our exposure to currency risk, interest<br />
rate risk, and other price risk arising from share-based compensation<br />
is shown in Note 4(g) of the Consolidated financial statements.<br />
Fair values – general<br />
The carrying values of cash and temporary investments, accounts<br />
receivable, short-term obligations, short-term borrowings, accounts payable<br />
and certain provisions (including restructuring accounts payable)<br />
approximate their fair values due to the immediate or short-term maturity<br />
of these financial instruments. The carrying values of our investments<br />
accounted for using the cost method do not exceed their fair values.<br />
The carrying value of short-term investments, if any, equals their fair<br />
value as they are classified as held for trading. The fair value is determined<br />
directly by reference to quoted market prices in active markets.<br />
The fair value of our long-term debt is based on quoted market prices<br />
in active markets.<br />
The fair values of our derivative financial instruments used to<br />
manage exposure to currency risks are estimated based on quoted<br />
market prices in active markets for the same or similar financial instruments<br />
or on the current rates offered to us for financial instruments<br />
of the same maturity, as well as the use of discounted future cash flows<br />
using current rates for similar financial instruments subject to similar<br />
risks and maturities (such fair values being largely based on Canadian<br />
dollar: U.S. dollar forward exchange rates as at the statement of<br />
financial position dates).<br />
<strong>TELUS</strong> 2012 ANNUAL REPORT . 75
The fair values of the derivative financial instruments we use to manage<br />
exposure to increases in compensation costs arising from certain<br />
forms of share-based compensation are based upon fair value estimates<br />
of the related cash-settled equity forward agreements provided by the<br />
counterparty to the transactions (such fair value estimates being largely<br />
based upon our Non-Voting Share prices as at the statement of financial<br />
position dates).<br />
Financial instruments that we measure at fair value on a recurring<br />
basis in periods subsequent to initial recognition and the level within the<br />
fair value hierarchy used to measure them are set out in Note 4(h) of the<br />
Consolidated financial statements.<br />
Commitments and contingent liabilities<br />
Contractual obligations<br />
Known contractual obligations<br />
76 . <strong>TELUS</strong> 2012 ANNUAL REPORT<br />
Fair values – derivative and non-derivative<br />
The derivative financial instruments that we measure at fair value on a<br />
recurring basis subsequent to initial recognition, and our long-term debt,<br />
which is measured at amortized cost, and the fair value thereof, are set<br />
out in tables in Note 4(h) of the Consolidated financial statements.<br />
Recognition of derivative gains and losses<br />
Gains and losses, excluding tax effects, on derivative instruments that<br />
are classified as cash flow hedging items, as well as gains and losses<br />
on derivative instruments that are classified as held for trading items<br />
and that are not designated as being in a hedging relationship, and their<br />
respective locations within the Consolidated statements of income and<br />
other comprehensive income, are detailed in Note 4(i) of the Consolidated<br />
financial statements.<br />
At December 31, 2012<br />
($ millions) 2013 2014 2015 2016 2017 Thereafter Total<br />
Short-term borrowings<br />
Interest obligations 6 5 – – – – 11<br />
Principal obligations (1) 2 400 – – – – 402<br />
Long-term debt<br />
8 405 – – – – 413<br />
Interest obligations (2) 310 297 264 224 195 659 1,949<br />
Principal maturities (3) 545 700 625 600 700 3,124 6,294<br />
855 997 889 824 895 3,783 8,243<br />
Construction credit facilities commitment (4) 182 – – – – – 182<br />
Operating lease obligations (5) Purchase obligations<br />
293 268 260 222 188 1,224 2,455<br />
(6)<br />
Operating expenditures 1,096 828 672 81 78 328 3,083<br />
Capital expenditures 230 24 15 15 15 7 306<br />
1,326 852 687 96 93 335 3,389<br />
Non-interest bearing financial liabilities 1,407 5 47 2 2 5 1,468<br />
Other obligations 25 – – – – – 25<br />
Total 4,096 2,527 1,883 1,144 1,178 5,347 16,175<br />
(1) Composed of a $2 million draw on bank facilities and $400 million securitized trade receivables (see Section 7.6 Sale of trade receivables).<br />
(2) Interest payment cash outflows in respect of commercial paper were calculated based on rates in effect at December 31, 2012.<br />
(3) See long-term debt maturity chart in Section 4.3.<br />
(4) A loan commitment in respect of a real estate joint venture (see Transactions with real estate joint venture in Section 7.10).<br />
(5) Total operating lease commitments include $2,421 million in respect of land and buildings, of which approximately 52% was in respect of our five largest leases for office premises<br />
over various terms, with expiry dates that range between 2022 and 2034, and approximately 18% was in respect of wireless site leases with a weighted average term of 7 years.<br />
Total operating lease commitments for land and buildings include the lease for our new national headquarters premises with a real estate joint venture and exclude operating lease<br />
receipts from sublet buildings. See Note 22(a) of the Consolidated financial statements for further detail.<br />
(6) Where applicable, purchase obligations reflect foreign exchange rates at December 31, 2012. Purchase obligations include future operating and capital expenditures that have been<br />
contracted for at the current year-end and include the most likely estimates of prices and volumes, where necessary. As purchase obligations reflect market conditions at the time the<br />
obligation was incurred for the items being purchased, they may not be representative of future years. Obligations from personnel supply contracts and other such labour agreements<br />
have been excluded.<br />
Indemnification obligations<br />
In the normal course of operations, we may provide indemnification in<br />
conjunction with certain transactions. The terms of these indemnification<br />
obligations range in duration. In some cases, these indemnifications<br />
would require us to compensate the indemnified parties for costs incurred<br />
as a result of litigation claims or statutory sanctions or damages that may<br />
be suffered by an indemnified party. In many cases, there is no maximum<br />
limit on these indemnification obligations and the overall maximum<br />
amount of such indemnification obligations cannot be reasonably<br />
estimated. Where appropriate, an indemnification obligation is recorded<br />
as a liability. Other than obligations recorded as liabilities at the time of<br />
the transaction, historically we have not made significant payments under<br />
these indemnifications.<br />
In connection with the 2001 disposition of our directory business,<br />
we agreed to bear a proportionate share of the new owner’s increased<br />
directory publication costs if the increased costs were to arise from<br />
a change in the applicable CRTC regulatory requirements. Our proportionate<br />
share is 15% through, and ending, May 2016. As well, should<br />
the CRTC take any action that would result in the owner being prevented<br />
from carrying on the directory business as specified in the agreement,
we would indemnify the owner in respect of any losses that the<br />
owner incurred.<br />
At December 31, 2012, we have no liability recorded in respect<br />
of indemnification obligations.<br />
Claims and lawsuits<br />
A number of claims and lawsuits (including class actions) seeking<br />
damages and other relief are pending against <strong>TELUS</strong>. As well, we have<br />
received or are aware of certain possible claims (including intellectual<br />
property infringement claims) against us and, in some cases, numerous<br />
other wireless carriers and telecommunications service providers.<br />
(See Section 10.9 Litigation and legal matters.)<br />
7.9 Outstanding share information<br />
The total number of outstanding shares at February 4, 2013, reflects<br />
the successful completion of our share exchange, approved by shareholders<br />
on October 17, 2012 (see Share exchange in Section 1.3). The<br />
total number of outstanding and issuable shares shown in the following<br />
table assumes full conversion of outstanding options and shares<br />
reserved for future option grants.<br />
Outstanding shares<br />
Common Non-Voting Total<br />
(millions) Shares Shares shares<br />
Common equity<br />
Outstanding shares<br />
at December 31, 2012 175 151 326 (1)<br />
Outstanding shares<br />
at February 4, 2013<br />
Options outstanding and<br />
326 – 326<br />
issuable (2) at February 4, 2013<br />
Outstanding and issuable shares<br />
27 – 27<br />
at February 4, 2013 353 – 353<br />
(1) For the purposes of calculating diluted earnings per share, the number of shares<br />
was 327 million in 2012.<br />
(2) Assuming full conversion and ignoring exercise prices.<br />
7.10 Transactions between related parties<br />
Investments in significant controlled entities<br />
At December 31, 2012, <strong>TELUS</strong> Corporation ultimately controlled 100%<br />
of the equity of <strong>TELUS</strong> Communications Inc., which in turn ultimately<br />
controlled 100% of the equity of <strong>TELUS</strong> Communications Company and<br />
TELE-MOBILE COMPANY. This was unchanged from December 31, 2011.<br />
Transactions with key management personnel<br />
Our key management personnel have authority and responsibility for<br />
overseeing, planning, directing and controlling our activities, and consist<br />
of our Board of Directors and our Executive Leadership Team. Total<br />
compensation expense amounts for key management personnel in 2012<br />
and 2011 were $38 million and $28 million, respectively. See Note 23(b)<br />
of the Consolidated financial statements for additional detail.<br />
Transactions with defined benefit pension plans<br />
We provided management and administrative services to our defined<br />
benefit pension plans. Charges for these services were on a cost recovery<br />
basis and were immaterial. We also made employer contributions to<br />
defined benefit plans as discussed in Section 7.1.<br />
MANAGEMENT’S DISCUSSION & ANALYSIS: 7<br />
Transactions with real estate joint venture (<strong>TELUS</strong> Garden)<br />
In the first quarter of 2011, as one of the future office tower tenants,<br />
we announced that we had partnered, as equals, with an arm’s-length<br />
party (Westbank Holdings Ltd.) in a residential condominium, retail<br />
and commercial real estate redevelopment project, <strong>TELUS</strong> Garden,<br />
in Vancouver, British Columbia. The project will result in us, as one of the<br />
new tenants, having new national headquarters. The new-build office<br />
tower, scheduled for com pletion in 2014, is to be built to the 2009 leadership<br />
in energy and environmental design (LEED) platinum standard and<br />
the neighbouring new-build residential condominium tower, scheduled<br />
for completion in 2015, is to be built to the LEED gold standard. Office<br />
tower construction began in the first quarter of 2012, while the residential<br />
tower was successfully marketed and construction began in the second<br />
quarter of 2012.<br />
During 2012, we had transactions with the real estate joint venture,<br />
which is a related party, as set out in Note 17(c) of the Consolidated<br />
financial statements. Commitments and contingent liabilities for the real<br />
estate joint venture are set out in Note 17(d) of the Consolidated financial<br />
statements, including the following:<br />
. Construction commitment: The real estate joint venture is expected<br />
to spend a combined total of approximately $470 million on an office<br />
tower and a residential condominium tower. As at December 31, 2012,<br />
the real estate joint venture’s construction-related contractual commitments<br />
were approximately $150 million through to 2015.<br />
. Operating leases: In the first quarter of 2012, we entered into an<br />
operating lease for our new national headquarter premises with the<br />
real estate joint venture, at market rates. Operating lease payments<br />
for the 20-year term total $230 million, including occupancy costs<br />
of $91 million, and are expected to commence in 2015.<br />
. Construction credit facilities: In the third quarter of 2012, the real<br />
estate joint venture signed definitive credit agreements with two<br />
Canadian financial institutions (as 50% lender) and <strong>TELUS</strong> Corporation<br />
(as 50% lender) to provide approximately $413 million of construction<br />
financing for the <strong>TELUS</strong> Garden project. The facilities contain customary<br />
real estate construction financing representations, warranties<br />
and covenants and are secured by demand debentures constituting<br />
first fixed and floating charge mortgages over the underlying real estate<br />
assets. The facilities are available by way of bankers’ acceptance or<br />
prime loan and bear interest at rates in line with similar construction<br />
financing facilities.<br />
. Other: We are to receive 50% of the earnings from the sale of<br />
residential condominium tower units in excess of the first $18 million<br />
of earnings; we are to receive 25% of the first $18 million of<br />
earnings and the arm’s-length co-owner is to receive 75%. We have<br />
guaranteed the payment of 50% of the real estate joint venture’s<br />
construction credit facility carrying costs and costs to complete.<br />
We have also provided an environmental indemnity in favour<br />
of the construction lenders. If we pay out under such guarantee<br />
or indemnity because the arm’s-length co-owner has not paid<br />
its pro-rata share of project costs, then we have recourse options<br />
available, including against the arm’s-length co-owner’s interest<br />
in the real estate joint venture. As at December 31, 2012, we had no<br />
liability recorded in respect of real estate joint venture obligations<br />
and guarantees.<br />
<strong>TELUS</strong> 2012 ANNUAL REPORT . 77
8 Critical<br />
accounting estimates and accounting policy developments<br />
Accounting estimates that are critical to determining financial results and effects in 2013<br />
of applying amended and new accounting standards<br />
8.1 Critical accounting estimates<br />
Our significant accounting policies are described in Note 1 of<br />
the Consolidated financial statements dated December 31, 2012.<br />
The preparation of financial statements in conformity with generally<br />
accepted accounting principles requires us to make estimates,<br />
assumptions and judgements that affect the <strong>report</strong>ed amounts of<br />
assets and liabilities and disclosure of contingent assets and liabilities<br />
at the date of the financial statements, and the <strong>report</strong>ed amounts<br />
of revenues and expenses during the <strong>report</strong>ing period. Actual results<br />
could differ from those estimates.<br />
Examples of significant judgements, apart from those involving<br />
estimation, include: (i) the decision to depreciate and amortize our<br />
property, plant, equipment and intangible assets subject to amortization<br />
on a straight-line basis as we believe that this method reflects the<br />
consumption of resources related to the economic lifespan of those<br />
assets better than an accelerated method and is more representative<br />
of the economic substance of the underlying use of those assets;<br />
(ii) our view that our spectrum licences granted by Industry Canada<br />
will likely be renewed by Industry Canada; that we intend to renew<br />
them; and that we believe we have the financial and operational ability<br />
to renew them and, thus, they are deemed to have an indefinite life;<br />
and (iii) in respect of claims and lawsuits, as discussed further in<br />
Note 22(c) of the Consolidated financial statements, the determination<br />
of whether an item is a contingent liability or whether an outflow of<br />
resources is probable and thus needs to be accounted for as a provision.<br />
Our critical accounting estimates and assumptions are described<br />
below and are generally discussed with the Audit Committee each quarter.<br />
78 . <strong>TELUS</strong> 2012 ANNUAL REPORT<br />
General<br />
. In determining our critical accounting estimates, we consider trends,<br />
commitments, events or uncertainties that we reasonably expect<br />
to materially affect the methodology or assumptions, subject to the<br />
items identified in the Caution regarding forward-looking statements<br />
section of this MD&A.<br />
. In the normal course, we make changes to assumptions underlying<br />
all critical accounting estimates to reflect current economic conditions,<br />
updating of historical information used to develop the assumptions<br />
and changes in our credit ratings, where applicable. Unless indicated<br />
otherwise in the discussion below, we expect that no material changes<br />
in overall financial performance and financial statement line items<br />
would arise either from reasonably likely changes in material assumptions<br />
underlying the estimate or from selection of a different estimate<br />
from within a valid range of estimates.<br />
. All critical accounting estimates are uncertain at the time of<br />
making the estimate and affect the following Consolidated statements<br />
of income and other comprehensive income line items:<br />
Income taxes (except for estimates about goodwill) and Net income.<br />
Similarly, all critical accounting estimates affect the following<br />
Consolidated statements of financial position line items: Current<br />
assets (Income and other taxes receivable); Current liabilities<br />
(Income and other taxes payable); Deferred income tax liabilities;<br />
and Common Share and Non-Voting Share equity (retained earnings).<br />
The discussion of each critical accounting estimate does not<br />
differ between our two segments, wireless and wireline, unless<br />
explicitly noted.<br />
. Our critical accounting estimates affect line items on the Consolidated statements of income and other comprehensive income, and line items on<br />
the Consolidated statements of financial position, as follows:<br />
Consolidated statements of income and other comprehensive income<br />
Operating expenses<br />
Other<br />
comprehensive<br />
income<br />
(Item never<br />
Goods and Employee Amortization subsequently<br />
Operating services benefits of intangible Financing reclassified<br />
Consolidated statements of financial position revenues purchased expense Depreciation assets costs to income)<br />
Accounts receivable X<br />
Inventories X<br />
Property, plant and equipment, net X<br />
Intangible assets, net, and Goodwill, net X (1)<br />
Investments X<br />
Employee defined benefit pension plans X (2) X (3) X (3) X (2) X (2)<br />
(1) Accounting estimate, as applicable to intangible assets with indefinite lives and goodwill, primarily affects our wireless cash-generating unit.<br />
(2) Fiscal periods beginning January 1, 2013, will be affected by the application of the amended standard IAS 19 Employee Benefits (2011), discussed in this section under Employee<br />
defined benefit pension plans and in Section 8.2.<br />
(3) Accounting estimate impact due to internal labour capitalization rates.
Accounts receivable<br />
General<br />
. We consider the business area that gave rise to the accounts<br />
receivable, perform statistical analysis of portfolio delinquency trends<br />
and perform specific account identification when determining our<br />
allowance for doubtful accounts.<br />
. Assumptions underlying the allowance for doubtful accounts include<br />
portfolio delinquency trends and specific account assessments<br />
made when performing specific account identification.<br />
. These accounting estimates are in respect of the Accounts receivable<br />
line item on our Consolidated statements of financial position<br />
comprising approximately 8% of Total assets at December 31, 2012<br />
(7% at December 31, 2011). If the future were to differ adversely from<br />
our best estimates of the fair value of the residual cash flows and<br />
the allowance for doubtful accounts, we could experience a doubtful<br />
account expense in the future. Such a doubtful account expense<br />
does not result in a cash outflow.<br />
The allowance for doubtful accounts<br />
. The estimate of our allowance for doubtful accounts could materially<br />
change from period to period due to the allowance being a function of<br />
the balance and composition of accounts receivable, which can vary<br />
on a month-to-month basis. The variance in the balance of accounts<br />
receivable can arise from a variance in the amount and composition<br />
of operating revenues and from variances in accounts receivable<br />
collection performance.<br />
Inventories<br />
The allowance for inventory obsolescence<br />
. We determine our allowance for inventory obsolescence based<br />
upon expected inventory turnover, inventory aging, and current and<br />
future expectations with respect to product offerings.<br />
. Assumptions underlying the allowance for inventory obsolescence<br />
include future sales trends and offerings and the expected inventory<br />
requirements and inventory composition necessary to support<br />
these future sales offerings. Our estimate of the allowance for inventory<br />
obsolescence could materially change from period to period<br />
due to changes in product offerings and consumer acceptance of<br />
those products.<br />
. This accounting estimate is in respect of the Inventories line item<br />
on our Consolidated statements of financial position, which comprises<br />
approximately 2% of Total assets at December 31, 2012 and<br />
2011. If the allowance for inventory obsolescence were inadequate,<br />
we could experience a charge to Goods and services purchased<br />
expense in the future. Such an inventory obsolescence charge does<br />
not result in a cash outflow.<br />
MANAGEMENT’S DISCUSSION & ANALYSIS: 8<br />
Property, plant and equipment, net; Intangible assets, net;<br />
and Goodwill, net<br />
General<br />
. The Property, plant and equipment, net, line item on our Consolidated<br />
statements of financial position represents approximately 40% of<br />
Total assets at December 31, 2012 and 2011.<br />
. The Intangible assets, net, line item represents approximately 30%<br />
of Total assets at December 31, 2012 (31% at December 31, 2011).<br />
Included in Intangible assets are spectrum licences, which represent<br />
approximately 24% of Total assets at December 31, 2012 and 2011.<br />
. The Goodwill, net, line item represents approximately 18% of Total<br />
assets at December 31, 2012 and 2011.<br />
. If our estimated useful lives of assets were incorrect, we could<br />
experience increased or decreased charges for amortization<br />
of intangible assets or depreciation in the future. If the future were<br />
to differ adversely from our best estimate of key economic assumptions<br />
and associated cash flows were to materially decrease, we<br />
could potentially experience future material impairment charges<br />
in respect of our property, plant and equipment assets, our intangible<br />
assets or our goodwill. If intangible assets with indefinite lives were<br />
determined to have finite lives at some point in the future, we could<br />
experience increased charges for amortization of intangible assets.<br />
Such charges do not result in a cash outflow and of themselves<br />
would not affect our immediate liquidity.<br />
The estimated useful lives of assets<br />
. The estimated useful lives of assets are determined by a continuing<br />
program of asset life studies. The recoverability of assets with finite<br />
lives is significantly impacted by the estimated useful lives of assets.<br />
. Assumptions underlying the estimated useful lives of assets include<br />
the life cycle of technology, competitive pressures and future<br />
infrastructure utilization plans.<br />
The recoverability of intangible assets with indefinite lives;<br />
the recoverability of goodwill<br />
. The carrying value of intangible assets with indefinite lives, and<br />
goodwill, is periodically tested for impairment and this test represents<br />
a significant estimate for us.<br />
. The recoverable amounts of the cash-generating units’ assets have<br />
been determined based on a value-in-use calculation. There is a<br />
material degree of uncertainty with respect to the estimates of the<br />
recoverable amounts of the cash-generating units’ assets given<br />
the necessity of making key economic assumptions about the future.<br />
The value-in-use calculation uses discounted cash flow projections<br />
that employ the following key assumptions: future cash flows and<br />
growth projections, including economic risk assumptions and estimates<br />
of achieving key operating metrics and drivers; the future weighted<br />
average cost of capital; and earnings multiples.<br />
. See Note 16(d) of the Consolidated financial statements for further<br />
discussion of methodology and sensitivity testing.<br />
<strong>TELUS</strong> 2012 ANNUAL REPORT . 79
Investments<br />
The recoverability of long-term investments<br />
. We assess the recoverability of our long-term investments on a<br />
regular, recurring basis. The recoverability of investments is assessed<br />
on a specific-identification basis taking into consideration expectations<br />
about future performance of the investments and comparison<br />
of historical results to past expectations.<br />
. The most significant assumptions underlying the recoverability<br />
of long-term investments are the achievement of future cash flow<br />
and operating expectations. Our estimate of the recoverability<br />
of long-term investments could change from period to period<br />
due to the recurring nature of the recoverability assessment and<br />
due to the nature of long-term investments (we do not control<br />
the investees).<br />
. If the allowance for recoverability of long-term investments were<br />
inadequate, we could experience an increased charge to Other<br />
operating income in the future. Such a provision for recoverability<br />
of long-term investments does not result in a cash outflow. When<br />
there is clear and objective evidence of an increase in the fair<br />
value of an investment, which may be indicated by either a recent<br />
sale of shares by another current investor or the injection of new<br />
cash into the entity from a new or existing investor, we recognize the<br />
after-tax increase in value in Other comprehensive income (change<br />
in unrealized fair value of available-for-sale financial assets).<br />
Income tax assets and liabilities<br />
The amount and composition of income tax assets and income tax<br />
liabilities, including the amount of unrecognized tax benefits<br />
. Assumptions underlying the composition of income tax assets<br />
and liabilities are based upon an assessment of the technical merits<br />
of tax positions. Income tax benefits on uncertain tax positions are<br />
only recognized when it is more likely than not that the ultimate determination<br />
of the tax treatment of the position will result in the benefit<br />
being realizable. Income tax assets and liabilities are measured at<br />
the amount that is expected to be realized or incurred upon ultimate<br />
settlement with taxing authorities. Such assessments are based upon<br />
the applicable income tax legislation, regulations and interpretations,<br />
all of which in turn are subject to interpretation.<br />
. Current income tax assets and liabilities are estimated based<br />
upon the amount of tax that is calculated as being owed to taxing<br />
authorities, net of periodic instalment payments. Deferred income<br />
tax liabilities are composed of the tax effect of temporary differences<br />
between the carrying amount and tax basis of assets and liabilities<br />
as well as the tax effect of undeducted tax losses. The timing of<br />
the reversal of temporary differences is estimated and the tax rate<br />
substantively enacted for the periods of reversal is applied to the<br />
temporary differences. The carrying amounts of assets and liabilities<br />
are based upon the amounts recorded in the financial statements<br />
and are therefore subject to accounting estimates that are inherent in<br />
those balances. The tax basis of assets and liabilities, as well as the<br />
amount of undeducted tax losses, are based upon the assessment<br />
and measurement of tax positions as noted above. Assumptions as<br />
to the timing of reversal of temporary differences include expectations<br />
about the future results of operations and cash flows. The composition<br />
of income tax liabilities is reasonably likely to change from period<br />
to period because of changes in the estimation of these significant<br />
uncertainties.<br />
80 . <strong>TELUS</strong> 2012 ANNUAL REPORT<br />
. This accounting estimate is in respect of material asset and liability<br />
line items on our Consolidated statements of financial position<br />
comprising less than 1% of Total assets at December 31, 2012 and<br />
2011, and approximately 8% of Total liabilities and owners’ equity<br />
at December 31, 2012 and 2011. If the future were to adversely<br />
differ from our best estimate of the likelihood of tax positions being<br />
sustained, the amount of tax expected to be incurred, the future<br />
results of operations, the timing of reversal of deductible temporary<br />
differences and taxable temporary differences, and the tax rates<br />
applicable to future years, we could experience material deferred<br />
income tax adjustments. Such deferred income tax adjustments<br />
could result in an acceleration of cash outflows at an earlier time<br />
than might otherwise be expected.<br />
Employee defined benefit pension plans<br />
Certain actuarial and economic assumptions used in determining<br />
defined benefit pension costs, accrued pension benefit obligations<br />
and pension plan assets<br />
. We review industry practices, trends, economic conditions and data<br />
provided by actuaries when developing assumptions used in the<br />
determination of defined benefit pension costs and accrued pension<br />
benefit obligations. Pension plan assets are generally valued using<br />
market prices, however, some assets are valued using market estimates<br />
when market prices are not readily available. Defined benefit<br />
pension costs are also affected by the quantitative methods used<br />
to determine estimated returns on pension plan assets. Actuarial<br />
support is obtained for interpolations of experience gains and losses<br />
that affect the employee defined benefit plan actuarial gains and<br />
losses and accrued benefit obligations. The discount rate, which<br />
is used to determine the accrued benefit obligation, is based upon<br />
the yield on long-term, high-quality fixed-term investments. The<br />
discount rate is set <strong>annual</strong>ly at the end of each calendar year, based<br />
upon yields on long-term corporate bond indices in consultation<br />
with actuaries, and is reviewed quarterly for significant changes.<br />
Future increases in compensation are based upon the current<br />
benefits policies and economic forecasts.<br />
. We currently expect to initially apply the standard IAS 19 Employee<br />
Benefits (2011) effective in the fiscal period that began on January 1,<br />
2013, with retrospective application. Relative to our accounting<br />
policies and presentation and disclosure practices in effect for 2012,<br />
the key difference in the amended standard is that the expected<br />
long-term rate of return on plan assets will no longer be used for<br />
defined benefit plan measurement purposes and thus will no longer<br />
be a significant estimate. Application of this amended standard is<br />
expected to result in retrospective changes to Operating expenses<br />
(Employee benefits expense), Financing costs and Income taxes.<br />
The effects on Net income are expected to be offset in Other<br />
comprehensive income. See Section 8.2 for further detail and the<br />
quantified impacts of applying the amended standard.<br />
. On an <strong>annual</strong> basis, at a minimum, the defined benefit pension plan<br />
assumptions are assessed and revised as appropriate. When the<br />
defined benefit pension plan key assumptions fluctuate significantly<br />
relative to their immediately preceding year-end values, actuarial<br />
gains (losses) arising from such significant fluctuations are recognized<br />
on an interim basis. Assumptions used in determining defined benefit<br />
pension costs, accrued pension benefit obligations and pension<br />
plan assets include: discount rates, long-term rates of return for plan<br />
assets (which is equal to the discount rate effective in fiscal 2013),<br />
market estimates and rates of future compensation increases.
Material changes in overall financial performance and financial state-<br />
ment line items would arise from reasonably likely changes, because<br />
of revised assumptions to reflect updated historical information<br />
and updated economic conditions, in the material assumptions<br />
underlying this estimate. See Note 14 of the Consolidated financial<br />
statements for further analysis.<br />
. This accounting estimate is in respect of components of the<br />
Operating expenses line item and Other comprehensive income<br />
line item on our Consolidated statements of income and other<br />
comprehensive income. If the future were to adversely differ from<br />
our best estimate of assumptions used in determining defined<br />
benefit pension costs, accrued benefit obligations and pension plan<br />
assets, we could experience future increased (or decreased) defined<br />
benefit pension expense, financing costs and charges to Other<br />
comprehensive income.<br />
8.2 Accounting policy developments<br />
Real estate joint venture<br />
We account for our interest in the real estate joint venture using the<br />
equity basis of accounting whereby the investment is initially recorded<br />
at cost and subsequently adjusted for additional investments and to<br />
recognize our share of earnings or losses of the real estate joint venture<br />
and earnings distributed.<br />
Standards, interpretations and amendments<br />
not yet effective and not applied<br />
Unless otherwise indicated, the following standards are required to be<br />
applied for periods beginning on or after January 1, 2013. Unless otherwise<br />
indicated, based upon current facts and circumstances, we do<br />
not expect to be materially affected by the application of the following<br />
standards and we are currently determining which date(s) we will select<br />
for initial compliance if earlier than the required compliance date(s).<br />
. IFRS 7, Financial Instruments: Disclosures (amended 2011).<br />
. IFRS 9, Financial Instruments, is required to be applied for periods<br />
beginning on or after January 1, 2015.<br />
. Other than for the disclosure requirements therein, the following<br />
standards and amended standards must be initially applied<br />
concurrently:<br />
. IFRS 10, Consolidated Financial Statements<br />
. IFRS 11, Joint Arrangements<br />
. IFRS 12, Disclosure of Interests in Other Entities<br />
. IAS 27, Separate Financial Statements (amended 2011)<br />
. IAS 28, Investments in Associates (amended 2011).<br />
. IFRS 13, Fair Value Measurement.<br />
. IAS 32, Financial Instruments (amended 2011), is required to<br />
be applied for periods beginning on or after January 1, 2014.<br />
. IAS 19, Employee Benefits (amended 2011), as follows:<br />
Relative to our current accounting policies and presentation<br />
and disclosure practices, the key difference in the amended standard<br />
is that the expected long-term rate of return on plan assets will no<br />
longer be used for defined benefit plan measurement purposes<br />
(and thus will no longer be a significant estimate). In the determination<br />
of Net income in our instance, the effect is that the defined benefit<br />
plan expense con cepts of “interest cost” and “return on plan assets”<br />
will be replaced with the concept of “net interest.” Net interest for<br />
each plan is the product of the plan’s surplus (deficit) multiplied by the<br />
discount rate. The amended standard does not prescribe where in<br />
the results of operations the net interest amount is to be presented,<br />
MANAGEMENT’S DISCUSSION & ANALYSIS: 8<br />
but we expect that we will present such amount as a component<br />
of financing costs upon application of the amended standard.<br />
As our current view, consistent with long-term historical experience,<br />
is that the expected long-term rate of return on plan assets<br />
would exceed the discount rate (a result of targeting a significant<br />
percentage of the defined benefit plan assets to be invested in equity<br />
securities), the relative effect of the amended standard is expected<br />
to be a decrease in Net income and associated per-share amounts.<br />
The variance, if any, between the actual rate of return on defined<br />
benefit plan assets and the discount rate, as well as related effects<br />
from the limit on defined benefit assets, if any, would be included<br />
in Other comprehensive income as a re-measurement. The amended<br />
standard is not expected to affect our statement of financial position<br />
or statement of cash flows.<br />
Application of the amended standard in fiscal 2013 will result in<br />
retrospective changes to the Consolidated statements of income and<br />
other comprehensive income, including the following line items:<br />
Effects of IAS 19 (2011) on Consolidated statements<br />
of income and other comprehensive income (unaudited)<br />
Years ended December 31<br />
($ in millions, except per share amounts) 2012 2011<br />
Operating expenses<br />
Employee benefits expense<br />
As currently <strong>report</strong>ed 2,129 1,893<br />
Effect of applying IAS 19 (2011) 113 113<br />
Adjusted<br />
Financing costs<br />
2,242 2,006<br />
As currently <strong>report</strong>ed 332 377<br />
Effect of applying IAS 19 (2011) 42 6<br />
Adjusted<br />
Income taxes<br />
374 383<br />
As currently <strong>report</strong>ed 457 376<br />
Effect of applying IAS 19 (2011) (41) (30)<br />
Adjusted<br />
Net income<br />
416 346<br />
As currently <strong>report</strong>ed 1,318 1,215<br />
Effect of applying IAS 19 (2011) (114) (89)<br />
Adjusted<br />
Other comprehensive income (loss)<br />
1,204 1,126<br />
Item never subsequently reclassified to income<br />
Employee defined benefit plans<br />
actuarial gains (losses)<br />
As currently <strong>report</strong>ed (400) (851)<br />
Effect of applying IAS 19 (2011) 114 89<br />
Adjusted (286) (762)<br />
Net income per Common Share and Non-Voting Share<br />
Basic<br />
As currently <strong>report</strong>ed 4.05 3.76<br />
Effect of applying IAS 19 (2011) (0.36) (0.28)<br />
Adjusted 3.69 3.48<br />
Net income per Common Share and Non-Voting Share<br />
Diluted<br />
As currently <strong>report</strong>ed 4.03 3.74<br />
Effect of applying IAS 19 (2011) (0.36) (0.28)<br />
Adjusted 3.67 3.46<br />
<strong>TELUS</strong> 2012 ANNUAL REPORT . 81
Application of the amended standard in fiscal 2013 will also result<br />
in retrospective changes to measures <strong>report</strong>ed in the MD&A, including:<br />
Effects of IAS 19 (2011) on other measures (unaudited)<br />
Years ended, or as at, December 31 2012 2011<br />
EBITDA ($ millions)<br />
As currently <strong>report</strong>ed<br />
Effect of applying IAS 19 (2011)<br />
3,972 3,778<br />
(higher Employee benefits expense) (113) (113)<br />
Adjusted<br />
EBITDA – wireless segment ($ millions)<br />
3,859 3,665<br />
As currently <strong>report</strong>ed<br />
Effect of applying IAS 19 (2011)<br />
2,467 2,186<br />
(higher Employee benefits expense) (9) (9)<br />
Adjusted<br />
EBITDA – wireline segment ($ millions)<br />
2,458 2,177<br />
As currently <strong>report</strong>ed<br />
Effect of applying IAS 19 (2011)<br />
1,505 1,592<br />
(higher Employee benefits expense) (104) (104)<br />
Adjusted 1,401 1,488<br />
82 . <strong>TELUS</strong> 2012 ANNUAL REPORT<br />
Years ended, or as at, December 31 2012 2011<br />
Net debt to EBITDA –<br />
excluding restructuring costs (times)<br />
As currently <strong>report</strong>ed<br />
Adjusted (higher due to increase<br />
1.6 1.8<br />
in Employee benefits expense)<br />
Dividend payout ratio<br />
of adjusted net earnings (%)<br />
1.7 1.9<br />
As currently <strong>report</strong>ed<br />
Adjusted (higher due to decrease<br />
64 64<br />
in basic earnings per share)<br />
Dividend payout ratio (%)<br />
71 70<br />
As currently <strong>report</strong>ed<br />
Adjusted (higher due to decrease<br />
63 62<br />
in basic earnings per share) 69 67<br />
As a result of applying this amended standard and the reductions<br />
of Net income and earnings per share, the Board of Directors has<br />
approved a revised dividend payout ratio target guideline of 65 to<br />
75% of sustainable earnings on a prospective basis.
9 General<br />
outlook<br />
Trends and expectations for the telecommunications industry<br />
Our discussion in this section is qualified in its entirety by the Caution<br />
regarding forward-looking statements at the beginning of the MD&A.<br />
9.1 Telecommunications industry trends and expectations<br />
We estimate that Canada’s GDP growth in 2012 was 1.9%. The expectation<br />
for 2013 is 2.0%, based on the Bank of Canada’s January 2013<br />
Monetary Policy Report.<br />
We estimate that Canadian telecommunications industry revenues<br />
in 2012 (including TV and excluding media) grew by 3% to just over<br />
$53 billion. Wireless and data services (including TV) continued to be the<br />
growth engines for the sector, partly offset by continued weakness in<br />
legacy wireline voice service revenues. Bell Canada (excluding media)<br />
and its affiliated companies represented about 33% of the total<br />
industry revenue.<br />
As one of Canada’s largest telecommunications companies, <strong>TELUS</strong><br />
generated $10.9 billion in revenues in 2012, or approximately 21% of<br />
the total industry revenue. Our revenue increased by 5.0% in 2012 and<br />
we have targeted consolidated revenue growth of 4 to 6% in 2013.<br />
Approximately 80% of 2012 <strong>TELUS</strong> revenues were composed of<br />
wireless revenues and wireline data revenue, and it is expected that<br />
this percentage will continue to increase due to ongoing growth in<br />
wireless and data and declining legacy wireline voice revenues.<br />
We believe that we are well positioned for ongoing consolidated<br />
revenue and EBITDA growth due to our consistent strategic focus<br />
on providing a full suite of valuable and reliable telecommunications<br />
services; our delivery of differentiated, premium national business solutions<br />
in data and IP; our portfolio of growth services such as wireless,<br />
data and IP, including Optik TV and high-speed Internet services; ongoing<br />
investment to enhance wireless and broadband networks; and our<br />
continued focus on enhancing the customer experience across all areas<br />
of our operations.<br />
9.2 Wireless<br />
Based on publicly <strong>report</strong>ed competitors’ results, the Canadian wireless<br />
industry experienced good growth in 2012 with year-over-year revenue<br />
and EBITDA increases estimated at approximately 5% and 8%, respectively<br />
(estimates of 4.5% and 2%, respectively, in 2011). <strong>TELUS</strong> wireless<br />
revenue and EBITDA growth was 7% and 13%, respectively, in 2012<br />
(9.0% and 8.2%, respectively, in 2011).<br />
The Canadian wireless industry added an estimated 1.2 million<br />
new subscribers in 2012, compared to an estimated 1.6 million in<br />
2011. This reflects an increase in the penetration rate of approximately<br />
2.6 percentage points in 2012, as compared to approximately 3.8 percentage<br />
points in 2011. We expect penetration to continue increasing<br />
in Canada in 2013 and future years, as suggested by the experience in<br />
Canada’s most comparable market, the U.S., which currently has a<br />
penetration rate above 100%.<br />
MANAGEMENT’S DISCUSSION & ANALYSIS: 9<br />
Comparison of wireless industry metrics<br />
2011 2012 2013<br />
Market penetration of population<br />
Canada 77% 80% 82 to 83%<br />
U.S. 106% 109% 110%<br />
Europe up to 170% up to 177% up to 181%<br />
Asia-Pacific<br />
Data usage (percentage of ARPU)<br />
up to 147% up to 152% up to 156%<br />
Canada 33% 39% 45%<br />
U.S. 38% 43% 49%<br />
Europe 31% 34% 37%<br />
Asia-Pacific 52% 58% 62%<br />
Sources: Our estimates, CRTC’s Communications Monitoring Reports (2012 and 2011),<br />
other companies’ <strong>report</strong>s and industry <strong>report</strong>s.<br />
Wireless penetration rates in many countries in Western Europe have<br />
significantly surpassed 100%. These rates are not exactly comparable<br />
to Canada for several reasons, including: Europe has a more expensive<br />
calling party pays regime for wireline local calls that has stimulated<br />
wireless adoption; and many Europeans have multiple wireless subscriptions<br />
from different carriers on a single handset to reduce roaming<br />
charges, which inflates subscription numbers and understates average<br />
revenue per user.<br />
Wireless revenue growth continues to be driven by the increased<br />
adoption and usage of data services. In 2012, wireless data ARPU in<br />
Canada represented an estimated 39% of industry ARPU. This compares<br />
to approximately 43% in the U.S., 34% in Europe and 58% in Asia-<br />
Pacific, suggesting a significant ongoing growth opportunity in Canada.<br />
The higher proportion of data usage in Asia is due in part to a very low<br />
rate of penetration of wireline Internet service to households in many<br />
Asian countries.<br />
Data growth is being driven by the ongoing adoption of smartphones<br />
and tablets, and associated data plans. The adoption of more expensive<br />
smartphones is impacting industry margins. With a multi-year sales<br />
agreement, there is typically a significant upfront device subsidy provided<br />
to the customer that initially results in a negative return, but also provides<br />
higher ARPU and lower churn rates, which result in higher average lifetime<br />
revenue. Tablet devices operating on mobile networks or Wi-Fi are<br />
expected to be a growth segment in 2013. Customers want more<br />
mobile connectivity to the Internet, and usage of enhanced portable<br />
computing services is growing.<br />
It is expected that major mobile platforms will increasingly sell<br />
streaming content services in 2013, such as music, TV and video, as<br />
consumers become more comfortable with cloud-based computing.<br />
It is expected that these platforms will transition to supporting cloudbased<br />
services that will allow customers to access both corporate and<br />
personal data (e.g. photos, streaming video and music) from virtually<br />
anywhere, on multiple devices.<br />
<strong>TELUS</strong> 2012 ANNUAL REPORT . 83
The demand for wireless data services is expected to continue to<br />
grow due to: ongoing investment in faster network technologies like LTE<br />
that provide a richer user experience; the growing appetite for personal<br />
connectivity and social networking; greater affordability and selection of<br />
smartphones and products such as tablets and e-book readers; and<br />
more affordable data plans.<br />
Increasing data traffic represents a growing challenge to wireless<br />
carriers’ networks and carriers’ ability to manage and serve this traffic.<br />
To better manage this increase in data traffic and to capitalize on<br />
Canada’s wireless growth opportunity, established Canadian providers<br />
continue to roll out faster, next-generation high-speed wireless networks<br />
with greater capacity. The incumbent wireless carriers and AWS entrants<br />
need to acquire more spectrum in order to meet the growth in data.<br />
Industry Canada is expected to auction 700 MHz spectrum in the second<br />
half of 2013 and 2,500 to 2,690 MHz spectrum in 2014. It is important<br />
that <strong>TELUS</strong> is able to acquire spectrum in both urban and rural markets<br />
to meet the growing demand for data from its growing customer base.<br />
To bring innovative services and the latest data-capable devices<br />
to customers, we continued to expand capacity and coverage of<br />
our HSPA+ network in 2012, which reached more than 97% of Canadians<br />
at the end of 2012. In addition, we launched services on our 4G LTE<br />
network in February 2012 and expanded LTE coverage to more than<br />
two-thirds of Canadians by year-end. LTE technologies are expected<br />
to deliver manufacturer-rated peak data download speeds of up to<br />
75 Mbps (typical speeds of 12 to 25 Mbps expected), while at the same<br />
time introducing significant improvements in network capacity and<br />
performance. The roll-out of LTE into rural Canada will be dependent on<br />
acquiring spectrum in the 700 MHz band in the upcoming auction in 2013<br />
(see Future availability and cost of wireless spectrum in Section 10.3).<br />
In 2012, AWS entrants WIND Mobile, Mobilicity, Public Mobile and<br />
Videotron collectively gained an estimated 40% of new subscribers<br />
in Canada. In early 2013, Eastlink began offering services in Nova Scotia<br />
and Prince Edward Island. Industry analysts expect some degree of<br />
consolidation among AWS entrants, possibly before the 700 MHz spectrum<br />
auction. Of note, Shaw Communications chose to not use its AWS<br />
spectrum in Western Canada to build a wireless network to compete<br />
against other wireless carriers, and is building out Wi-Fi facilities instead.<br />
Additionally, in January 2013, Shaw announced it was granting an option<br />
to Rogers Communications to buy this AWS spectrum when Industry<br />
Canada’s five-year moratorium on AWS spectrum sales to established<br />
wireless providers expires in 2014.<br />
AWS entrants continue to be focused on gaining market share<br />
(currently estimated at 6%) using primarily aggressive price discounting<br />
and unlimited usage plans. Industry analysts question the economic<br />
sustainability of these aggressive pricing business models. Beyond<br />
funding start-up losses, new AWS competitors must also manage various<br />
challenges, including significant capital requirements to expand and<br />
enhance their wireless networks, expand distribution and fund future<br />
spectrum purchases. The discount model focus, relative lack of popular<br />
smartphones, and absence of ubiquitous network coverage have been<br />
factors behind low <strong>report</strong>ed ARPUs and what are believed to be high<br />
rates of churn for AWS entrants.<br />
Separately branded basic value services are offered by <strong>TELUS</strong><br />
(Koodo), Rogers (Chatr and Fido) and Bell (Virgin and Solo) to better<br />
position them to compete in this expanding segment. In 2012, Koodo<br />
introduced a prepaid offering, which followed the introduction a<br />
year earlier of an expanded range of smartphones and nationwide<br />
calling plans.<br />
84 . <strong>TELUS</strong> 2012 ANNUAL REPORT<br />
To better compete in the wireless market, we continue to differentiate<br />
the strong <strong>TELUS</strong> and Koodo brands with an intense focus on enhancing<br />
customer experience and the evolution of our Clear and Simple customer<br />
approach, eliminating activation fees and offering enhanced and<br />
lower cost international roaming. We believe that our customer-friendly<br />
approach has contributed to achieving churn rates that are among<br />
the lowest in the Canadian wireless industry.<br />
Given our high and growing exposure to wireless (54% and 62%,<br />
respectively, of 2012 revenue and EBITDA), strong and recognizable<br />
brands, leading-edge network, focus on an enhanced customer<br />
experience, and high-value smartphone growth, we believe we are<br />
well positioned to benefit from ongoing growth in the Canadian<br />
wireless market.<br />
9.3 Wireline<br />
The wireline telecommunications market is expected to remain very<br />
competitive in 2013 with low revenue growth and flat or declining EBITDA,<br />
as high-margin legacy voice revenues continue to decline due to technology<br />
substitution, such as email, wireless and voice over IP (VoIP)<br />
services. Canada’s four major cable-TV companies had an installed base<br />
of approximately 4.2 million telephony subscribers at the end of 2012,<br />
or a national con sumer market share of approximately 39%, up three<br />
percentage points from 2011. Other non-facilities-based competitors also<br />
offer local and long distance VoIP services and resell high-speed Internet<br />
solutions. This competition, along with technological substitution such<br />
as to wireless, continue to erode the number of residential network access<br />
lines and associated local and long distance revenues.<br />
Cable-TV companies continue to increase the speed of their Internet<br />
services and present aggressive customer acquisition offers. Canada’s<br />
four major cable-TV companies have approximately 5.8 million Internet<br />
subscribers, up from 5.6 million in 2011, while telecommunications companies<br />
have approximately 4.6 million Internet subscribers, up from<br />
4.4 million in 2011. Although the consumer high-speed Internet market<br />
is maturing, with approximately 80% penetration in Western Canada<br />
and 77% penetration across Canada, subscriber growth is expected<br />
to continue over the next several years.<br />
The growing popularity of watching TV anywhere is expected to<br />
continue as customers adopt services that enable them to view content<br />
on multiple screens, including computers, smartphones and tablets,<br />
as well as on their TVs. Over-the-top (OTT) content providers like Netflix,<br />
as well as Apple and Google, are competing for share of viewership.<br />
However, it is not clear if this competition replaces, or simply complements,<br />
existing TV services. TV and Internet service providers are<br />
monitoring OTT developments and evolving their content and market<br />
strategy to compete with these non-traditional offerings.<br />
In 2012, Canadian IP TV providers increased their subscriber base<br />
by approximately 44% to surpass 1.1 million. This growth came at the<br />
expense of cable-TV subscriber losses and was primarily driven by strong<br />
subscriber loading at <strong>TELUS</strong> and Bell. Canada’s four major cable-TV<br />
companies have approximately 7.1 million TV subscribers or 64% market<br />
share, down two percentage points from 2011. Beyond increasing the<br />
speed of Internet services, our primary Western Canadian cable-TV<br />
competitor, Shaw Communications, continued its roll-out of an urban<br />
Wi-Fi network and, similar to other cable competitors, launched an<br />
on-the-go TV product to better compete against on-the-go TV services<br />
offered by IP TV providers like <strong>TELUS</strong>.
Telecom companies continue to make investments in DSL broadband<br />
technologies to maintain their ability to support competitive IP-based<br />
services. ADSL2+ allows typical broadband download speeds of 3 to<br />
15 Mbps and the VDSL2 technology overlay allows typical download<br />
speeds of 5 to 25 Mbps. Additional VDSL technology platforms allow this<br />
speed to be increased further. In addition, telecom companies are actively<br />
deploying fibre to the home (FTTH) technologies, which support broadband<br />
speeds higher than any other technology.<br />
Combined with wireline local and long distance, wireless and<br />
high-speed Internet and entertainment services, telecom companies<br />
are increasingly offering bundled products to achieve competitive<br />
differentiation that offers customers more freedom, flexibility and choice.<br />
<strong>TELUS</strong>’ broadband investments and bundled integrated service offers<br />
have significantly improved our competitive position relative to our main<br />
cable-TV competitor, Shaw.<br />
The Canadian broadcasting industry has become more vertically<br />
integrated, with most of our competitors owning broadcast content.<br />
In 2011, the CRTC set clear safeguards to ensure healthy competition<br />
in the broadcasting sector (see Section 10.3 Regulatory matters –<br />
Broadcasting distribution undertakings). Our differentiated approach,<br />
MANAGEMENT’S DISCUSSION & ANALYSIS: 9<br />
consistent with our content strategy, is to aggregate, integrate and<br />
make accessible the best content and applications to customers,<br />
through whatever device they choose. <strong>TELUS</strong> has taken the position<br />
that it is not necessary to own content to make it accessible on an<br />
economically attractive basis, provided there is meaningful and timely<br />
enforcement of regulatory safeguards and additional safeguards<br />
introduced, as required.<br />
In the business market (enterprise and SMB), the convergence of IT<br />
and telecommunications, facilitated by the ubiquity of IP, continues to<br />
shape competitive investments. Telecommunications companies like ours<br />
are providing network-centric managed applications, while IT service<br />
providers are bundling network connectivity with their software as service<br />
offerings. In addition, manufacturers continue to bring all-IP and converged<br />
(IP plus legacy) equipment to market, enabling ongoing migration<br />
to IP-based solutions. The development of IP-based platforms, which<br />
provide combined IP voice, data and video solutions, creates potential<br />
cost efficiencies that compensate, in part, for reduced margins resulting<br />
from the migration from legacy to IP-based services. New opportunities<br />
exist for integrated solutions that have greater business impact than<br />
traditional telecommunications services.<br />
<strong>TELUS</strong> 2012 ANNUAL REPORT . 85
10 Risks<br />
Our discussion in this section is qualified in its entirety by the Caution<br />
regarding forward-looking statements at the beginning of the MD&A.<br />
Risk and control assessment process<br />
We use a three-level enterprise risk and control assessment process<br />
that solicits and incorporates the expertise and insight of team members<br />
from all areas of <strong>TELUS</strong>. We implemented this process in 2002 and track<br />
multi-year trends for various key risks and control environment perceptions<br />
across the organization.<br />
Definition of business risk<br />
We define business risk as the degree of exposure associated with<br />
the achievement of key strategic, financial, organizational and process<br />
objectives in relation to the effectiveness and efficiency of operations,<br />
reliability and integrity of financial <strong>report</strong>ing, compliance with laws,<br />
regulations, policies, procedures and contracts, and safeguarding<br />
of assets within an ethical organizational culture.<br />
Our enterprise risks are largely derived from our business environment<br />
and are fundamentally linked to our strategies and business objectives.<br />
We strive to proactively mitigate our risk exposures through rigorous<br />
performance planning, effective and efficient business operational management,<br />
and risk response strategies, which can include mitigating,<br />
transferring, retaining and/or avoiding risks. For example, residual<br />
86 . <strong>TELUS</strong> 2012 ANNUAL REPORT<br />
and risk management<br />
Risks and uncertainties facing us and how we manage these risks<br />
Three-level enterprise risk and control assessment process<br />
LEVEL ONE:<br />
Annual risk<br />
and control<br />
assessment<br />
LEVEL TWO:<br />
Quarterly<br />
risk<br />
assessment<br />
Board of<br />
Directors and<br />
<strong>TELUS</strong> Executive<br />
Leadership<br />
Team<br />
LEVEL THREE:<br />
Granular<br />
risk<br />
assessment<br />
exposure for certain risks is mitigated through appropriate insurance<br />
coverage, including for domestic and international operations, where<br />
we judge this to be efficient and commercially viable. We also mitigate<br />
risks through contractual terms and conditions, contingency planning<br />
and other risk response strategies as appropriate.<br />
We strive to avoid taking on undue risk exposures whenever possible<br />
and ensure alignment of exposures with business strategies, objectives,<br />
values and risk tolerances.<br />
Level one Annual risk and control assessment<br />
Key inputs into this process include interviews with senior managers, data and updates from our ongoing strategic<br />
planning process, and the results of our <strong>annual</strong> web-enabled risk and control assessment survey. The survey is based on<br />
the COSO (Committee of Sponsoring Organizations of the Treadway Commission) enterprise risk management and internal<br />
control frameworks. The survey is widely distributed to our management leadership team (all executive vice-president,<br />
vice-president and director-level team members and a random sample of management). Survey responses were received<br />
from 2,001 individuals in 2012.<br />
The members of our Board of Directors are also surveyed to solicit their perspective of our key risks and approach to<br />
enterprise risk management, and to gauge our risk appetite and tolerance by key risk category.<br />
Our assessment process incorporates input from recent internal and external audits, results of various risk management<br />
activities, and our management’s SOX 404 (Sarbanes Oxley Act of 2002) internal control over financial <strong>report</strong>ing compliance<br />
activities. Key enterprise risks are identified, defined and prioritized, and classified into one of eight risk categories. Perceived<br />
risk resiliency (or readiness) is assessed by key risk and risk tolerance/appetite is evaluated by risk category.<br />
Results of the <strong>annual</strong> risk and control assessment are shared with our senior management and our Board (including the<br />
Audit Committee). Executive-level risk owners and Board oversight committees are assigned. The <strong>annual</strong> risk assessment<br />
results guide the development of our <strong>annual</strong> internal audit program, which has an emphasis on assurance coverage of<br />
higher-rated risks and is approved by our Audit Committee. Risk assessments are also incorporated back into our strategic<br />
planning, operational risk management and performance management processes, and are shared with our Board.<br />
Level two Quarterly risk assessment review<br />
We conduct quarterly risk assessment reviews with our executive-level risk owners and designated risk primes across all<br />
business units to capture and communicate the dynamically changing business risks, identify key risk mitigation activities<br />
and provide quarterly updates and assurance to our Audit Committee and other applicable Board committees.<br />
Level three Granular risk assessments<br />
We conduct granular risk assessments for specific audit engagements and various risk management, strategic and<br />
operational initiatives (e.g. strategic planning, project, environmental management, safety, business continuity planning,<br />
network and IT vulnerability, and fraud and ethics risk assessments). The results of the multiple risk assessments are<br />
evaluated, prioritized, updated and integrated into the key risk profile throughout the year.
Board risk governance and oversight<br />
We maintained strong risk governance and oversight practices in 2012<br />
with Board risk oversight responsibilities outlined in the Board’s terms<br />
of reference and Board committee mandates.<br />
. Risks on the enterprise key risk profile are assigned for oversight<br />
to one or more Board committees.<br />
MANAGEMENT’S DISCUSSION & ANALYSIS: 10<br />
. Board committees provide risk updates to our full Board at least<br />
once <strong>annual</strong>ly for risks overseen through their respective terms<br />
of reference.<br />
. Our Board or Board committees may request risk briefings by our<br />
executive risk owners. The Vice-President, Risk Mitigation and Chief<br />
Internal Auditor attends, or receives a summary of, these briefings.<br />
Principal risks and uncertainties<br />
The following subsections describe the principal risks and uncertainties that could affect our future business results and our associated risk mitigation<br />
activities. The significance of these risks is such that they alone or in combination may have material impacts on our business operations, reputation,<br />
results and valuation.<br />
10.1 Competition 10.5 Process risks 10.9 Litigation and legal matters<br />
10.2 Technology 10.6 Financing and debt requirements 10.10 Human-caused and natural threats<br />
10.3 Regulatory matters 10.7 Tax matters 10.11 Economic growth and fluctuations<br />
10.4 Human resources 10.8 Health, safety and environment<br />
10.1 Competition<br />
Customer experience<br />
There is a risk that we will not improve or maintain levels of client<br />
loyalty and increase their likelihood to recommend <strong>TELUS</strong> if our products<br />
and services and the service experience we provide do not meet or<br />
exceed customer expectations. If we do not provide a better customer<br />
experience than our competitors, the <strong>TELUS</strong> brand image could suffer,<br />
business clients and consumers may change service providers, and<br />
our profitability could be negatively impacted should the costs to acquire<br />
and retain customers increase.<br />
Risk mitigation: Enhancing customer experience and earning the loyalty<br />
of clients is a prioritized Company-wide commitment, a focus which com-<br />
menced in 2010. We continue to introduce new client experience initiatives<br />
to bring greater transparency and simplicity to our customers, which may<br />
increase their likelihood to recommend <strong>TELUS</strong>. (See Strategic imperatives<br />
in Section 2.2 and Corporate priorities in Section 3.)<br />
Intense wireless competition is expected to continue<br />
Besides <strong>TELUS</strong>, eight facilities-based wireless competitors operated in<br />
Canada in 2012 (some nationally and some regionally – see Competition<br />
overview in Section 4.1). This includes four competitors who acquired<br />
advanced wireless services (AWS) spectrum in 2008. A fifth AWS entrant<br />
has announced it will offer services starting in 2013. AWS entrants have<br />
typically focused on a price discounting strategy as their main differ-<br />
entiator from established players. Most AWS entrants offer zone-based<br />
plans and advertise unlimited calling and data. Established competitors<br />
have also re-launched or introduced new brands with aggressive<br />
acquisition and retention offers.<br />
We expect continued pressure on ARPU from competitors’ offers<br />
and promotions for voice and data services, including Canadian<br />
long dis tance promotions. We expect pressure on cost of acquisition<br />
and retention as customers demand more advanced smartphones<br />
and competitors continue to heavily subsidize these devices. We also<br />
expect increased promotional activity in tandem with exciting new<br />
device launches.<br />
We expect increased competition through the use of unlicensed<br />
spectrum to deliver higher-speed data services. In 2011, Shaw<br />
Communications, which had earlier announced plans to launch wireless<br />
services in early 2012, stopped building a conventional wireless network<br />
in Western Canada and started building managed metropolitan area<br />
Wi-Fi networks to deliver entertainment to its customers beyond the<br />
home. In 2012, Shaw launched a service to compete with <strong>TELUS</strong> Optik<br />
on the go. In addition, satellite operators such as Xplornet are augmenting<br />
their existing high-speed Internet access (HSIA) (stated download<br />
speeds of up to 10 Mbps) with launched high-throughput satellites<br />
(stated download speeds of up to 25 Mbps).<br />
Risk mitigation in wireless markets: We improved our competitive position<br />
with the roll-out of our LTE network and services in 2012, and previously<br />
with our HSPA+ dual-cell network (see Section 10.2 Technology). In aggre-<br />
gate, these higher-speed networks cover more than 97% of Canada’s<br />
population, facilitated by network access agreements with Bell Canada<br />
and SaskTel.<br />
HSPA+ dual-cell and LTE technologies have enabled us to establish<br />
and maintain a strong position in smartphone and data device selection,<br />
expand roaming capability to more than 200 countries and increase<br />
international roaming revenue. Increased data download speeds provided<br />
by these technologies enable delivery of Optik on the go entertainment<br />
to mobile devices when beyond the reach of Wi-Fi.<br />
To compete more effectively in serving a variety of customer segments,<br />
we offer a value service brand, Koodo Mobile. By maintaining separation<br />
between the <strong>TELUS</strong> and Koodo brands through separate distribution<br />
and uniquely targeted value propositions, we believe we are well positioned<br />
in the face of heightened competitive intensity from AWS entrants<br />
and incumbent national competitors.<br />
We intend to continue the marketing and distribution of innovative<br />
and differentiated wireless services; offer a bundled wireless service<br />
(e.g. voice, text, and data); invest in our extensive network; evolve technologies;<br />
and acquire spectrum to facilitate service development and<br />
profitable expansion of our subscriber base and address accelerating<br />
demand for data usage. (See Section 10.3 Regulatory matters – Future<br />
availability and cost of wireless spectrum.)<br />
<strong>TELUS</strong> 2012 ANNUAL REPORT . 87
Competitor pricing and technological substitution may<br />
adversely affect market shares, volumes and pricing, leading<br />
to reduced utilization and increased commoditization of<br />
legacy wireline voice local and long distance services<br />
We face intense competition across all key business lines and market<br />
segments, including the consumer, small and medium business (SMB)<br />
and large enterprise markets.<br />
Technological advances have blurred the traditional boundaries<br />
between broadcasting, Internet and telecommunications. (See<br />
Section 10.2 Technology.) Cable-TV companies continue to expand<br />
offerings of digital voice and enhanced phone services, resulting in<br />
intensified competition in the residential and certain SMB, local access,<br />
long distance and HSIA markets. Over-the-top (OTT) content providers<br />
like Netflix are expected to compete for share of viewership, potentially<br />
cannibalizing TV and entertainment services. However, we view OTT<br />
services as a possible complement to our Optik TV service offering.<br />
Overall, industry pricing pressure and customer acquisition efforts have<br />
remained intensified across most product and service categories and<br />
market segments, and we expect this to continue.<br />
Risk mitigation, general: CRTC decisions in recent years approving<br />
wireline deregulation have provided us with improved flexibility to<br />
respond to intense competition (see Section 10.3 Regulatory matters).<br />
Active monitoring of competitive developments in product and geographic<br />
markets enables us to respond more rapidly to competitor offers<br />
and leverage our full suite of integrated solutions and national reach.<br />
As discussed below, to offset competitive intensity and losses in legacy<br />
services we provide in our incumbent areas, we continue to invest in<br />
increasing the speed and reach of our broadband networks, introduce<br />
innovative products and services, and enhance services with integrated<br />
bundled offers. We continue to expand into and generate growth in<br />
non-incumbent markets in Central Canada with business services and<br />
mobility offerings. We also continue to actively pursue a competitive<br />
cost structure and invest in efficient operations.<br />
Wireline voice and data competition<br />
We expect competition to remain intense from traditional telephony, data,<br />
IP and IT service providers, as well as from voice over Internet protocol<br />
(VoIP) focused entrants in both business and consumer markets.<br />
The industry transition from legacy voice infrastructure to IP telephony<br />
and from legacy data platforms to Ethernet, IP virtual private networks,<br />
multi-protocol label switching IP platforms and IP-based service delivery<br />
models continues at a robust pace. Legacy data revenues and margins<br />
continue to decline and have been only partially offset by increased<br />
demand and/or migration of customers to IP-based platforms. IP-based<br />
solutions are also subject to downward pricing pressure, lower margins<br />
and technological evolution. Capital investments in wireline infrastructure<br />
are required to facilitate this ongoing transition process for all incumbent<br />
local exchange carrier (ILEC) entities including us.<br />
Business<br />
In the business market, price-discounted bundling of local access,<br />
wireless and advanced data and IP services has evolved to include<br />
web-based and e-commerce services, as well as other IT services and<br />
support. Non-traditional competitors such as Microsoft have entered<br />
the telecommunications space through new products like Unified<br />
Communications, which redirect and deliver email, voice and text<br />
messages from a variety of telecommunications and IT systems to the<br />
device nearest the intended recipient. With this broader bundling of<br />
traditional telecommunications services and IT services, we increasingly<br />
88 . <strong>TELUS</strong> 2012 ANNUAL REPORT<br />
face competition from pure Internet and IT hardware, software and<br />
business process/consulting companies. Cable-TV companies are<br />
targeting the SMB market with their VoIP services. The result is that<br />
traditional and non-traditional competitors are now focused on providing<br />
a broad range of telecommunications services to the business market,<br />
particularly in major urban areas.<br />
Risk mitigation in the business wireline market: We continue to increase<br />
our capabilities through a combination of strategic acquisitions and<br />
partnerships, a focus on priority vertical markets (public sector, healthcare,<br />
financial services, energy and telecommunications wholesale), expansion<br />
of strategic solution sets in the enterprise market, and a mass modular<br />
approach in the SMB market (including services such as <strong>TELUS</strong> Business<br />
One and <strong>TELUS</strong> Future Friendly Office). Through <strong>TELUS</strong> Health, we<br />
have leveraged our systems and proprietary solutions, as well as their<br />
reach and brand, to extend our footprint in healthcare, benefit from<br />
the investments being made by governments in eHealth, bring to market<br />
services targeted at consumers such as personal health records and<br />
tools to manage their health, pursue the transformation of the Canadian<br />
pharmacy benefit claims management sector and cross-sell more<br />
traditional telecommu nications products and services to the healthcare<br />
sector. We are also focused on implementing large enterprise deals<br />
that leverage our capital investments and capabilities.<br />
Consumer<br />
In the consumer wireline market, cable-TV companies and other<br />
competitors encounter minimal regulation and continue to combine a<br />
mix of residential local VoIP, long distance, HSIA and, in some cases,<br />
wireless services into one bundled and/or discounted monthly rate, along<br />
with their existing broadcast or satellite-based TV services. In addition,<br />
cable-TV companies continue to increase the speed of their HSIA<br />
offerings. To a lesser extent, other non-facilities-based competitors offer<br />
local and long distance VoIP services over the Internet and resell HSIA<br />
solutions. Erosion of our residential NALs is expected to continue as a<br />
result of this competition and ongoing technological substitution. Access<br />
line-associated revenues, including long distance, can be expected to<br />
continue to decline. Although the HSIA market is maturing, subscriber<br />
growth is expected to continue over the next several years. With a<br />
more mature HSIA market and the potential for higher-speed Internet<br />
service offerings from competitors, we may be constrained in our ability<br />
to maintain market share in B.C., Alberta and Eastern Quebec by the<br />
amount and timing of capital expenditures associated with maintaining<br />
competitive network access speeds.<br />
Risk mitigation in the consumer wireline market: We continue to expand<br />
the coverage and increase the speed of our high-speed Internet service<br />
and increase the coverage and capability of our IP-based Optik TV service<br />
in B.C., Alberta and Eastern Quebec (see Broadcasting below and<br />
Section 2.2 Strategic imperatives). The provision of Optik TV service<br />
helps us attract pull-through Internet subscriptions and generally counter<br />
cable-TV competition in its own incumbent markets, and to retain<br />
and grow revenues with a bundled offering of local and long distance<br />
telephony, HSIA and TV entertainment services. <strong>TELUS</strong> Satellite TV<br />
service in Alberta and B.C. complements IP TV service, enabling us to<br />
more effectively serve households that are not currently on our IP TV<br />
network footprint and leverage our strong distribution and marketing<br />
presence. <strong>TELUS</strong> Satellite TV service is made possible by an agreement<br />
with Bell Canada.
Broadcasting<br />
We offer Optik TV service to more than 2.4 million households in B.C.,<br />
Alberta and Eastern Quebec, and continue targeted roll-outs to new<br />
areas. While <strong>TELUS</strong> TV provides numerous interactivity and customization<br />
advantages, there can be no assurance that we will be successful in<br />
achieving our plans of obtaining a sizable share of the TV services market<br />
or that implementation costs or projected TV revenues will be as planned.<br />
Risk mitigation: Fully digital <strong>TELUS</strong> TV is offered as both an IP-based<br />
service (in urban markets of B.C., Alberta and Eastern Quebec) and<br />
a satellite-based service (in B.C. and Alberta). We broadened the<br />
addressable market for our high-definition (HD) TV services through the<br />
deployment of ADSL2+ technology and upgrades to VDSL2 technology.<br />
In February 2010, we launched an upgrade of our IP TV middleware<br />
to Microsoft Mediaroom. These developments enabled our June 2010<br />
launch of the Optik brand, featuring a suite of advanced TV and highspeed<br />
Internet services, and facilitated a 33% expansion in the <strong>TELUS</strong><br />
TV subscriber base in 2012.<br />
Increasing vertical integration into broadcast content<br />
ownership by competitors<br />
We are not currently seeking to be a broadcast content owner, but our<br />
major competitors own and continue to acquire broadcast content assets.<br />
Increased vertical integration could result in content being withheld from<br />
us or being made available to us at inflated prices.<br />
Risk mitigation: Our strategy is to aggregate, integrate and make accessible<br />
content and applications for customers’ enjoyment. We do not<br />
believe it is necessary to own content to make it accessible to customers<br />
on an economically attractive basis, subject to timely and strict regulatory<br />
enforcement of the CRTC’s vertical integration safeguards to prevent<br />
undue preference by vertically integrated competitors. (See Section 10.3<br />
Regulatory matters – Broadcasting distribution undertakings.)<br />
10.2 Technology<br />
Technology is a key enabler for us and our customers. However,<br />
technology evolution brings risks, uncertainties and opportunities. We<br />
vigorously maintain short-term and long-term technology strategies<br />
to optimize our selection and timely use of technology, while minimizing<br />
the associated costs, risks and uncertainties. Following are the main<br />
tech nology risks and uncertainties and how we proactively address them.<br />
Subscriber demand for data may challenge wireless networks<br />
and is expected to be accompanied by decreasing prices<br />
The demand for wireless data services is growing at unprecedented<br />
rates, driven by greater broadband penetration, growing personal<br />
connectivity and networking, increasing affordability of smartphones<br />
and high-usage data devices (such as smartphones, mobile Internet<br />
keys and tablets), machine-to-machine data applications, richer<br />
multimedia services and applications, and wireless price competition.<br />
Given the highly competitive wireless business environment in Canada,<br />
it is expected that wireless data revenues will grow more slowly than<br />
demand for bandwidth. Rising data traffic levels and the fast pace of data<br />
device innovation present challenges to adequately provision capacity<br />
and maintain high service levels.<br />
MANAGEMENT’S DISCUSSION & ANALYSIS: 10<br />
Risk mitigation: Our investments in LTE and HSPA+ networks position<br />
us to meet capacity demands and challenges in the near future. We<br />
expect to implement further standards-based enhancements that are<br />
ready for commercial deployment to these networks. In addition, our<br />
investments in IP networks, IP/fibre cell-site backhaul and a softwareupgradeable<br />
radio infrastructure will support the future evolution<br />
to LTE-advanced technologies. LTE-advanced is expected to further<br />
increase network capacity and speed, reduce delivery costs per<br />
megabyte of data, enable richer multimedia applications and services,<br />
and deliver a superior subscriber experience.<br />
Rapid growth of wireless data volumes requires optimal and efficient<br />
utilization of our spectrum holdings. We aim to achieve efficient utilization<br />
of our spectrum holdings and position ourselves to meet rising levels of<br />
data traffic through the continued deployment of HSPA+ and LTE technologies,<br />
the eventual launch of LTE-advanced technology and ongoing<br />
development of a capacity management toolkit. Our spec trum strategy<br />
is designed to further strengthen our ability to deliver the mobile Internet<br />
to Canadians in the future. In line with this strategy, we intend to participate<br />
in upcoming spectrum auctions (see Section 10.3 Regulatory<br />
matters – Future availability and cost of wireless spectrum). If we are<br />
successful in our bids, the additional spectrum will likely provide additional<br />
capacity and mitigate risks from growth in data traffic, as well as allow<br />
for economic deployment of LTE services in rural coverage areas.<br />
Implementation of HSPA+ and LTE technologies and systems<br />
As part of a natural 4G network progression, we are committed<br />
to LTE and HSPA+ technology to support medium-term and long-term<br />
growth of mobile broadband services. We successfully launched our<br />
HSPA+ network in November 2009, under a reciprocal network access<br />
agreement with Bell Canada that sped up the initial network roll-out<br />
and reduced our costs of deployment nationally. We continue to expand<br />
HSPA+ capacity and coverage, which now reaches more than 97% of<br />
Canada’s population. We began construction of our urban LTE network<br />
in the second half of 2011 and launched LTE-based services in 14 metropolitan<br />
areas in February 2012. Including reciprocal network access<br />
agreements, our LTE coverage expanded to reach more than two-thirds<br />
of Canadians by the end of 2012. LTE delivers peak manufacturer-rated<br />
download speeds of up to 75 Mbps (typical speeds of 12 to 25 Mbps<br />
expected). LTE devices that we sell will also roam onto our extensive<br />
HSPA+ network (including HSPA+ dual-cell technology).<br />
An extensive roll-out of LTE in rural areas is dependent on future<br />
Industry Canada wireless spectrum auction rules and timing of such<br />
auctions (see Section 10.3 Regulatory matters – Future availability and<br />
cost of wireless spectrum). Spectrum in the 700 MHz range has superior<br />
propagation capabilities that make it effective and efficient in covering<br />
Canada’s expansive rural geography. In addition, these same capabilities<br />
improve the quality of in-building coverage in urban areas. We plan our<br />
overall wireless and wireline capital intensity level, excluding any capital<br />
that may be required for wireless spectrum auctions, to be approximately<br />
17% of consolidated revenues in 2013. However, there is the risk<br />
that our future wireless capital expenditures may be higher than those<br />
recorded historically in order to meet ongoing technology investments.<br />
Mature CDMA and iDEN wireless technologies must<br />
coexist with new HSPA+ and LTE networks<br />
We continue to support CDMA2000 3G wireless services (including<br />
EVDO Revision A), but no longer actively sell CDMA devices. We believe<br />
CDMA technology will continue to be used to support the current<br />
subscriber base and roaming agreements with other domestic and<br />
foreign carriers.<br />
<strong>TELUS</strong> 2012 ANNUAL REPORT . 89
We continue to support our Mike Push to Talk (PTT) service using<br />
iDEN technology and we plan to launch an LTE-based PTT solution.<br />
Sprint-Nextel, which provides U.S. roaming for our Mike services, plans<br />
to turn off its iDEN network in mid-2013. Mike subscribers represent a<br />
small percentage of our wireless subscriber base.<br />
CDMA and iDEN coexistence with HSPA+ and LTE, and eventual<br />
decommissioning / re-purposing, must be managed appropriately<br />
to ensure optimal use of spectrum and tower facilities, reduce costs<br />
and minimize subscriber migration and retention risks.<br />
Risk mitigation: Our practice is to continually optimize capital investments<br />
to provide positive payback periods and flexibility in considering future<br />
technology evolutions. Some capital investments, such as towers,<br />
leasehold improvements and power systems, are technology-indifferent.<br />
We expect to leverage the economies of scale and handset variety of<br />
the LTE and HSPA+ device ecosystems. We continue to strategically<br />
migrate certain CDMA and Mike (iDEN) subscribers to high-speed LTE<br />
and HSPA+ data devices, thereby providing the potential to increase<br />
utilization of data services and stabilize revenue.<br />
Reciprocal network access agreements, principally with Bell Canada,<br />
facilitated our rapid deployment of next-generation wireless technologies<br />
and provided the means for us to better manage our capital expenditures.<br />
These agreements are expected to provide ongoing cost savings beyond<br />
the initial network build and flexibility to invest in service differentiation.<br />
We maintain close co-operation with our network technology suppliers<br />
and operator partners to influence and benefit from developments<br />
in HSPA+ and LTE technologies. By contracting our suppliers to provide<br />
technology solutions that are amenable to future improvements, such<br />
as LTE-advanced, we can mitigate the operational disruption during<br />
technology transitions. Fundamental to our strategy is the reuse and<br />
redeployment of application servers and network elements that are<br />
technology-indifferent, such as messaging into the latest radio access<br />
technology. This enables us to invest in radio-based technologies<br />
as they evolve, without the need to replace these application servers.<br />
Standardization and deployment of 4G LTE technologies<br />
may not keep pace with growing demand for data<br />
Standardization and deployment of 4G LTE technologies aligned with<br />
the need for additional network capacity required to address the surging<br />
demand for wireless data. However, just as with any other new wireless<br />
technology, significant challenges remain that the industry needs to<br />
overcome, including: harmonization of global spectrum, intellectual<br />
property rights, support for voice and short messaging service (SMS),<br />
interoperability, device availability, technology maturity, operational<br />
readiness and costs.<br />
The surge of mobile broadband traffic resulting from the proliferation<br />
of smartphones and data devices, along with larger data volumes driven<br />
by the need for continuous connectivity and new applications, are<br />
expected to continue to stress the capabilities of current 4G networks.<br />
Risk mitigation: Our wireless networks are ready to evolve through<br />
software upgrades to support enhancements in HSPA+ and LTE that<br />
improve performance, capacity and speed. In parallel, and complementary<br />
to the evolution and growth of HSPA+ and LTE, we continue to<br />
develop a comprehensive capacity management toolkit that is helping<br />
address traffic growth challenges and complement new technologies.<br />
90 . <strong>TELUS</strong> 2012 ANNUAL REPORT<br />
Wireless handset supplier concentration and market power<br />
The popularity of certain models of smartphones and tablets, such as<br />
those from Apple and Samsung, has resulted in a growing reliance on<br />
these manufacturers, which may increase the market power that these<br />
suppliers have over us.<br />
Risk mitigation: We offer and promote alternatives, including Android<br />
devices, to provide greater choice for consumers and to help lessen our<br />
dependence on a few key suppliers.<br />
Support systems will be increasingly critical<br />
to operational efficiency<br />
We have a very large number of interconnected operational and business<br />
support systems, and complexity has been increasing. This is typical of<br />
established telecommunications providers that support a wide variety<br />
of legacy and emerging telephony, mobility, data and video services. The<br />
development and launch of a new service typically requires significant<br />
systems development and integration efforts. Management of associated<br />
development and ongoing operational costs is a significant factor in<br />
maintaining a competitive position and profit margins. We are proactive<br />
in evolving to next-generation support systems, which leverage industry<br />
integration and process standards. As next-generation services are<br />
introduced, they must be designed to work with next-generation systems,<br />
frameworks and IT infrastructures, and at the same time, must be<br />
compatible with legacy services and support systems. This introduces<br />
uncertainty with respect to the speed and costs of development and<br />
regression tests necessary to deliver solutions with the desired effect.<br />
Risk mitigation: In line with industry best practice, our approach is<br />
to separate business support systems (BSS) from operational support<br />
systems (OSS) and underlying network technology. Our aim is to<br />
decouple the introduction of new network technologies from the services<br />
sold to customers so that both can evolve independently. This allows<br />
us to optimize network investments while limiting the impact on customer<br />
services, and facilitate the introduction of new services by driving BSS/<br />
OSS functions with configurable data rather than program changes.<br />
In addition, we actively participate in the TeleManagement Forum<br />
that is working to develop standard industry-defined modules in order<br />
to reduce cost through scale and increase adoption through scope.<br />
We have established a next-generation BSS/OSS framework to ensure<br />
that, as new services and technologies are developed, they are part<br />
of the next-generation framework to ease the retirement of legacy<br />
systems in accordance with TeleManagement Forum’s Next Generation<br />
Operations Systems and Software program.<br />
Restructuring of vendors may impact our networks and services<br />
We have relationships with a number of vendors, which are important<br />
in supporting network evolution plans and timelines and providing<br />
services to our customers. We face the risk that some vendors could<br />
discontinue products we use, or that vendors may experience business<br />
difficulties, restructure their operations, or be consolidated with other<br />
suppliers, which could affect their ability to support all of their products<br />
in the future. There can be no guarantee that the outcome of any<br />
particular vendor difficulty will not affect the services that we provide<br />
to our customers, or that we will not incur additional costs to continue<br />
providing services. Certain customer needs and preferences may<br />
not be aligned with our vendor selection or product and service offering,<br />
which may result in limitations on growth or loss of existing business.
Risk mitigation: We consider these possible outcomes when planning<br />
for our future growth, maintenance and support of existing equipment<br />
and services. We have a comprehensive contingency plan for multiple<br />
scenarios, including working with multiple vendors and maintaining<br />
ongoing strong vendor relations.<br />
Evolving wired broadband access technology standards may<br />
outpace projected access infrastructure investment lifetimes<br />
The technology standards for broadband access over copper loops<br />
to customer premises are evolving rapidly, enabling higher broadband<br />
access speeds. The evolution is fuelled by user appetite for faster connectivity,<br />
the threat of increasing competitor capabilities and offerings,<br />
growing use of OTT applications and the desire of service providers like<br />
us to offer new services, such as IP TV, that require greater bandwidth.<br />
In general, the evolution to higher broadband access speeds is achieved<br />
by deploying fibre further out from the central office, thus shortening<br />
the copper loop portion of the access network, and using faster modem<br />
technologies on the shortened copper loop. However, new access technologies<br />
are evolving faster than the traditional investment cycle for<br />
access infrastructure. The introduction of these new technologies and<br />
the pace of adoption could result in increased requirements for capital<br />
funding not currently planned, as well as shorter estimated useful lives<br />
for certain existing infrastructure, which would increase depreciation<br />
and amortization expenses.<br />
Risk mitigation: As part of our multi-year broadband build program, we<br />
upgraded substantial parts of our network to fibre to the neighbourhood<br />
(FTTN) technology. We continue to make incremental investments to<br />
this infrastructure in order to maintain our ability to support competitive<br />
services – most recently, the upgrade to VDSL2, which supports typical<br />
download speeds of 5 to 25 Mbps, and bonding technologies, which<br />
support even higher download speeds. In addition, we are actively<br />
deploying fibre to the home (FTTH) technologies, which support bandwidths<br />
higher than any other technology, in new greenfield areas.<br />
In addition to ongoing enhancements to FTTN, we actively monitor<br />
the development and carrier acceptance of competing proposed FTTx<br />
standards (such as FTTH and fibre to the distribution point (FTTDp).<br />
One or more of these fibre-based solutions may be a more practical<br />
technology to deploy in brownfield neighbourhoods or multiple dwelling<br />
units (MDUs) than the current xDSL deployments on copper loops.<br />
We are exploring business models for economic deployment of fibrebased<br />
technologies in areas currently connected by copper.<br />
The evolution of these access architectures and corresponding<br />
standards, enabled with quality of service standards and network traffic<br />
engineering, all support our Future Friendly Home ® strategy to deliver<br />
IP-based Internet, voice and video services over a common broadband<br />
access infrastructure.<br />
MANAGEMENT’S DISCUSSION & ANALYSIS: 10<br />
IP-based telephony as a replacement for legacy analogue<br />
telephony is evolving and cost savings are uncertain<br />
We continue to monitor the evolution of IP-based telephony technologies<br />
and service offerings and have developed a consumer solution for<br />
IP-based telephony through broadband access in accordance with<br />
our strategy and standards. Currently this solution is intended to replace<br />
legacy analogue telephone service in areas that are served by fibre-based<br />
facilities. However, this could expand to provide additional telephone<br />
services over the same line as existing analogue service. We are also in<br />
the process of designing and testing our next-generation IP telephony<br />
solution for business users, which is intended to replace existing, endof-life<br />
business VoIP platforms as well as address areas that are served<br />
via fibre access.<br />
One of the realities of VoIP in the consumer space is that the actual<br />
state of technology developed to inter-work telephony, video and Internet<br />
access on the same broadband infrastructure is in its infancy and<br />
there are risks and uncertainties to be addressed, such as ensuring all<br />
services can be delivered simultaneously to the home (and to different<br />
devices within the home) with uncompromised quality. These issues<br />
are exacerbated when the exchange of information is between service<br />
providers with different broadband infrastructures.<br />
A long-term technology strategy is to move all services to IP to<br />
simplify the network, reduce costs and enable advanced Future Friendly<br />
Home services. Pursuing this strategy to its full extent would involve<br />
transitioning our standard telephone service offering to IP-based telephony<br />
and phasing out legacy analogue-based telephone service.<br />
To this point, our legacy voice network infrastructure could be simplified<br />
if regular analogue telephone lines were discontinued in favour of<br />
digital-only broadband access lines supporting all services including<br />
telephony, Internet and video. However, digital-only broadband access<br />
may not be feasible or economical in many areas for some time, particularly<br />
in rural and remote areas. We expect to support both legacy<br />
and broadband voice systems for some time and incur costs to maintain<br />
both systems. There is a risk that investments in broadband voice may<br />
not be accompanied by reductions in the costs of maintaining legacy<br />
voice systems. There is also the risk that broadband access infrastructure<br />
and corresponding IP-telephony platforms may not be in place in time<br />
to avoid some reinvestment in traditional switching platforms to support<br />
the legacy public switched telephone network access base in certain<br />
areas, resulting in some investment in line adaptation in non-broadband<br />
central offices.<br />
If we were to migrate towards a fully IP-based voice solution,<br />
the level of effort required to migrate customers could be costly. We are<br />
observing a large migration of users away from traditional residential<br />
voice services onto wireless or competitive VoIP offerings, creating the<br />
possibility, when combined with long migration times, of significant overinvestment<br />
in an alternative solution for customers who may not be<br />
available to migrate. Migration to a DSL-based primary voice offering<br />
will also require us to develop a strategy around battery backup,<br />
proactive customer premises equipment replacement and increased<br />
in-home support (truck rolls). Similarly, hosted business IP telephony<br />
has not experienced the uptake industry analysts had predicted<br />
and its long-term future is unclear.<br />
<strong>TELUS</strong> 2012 ANNUAL REPORT . 91
Risk mitigation: We continue to deploy residential IP-based voice<br />
technologies into fibre-based communities and work with vendors<br />
and the industry to assess the technical applicability and evolving<br />
cost profiles of proactively migrating legacy customers onto IP-based<br />
platforms, while striving to adhere to CRTC commitments and customer<br />
expectations. Our ongoing investments in FTTN and access technologies<br />
should enable a smoother future evolution of IP-based telephony.<br />
We are also working with manufacturers to optimize the operations,<br />
cost structure and life expectancy of analogue systems and solutions<br />
so that some of this infrastructure evolves to a point where it can<br />
form a part of the overall evolution towards IP. Additionally, IP-based<br />
solutions that we are cur rently deploying are capable of supporting a<br />
wide range of customers and services to help limit our exposure to<br />
any one market segment. For example, the new business VoIP platform<br />
is also capable of supporting consumer services and OTT capabilities,<br />
in addition to a pure business VoIP offering. Going forward, as our<br />
wireless services evolve, we will continue to assess the opportunity<br />
to further consolidate technology silos into a single voice service<br />
environment. We are looking at opportunities to rationalize our existing<br />
legacy voice infrastructure in order to manage costs. We are also<br />
increasing our focus on driving the costs out of VoIP services, and are<br />
working with our vendors and partners to reduce the cost structure<br />
of VoIP deployments.<br />
Convergence in a common IP-based application environment<br />
for telephony, Internet and video is complex<br />
The convergence of wireless and wireline voice, Internet and video<br />
in a common IP-based application environment, carried over a common<br />
IP-based network, provides opportunities for cost savings and for the<br />
rapid development of more advanced services that are also more flexible<br />
and easier to use. However, the transformation from individual silo<br />
systems and architectures to a common environment is very complex<br />
and could be accompanied by implementation errors, design issues<br />
and system instability.<br />
Risk mitigation: We substantially completed the transition of our previous<br />
IP TV middleware to Microsoft Mediaroom in 2011 and we continue<br />
to expand the new platform. We mitigate implementation risk through<br />
modular architectures, lab investments, partnering with system integrators<br />
where appropriate, employee trials, and using hardware that is<br />
common to most other North American IP TV deployments. We strive<br />
to ensure that our IP TV deployment is part of an open framework that<br />
will fit into the overall transformation strategy once standards are ratified<br />
and the actual implementations have stabilized, particularly with the<br />
set-top box. We are also active in a number of standards bodies such<br />
as the MEF and IP Sphere to help ensure its IP infrastructure strategy<br />
leverages standards-based functionality to further simplify our networks.<br />
The emergence of OTT services presents challenges<br />
to network capacity and conventional business models<br />
OTT services are a new category of services being delivered over the<br />
Internet and compete directly with traditional pay-TV services. OTT<br />
video services in particular have rapidly become the largest source of<br />
traffic on the North American Internet backbone. OTT service providers<br />
do not invest in, or own, networks and their growing services present<br />
a challenge to Internet service providers and network owners to prevent<br />
network congestion.<br />
92 . <strong>TELUS</strong> 2012 ANNUAL REPORT<br />
Risk mitigation: We have designed a robust IP network that has not<br />
experienced significant congestion problems through 2012. However,<br />
as additional OTT providers launch services and offer higher resolution<br />
video over the Internet, we may be required to make larger investments<br />
in the network to support this capacity and develop new business and<br />
regulatory models for dealing with the OTT providers.<br />
10.3 Regulatory matters<br />
Regulatory developments could have a material impact<br />
on our operating procedures, costs and revenues<br />
Our telecommunications and broadcasting services are regulated<br />
under federal legislation by the Canadian Radio-television and<br />
Telecommunications Commission (CRTC), Industry Canada and Heritage<br />
Canada. The CRTC has forborne from regulating prices for services<br />
offered in competitive markets, such as local residential and business<br />
services in selected exchanges, long distance and some data services,<br />
and does not regulate the pricing of wireless services. Local telecommunications<br />
services that are not forborne are regulated by the CRTC<br />
using a price cap mechanism.<br />
The outcome of the regulatory reviews, proceedings and appeals<br />
discussed below and other regulatory developments could have a material<br />
impact on our operating procedures, costs and revenues. The CRTC’s<br />
announced priorities for public proceedings and other initiatives through<br />
to 2015 include: a review of methods to establish wholesale prices<br />
(for regulated services), voice network interconnection implementation,<br />
implementation of the vertical integration decisions, stolen wireless<br />
handsets, telecommunications accessibility issues for the disabled and<br />
deployment of a public alert system.<br />
Radiocommunication licences regulated by Industry Canada<br />
All wireless communications depend on the use of radio transmissions<br />
and, therefore, require access to radio spectrum. Under the<br />
Radiocommunication Act, Industry Canada regulates, manages and<br />
controls the allocation of spectrum in Canada, and licenses frequency<br />
bands and/or radio channels within various frequency bands to<br />
service providers and private users. Voice and data wireless communications<br />
via cellular, specialized mobile radio (SMR), enhanced<br />
specialized mobile radio and personal communications services<br />
(PCS) systems, among others, require such licences. Our PCS and<br />
cellular licences include various terms and conditions, such as:<br />
. Meeting Canadian ownership requirements<br />
. Meeting obligations regarding coverage<br />
. Spending at least 2% of certain PCS and cellular revenues<br />
on research and development<br />
. Annual <strong>report</strong>ing<br />
. Mandated roaming and antenna site sharing to competitors.<br />
While we believe that we are substantially in compliance with our licence<br />
conditions, there can be no assurance that we will be found to comply<br />
with all licence conditions, or if found not to be compliant, that a waiver<br />
will be granted, or that the costs to be incurred to achieve compliance<br />
will not be significant. Initial licence fees and <strong>annual</strong> renewal fees are<br />
payable for licences that have not been obtained via spectrum auction.
Future availability and cost of wireless spectrum<br />
On March 14, 2012, the Canadian federal government initiated written<br />
consultations to develop the rules for two spectrum auctions, as well as<br />
changes to restrictions on foreign ownership (see Changes to restrictions<br />
on foreign ownership for small common carriers below). Industry Canada<br />
plans to auction spectrum in the 700 MHz band, currently expected in<br />
the second half of 2013, to be followed by an auction for spectrum in the<br />
2,500–2,690 MHz bands in 2014.<br />
A 10 MHz cap was set on the amount of prime 700 MHz spectrum<br />
any individual bidder can acquire. We began urban construction of a<br />
wireless 4G LTE network in the second half of 2011 and launched services<br />
on this network in February 2012 using our AWS spectrum acquired in<br />
2008. An extensive roll-out of 4G LTE wireless service to rural markets is<br />
dependent on us bidding on and acquiring 700 MHz spectrum in the<br />
planned auction. Spectrum in the 700 MHz range has superior propagation<br />
capabilities that make it effective and efficient in covering Canada’s<br />
expansive rural geography. In addition, these same capabilities improve<br />
the quality of in-building coverage in urban areas.<br />
In addition to establishing rules for the 700 MHz auction, Industry<br />
Canada also announced its intent to auction spectrum at 2,500–2,690<br />
MHz in 2014. This spectrum is prime spectrum for LTE in urban locations.<br />
Currently most of this spectrum is held by Rogers Communications and<br />
Bell Canada through their Inukshuk partnership for fixed broadband.<br />
Under the auction rules all participants will be limited by a 40 MHz cap<br />
on bidding on this spectrum in each licence region. In those regions<br />
where incumbents exceed the spectrum cap, they will not be required<br />
to relinquish any existing spectrum holdings. Since Bell and Rogers<br />
already control sub stantial blocks of this spectrum, their ability to bid in<br />
the auction will be restricted absent any divestment of existing blocks.<br />
The cap provides an opportunity to significantly increase our spectrum<br />
holdings for LTE should we succeed in the auction. However there<br />
is no guarantee we will acquire all of the spectrum we might seek under<br />
the cap.<br />
As the outcomes of these future auctions are unknown, our capital<br />
outlay required to bid successfully and the amounts of spectrum that<br />
we may ultimately secure in each region are uncertain.<br />
Provincial consumer protection legislation / National<br />
wireless services consumer code<br />
A number of provinces have introduced, or plan to introduce, amendments<br />
to consumer protection legislation that directly or indirectly affect<br />
the terms and conditions of providing wireless services. The rules are<br />
not harmonized and create risks of significant compliance costs for us<br />
and other wireless providers. In 2012, we asked the CRTC to act to set<br />
mandatory uniform national guidelines.<br />
On October 11, 2012, the CRTC issued Telecom Notice of Consultation<br />
CRTC 2012-557, to establish a mandatory code to address the clarity<br />
and content of mobile wireless services contracts. This code is intended<br />
to be a clear and concise list of consumers’ rights and service providers’<br />
responsibilities. The CRTC released a draft code in January 2013 and a<br />
hearing beginning in February will lead to a national wireless code being<br />
implemented later in 2013 or early 2014. We are participating in this<br />
proceeding and support the establishment of a national wireless services<br />
code by the CRTC based on the existing Quebec code.<br />
Stolen wireless handsets initiative<br />
On November 8, 2012, the Canadian Wireless Telecommunications<br />
Association (CWTA) and Canada’s wireless carriers announced an<br />
initiative to help law enforcement agencies combat the theft of wireless<br />
devices. By September 30, 2013, the activation of any global system<br />
MANAGEMENT’S DISCUSSION & ANALYSIS: 10<br />
for mobile communication (GSM) or LTE device will verify that the device<br />
has not been <strong>report</strong>ed stolen in Canada and some other countries. This<br />
same capa bility is expected to be available in the U.S. by November 2013<br />
to help protect customers across North America from device theft.<br />
In addition, the CRTC plans to conduct a public proceeding to review<br />
this matter.<br />
Restrictions on foreign ownership<br />
We are subject to the foreign ownership and control restrictions imposed<br />
by the Telecommunications Act, the Radiocommunication Act and the<br />
Broadcasting Act and associated regulations. Although we believe that<br />
we are in compliance with the relevant legislation, there can be no assurance<br />
that a future CRTC, Industry Canada or Heritage Canada determination,<br />
or events beyond our control, will not result in us ceasing to<br />
comply with the relevant legislation. If such a development were to occur,<br />
the ability of our subsidiaries to operate as Canadian carriers under the<br />
Telecommunications Act or to maintain, renew or secure licences under<br />
the Radiocommunication Act and Broadcasting Act could be jeopardized<br />
and our business could be materially adversely affected.<br />
We must comply with the restrictions on ownership of voting shares<br />
by non-Canadians prescribed by Canadian laws, namely the Canadian<br />
Telecommunications Common Carrier Ownership and Control Regulations,<br />
the Telecommunications Act (collectively, the Telecommunications<br />
Regulations), the Broadcasting Act and the Radiocommunication Act.<br />
Specifically, to maintain our eligibility to operate certain of our subsid iaries<br />
that are Canadian carriers under these laws, the level of non-Canadian<br />
ownership of <strong>TELUS</strong> Common Shares cannot exceed 331 ⁄3% and we<br />
must not otherwise be controlled by non-Canadians. The Telecommunications<br />
Regulations give <strong>TELUS</strong>, which is a carrier-holding corporation<br />
of Canadian carriers, certain powers to monitor and control the level of<br />
non-Canadian ownership of our voting shares. These powers have been<br />
incorporated into <strong>TELUS</strong>’ Articles and were extended to also ensure compliance<br />
under both the Radiocommunication Act and the Broadcasting<br />
Act. These powers include the right to: (i) refuse to register a transfer of<br />
voting shares to a non-Canadian; (ii) require a non-Canadian to sell<br />
any voting shares; (iii) convert voting shares to non-voting shares; and<br />
(iv) suspend the voting rights attached to the voting shares in inverse<br />
order of registration. For example, in 2012 for a period of time, we<br />
suspended issuing registration numbers when significant buying of<br />
<strong>TELUS</strong> Common Shares by non-Canadians occurred and approached<br />
the foreign-ownership limit. The CRTC also reviewed our monitoring<br />
procedures in 2012 in response to a complaint from Globalive. On<br />
December 5, 2012, the CRTC denied Globalive’s request for a review<br />
of the ownership of <strong>TELUS</strong> in Telecom Decision CRTC 2012-665.<br />
Changes to restrictions on foreign ownership<br />
for small common carriers<br />
On March 14, 2012, the Canadian federal government announced<br />
that it would lift restrictions on foreign ownership for telecommunications<br />
common carriers whose <strong>annual</strong> revenues from the provision of telecommunications<br />
services in Canada represent less than 10% of the<br />
total <strong>annual</strong> revenues, as determined by the CRTC, from the provision<br />
of telecommunications services in Canada. The amendments to the<br />
Telecommunications Act subsequently received royal assent and are<br />
in force. This gives smaller wireless and wireline carriers the opportunity<br />
to raise foreign capital to fund their network construction, operating<br />
losses and spectrum bids in 2013 and/or 2014. These changes may<br />
also drive consolidation amongst smaller carriers or result in the change<br />
of control of a smaller carrier or carriers to a large, well-funded foreign<br />
carrier. We hope that these changes to foreign-ownership limits provided<br />
<strong>TELUS</strong> 2012 ANNUAL REPORT . 93
y the federal government are a first step towards the full liberalization<br />
of restrictions across the industry. The recent relaxation of restrictions<br />
on foreign ownership for “small” common carriers does not apply to<br />
broadcasting distribution undertakings.<br />
Broadcasting distribution undertakings<br />
We hold licences from the CRTC to operate terrestrial broadcasting<br />
distribution undertakings to serve various communities in B.C. and<br />
Alberta (renewed in 2009 for a second full seven-year term), and<br />
in Eastern Quebec (renewed in 2011 for a second full seven-year term).<br />
We also hold a licence to operate a national video-on-demand (VOD)<br />
undertaking (renewed until August 31, 2016). Our strategy is to aggregate,<br />
integrate and make accessible content and applications for customers’<br />
enjoyment. We do not believe it is necessary to own content, subject<br />
to adequate and timely regulatory oversight to prevent undue preference<br />
by vertically integrated competitors.<br />
Increasing vertical integration<br />
The broadcasting landscape has undergone significant consolidation,<br />
such as with the acquisition by Shaw of the programming services of<br />
Canwest Global (a transaction approved by the CRTC in October 2010)<br />
and the acquisition by Bell Canada Enterprises (BCE) of control of the<br />
programming services of CTVglobemedia (a transaction approved by the<br />
CRTC in March 2011). In addition, Rogers Communications and Quebecor<br />
continue to own content assets. The proposed acquisition by BCE of<br />
Astral Media announced in March 2012 was rejected by the CRTC on<br />
October 18, 2012, however, BCE and Astral as of November 19, 2012,<br />
resubmitted an application to the CRTC for approval and extended the<br />
date of closing out as far as mid-2013. The resubmitted application<br />
has yet to be made public by Bell, Astral or the CRTC. <strong>TELUS</strong> opposed<br />
BCE’s proposed first attempt to acquire Astral Media on the basis that<br />
such concentration of media assets within a large national distribution<br />
company would make BCE too dominant in the broadcasting sector and<br />
would result in a lessening of competition. <strong>TELUS</strong> expects to oppose<br />
and/or request safeguards against anti-competitive conduct in any future<br />
acquisition proposal of Astral Media by BCE or any other vertically<br />
integrated broadcasting company. The CRTC is expected to announce<br />
a public review process in the near future, including a public hearing<br />
to consider the resubmitted application in detail.<br />
CRTC policy decisions and enforcement proceedings<br />
Given the potential for anti-competitive behaviour in a more vertically<br />
integrated broadcasting market environment, the CRTC launched<br />
a policy hearing in June 2011 to consider what safeguards might be<br />
necessary to ensure healthy competition in the broadcasting sector.<br />
On September 21, 2011, the CRTC issued Broadcasting Regulatory Policy<br />
CRTC 2011-601 (Regulatory framework relating to vertical integration)<br />
that set clear safeguards to ensure competition. The decision applies<br />
to companies that own both broadcasting content and broadcasting<br />
distribution assets. We are a member of the Canadian Independent<br />
Distributors Group (CIDG), which filed a request for dispute resolution<br />
of specialty TV services controlled by Bell Media Inc.<br />
On April 5, 2012, in Broadcasting Decision CRTC 2012-208, the CRTC<br />
set out its determinations and expectations relating to: the packaging<br />
of programming services so that consumer choice is enhanced while<br />
ensuring that the objectives set out in the Broadcasting Act are fulfilled;<br />
pricing incentives; making non-linear rights available on commercially<br />
reasonable terms; and a final-offer arbitration process to set rates.<br />
The CRTC also indicated its preference for the parties to arrive at<br />
a commer cially negotiated agreement, prior to final-offer arbitration.<br />
94 . <strong>TELUS</strong> 2012 ANNUAL REPORT<br />
We were not able to conclude a commercially negotiated renewal<br />
agreement for carriage of Bell Media signals. Final-offer arbitration submis-<br />
sions and reply comments were filed with the CRTC in June 2012. On<br />
July 20, 2012, the CRTC issued Broadcasting Decision CRTC 2012-393,<br />
choosing our final offer over Bell Media’s and directing the parties to<br />
execute our final-offer affiliation agreement within five days. The CRTC<br />
recognized that our offer provided consumers greater choice and flexibility,<br />
and was innovative in its approach. Notably, our customers will<br />
continue to have the discretion to choose sports programming and are<br />
not forced to take sports programming as part of the basic “Essentials”<br />
channel package.<br />
While we are pleased that the CRTC has selected our final offer that<br />
is consistent with the policies adopted in Broadcasting Regulatory Policy<br />
CRTC 2011-601, the decision wording provides only weak commitment to<br />
enforcing the regulatory safeguards. We filed a new unrelated complaint<br />
under the vertical integration framework against Corus Entertainment Inc.<br />
in September 2012, relating to a denial of access to its Movie Central/<br />
HBO Canada content for <strong>TELUS</strong> Optik on the Go service, despite this<br />
same content being provided by Corus to its related distribution undertakings<br />
Shaw Cable and Shaw Direct. We requested that the Commission<br />
enforce the new “no head start” provision (S. 6.3 of the Pay Television<br />
Regulations). On November 27, 2012, the CRTC issued Broadcasting<br />
Decision CRTC 2012-645 in which it disappointingly found that Corus<br />
Entertainment did not violate the Pay Television Regulations when it<br />
provided Movie Central/HBO Canada content to Shaw prior to making<br />
this content available to <strong>TELUS</strong>.<br />
Without timely and strict enforcement of the vertical integration safeguards,<br />
there is risk that vertically integrated competitors, who own both<br />
broadcast content and broadcasting distribution assets, could unfairly<br />
raise programming costs of non-vertically integrated companies such as<br />
<strong>TELUS</strong>, and/or attempt to withhold content on new media platforms<br />
(Internet and mobile platforms), or otherwise disadvantage us in attracting<br />
and retaining wireless or Optik TV customers.<br />
Risk mitigation for regulatory matters: We have advocated for the<br />
establishment by the CRTC of a national wireless services consumer<br />
code to reduce compliance costs and standardize the terms and<br />
conditions of service.<br />
In respect of restrictions on foreign ownership, we continue to<br />
advocate for and encourage the Government to expeditiously move<br />
to implement a symmetrical foreign-ownership regime for both telecommunications<br />
and broadcast distribution. With respect to the foreign<br />
ownership of <strong>TELUS</strong> Common Shares, we have robust and effective<br />
controls in place to ensure that foreign-ownership levels are respected<br />
through a reservation and declaration system. In addition, we have a<br />
number of remedies available to us under the Telecommunications Act<br />
that are reflected and available to us under <strong>TELUS</strong>’ Articles.<br />
In the case of the distribution of broadcasting content, we support<br />
a symmetrical regime under the Broadcasting Act that ensures all<br />
Canadian consumers continue to have equitable access to broadcast<br />
content irrespective of the distributor or platform they choose. We believe<br />
that, as long as content is regulated to achieve cultural objectives, this<br />
is in the best interest of all carriers and their customers. We continue<br />
to advocate the enforcement of the CRTC vertical integration policy and<br />
will continue to advocate for further meaningful enforcement and<br />
safeguards as required.
10.4 Human resources<br />
Our success depends on the abilities, experience and engagement of<br />
our team members. Competition for highly skilled and entrepreneurial<br />
management and front-line employees is intense in the telecommunications<br />
industry. The loss of key employees – or deterioration in<br />
overall employee morale and engagement resulting from organizational<br />
changes, any unresolved collective agreements, or ongoing cost reduction<br />
initiatives – could have an adverse impact on our growth, business<br />
and profitability.<br />
With competition expanding in the telecommunications industry,<br />
employee retention risk is expected to remain elevated in 2013. We<br />
aim to attract and retain key employees through both monetary and<br />
non-monetary approaches, and strive to both protect and improve<br />
engagement levels. The risk of a future decline in <strong>TELUS</strong> share prices<br />
could negatively impact the effectiveness of medium-term and longterm<br />
retention incentives, which are share-based compensation.<br />
Risk mitigation: Our compensation and benefits program is designed<br />
to support our high-performance culture and is both market-driven<br />
and performance-based. It includes:<br />
. Competitive base salary<br />
. An employee performance bonus that is tied directly to corporate<br />
profitability as well as individual and corporate operational results<br />
. Share-based compensation for eligible employees<br />
. <strong>TELUS</strong> Employee Share Purchase plan available to all domestic<br />
full-time and part-time employees.<br />
Medium-term and long-term performance incentives (share-based compensation)<br />
for key personnel generally have three-year vesting periods.<br />
The increase in value of <strong>TELUS</strong> shares over the past three years has<br />
increased the effectiveness of these retention incentives. Where required,<br />
we continue to implement targeted retention solutions for employees<br />
with talents that are scarce in the marketplace. As well, a benefits<br />
program is offered that allows the tailoring of personal health, wellness,<br />
lifestyle and retirement choices to suit individual and family needs.<br />
By striving to ensure our compensation and benefits remain competitive,<br />
we seek to attract and retain key employees. With respect to<br />
ongoing program cost management, we hope to manage engagement<br />
levels through direct and upfront communication to all employees.<br />
A positive indicator in 2012 was a 10-point increase in the measure of<br />
employee engagement, which followed a 13-point increase the previous<br />
year. We believe the following were influencing factors:<br />
. Increased communications with front-line team members<br />
. A focus on the customer and additional support for those team<br />
members performing in that capacity<br />
. Success in the marketplace due to innovative high-quality products<br />
and services available to customers on our enhanced wireless and<br />
wireline networks.<br />
We expect to continue to focus on other non-monetary factors that<br />
have a clear alignment with engagement including:<br />
. Performance management<br />
. Career opportunities<br />
. Training and development<br />
. Recognition<br />
. Work styles (e.g. facilitating working remotely from home<br />
and alternative work locations).<br />
10.5 Process risks<br />
MANAGEMENT’S DISCUSSION & ANALYSIS: 10<br />
Systems and processes<br />
We have numerous complex systems and process change initiatives<br />
underway. There can be no assurance that the full complement of our<br />
various systems and process change initiatives, including those required<br />
to support changes in provincial sales tax regimes, will be successfully<br />
implemented or that sufficiently skilled resources will be available to<br />
complete all key initiatives planned for 2013 and beyond. There is risk<br />
that certain projects may be deferred or cancelled and the expected<br />
benefits of such projects may be deferred or unrealized.<br />
Risk mitigation: In general, we strive to ensure that system development<br />
priorities are selected in an optimal manner. Our project management<br />
approach includes extensive risk identification and contingency planning,<br />
scope and change control, and resource and quality management. The<br />
quality assurance of the solutions includes extensive functional, performance<br />
and revenue assurance testing, as well as capturing and utilizing<br />
lessons learned. In addition, we often move our business continuity<br />
planning and emergency management operations centre to a heightened<br />
state of readiness in advance of major systems conversions.<br />
Large enterprise deals<br />
Our operating efficiency and earnings may be negatively impacted by<br />
challenges with, or ineffective implementation of large enterprise deals,<br />
which may be characterized by service credits that lower revenues;<br />
significant upfront expenses and capital expenditures; and a need<br />
to anticipate, understand and respond to complex and multi-faceted<br />
enterprise customer-specific requirements. There can be no assurance<br />
that service implementation will proceed as planned and expected<br />
efficiencies will be achieved, which may impact return on investment or<br />
desired margins. We may also be constrained by available staff, system<br />
resources and co-operation of existing service providers, which may limit<br />
the number of large contracts that can be implemented concurrently in a<br />
given period and/or increase our costs related to such implementations.<br />
Risk mitigation: We have gained experience in implementing numerous<br />
large enterprise deals over a number of years and expect to continue to<br />
focus on implementing recent large enterprise contract wins. We expect<br />
to continue being selective as to which new large contracts we will bid<br />
on, and we continue our focus on the SMB market.<br />
We follow industry-standard practices for rigorous project management,<br />
including executive (senior) level governance and project oversight;<br />
appropriate project resources, tools and supporting processes; and<br />
proactive project-specific risk assessments and risk mitigation planning.<br />
We also conduct independent project reviews and internal audits to help<br />
monitor progress and identify areas that may require additional focus,<br />
and to identify systemic issues and learnings in project implementations,<br />
which may be shared among projects.<br />
<strong>TELUS</strong> 2012 ANNUAL REPORT . 95
Reorganizations<br />
Arising from our operational efficiency program, we carry out a number<br />
of operational consolidation, rationalization and integration initiatives each<br />
year that are aimed at improving our operating productivity and competitiveness.<br />
There can be no assurance that all planned efficiency initiatives<br />
will be completed, or that such initiatives will provide the expected<br />
benefits or will not have a negative impact on operating performance,<br />
employee engagement, financial results and customer service.<br />
Risk mitigation: We focus on and manage organizational changes through<br />
a formalized business transformation function by leveraging the expertise,<br />
key learnings and best practices gained from mergers, business integrations<br />
and efficiency-related reorganizations in recent years.<br />
Foreign operations<br />
Maintaining our international operations presents unique risks, including:<br />
country-specific risks (such as differences in political, legal and<br />
regulatory regimes and cultural values); lack of diversity in geographical<br />
locations; concentration of customers; different taxation regimes;<br />
infrastructure and security challenges; differences in exposure to and<br />
frequency of natural disasters; and the requirement for system processes<br />
that work across multiple time zones, cultures and countries. There can<br />
be no assurance that international initiatives and risk mitigation efforts<br />
will provide the benefits and efficiencies expected, or that there will not<br />
be significant difficulties in combining different management and cultures,<br />
which could have a negative impact on operating and financial results.<br />
Risk mitigation: Our strategy is to improve the diversity and geographic<br />
distribution of our operations, customers and conduct of business<br />
process outsourcing activities. We have expanded beyond our<br />
Philippines operations to include locations in Europe, Central America,<br />
the Caribbean region and the U.S. The continued expansion of<br />
international operations provides us with more geographic diversity,<br />
spreads political risk among foreign jurisdictions, provides us with<br />
the ability to serve cus tomers in multiple languages and in multiple time<br />
zones, and through network redundancy and contingency planning,<br />
provides the ability to divert operations in emergency situations. We<br />
continue to work with our inter national operations to extend operational<br />
best practices, to integrate and align international and domestic Canadian<br />
operations, as appropriate, and to ensure that internal controls are<br />
implemented, tested, monitored and maintained.<br />
Integration of acquisitions<br />
Post-merger and post-acquisition activities include the review and alignment<br />
of accounting policies, employee transfers and moves, information<br />
systems integration, optimization of service offerings and establishment<br />
of control over new operations. Such activities may not be conducted<br />
efficiently and effectively, negatively impacting service levels, competitive<br />
position and expected financial results.<br />
Risk mitigation: We have a team that performs post-merger integration<br />
(PMI). The PMI team applies an integration model, based on learnings<br />
from numerous previous post-acquisition integrations, which enhances<br />
and accelerates the standardization of our business processes and<br />
strives to preserve the unique qualities of acquired operations. PMI<br />
begins with strategic, pre-closing analysis and planning, and continues<br />
after closing with the plan execution. Initial plans are re-evaluated<br />
and assessed regularly, based on timely feedback received from the<br />
integration teams.<br />
96 . <strong>TELUS</strong> 2012 ANNUAL REPORT<br />
Data protection<br />
Some of our efficiency initiatives rely on offshoring of internal functions<br />
to partners domestically and abroad. To be effective, offshoring relationships<br />
require us to provide access to our data. Remote access to<br />
our data could lead to data being lost, compromised or accessed by<br />
third parties potentially for inappropriate use, negatively impacting our<br />
competitive position, financial results and brand.<br />
Risk mitigation: A core component of our strategy is for data to reside in<br />
our facilities in Canada, with the deployment of infrastructure to support<br />
partner connectivity to view our systems. Offshore partners are provided<br />
with remote views of the data without it being stored on local systems.<br />
Another core component of our strategy is payment card industry<br />
(PCI) compliance, a rigorous set of standards leveraging the latest security<br />
technology, such as encryption, to ensure the protection of customer<br />
credit card information. We are maintaining these capabilities in accordance<br />
with the ongoing PCI certification program.<br />
Real estate joint venture (<strong>TELUS</strong> Garden)<br />
Risks associated with the real estate joint venture include possible<br />
construction-related cost overruns, financing risks, reputational risks<br />
and, for the commercial component of the joint venture, leasing<br />
occupancy risks. There can be no assurance that <strong>TELUS</strong> Garden will<br />
be completed on budget or on time or obtain lease commitments as<br />
planned. Accordingly, we are exposed to the risk of loss on investment<br />
and loan amounts should the project’s business plan not be successfully<br />
realized, and reputational risks should the planned LEED standard<br />
quality of the project not be realized<br />
Risk mitigation: We have established a joint venture with subsidiaries<br />
of Westbank Holdings Ltd., a leading developer of large commercial<br />
and residential real estate projects, to develop <strong>TELUS</strong> Garden.<br />
Westbank brings considerable expertise in the successful management<br />
of devel opment projects of the scope and scale of <strong>TELUS</strong> Garden.<br />
The residential condominium project was substantially pre-sold prior<br />
to the commencement of construction, and additional deposits are<br />
due as construction proceeds. The commercial project obtained<br />
significant lease commitments from us and another major tenant prior<br />
to commencement of construction, and the proportion committed<br />
in February 2013 was over half of leasable space. The success of the<br />
commercial project will be dependent on the extent of additional<br />
lease commitments obtained in the future, the future leasing market<br />
in terms of demand for space and rates in Vancouver for high-quality<br />
commercial office space, as well as possible construction cost<br />
overruns. Budget-overrun risks for both the residential and commercial<br />
projects are mitigated through the use of fixed-price supply contracts,<br />
expert project management oversight and insurance of certain risks.
10.6 Financing and debt requirements<br />
Our business plans and growth could be negatively affected if<br />
existing financing is not sufficient to cover funding requirements<br />
Risk factors such as disruptions in the capital markets, sovereign credit<br />
concerns in Europe, increased bank capitalization regulations, reduced<br />
lending in general, or fewer Canadian chartered banks as a result of<br />
reduced activity or consolidation, could reduce capital available or<br />
increase the cost of such capital for investment grade corporate issuers<br />
such as <strong>TELUS</strong>. External capital market conditions could potentially<br />
affect our ability to make strategic investments and fund ongoing capital<br />
investment requirements.<br />
Risk mitigation: We may finance future capital requirements with<br />
internally generated funds, borrowings under the unutilized portion<br />
of our bank credit facility, use of securitized trade receivables, use<br />
of commercial paper, and/or the issuance of debt or equity securities.<br />
We have a shelf prospectus available until November 2013, under<br />
which, as at December 31, 2012, we can offer up to $2 billion of debt<br />
and/or equity. We believe adherence to our stated financial policies<br />
and the resulting investment grade credit ratings, coupled with our efforts<br />
to maintain a constructive relationship with banks, investors and credit<br />
rating agencies, continue to contribute to providing reasonable access<br />
to capital markets.<br />
Our $2 billion credit facility expires on November 3, 2016, and at<br />
the end of 2012, $1.8 billion of this credit facility was available. This facility<br />
allows us to continue to meet one of our financial objectives, which<br />
is to generally maintain $1 billion in available liquidity. As described in<br />
Section 7.6 Sale of trade receivables, <strong>TELUS</strong> Communications Inc.<br />
(TCI) has an agreement with an arm’s-length securitization trust under<br />
which it is able to sell an interest in certain of its trade receivables<br />
up to a maximum of $500 million, of which $100 million was available<br />
at December 31, 2012.<br />
Ability to refinance maturing debt<br />
At December 31, 2012, the only significant maturity of long-term debt<br />
in 2013 is the $300 million of 5.00% Notes due in June. In addition, we<br />
expect to participate in the upcoming spectrum auction in 2013 and<br />
will need to fund any spectrum licences purchased. We operate a com-<br />
mercial paper program (maximum of $1.2 billion) that permits access<br />
to currently low-cost funding. At December 31, 2012, we had $245 million<br />
of commercial paper issued, which must be refinanced on an ongoing<br />
basis to enable the cost savings relative to borrowing on the 2016 credit<br />
facility to be realized. Capital market conditions may prohibit the rolling<br />
of commercial paper at low rates.<br />
Risk mitigation: In 2012, we refinanced $300 million of 4.50% Notes that<br />
matured in March using low-rate commercial paper, while in December,<br />
we issued $500 million of 3.35% Notes maturing on March 15, 2023,<br />
and used the proceeds to reduce commercial paper outstanding.<br />
Our commercial paper program is fully backstopped by the 2016<br />
credit facility. We may issue additional long-term debt to refinance<br />
$300 million maturing in June 2013 and potential spectrum purchases,<br />
although we expect to have sufficient unutilized credit facilities to<br />
refinance the debt and acquire spectrum without accessing the longterm<br />
debt markets. At December 31, 2012, our long-term debt was<br />
$6.26 billion, with various amounts maturing from 2013 to 2025<br />
(see Section 4.3 for a debt principal maturity profile).<br />
MANAGEMENT’S DISCUSSION & ANALYSIS: 10<br />
A reduction in <strong>TELUS</strong> credit ratings could impact<br />
our cost of capital and access to capital<br />
Our cost of capital could increase and access to capital might be affected<br />
by a reduction in the credit ratings of <strong>TELUS</strong> and/or TCI. There can be<br />
no assurance that we can maintain or improve current credit ratings.<br />
Risk mitigation: We seek to maintain debt credit ratings in the range<br />
of BBB+ to A–, or the equivalent. The four credit rating agencies that<br />
rate <strong>TELUS</strong> currently have ratings that are in line with this target, with<br />
a stable outlook or trend, and have also confirmed these ratings. We<br />
have financial policies in place that were established to help maintain<br />
or improve existing credit ratings. (See Section 7.4 Liquidity and capital<br />
resource measures.)<br />
Lower than planned free cash flow could constrain<br />
our ability to invest in operations or reduce debt<br />
We plan to generate free cash flow in the range of $1.2 to $1.4 billion<br />
in 2013 after investing approximately $1.95 billion of capital expenditures.<br />
Free cash flow excludes expenditures for purchases of spectrum<br />
licences, such as in the upcoming auction in the second half of 2013.<br />
(See the free cash flow definition in Section 11.2.) Among other things,<br />
free cash flow would be available to pay dividends to our shareholders.<br />
While anticipated cash flow is expected to be more than sufficient to<br />
meet current requirements and remain in compliance with our financial<br />
policies, these intentions could constrain our ability to invest in our<br />
operations for future growth. Higher cash income taxes in 2013, funding<br />
of defined benefit pension plans and any increases in corporate income<br />
tax rates in the future will reduce the after-tax cash flow otherwise available<br />
to return capital to our shareholders. If actual results are different<br />
from our expectations, there can be no assurance that we will not need<br />
to change our financing plans, including our intention to pay dividends<br />
according to the target payout guideline.<br />
Risk mitigation: Our Board of Directors reviews the dividend each quarter,<br />
based on a number of factors including a target dividend payout ratio<br />
guideline. These reviews resulted in our announcements in 2011 and<br />
2012 of four of six targeted semi-<strong>annual</strong> dividend increases through<br />
2013. The increases are to be normally declared in May and November,<br />
in the range of circa 10% <strong>annual</strong>ly and are not necessarily indicative<br />
of dividend increases beyond 2013. Based on announced dividend<br />
increases as of February 27, 2013, and 326 million shares outstanding,<br />
dividend payments would total approximately $835 million in 2013.<br />
Application of the amended accounting standard IAS 19 Employee<br />
benefits (2011) in fiscal 2013 will result in a non-cash reduction of our<br />
earnings (see Section 8.2 Accounting policy developments). Consequently,<br />
the Board of Directors approved a change in our dividend<br />
payout ratio guideline from 55 to 65% to 65 to 75% of net sustainable<br />
earnings on a prospective basis, effective for dividend declarations<br />
after January 1, 2013.<br />
Financial instruments<br />
Our financial instruments, and the nature of credit risks, liquidity risks and<br />
market risks that they may be subject to, are described in Section 7.8.<br />
<strong>TELUS</strong> 2012 ANNUAL REPORT . 97
10.7 Tax matters<br />
Income and commodity tax amounts, including tax expense,<br />
may be materially different than expected<br />
Our operations are complex and related tax interpretations, regulations<br />
and legislation that pertain to our activities are subject to continual<br />
change. Moreover, the implementation of new legislation in itself has its<br />
own complexities, including those of execution where multiple systems<br />
are involved, and interpretations in applying new rules to specific transactions,<br />
products and services. We collect and pay significant amounts<br />
of commodity taxes, such as sales and use taxes, harmonized sales<br />
taxes (HST), goods and services taxes (GST), provincial sales taxes (PST)<br />
and value-added taxes, to various taxation authorities. Actions by certain<br />
Canadian provinces have resulted in significant changes in this area.<br />
As a result of a referendum in 2011, British Columbia is reverting back<br />
to a form of PST effective April 1, 2013, which requires changes to<br />
76 systems and involves approximately 300 of our team members. We<br />
are also modifying our systems to accommodate changes for Quebec<br />
PST (or QST) harmonization that are effective January 1, 2013, as well as<br />
replacement of Prince Edward Island’s separate PST and GST with an<br />
HST effective April 1, 2013. The total cost to implement these changes<br />
is estimated at $10 to $11 million.<br />
We also accrue and pay income taxes in the hundreds of millions<br />
of dollars and have significant deferred income tax liabilities and income<br />
tax expense. Income tax amounts are based on our estimates, using<br />
accounting principles that recognize the benefit of income tax positions<br />
when it is more likely than not that the ultimate determination of the<br />
tax treatment of the positions will result in the benefit being realized.<br />
The assessment of the likelihood and amount of income tax benefits,<br />
as well as the timing of realization of such amounts, can materially affect<br />
the determination of net income or cash flows. As noted in Section 1.5<br />
Financial and operating targets for 2013, we currently expect to make<br />
cash income tax payments, net of recoveries, of approximately $390<br />
to $440 million in 2013. We expect the blended statutory income tax rate<br />
to range between 25% and 26% in 2013. These expectations can<br />
change as a result of changes in interpretations, regulations, legislation<br />
or jurisprudence.<br />
The timing concerning the monetization of deferred income tax<br />
accounts is uncertain, as it is dependent on our future earnings and<br />
other events. The amounts of deferred income tax liabilities are also<br />
uncertain, as the amounts are based upon substantively enacted future<br />
income tax rates in effect at the time, which can be changed by governments.<br />
The amounts of cash tax payments and deferred income tax<br />
liabilities are also based upon our anticipated mix of revenues among<br />
the jurisdictions in which we operate, which is also subject to change.<br />
The audit and review activities of the Canada Revenue Agency and<br />
tax authorities in other jurisdictions affect the ultimate determination<br />
of the actual amounts of commodity taxes payable or receivable, income<br />
taxes payable or receivable, deferred income tax liabilities and income<br />
tax expense. Therefore, there can be no assurance that taxes will be<br />
payable as anticipated and/or that the amount and timing of receipt or<br />
use of the tax-related assets will be as currently expected. Our experience<br />
indicates the taxation authorities are generally more aggressive in pursuing<br />
perceived tax issues and have increased the resources they put to<br />
these efforts. Economic uncertainty and government deficits have only<br />
served to exacerbate such aggressive practices.<br />
In order to provide comprehensive solutions to Canadian-based<br />
customers operating in foreign jurisdictions, we have entered into further<br />
arrangements for the supply of services in such foreign jurisdictions.<br />
98 . <strong>TELUS</strong> 2012 ANNUAL REPORT<br />
These activities, as well as the offshoring of certain business processes,<br />
have resulted in greater presence in the United States, United Kingdom,<br />
Philippines, Guatemala, El Salvador, Barbados, India, Romania and<br />
Bulgaria, which increases our exposure to multiple forms of taxation.<br />
Generally, each foreign jurisdiction has taxation peculiarities in the<br />
forms of taxation imposed (such as value-added tax, gross receipts tax<br />
or income tax) and legislation and tax treaties with Canada, as well<br />
as currency and language differences. Notwithstanding the usual differences,<br />
the telecommunications industry has unique issues that lead<br />
to uncertainty in the application or division of tax between domestic and<br />
foreign jurisdictions. Accordingly, our foreign expansion activities have<br />
increased our exposure to tax risks, from both financial and repu tational<br />
perspectives.<br />
Risk mitigation: We follow a Comprehensive Tax Conduct and Risk<br />
Management Policy that has been adopted by our Board of Directors.<br />
This policy outlines the principles underlying and guiding the roles of<br />
team members, their responsibilities, personal conduct, the method of<br />
conducting business in relation to tax law and the approaches to working<br />
relationships with external taxing authorities and external advisors. This<br />
policy recognizes the requirement to comply with tax laws in the context<br />
of the rights of <strong>TELUS</strong> as a taxpayer in the various jurisdictions in which<br />
it operates. The required components for control and mitigation of tax risk<br />
are outlined, as well as the delegation of authority to management on<br />
tax matters with Board and Audit Committee communication guidelines.<br />
In keeping with this policy, we maintain an internal Taxation department<br />
composed of professionals who are trained and educated in taxation<br />
administration and who maintain an up-to-date knowledge base of new<br />
developments in the underlying Canadian law, its interpretations and<br />
jurisprudence. We also have an experienced international team with<br />
knowledge of U.S. and other foreign tax laws, supplemented by U.S.<br />
and foreign external advisors, to provide tax advice and to assess foreign<br />
tax issues and risks. These teams review systems and process changes<br />
to ensure compliance with domestic and applicable international taxation<br />
laws and regulations. They are also responsible for the specialized<br />
accounting required for income taxes, and accordingly, they are charged<br />
with maintaining state-of-the-art knowledge of tax accounting developments<br />
and the implementation of such relevant measures, as required.<br />
Material transactions of <strong>TELUS</strong> are under continual review by our<br />
Taxation department whereby transactions of an unusual or non-recurring<br />
nature, in particular, are assessed from multiple risk-based perspectives.<br />
Tax-related transaction risks are regularly communicated to and<br />
reassessed by tax counsel as a check to initial exposure assessments.<br />
As a matter of regular practice, large and international transactions<br />
are reviewed by external tax advisors, while other third-party advisors<br />
may also be engaged to express their view as to the potential for tax<br />
exigibility. In 2012, we completed phase two of our enterprise-wide<br />
program to review our existing international structure, systems and<br />
processes and to develop a future mode of operation that will mitigate<br />
regulatory, legal and tax risks as we continue international expansion.<br />
We continue to review and monitor our foreign expansion activities<br />
to ensure that we take action to comply with the regulatory, legal and<br />
tax obligations. We engage external counsel and advisors as appropriate<br />
to provide advice and to prepare or review returns to enable us to<br />
comply in material respects with tax laws in the jurisdictions outside<br />
of Canada in which we have operations of any significance. The advice<br />
and returns provided by such advisors and counsel are reviewed<br />
for reasonableness by our internal Taxation team.
10.8 Health, safety and environment<br />
Team member health, wellness and safety<br />
Lost work time resulting from the physical injury or psychological illness<br />
of our team members can negatively impact organizational productivity<br />
and employee benefit costs.<br />
Risk mitigation: To minimize absences in the workplace, we support a<br />
holistic and proactive approach to team member health by providing<br />
comprehensive wellness, disability, ergonomic and employee assistance<br />
programs. To promote safe work practices, we have long-standing<br />
training and orientation programs for team members, contractors and<br />
suppliers who access our facilities. In addition to a robust active living<br />
strategy and proactive health screenings, the wellness strategy includes<br />
comprehensive support and training for managers. This includes workplace<br />
team support programs and access to short-term and long-term<br />
counselling for individual team members. However, there can be no<br />
assurance that these safety and health programs and practices will be<br />
effective in all situations.<br />
Concerns related to radiofrequency (RF) emissions<br />
from mobile phones and towers<br />
Cell phones and cell towers emit non-ionizing RF electromagnetic fields.<br />
While these fields do not carry sufficient energy to break chemical bonds<br />
or cause ionization in the human body and the only known biological<br />
effect is heating, one international epidemiological study in 2010 showed<br />
that long-term, heavy use of mobile phones was associated with a form<br />
of brain cancer (glioma), however, certain limitations in the study prevented<br />
a causal interpretation. Other epidemiological studies, including those<br />
with respect to cell phone towers, have not supported this association.<br />
Animal cancer and laboratory studies have found no evidence that<br />
RF fields at high levels are carcinogenic or cause DNA damage.<br />
In May 2011, the International Agency for Research on Cancer (IARC)<br />
classified RF electromagnetic fields as possibly carcinogenic to humans,<br />
but chance, bias and confounding could not be ruled out with reasonable<br />
confidence. The IARC also called for additional research into longterm,<br />
heavy use of mobile phones. This IARC classification of possible<br />
carcinogens includes 275 agents such as coffee and nickel.<br />
Although the evidence for a possible cancer risk is far from conclusive,<br />
the IARC and Health Canada have advised concerned cell phone users<br />
that they can take practical precautionary measures to reduce their<br />
RF emission exposure by limiting the length of cell phone calls, using<br />
hands-free devices, replacing cell phone calls with text messages<br />
and reducing children’s RF exposure.<br />
There can be no assurance that future studies, government regulations<br />
or public concerns about the health effects of RF emissions will<br />
not have an adverse effect on our business and prospects. For example,<br />
public concerns or government action could reduce subscriber growth<br />
and usage, and costs could increase as a result of modifying handsets,<br />
relocating wireless towers, and addressing any incremental legal<br />
requirements and product liability lawsuits that might arise.<br />
Risk mitigation: Industry Canada is responsible for establishing safe<br />
limits for signal levels of radio devices. We believe that the handsets and<br />
devices we sell, as well as our wireless towers and other associated<br />
devices, comply with all applicable Canadian and U.S. government safety<br />
standards. We continue to monitor new published studies, government<br />
regulations and public concerns on health impacts of RF exposure.<br />
MANAGEMENT’S DISCUSSION & ANALYSIS: 10<br />
Concerns related to contaminated property<br />
To conduct business operations, we own or lease a large number of<br />
properties. We have fuel systems for backup power generation that enable<br />
us to provide reliable service, but also pose an environmental risk. Spills<br />
or releases from these systems have occurred occasionally in recent<br />
years, but the significant portion of this risk is associated with sites contaminated<br />
by our historic practices or by previous owners. There were no<br />
significant changes to our environmental risk during 2012. Although we<br />
take proactive measures to identify and mitigate environmental exposures<br />
and employ an environmental management system (EMS) based on<br />
the ISO14001:2004 standard, there can be no assurance that specific<br />
environmental incidents will not impact our operations in the future.<br />
Risk mitigation: While our environmental risks are considered immaterial<br />
to our financial results, they are strategically important from a corporate<br />
social responsibility (CSR) perspective. Poor environmental performance<br />
or ineffective risk mitigation could have negative legal, brand or community<br />
impacts. Our EMS is designed to proactively identify and prioritize<br />
these risks. The specific risk posed by fuel systems is being addressed<br />
through a program to install containment and monitoring equipment<br />
at sites with systems of qualifying size. Further detailed assessment of<br />
environmental risk and mitigation activities can be found in our CSR<br />
<strong>report</strong> at telus.com/csr.<br />
Concerns related to climate change<br />
The scientific community’s general view is that anthropogenic sources<br />
of greenhouse gases such as carbon dioxide equivalency (CO2e) are<br />
likely accelerating the rate of global climate change. Such changes are<br />
a potential risk to our business operations. We estimate that our emissions<br />
in 2012 will be similar to 2011 at approximately 375,000 tonnes.<br />
Final emission totals for 2012 will be published in our 2012 CSR <strong>report</strong>.<br />
Risk mitigation: In 2010, we announced our climate change strategy,<br />
which includes a mitigation component focusing on energy and CO2e reduction, an adaptation component focusing on business continuity<br />
planning and readiness for the potential effects of a changing climate on<br />
our operations, and an innovation component, which helps customers<br />
and communities realize their climate change goals through technological<br />
product and service solutions. Our target is a 25% reduction in<br />
CO2e emissions over 2009 levels by 2020 and a 10% reduction in energy<br />
use over the same period. We are working to achieve these targets<br />
through network efficiency and technology upgrades, a comprehensive<br />
energy management program, real estate transformation (including LEED<br />
principles certification for construction of new buildings), increased use<br />
of video-conferencing and teleconferencing, ongoing fleet transformation<br />
and employee education. We measure our yearly emissions against our<br />
targets and actively pursue efficiency strategies to help reach our goals.<br />
Concerns related to electronic waste (e-waste)<br />
We have a responsibility to help ensure that equipment we use or sell<br />
is dealt with appropriately at the end of its life cycle. Improperly managed<br />
e-waste may be sent to landfills or developing countries which, due<br />
to a lack of disposal regulations, can contribute to environmental and<br />
health impacts.<br />
<strong>TELUS</strong> 2012 ANNUAL REPORT . 99
Risk mitigation: We have implemented an e-waste management program<br />
designed to provide approved recycling channels for both our external<br />
and internal electronic products. We monitor current and emerging government<br />
regulation and continue to improve our processes that provide<br />
customers with options to return their electronic devices. Returned devices<br />
are sent to approved Canadian facilities where they are refurbished and<br />
re-used or recycled by approved processors.<br />
Concerns related to conflict minerals<br />
The U.S. Securities and Exchange Commission (SEC) finalized new<br />
<strong>report</strong>ing requirements to disclose the use of designated minerals and<br />
metals mined in the Democratic Republic of Congo and adjacent<br />
countries. Cassiterite (a source of tin), wolframite (a source of tungsten),<br />
columbite-tantalite (or coltan, a source of tantalum) and gold are often<br />
referred to collectively as conflict minerals. Such minerals may be used<br />
in electronic and communications equipment that we use or sell. We are<br />
a signatory of the UN Global Compact and, as such, are committed<br />
to preventing human rights abuses that could result from our operations.<br />
Risk mitigation: New SEC <strong>report</strong>ing requirements for conflict minerals,<br />
mandated by Section 1502 of the Dodd-Frank Wall Street Reform and<br />
Consumer Protection Act, come into effect for us with our 2013 <strong>annual</strong><br />
<strong>report</strong>s. We have participated in industry discussions on this matter<br />
and support the overall intent of Dodd-Frank Section 1502 to address<br />
human rights violations in these countries. We are assessing our<br />
obligations under this act and expect to comply with the regulations<br />
in a manner consistent with industry peers.<br />
10.9 Litigation and legal matters<br />
Investigations, claims and lawsuits<br />
Given our size, investigations, claims and lawsuits seeking damages<br />
and other relief are regularly threatened or pending against us. It is not<br />
currently possible for us to predict the outcome of such claims, possible<br />
claims and lawsuits due to various factors, including: the preliminary<br />
nature of some claims; uncertain damage theories and demands; an<br />
incomplete factual record; uncertainty concerning legal theories, procedures<br />
and their resolution by the courts, both at the trial and the<br />
appeal level; and the unpredictable nature of opposing parties and their<br />
demands. Therefore, there can be no assurance that financial or<br />
oper ating results will not be negatively impacted.<br />
Subject to the foregoing limitations, management is of the opinion,<br />
based upon legal assessment and information presently available,<br />
that it is unlikely that any liability, to the extent not provided for through<br />
insurance or otherwise, would have a material effect in relation to<br />
our financial position and the results of our operations, excepting the<br />
items disclosed herein, and in Note 22(c) of the Consolidated financial<br />
statements.<br />
Risk mitigation: We believe that we have put in place reasonable policies<br />
and processes designed to enable compliance with legal and contractual<br />
obligations and reduce exposure to legal claims. See other risk mitigation<br />
steps discussed below.<br />
100 . <strong>TELUS</strong> 2012 ANNUAL REPORT<br />
Class actions<br />
We are defendants in a number of certified and uncertified class actions.<br />
We have observed an increased willingness on the part of claimants<br />
to launch class actions whereby a representative plaintiff seeks to pursue<br />
a legal claim on behalf of a large group of persons, and the number of<br />
class actions filed against us has continually increased in recent years.<br />
The adoption by governments of increasingly stringent consumer<br />
protection legislation (such as the Province of Quebec’s Bill 60 in 2010)<br />
may also increase the number of class actions. A successful class<br />
action lawsuit, by its nature, could result in a sizable damage award<br />
that negatively affects a defendant’s financial or operating results.<br />
Certified class actions<br />
Certified class actions against us include a class action brought in<br />
2004 in Saskatchewan against a number of past and present wireless<br />
service providers including us. The claim alleges that each of the<br />
carrier defendants is in breach of contract and has violated competition,<br />
trade practices and consumer protection legislation across Canada<br />
in connection with the collection of system access fees, and seeks direct<br />
and punitive damages in an unspecified amount. Similar proceedings<br />
were commenced in other provinces. A national class was certified<br />
in September 2007 by the Saskatchewan Court of Queen’s Bench. Our<br />
appeal of the certification order was dismissed on November 15, 2011.<br />
An application for leave to appeal this decision to the Supreme Court of<br />
Canada was denied on June 28, 2012.<br />
A new class action making substantially the same allegations was<br />
brought in 2009 in Saskatchewan. We believe this was done in an<br />
attempt to take advantage of the expanded scope in class action legislation<br />
since 2004. The new class action was stayed by the court in<br />
December 2009 upon an application by the defendants to dismiss it for<br />
abuse of process, conditional on possible future changes in circumstance.<br />
The plaintiffs’ application for leave to appeal the stay was heard on<br />
November 14, 2012, and the decision was reserved.<br />
In late 2011, a further class action relating to system access fees<br />
was filed in British Columbia; this action is not yet certified. Should the<br />
ultimate resolution of the class actions relating to the collection of system<br />
access fees differ from our assessments and assumptions, a material<br />
adjustment to our financial position and results of operations could result.<br />
Risk mitigation: Certification of a class action does not determine the<br />
merits of the claim, and the plaintiffs are still required to prove the merits<br />
of their claims. We believe that we have good defences to these actions<br />
and are vigorously defending them.<br />
Uncertified class actions<br />
Uncertified class actions against us include: a 2008 class action brought<br />
in Saskatchewan alleging that, among other things, Canadian telecommunications<br />
carriers including us have failed to provide proper notice of<br />
911 charges to the public and have been deceitfully passing them off as<br />
government charges; a 2008 class action brought in Ontario alleging<br />
that we have misrepresented our practice of rounding up wireless airtime<br />
to the nearest minute and charging for the full minute; and a 2012 class<br />
action brought in Quebec alleging that we had improperly unilaterally<br />
amended consumer contracts to increase various wireless service rates.<br />
In 2011, we learned that a further class action relating to 911 charges was<br />
filed in Alberta in 2008, but has not yet been served on us. The plaintiffs<br />
in these actions seek direct and punitive damages and other relief. We<br />
are assessing the merits of these claims, but the potential for liability and<br />
magnitude of potential loss cannot be readily determined at this time.
Risk mitigation: We are vigorously defending against certification of<br />
these actions. Certification is a procedural step that determines whether<br />
a particular lawsuit may be prosecuted by a representative plaintiff on<br />
behalf of a class of individuals. Certification of a class action does not<br />
determine the merits of the claim, so that if we were unsuccessful in<br />
defeating certification, the plaintiffs would still be required to prove the<br />
merits of their claims. Should the ultimate resolution of the uncertified<br />
class actions identified above differ from our assessments and assumptions,<br />
a material adjustment to our financial position and results of<br />
operations could result.<br />
Civil liability in the secondary market<br />
Like other Canadian public companies, we are subject to civil liability<br />
for misrepresentations in written disclosure and oral statements, and<br />
liability for fraud and market manipulation. Legislation creating liability<br />
was first introduced in Ontario in 2005. Since then, other provinces<br />
and territories have adopted similar legislation.<br />
The legislation creates a right of action for damages against us,<br />
our directors and certain of our officers in the event that we, or a person<br />
with actual, implied or apparent authority to act or speak on behalf<br />
of <strong>TELUS</strong>, releases a document or makes a public oral statement that<br />
contains a misrepresentation, or we fail to make timely disclosure of<br />
a material change.<br />
The legislation permits action to be taken by any person or company<br />
that acquires or disposes of <strong>TELUS</strong> securities in the secondary market<br />
during the period of time that the misrepresentation remains uncorrected<br />
in the public or, in the case of an omission, until such time as the material<br />
change has been disclosed. It is not necessary for the person or company<br />
to establish that they relied on the misrepresentation in making the<br />
acquisition or disposition.<br />
Risk mitigation: When the legislation was first introduced, we conducted<br />
a review of our disclosure practices and procedures and the extent to<br />
which they were documented. As part of that review, we consulted<br />
external advisors. This review indicated that we have well-documented<br />
and fulsome processes in place, including a corporate disclosure policy<br />
that restricts the role of spokesperson to specifically designated senior<br />
manage ment, provides a protocol for dealing with analysts and oral<br />
presentations, outlines the communication approach to issues, and has<br />
a disclosure committee to review and determine disclosure of material<br />
information. We monitor legal developments and <strong>annual</strong>ly re-evaluate our<br />
disclosure practices and procedures, and believe that they continue<br />
to be appro priate and prudent and that our risk exposure is reasonable<br />
and has not changed significantly over the past 12 months. However,<br />
there can be no assurance that our processes will be followed by all<br />
team members at all times.<br />
Legal compliance<br />
We rely on our employees, officers, Board of Directors, key suppliers<br />
and other business partners to demonstrate behaviour consistent with<br />
reasonable legal and ethical standards in all jurisdictions within which<br />
we operate. Situations might occur where individuals do not adhere to<br />
our policies, applicable laws and regulations or contractual obligations.<br />
For instance, there could be cases where personal information of a<br />
<strong>TELUS</strong> customer or employee is inadvertently collected, used or disclosed<br />
in a manner that is not fully compliant with legislation or contractual<br />
obligations. In the case of <strong>TELUS</strong> Health, personal information includes<br />
sensitive health information of individuals who are our customers or<br />
MANAGEMENT’S DISCUSSION & ANALYSIS: 10<br />
health care providers’ end customers. In addition, there could be situations<br />
where compliance programs may not be fully adhered to or parties may<br />
have a different interpretation of the requirements of particular legislative<br />
provisions. These various situations may expose us to litigation and<br />
the possibility of damages, sanctions and fines, or being disqualified<br />
from bidding on contracts, and/or may negatively affect our financial<br />
or operating results and reputation.<br />
We continue to expand our activities into the United States and<br />
other countries. When operating in foreign jurisdictions, we are required<br />
to comply with local laws and regulations, which may differ substantially<br />
from Canadian laws and add to the legal and tax exposures that we face.<br />
Risk mitigation: Although we cannot predict outcomes with certainty,<br />
we believe that we have reasonable policies, controls and processes in<br />
place, and sufficient levels of awareness for proper compliance, and that<br />
these programs are having a positive effect on reducing risks. We have<br />
instituted for our employees, officers and directors an ethics policy and<br />
mandatory ethics training as well as a toll-free Ethics Line for anonymous<br />
<strong>report</strong>ing by anyone who has issues or complaints. Since 2003, we<br />
have had a designated Compliance Officer, whose role is to work across<br />
the enterprise to ensure that the business has the appropriate controls<br />
and measurements in place to facilitate legal compliance. For example,<br />
as a proactive measure on privacy compliance, we place a control in<br />
the development stage of major projects by requiring a privacy impact<br />
assessment to be performed for such projects involving the use of<br />
customer or team member personal information.<br />
We have an established, rigorous review process to ensure that<br />
regulatory, legal and tax requirements are considered when pursuing<br />
opportunities outside of Canada. We have also launched an enterprisewide<br />
program to review our existing international structure, systems and<br />
processes and have developed a future mode of operation that mitigates<br />
regulatory, legal and tax risks as business activities expand outside of<br />
Canada. Finally, we engage external counsel and advisors qualified in the<br />
relevant foreign jurisdictions to provide regulatory, legal and tax advice<br />
as appropriate.<br />
The Compliance Officer <strong>report</strong>s jointly to the Audit Committee of the<br />
Board of Directors and the Senior Vice-President and Chief Legal Officer.<br />
This dual <strong>report</strong>ing provides direct line-of-sight <strong>report</strong>ing to the Audit<br />
Committee to address identified risks.<br />
Defects in software and failures in data and transaction processing<br />
We provide certain applications and managed services to our customers<br />
that involve the processing and/or storing of data, including sensitive<br />
per sonal medical records, and the transfer of large funds. Software defects<br />
or failures in data or transaction processing could lead to substantial<br />
damage claims (including medical claims). For instance, a defect in a<br />
<strong>TELUS</strong> Health application could lead to personal injury, while a failure<br />
in transaction processing could result in the transfer of funds to the<br />
wrong recipient.<br />
Risk mitigation: We believe that we have put in place reasonable policies,<br />
controls, processes (such as quality assurance programs in software<br />
development procedures) and contractual arrangements (such as disclaimers,<br />
indemnities and limitations of liability), as well as insurance<br />
coverage, to reduce exposure to legal claims. However, there can be no<br />
assurance that our processes will be followed by all team members at<br />
all times.<br />
<strong>TELUS</strong> 2012 ANNUAL REPORT . 101
Intellectual property and proprietary rights<br />
Technology evolution also brings additional legal risks and uncertainties.<br />
The intellectual property and proprietary rights of owners and developers<br />
of hardware, software, business processes and other technologies<br />
may be protected under statute, such as patent, copyright and industrial<br />
design legislation, or under common law, such as trade secrets. With the<br />
growth and development of technology-based industries, the value of<br />
these intellectual property and proprietary rights has increased. Significant<br />
damages may be awarded in intellectual property infringement claims<br />
advanced by rights holders. In addition, defendants may incur significant<br />
costs to defend such claims and that possibility may prompt defendants<br />
to settle claims more readily, in part to mitigate those costs. Both of<br />
these factors may incent intellectual property rights holders to more<br />
aggressively pursue infringement claims.<br />
Given the vast array of technologies and systems that we use<br />
to deliver products and services, and with the rapid change and complexity<br />
of such technologies, disputes over intellectual property and<br />
proprietary rights can reasonably be expected to increase. As a user<br />
of technology, we receive communications from time to time, ranging<br />
from solicitations to demands and legal actions from third parties claiming<br />
ownership rights over intellectual property used by us and asking for<br />
settlement payments or licensing fees for the continued use of such<br />
intellectual property. This includes notice of one claim that certain wireless<br />
products used on our networks infringe two third-party patents.<br />
We are assessing the merits of this claim, but the potential for liability<br />
and magnitude of potential loss cannot be readily determined at this<br />
time. There can be no assurance that we will not be faced with significant<br />
claims based on the alleged infringement of intellectual property rights,<br />
whether such claims are based on a legitimate dispute over the validity<br />
of the intellectual property rights or their infringement, or whether such<br />
claims are advanced for the primary purpose of extracting a settlement.<br />
We may incur significant costs in defending infringement claims, and<br />
may suffer significant damages and lose the right to use technologies<br />
that are essential to our operations should any infringement claim prove<br />
successful. As a developer of technology, <strong>TELUS</strong> Health depends on<br />
its ability to protect the proprietary aspects of its technology. The failure<br />
to do so adequately could materially affect its business. However,<br />
policing unauthorized use of our intellectual property may be difficult<br />
and costly. Should the ultimate resolution of the claim that our wireless<br />
products infringe two third-party patents differ from our assessments<br />
and assumptions, a material adjustment to our financial position and<br />
results of operations could result.<br />
Risk mitigation: We incorporate many technologies into products and<br />
services. However, except for <strong>TELUS</strong> Health, we are not primarily in the<br />
business of creating or inventing technology. In acquiring products and<br />
services from suppliers, it is our practice to seek and obtain contractual<br />
protections consistent with industry practices to help mitigate the risks<br />
of intellectual property infringements. It is the practice of <strong>TELUS</strong> Health<br />
to vigorously protect its intellectual property rights through litigation<br />
and other means.<br />
102 . <strong>TELUS</strong> 2012 ANNUAL REPORT<br />
10.10 Human-caused and natural threats<br />
Concerns about natural disasters and intentional threats<br />
to our infrastructure and our Canadian and international<br />
business operations<br />
We are a key provider of critical telecommunications infrastructure in<br />
Canada and have certain supporting business functions located in more<br />
than 10 countries in North America, Asia, Central America and Europe.<br />
Our networks, information technology, physical assets, team members,<br />
supply chain and business results may be materially impacted by<br />
exogenous threats, including:<br />
. Natural disasters, seismic events, weather-related events and<br />
solar storms<br />
. Intentional threats such as sabotage, terrorism, labour disputes,<br />
and political and civil unrest<br />
. Dependence on the provision of service to us by other infrastructure<br />
providers (e.g. power)<br />
. Public health threats such as pandemics.<br />
Although we have business continuity planning processes in place, there<br />
can be no assurance that specific events or a combination of events<br />
will not materially impact our operations and results. We recognize that<br />
global climate change may exacerbate certain of these threats, including<br />
the frequency and severity of weather-related events.<br />
Risk mitigation: We have an extensive Company-wide business continuity<br />
program with resources dedicated to develop, exercise and maintain<br />
business continuity/disaster recovery policies, plans and processes that<br />
address a range of emergency and disaster scenarios to protect our<br />
critical business functions and key facilities. Our approach focuses on:<br />
ensuring team member safety; sustaining our ability to reliably serve<br />
customers and deliver a positive customer experience; and protecting<br />
corporate assets by building resiliency across our day-to-day business<br />
operations. Our business continuity management incorporates proactive<br />
event-driven planning with ongoing environmental and situational<br />
monitoring. We take a comprehensive all-hazards approach, including<br />
planning for resource-impacting events such as pandemics and work<br />
stoppages, as well as ongoing risk mitigation in regards to: seismic<br />
structural upgrades; earthquake-readiness exercises; fire and flood risk<br />
reduction; network and power resiliency (redundancy and diversity);<br />
and team member health, wellness and safety programs.<br />
Optimizing the disaster recovery planning for our IT assets is a<br />
continuing key focus with the goal of preventing outages and reducing<br />
outage durations, as well as improving alignment of IT support capability<br />
with business demand. Regarding our internationally based business<br />
process and outsourcing support functions, we have expanded these to<br />
additional countries in different geographic regions to mitigate the risk<br />
of locating these functions in one country, and we continue to work to<br />
increase the site-specific risk resiliency of these operations.
Security – Electronic attack<br />
Electronic attacks are intentional acts to gain unauthorized access<br />
to our information or to prevent legitimate users from gaining access.<br />
Such attacks may use a range of techniques, from social engineering<br />
(non-technical intrusion relying heavily on human interaction and<br />
trickery to break normal security procedures) to the use of sophisticated<br />
software and hardware.<br />
Risk mitigation: Using a layered security approach, we have implemented<br />
a number of proactive, reactive and containment processes and<br />
systems to safeguard our IT infrastructure, information repositories and<br />
information distribution. Security policies and procedures are in place<br />
to govern the duties of those responsible for information confidentiality<br />
and integrity. Intrusion detection systems, access controls and incident<br />
response procedures are in place to provide continuous monitoring<br />
of our IT infrastructure.<br />
Security – Vandalism and theft<br />
We have a number of publicly situated physical assets that are subject<br />
to vandalism and/or theft, including public payphones, copper cable,<br />
corporate stores, and network and telephone switch centres. While we<br />
have IT and network security planning processes, and thorough physical<br />
asset security planning processes in place, there can be no assurance<br />
that specific events will not materially impact our operations and results.<br />
Risk mitigation: We have implemented an array of physical and electronic<br />
barriers, policies, controls and monitoring systems to protect our assets<br />
and our team members, considering such factors as asset importance,<br />
exposure risks and potential costs incurred should a particular asset be<br />
damaged or stolen. As an additional level of risk management, we have<br />
a corporate security group that continually investigates and evaluates<br />
the risks and, in co-operation with law enforcement and other external<br />
agencies, adjusts its level of protection to meet changing risks and<br />
lobbies for legislative changes to address this ongoing threat.<br />
10.11 Economic growth and fluctuations<br />
We estimate economic growth in Canada at 1.9% in 2012, following<br />
growth of 2.5% in 2011. Significant global challenges remain in 2013.<br />
The Bank of Canada’s January 2013 Monetary Policy Report projected<br />
growth of 2.0% for 2013 and 2.7% for 2014, as continuing weakness<br />
in the global economy is expected to pose challenges to the Canadian<br />
economy through 2013. Based on a consensus of major Canadian chartered<br />
banks, Canada’s <strong>annual</strong> unemployment rate for 2013 is expected<br />
to be 7.2%.<br />
With continued strength in the Canadian natural resource sector,<br />
economic growth in B.C. and Alberta is expected to remain stronger than<br />
in Central Canada. However, concerns remain around weak domestic<br />
demand, global economic weakness, high unemployment rates, and the<br />
timing and impact of reduced government spending in Canada.<br />
MANAGEMENT’S DISCUSSION & ANALYSIS: 10<br />
Slow or uneven economic growth may adversely impact us<br />
Economic uncertainty may cause consumers and business customers<br />
to delay new service purchases, reduce volumes of use, discontinue<br />
use of services or seek lower-priced alternatives. A significant economic<br />
downturn or recession could adversely impact our revenue, profitability,<br />
free cash flow and bad debt expense, and potentially require us to<br />
record impairments to the carrying value of our assets including, but not<br />
limited to, our intangible assets with indefinite lives (spectrum licences)<br />
and goodwill. Impairments to the carrying value of assets would result<br />
in a charge to earnings and a reduction in owners’ equity, but would not<br />
affect cash flow.<br />
Risk mitigation: While economic risks cannot be completely mitigated,<br />
we introduced the Customers First initiatives as the number one<br />
corporate priority to enhance customer experiences. We continue to<br />
pursue cost reduction and efficiency initiatives. Even though Canadian<br />
economic growth in 2013 is expected to be similar to 2012, we are<br />
targeting our revenue growth to be 4 to 6% in 2013 (see Section 1.5).<br />
Our target for 2013 capital expenditures (excluding spectrum licence<br />
purchases) is to be at a level similar to 2012.<br />
Pension funding<br />
Economic and capital market fluctuations could also adversely impact<br />
the funding and expense associated with the defined benefit pension<br />
plans that we sponsor. There can be no assurance that our pension<br />
expense and funding of our defined benefit pension plans will not<br />
increase in the future and thereby negatively impact earnings and/or<br />
cash flow. Defined benefit funding risks may arise if total pension liabilities<br />
exceed the total value of the respective plan assets in trust funds.<br />
Unfunded differences may arise from lower than expected investment<br />
returns, reductions in the discount rate used to value pension liabilities,<br />
and actuarial losses. Actuarial gains and losses on defined benefit<br />
pension plans will cause fluctuations in Other comprehensive income,<br />
which will never be subsequently reclassified to income.<br />
Risk mitigation: We seek to mitigate this risk through the application of<br />
policies and procedures designed to control investment risk and ongoing<br />
monitoring of our funding position. Pension funding for 2013 is largely<br />
determined by the discount rate used to value the pension liabilities<br />
and the value of the underlying assets. Our best estimate of cash contributions<br />
to our defined benefit pension plans in 2013 is $195 million<br />
($171 million in 2012).<br />
<strong>TELUS</strong> 2012 ANNUAL REPORT . 103
11<br />
Definitions<br />
and reconciliation of certain non-GAAP measures that we use<br />
11.1 EBITDA (earnings before interest, taxes,<br />
depreciation and amortization)<br />
EBITDA does not have any standardized meaning prescribed by<br />
IFRS-IASB and is therefore unlikely to be comparable to similar measures<br />
presented by other issuers. EBITDA should not be considered an alternative<br />
to Net income in measuring <strong>TELUS</strong>’ performance, nor should it<br />
be used as an exclusive measure of cash flow. We have issued guidance<br />
on and <strong>report</strong> EBITDA because it is a key measure used to evaluate<br />
performance at a consolidated level and for our two segments. EBITDA<br />
– excluding restructuring costs is also utilized in measuring compliance<br />
with debt covenants (see description in Section 11.4). EBITDA is com-<br />
monly <strong>report</strong>ed and widely used by investors and lending institutions<br />
as an indicator of a company’s operating performance and ability<br />
to incur and service debt, and as a valuation metric.<br />
As in 2012 and 2011, we may also calculate an adjusted EBITDA<br />
to exclude items of an unusual nature that do not reflect our ongoing<br />
operations, that should not be considered in a valuation metric or<br />
that should not be included in an assessment of ability to service or<br />
incur debt.<br />
The CICA’s Canadian Performance Reporting Board defined<br />
standardized EBITDA to foster comparability of the measure between<br />
entities. Standardized EBITDA is an indication of an entity’s capacity<br />
to generate income from operations before taking into account<br />
man agement’s financing decisions and costs of consuming tangible<br />
and intangible capital assets, which vary according to their vintage,<br />
technological currency and management’s estimate of their useful life.<br />
Accordingly, standardized EBITDA comprises revenue less operating<br />
costs before interest expense, capital asset amortization and<br />
impairment charges, and income taxes.<br />
EBITDA reconciliation<br />
and reconciliations<br />
Definitions of operating, liquidity and capital resource measures, including calculation<br />
Years ended December 31 ($ millions) 2012 2011<br />
Net income 1,318 1,215<br />
Financing costs 332 377<br />
Income taxes 457 376<br />
Depreciation 1,422 1,331<br />
Amortization of intangible assets 443 479<br />
Impairment losses (reversals) for capital assets<br />
EBITDA (standardized EBITDA<br />
– –<br />
in CICA guideline)<br />
Deduct gain net of equity losses related to the<br />
3,972 3,778<br />
<strong>TELUS</strong> Garden residential real estate partnership (7) –<br />
Deduct Transactel gain – (17)<br />
Adjusted EBITDA 3,965 3,761<br />
We also calculate a simple proxy for cash flow at a consolidated level<br />
and for our two segments, which may be compared with the <strong>report</strong>ed<br />
results of other telecommunications companies and is subject to the<br />
potential comparability issues of adjusted EBITDA.<br />
104 . <strong>TELUS</strong> 2012 ANNUAL REPORT<br />
Calculation of adjusted EBITDA less capital expenditures<br />
Years ended December 31 ($ millions) 2012 2011<br />
EBITDA 3,972 3,778<br />
Capital expenditures (1,981) (1,847)<br />
EBITDA less capital expenditures 1,991 1,931<br />
Adjustments to EBITDA (from above) (7) (17)<br />
Adjusted EBITDA less capital expenditures 1,984 1,914<br />
11.2 Free cash flow<br />
Free cash flow does not have any standardized meaning prescribed<br />
by IFRS-IASB and should not be considered an alternative to the<br />
Consolidated statements of cash flows. We <strong>report</strong> free cash flow<br />
because it is a key measure that we use to evaluate performance. Free<br />
cash flow excludes certain working capital changes and other sources<br />
and uses of cash, as found in the Consolidated statements of cash<br />
flows. Investors are cautioned that the free cash flow we <strong>report</strong> may<br />
not be comparable to the free cash flow <strong>report</strong>ed by other companies,<br />
and it differs from standardized free cash flow defined by the CICA’s<br />
Canadian Performance Reporting Board. Our definition of free cash flow<br />
provides an indication of how much cash generated by operations is<br />
available after capital expenditures, but before dividends, purchases<br />
of spectrum licences, acquisitions, proceeds from divested assets and<br />
changes in certain working capital items (such as trade receivables<br />
and trade payables).<br />
Free cash flow calculation<br />
Years ended December 31 ($ millions) 2012 2011<br />
EBITDA (see Section 11.1)<br />
Deduct gain net of equity losses related to the<br />
3,972 3,778<br />
<strong>TELUS</strong> Garden residential real estate partnership<br />
Deduct interest income recorded<br />
(7) –<br />
in Other operating income (1) –<br />
Deduct Transactel gain – (17)<br />
Restructuring costs net of cash payments (4) (48)<br />
Items from the Consolidated statements of cash flows:<br />
Share-based compensation<br />
Net employee defined benefit plans<br />
9 (12)<br />
expense (recovery)<br />
Employer contributions to employee<br />
(10) (32)<br />
defined benefit plans (173) (298)<br />
Interest paid (337) (378)<br />
Interest received 13 1<br />
Income taxes refunded (paid), net (150) (150)<br />
Capital expenditures (1,981) (1,847)<br />
Free cash flow (our definition) 1,331 997
The Canadian Performance Reporting Board defined standardized<br />
free cash flow to foster comparability of the measure between entities.<br />
Standardized free cash flow is an indication of an entity’s capacity to<br />
generate discretionary cash from operations, comprising cash flows from<br />
operating activities less net capital expenditures and those dividends<br />
that are more representative of interest costs. It does not necessarily<br />
represent the cash flow in the period available for management to use<br />
at its discretion, which may be affected by other sources and nondiscretionary<br />
uses of cash. The following reconciles our definition of<br />
free cash flow with standardized free cash flow and Cash provided by<br />
operating activities.<br />
Free cash flow reconciliation<br />
Years ended December 31 ($ millions) 2012 2011<br />
Cash provided by operating activities 3,219 2,550<br />
Deduct stipulated dividends n/a n/a<br />
Capital expenditures (1,981) (1,847)<br />
Proceeds from disposition of capital assets 4 –<br />
Standardized free cash flow (CICA guideline) 1,242 703<br />
Deduct proceeds from disposition of capital assets<br />
Adjustments to reconcile to cash provided<br />
(4) –<br />
by operating activities 93 294<br />
Free cash flow (our definition) 1,331 997<br />
11.3 Definitions of wireless operating indicators<br />
These measures are industry metrics and are useful in assessing<br />
the operating performance of a wireless telecommunications entity.<br />
Average revenue per subscriber unit per month (ARPU) is calculated<br />
as Network revenue divided by the average number of subscriber<br />
units on the network during the period and expressed as a rate per<br />
month. Data ARPU is a component of ARPU, calculated on the same<br />
basis for revenue derived from services such as text messaging,<br />
mobile computing, personal digital assistance devices, Internet browser<br />
activity and pay-per-use downloads.<br />
Churn per month is calculated as the number of subscriber units<br />
deactivated during a given period divided by the average number of<br />
subscriber units on the network during the period, and expressed<br />
as a rate per month. A prepaid subscriber is deactivated when the subscriber<br />
has no usage for 90 days following expiry of the prepaid credits.<br />
Cost of acquisition (COA) consists of the total of device subsidies,<br />
commissions, and advertising and promotion expenses related to the<br />
initial subscriber acquisition during a given period. As defined, COA<br />
excludes costs to retain existing subscribers (retention spend).<br />
COA per gross subscriber addition is calculated as cost of acquisition<br />
divided by gross subscriber activations during the period.<br />
Retention spend to Network revenue represents direct costs<br />
associated with marketing and promotional efforts aimed at the retention<br />
of the existing subscriber base, divided by Network revenue.<br />
11.4 Definitions of liquidity and capital resource measures<br />
Earnings coverage is defined in the Canadian Securities Administrators’<br />
National Instrument 41-101 and related instruments, calculated on a<br />
12-month trailing basis.<br />
MANAGEMENT’S DISCUSSION & ANALYSIS: 11<br />
Calculation of Earnings coverage<br />
Years ended December 31 ($ millions, except ratio) 2012 2011<br />
Net income attributable to Common Shares<br />
and Non-Voting Shares 1,318 1,219<br />
Income taxes<br />
Gross interest expense (Note 8 of the<br />
457 376<br />
Consolidated financial statements) 355 389<br />
Numerator 2,130 1,984<br />
Denominator – Gross interest expense 355 389<br />
Ratio (times) 6.0 5.1<br />
The following measures do not have any standardized meaning prescribed<br />
by IFRS-IASB and may not be comparable to similar measures<br />
presented by other issuers.<br />
Dividend payout ratio and dividend payout ratio of adjusted net<br />
earnings: The basic measure is defined as the quarterly dividend<br />
declared per Common Share and Non-Voting Share for the most recently<br />
completed quarter, as <strong>report</strong>ed in the Consolidated financial statements,<br />
multiplied by four and divided by the sum of basic earnings per share for<br />
the most recent four quarters for interim <strong>report</strong>ing periods (divided by<br />
<strong>annual</strong> basic earnings per share for fiscal years). More representative of a<br />
sustainable calculation is the historical ratio based on <strong>report</strong>ed earnings<br />
per share adjusted to exclude income tax-related adjustments, losses<br />
on redemption of long-term debt, the impacts of a net-cash settlement<br />
feature from 2007 to 2012, and items adjusted for in EBITDA. The target<br />
guideline for the <strong>annual</strong> dividend payout ratio is on a prospective basis,<br />
rather than on a trailing basis, and was revised to 65 to 75% from 55 to<br />
65% of sustainable earnings on a prospective basis (see Section 8.2<br />
Accounting policy developments).<br />
Calculation of Dividend payout ratios<br />
Years ended December 31 ($)<br />
Dividend payout ratio<br />
Numerator – Annualized fourth quarter dividend<br />
2012 2011<br />
declared per Common Share and Non-Voting Share<br />
Denominator – Net income per Common Share<br />
2.56 2.32<br />
and Non-Voting Share 4.05 3.76<br />
Ratio (%) 63 62<br />
Dividend payout ratio of adjusted net earnings<br />
Numerator ($ millions, from above)<br />
Adjusted net earnings ($ millions)<br />
Net income attributable to Common Shares<br />
2.56 2.32<br />
and Non-Voting Shares<br />
Deduct after-tax gain net of equity losses<br />
related to the <strong>TELUS</strong> Garden residential<br />
1,318 1,219<br />
real estate partnership<br />
Deduct net favourable income tax-related<br />
(6) –<br />
adjustments (12) (21)<br />
Deduct after-tax Transactel gain – (12)<br />
Net-cash settlement feature (2) (14)<br />
Denominator – Adjusted net earnings per<br />
1,298 1,172<br />
Common Share and Non-Voting Share 3.98 3.61<br />
Adjusted ratio (%) 64 64<br />
<strong>TELUS</strong> 2012 ANNUAL REPORT . 105
EBITDA – excluding restructuring costs is defined as EBITDA<br />
(see Section 11.1), adding back restructuring costs of $48 million for 2012<br />
and $35 million for 2011. This measure is used in the calculation of<br />
Net debt to EBITDA – excluding restructuring costs and EBITDA –<br />
excluding restructuring costs interest coverage, consistent with<br />
the calculation of the Leverage Ratio and the Coverage Ratio in credit<br />
facility covenants.<br />
EBITDA – excluding restructuring costs interest coverage is<br />
defined as EBITDA excluding restructuring costs, divided by Net interest<br />
cost, calculated on a 12-month trailing basis. This measure is substantially<br />
the same as the Coverage Ratio covenant in <strong>TELUS</strong>’ credit facilities.<br />
Net debt: The nearest IFRS measure to net debt is Long-term debt,<br />
including Current maturities of long-term debt, as reconciled below.<br />
Net debt is a component of a ratio used to determine compliance with<br />
debt covenants (see Net debt to EBITDA – excluding restructuring<br />
costs). We believe that Net debt is a useful measure because it<br />
represents the amount of long-term debt obligations that are not covered<br />
by available cash and temporary investments, and when applicable in<br />
previous years, it incorporated exchange rate impacts of cross-currency<br />
swap agreements put into place to fix the value of U.S. dollar debt.<br />
Calculation of Net debt<br />
At December 31 ($ millions) 2012 2011<br />
Long-term debt including current portion 6,256 6,574<br />
Debt issuance costs netted against long-term debt 26 27<br />
Cash and temporary investments (107) (46)<br />
Short-term borrowings 402 404<br />
Net debt 6,577 6,959<br />
106 . <strong>TELUS</strong> 2012 ANNUAL REPORT<br />
Net debt to EBITDA – excluding restructuring costs is defined<br />
as Net debt at the end of the period divided by the 12-month trailing<br />
EBITDA – excluding restructuring costs. Our long-term guideline range<br />
for Net debt to EBITDA is from 1.5 to 2.0 times, which is substantially<br />
the same as the Leverage Ratio covenant in our credit facilities.<br />
Net debt to total capitalization measures the proportion of debt<br />
used in the capital structure of <strong>TELUS</strong>.<br />
Net interest cost is defined as Financing costs, excluding employee<br />
defined benefit plans net interest and gains on redemption and repayment<br />
of debt, calculated on a 12-month trailing basis. No gains on<br />
redemption and repayment of debt were recorded in 2012 and 2011.<br />
Losses recorded on the redemption of debt are included in net interest<br />
cost. Net interest costs for 2012 and 2011 are equal to <strong>report</strong>ed<br />
Financing costs.<br />
Total capitalization – book value is defined and calculated as follows.<br />
Calculation of total capitalization<br />
At December 31 ($ millions) 2012 2011<br />
Net debt 6,577 6,959<br />
Owners’ equity 7,686 7,513<br />
Deduct Accumulated other comprehensive income (40) (11)<br />
Total capitalization – book value 14,223 14,461
Report of management on internal control<br />
over financial <strong>report</strong>ing<br />
Management of <strong>TELUS</strong> Corporation (<strong>TELUS</strong>) is responsible for<br />
establishing and maintaining adequate internal control over financial<br />
<strong>report</strong>ing and for its assessment of the effectiveness of internal<br />
control over financial <strong>report</strong>ing.<br />
<strong>TELUS</strong>’ Chief Executive Officer (CEO) and Chief Financial Officer<br />
(CFO) have assessed the effectiveness of the Company’s internal<br />
control over financial <strong>report</strong>ing as of December 31, 2012, in accordance<br />
with the criteria established in Internal Control – Integrated Framework<br />
issued by the Committee of Sponsoring Organizations of the Treadway<br />
Commission (COSO). Internal control over financial <strong>report</strong>ing is a process<br />
designed by, or under the supervision of, the Chief Executive Officer and<br />
the Executive Vice-President and Chief Financial Officer and effected<br />
by the Board of Directors, management and other personnel to provide<br />
reasonable assurance regarding the reliability of financial <strong>report</strong>ing<br />
and the preparation of financial statements for external purposes in<br />
accordance with generally accepted accounting principles.<br />
Due to its inherent limitations, internal control over financial <strong>report</strong>ing<br />
may not prevent or detect misstatements on a timely basis. Also, projections<br />
of any evaluation of the effectiveness of internal control over financial<br />
<strong>report</strong>ing to future periods are subject to the risk that the controls may<br />
become inadequate because of changes in conditions, or that the<br />
degree of compliance with the policies or procedures may deteriorate.<br />
FINANCIAL STATEMENTS & NOTES<br />
Based on this assessment, management has determined that the<br />
Company’s internal control over financial <strong>report</strong>ing is effective as of<br />
December 31, 2012. In connection with this assessment, no material<br />
weaknesses in the Company’s internal control over financial <strong>report</strong>ing<br />
were identified by management as of December 31, 2012.<br />
Deloitte LLP, the Company’s Independent Registered Chartered<br />
Accountants, audited the Company’s Consolidated financial statements<br />
for the year ended December 31, 2012, and as stated in the Report<br />
of Independent Registered Chartered Accountants, they have expressed<br />
an unqualified opinion on the effectiveness of the Company’s internal<br />
control over financial <strong>report</strong>ing as of December 31, 2012.<br />
John R. Gossling Darren Entwistle<br />
Executive Vice-President President<br />
and Chief Financial Officer and Chief Executive Officer<br />
February 27, 2013 February 27, 2013<br />
<strong>TELUS</strong> 2012 ANNUAL REPORT . 107
Report of independent registered<br />
chartered accountants<br />
To the Board of Directors and Shareholders of <strong>TELUS</strong> Corporation<br />
We have audited the accompanying consolidated financial statements of<br />
<strong>TELUS</strong> Corporation and subsidiaries (the Company), which comprise the<br />
consolidated statements of financial position as at December 31, 2012,<br />
and December 31, 2011, and the consolidated statements of income<br />
and other comprehensive income, changes in owners’ equity and cash<br />
flows for the years ended December 31, 2012, and December 31, 2011,<br />
and a summary of significant accounting policies and other explanatory<br />
information.<br />
Management’s Responsibility for the Consolidated<br />
Financial Statements<br />
Management is responsible for the preparation and fair presentation of<br />
these consolidated financial statements in accordance with International<br />
Financial Reporting Standards as issued by the International Accounting<br />
Standards Board, and for such internal control as management determines<br />
is necessary to enable the preparation of consolidated financial<br />
statements that are free from material misstatement, whether due to<br />
fraud or error.<br />
Auditors’ Responsibility<br />
Our responsibility is to express an opinion on these consolidated<br />
financial statements based on our audits. We conducted our audits in<br />
accordance with Canadian generally accepted auditing standards and<br />
the standards of the Public Company Accounting Oversight Board<br />
(United States). Those standards require that we comply with ethical<br />
requirements and plan and perform the audit to obtain reasonable<br />
assurance about whether the consolidated financial statements are<br />
free from material misstatement.<br />
An audit involves performing procedures to obtain audit evidence<br />
about the amounts and disclosures in the consolidated financial statements.<br />
The procedures selected depend on the auditor’s judgment,<br />
including the assessment of the risks of material misstatement of<br />
the consolidated financial statements, whether due to fraud or error.<br />
In making those risk assessments, the auditor considers internal<br />
108 . <strong>TELUS</strong> 2012 ANNUAL REPORT<br />
control relevant to the entity’s preparation and fair presentation of<br />
the consolidated financial statements in order to design audit proce-<br />
dures that are appropriate in the circumstances. An audit also includes<br />
evaluating the appropriateness of accounting policies used and<br />
the reasonableness of accounting estimates made by management,<br />
as well as evaluating the overall presentation of the consolidated<br />
financial statements.<br />
We believe that the audit evidence we have obtained in our audits<br />
is sufficient and appropriate to provide a basis for our audit opinion.<br />
Opinion<br />
In our opinion, the consolidated financial statements present fairly, in<br />
all material respects, the financial position of <strong>TELUS</strong> Corporation and<br />
subsidiaries as at December 31, 2012, and December 31, 2011, and their<br />
financial performance and their cash flows for each of the years ended<br />
December 31, 2012, and December 31, 2011, in accordance with<br />
International Financial Reporting Standards as issued by the International<br />
Accounting Standards Board.<br />
Other Matter<br />
We have also audited, in accordance with the standards of the Public<br />
Company Accounting Oversight Board (United States), the Company’s<br />
internal control over financial <strong>report</strong>ing as at December 31, 2012,<br />
based on the criteria established in Internal Control – Integrated<br />
Framework issued by the Committee of Sponsoring Organizations of<br />
the Treadway Commission and our <strong>report</strong> dated February 27, 2013,<br />
expressed an unquali fied opinion on the Company’s internal control<br />
over financial <strong>report</strong>ing.<br />
Deloitte LLP<br />
Independent Registered Chartered Accountants<br />
Vancouver, Canada<br />
February 27, 2013
Report of independent registered<br />
chartered accountants<br />
To the Board of Directors and Shareholders of <strong>TELUS</strong> Corporation<br />
We have audited the internal control over financial <strong>report</strong>ing of <strong>TELUS</strong><br />
Corporation and subsidiaries (the Company) as of December 31, 2012,<br />
based on the criteria established in Internal Control – Integrated<br />
Framework issued by the Committee of Sponsoring Organizations of<br />
the Treadway Commission. The Company’s management is responsible<br />
for maintaining effective internal control over financial <strong>report</strong>ing and<br />
for its assessment of the effectiveness of internal control over financial<br />
<strong>report</strong>ing, included in the accompanying Report of Management on<br />
Internal Control over Financial Reporting. Our responsibility is to express<br />
an opinion on the Company’s internal control over financial <strong>report</strong>ing<br />
based on our audit.<br />
We conducted our audit in accordance with the standards of the<br />
Public Company Accounting Oversight Board (United States). Those<br />
standards require that we plan and perform the audit to obtain reasonable<br />
assurance about whether effective internal control over financial<br />
<strong>report</strong>ing was maintained in all material respects. Our audit included<br />
obtaining an understanding of internal control over financial <strong>report</strong>ing,<br />
assessing the risk that a material weakness exists, testing and evaluating<br />
the design and operating effectiveness of internal control based on the<br />
assessed risk, and performing such other procedures as we considered<br />
necessary in the circumstances. We believe that our audit provides a<br />
reasonable basis for our opinion.<br />
A company’s internal control over financial <strong>report</strong>ing is a process<br />
designed by, or under the supervision of, the company’s principal<br />
executive and principal financial officers, or persons performing similar<br />
functions, and effected by the company’s board of directors, management,<br />
and other personnel to provide reasonable assurance regarding<br />
the reliability of financial <strong>report</strong>ing and the preparation of financial<br />
statements for external purposes in accordance with generally accepted<br />
accounting principles. A company’s internal control over financial<br />
<strong>report</strong>ing includes those policies and procedures that (1) pertain to the<br />
maintenance of records that, in reasonable detail, accurately and fairly<br />
reflect the transactions and dispositions of the assets of the company;<br />
FINANCIAL STATEMENTS & NOTES<br />
(2) provide reasonable assurance that transactions are recorded as<br />
necessary to permit preparation of financial statements in accordance<br />
with generally accepted accounting principles, and that receipts<br />
and expenditures of the company are being made only in accordance<br />
with authorizations of management and directors of the company; and<br />
(3) provide reasonable assurance regarding prevention or timely detection<br />
of unauthorized acquisition, use, or disposition of the company’s<br />
assets that could have a material effect on the financial statements.<br />
Because of the inherent limitations of internal control over financial<br />
<strong>report</strong>ing, including the possibility of collusion or improper management<br />
override of controls, material misstatements due to error or fraud may<br />
not be prevented or detected on a timely basis. Also, projections of<br />
any evaluation of the effectiveness of the internal control over financial<br />
<strong>report</strong>ing to future periods are subject to the risk that the controls may<br />
become inadequate because of changes in conditions, or that the<br />
degree of compliance with the policies or procedures may deteriorate.<br />
In our opinion, the Company maintained, in all material respects,<br />
effective internal control over financial <strong>report</strong>ing as of December 31, 2012,<br />
based on the criteria established in Internal Control – Integrated<br />
Framework issued by the Committee of Sponsoring Organizations<br />
of the Treadway Commission.<br />
We have also audited, in accordance with Canadian generally<br />
accepted auditing standards and the standards of the Public Company<br />
Accounting Oversight Board (United States), the consolidated financial<br />
statements as at and for the year ended December 31, 2012, of<br />
the Company and our <strong>report</strong> dated February 27, 2013, expressed<br />
an unqualified opinion on those financial statements.<br />
Deloitte LLP<br />
Independent Registered Chartered Accountants<br />
Vancouver, Canada<br />
February 27, 2013<br />
<strong>TELUS</strong> 2012 ANNUAL REPORT . 109
Consolidated statements of income<br />
and other comprehensive income<br />
Years ended December 31 (millions except per share amounts)<br />
Operating Revenues<br />
Note 2012 2011<br />
Service $ß10,079 $ß 9,606<br />
Equipment 773 719<br />
10,852 10,325<br />
Other operating income 6 69 72<br />
Operating Expenses<br />
10,921 10,397<br />
Goods and services purchased 4,820 4,726<br />
Employee benefits expense 7 2,129 1,893<br />
Depreciation 1,422 1,331<br />
Amortization of intangible assets 443 479<br />
8,814 8,429<br />
Operating Income 2,107 1,968<br />
Financing costs 8 332 377<br />
Income Before Income Taxes 1,775 1,591<br />
Income taxes 9 457 376<br />
Net Income 1,318 1,215<br />
Other Comprehensive Income<br />
Items that may subsequently be reclassified to income<br />
10<br />
Change in unrealized fair value of derivatives designated as cash flow hedges<br />
Foreign currency translation adjustment arising from translating<br />
(4) 6<br />
financial statements of foreign operations – 4<br />
Change in unrealized fair value of available-for-sale financial assets 33 –<br />
Item never subsequently reclassified to income<br />
29 10<br />
Employee defined benefit plans actuarial gains (losses) (400) (851)<br />
(371) (841)<br />
Comprehensive Income<br />
Net Income (Loss) Attributable to:<br />
$ß 947 $ß 374<br />
Common Shares and Non-Voting Shares $ß 1,318 $ß 1,219<br />
Non-controlling interests – (4)<br />
Total Comprehensive Income (Loss) Attributable to:<br />
$ß 1,318 $ß 1,215<br />
Common Shares and Non-Voting Shares $ß 947 $ß 378<br />
Non-controlling interests – (4)<br />
$ß 947 $ß 374<br />
Net Income Per Common Share and Non-Voting Share 11<br />
Basic $ß 4.05 $ß 3.76<br />
Diluted $ß 4.03 $ß 3.74<br />
Dividends Declared Per Common Share and Non-Voting Share<br />
Total Weighted Average Common Shares and Non-Voting Shares Outstanding<br />
12 $ß 2.440 $ß 2.205<br />
Basic 326 324<br />
Diluted 327 326<br />
The accompanying notes are an integral part of these consolidated financial statements.<br />
110 . <strong>TELUS</strong> 2012 ANNUAL REPORT
Consolidated statements of financial position<br />
FINANCIAL STATEMENTS & NOTES<br />
As at December 31 (millions)<br />
Assets<br />
Current assets<br />
Note 2012 2011<br />
Cash and temporary investments, net $ß 107 $ß 46<br />
Accounts receivable 24(a) 1,541 1,428<br />
Income and other taxes receivable 25 66<br />
Inventories 24(a) 350 353<br />
Prepaid expenses 178 144<br />
Derivative assets 4(h) 9 14<br />
Non-current assets<br />
2,210 2,051<br />
Property, plant and equipment, net 15 8,165 7,964<br />
Intangible assets, net 16 6,181 6,153<br />
Goodwill, net 16 3,702 3,661<br />
Real estate joint venture 17 11 –<br />
Other long-term assets 118 81<br />
Investments 58 21<br />
18,235 17,880<br />
Liabilities and Owners’ Equity<br />
Current liabilities<br />
$ß20,445 $ß19,931<br />
Short-term borrowings 18 $ß 402 $ß 404<br />
Accounts payable and accrued liabilities 24(a) 1,511 1,419<br />
Income and other taxes payable 102 25<br />
Dividends payable 12 208 188<br />
Advance billings and customer deposits 24(a) 703 655<br />
Provisions 19 49 88<br />
Current maturities of long-term debt 20 545 1,066<br />
Non-current liabilities<br />
3,520 3,845<br />
Provisions 19 222 122<br />
Long-term debt 20 5,711 5,508<br />
Other long-term liabilities 24(a) 1,682 1,343<br />
Deferred income taxes 1,624 1,600<br />
9,239 8,573<br />
Liabilities<br />
Owners’ equity<br />
12,759 12,418<br />
Common Share and Non-Voting Share equity 21 7,686 7,513<br />
Commitments and Contingent Liabilities 22<br />
The accompanying notes are an integral part of these consolidated financial statements.<br />
Approved by the Directors:<br />
William A. MacKinnon Brian A. Canfield<br />
Director Director<br />
$ß20,445 $ß19,931<br />
<strong>TELUS</strong> 2012 ANNUAL REPORT . 111
Consolidated statements of changes in owners’ equity<br />
112 . <strong>TELUS</strong> 2012 ANNUAL REPORT<br />
Common Shares Non-Voting Shares<br />
(millions except number of shares) Note Number of shares Share capital Number of shares Share capital<br />
Balance as at January 1, 2011 174,915,546 $ß2,219 147,448,586 $ß3,237<br />
Net income – – – –<br />
Other comprehensive income – – – –<br />
Dividends<br />
Dividend Reinvestment<br />
12(a) – – – –<br />
and Share Purchase Plan 12(b)<br />
– Dividends reinvested in shares – – 1,243,679 54<br />
– Optional cash payments – – 5,990 –<br />
Share option award expense<br />
Shares issued pursuant to<br />
13 – – – –<br />
cash exercise of share options<br />
Shares issued pursuant to use of<br />
share option award net-equity<br />
13(b) – – 812,834 44<br />
settlement feature<br />
Reclassification of subsidiary<br />
13(b) – – 422,076 2<br />
as held for sale 16(a) – – – –<br />
Acquisition of subsidiary 16(e) – – – –<br />
Balance as at December 31, 2011 174,915,546 $ß2,219 149,933,165 $ß3,337<br />
Balance as at January 1, 2012 174,915,546 $ß2,219 149,933,165 $ß3,337<br />
Net income – – – –<br />
Other comprehensive income – – – –<br />
Dividends 12(a) – – – –<br />
Share option award expense<br />
Shares issued pursuant to<br />
13 – – – –<br />
cash exercise of share options<br />
Shares issued pursuant to use of<br />
share option award net-equity<br />
13(b) – – 52,300 1<br />
settlement feature<br />
Share conversion requested by holder<br />
13(b) – – 1,062,021 22<br />
in accordance with our Articles<br />
Recovery of income tax on item credited<br />
(5,000) – 5,000 –<br />
directly to contributed surplus – – – –<br />
Balance as at December 31, 2012 174,910,546 $ß2,219 151,052,486 $ß3,360<br />
The accompanying notes are an integral part of these consolidated financial statements.
FINANCIAL STATEMENTS & NOTES<br />
Common Share and Non-Voting Share equity<br />
Equity contributed<br />
Share capital (Note 21)<br />
Accumulated<br />
other<br />
Contributed Retained comprehensive Non-controlling<br />
Total surplus earnings income Total interests Total<br />
$ß5,456 $ß176 $ß2,126 $ß 1 $ß7,759 $ß22 $ß7,781<br />
– – 1,219 – 1,219 (4) 1,215<br />
– – (851) 10 (841) – (841)<br />
– – (715) – (715) (4) (719)<br />
54 – – – 54 – 54<br />
– – – – – – –<br />
– 9 – – 9 – 9<br />
44 (17) – – 27 – 27<br />
2 (2) – – – – –<br />
– – – – – (12) (12)<br />
– – 1 – 1 (2) (1)<br />
$ß5,556 $ß166 $ß1,780 $ß11 $ß7,513 $ß – $ß7,513<br />
$ß5,556 $ß166 $ß1,780 $ß11 $ß7,513 $ß – $ß7,513<br />
– – 1,318 – 1,318 – 1,318<br />
– – (400) 29 (371) – (371)<br />
– – (794) – (794) – (794)<br />
– 9 – – 9 – 9<br />
1 – – – 1 – 1<br />
22 (22) – – – – –<br />
– – – – – – –<br />
– 10 – – 10 – 10<br />
$ß5,579 $ß163 $ß1,904 $ß40 $ß7,686 $ß – $ß7,686<br />
<strong>TELUS</strong> 2012 ANNUAL REPORT . 113
Consolidated statements of cash flows<br />
Years ended December 31 (millions) Note 2012 2011<br />
Operating Activities<br />
Net income<br />
Adjustments to reconcile net income to cash provided by operating activities:<br />
$ß1,318 $ß1,215<br />
Depreciation and amortization 1,865 1,810<br />
Deferred income taxes 163 205<br />
Share-based compensation 13 9 (12)<br />
Net employee defined benefit plans expense 14(b)-(c) (10) (32)<br />
Employer contributions to employee defined benefit plans (173) (298)<br />
Gain on re-measured 51% Transactel (Barbados) Inc. interest 6, 16(e) – (17)<br />
Other (5) (66)<br />
Net change in non-cash operating working capital 24(b) 52 (255)<br />
Cash provided by operating activities<br />
Investing Activities<br />
3,219 2,550<br />
Cash payments for capital assets, excluding spectrum licences 24(b) (1,950) (1,867)<br />
Cash payments for acquisitions and related investments 24(b) (53) (101)<br />
Real estate joint venture advances and contributions 17(c) (73) –<br />
Real estate joint venture receipts 17(c) 47 –<br />
Proceeds on dispositions 24(b) 20 –<br />
Other (49) –<br />
Cash used by investing activities<br />
Financing Activities<br />
(2,058) (1,968)<br />
Non-Voting Shares issued 1 24<br />
Dividends paid to holders of Common Shares and Non-Voting Shares 24(b) (774) (642)<br />
Issuance and repayment of short-term borrowings 18 (2) 4<br />
Long-term debt issued 20, 24(b) 5,988 4,068<br />
Redemptions and repayment of long-term debt 20, 24(b) (6,309) (3,946)<br />
Acquisition of additional equity interest in a subsidiary from non-controlling interest 16(e) – (51)<br />
Dividends paid by a subsidiary to non-controlling interest and other (4) (10)<br />
Cash used by financing activities<br />
Cash Position<br />
(1,100) (553)<br />
Increase in cash and temporary investments, net 61 29<br />
Cash and temporary investments, net, beginning of period 46 17<br />
Cash and temporary investments, net, end of period<br />
Supplemental Disclosure of Cash Flows<br />
$ß 107 $ß 46<br />
Interest (paid) $ß (337) $ß (378)<br />
Interest received $ß 13 $ß 1<br />
Income taxes (inclusive of Investment Tax Credits) (paid), net 9 $ß (150) $ß (150)<br />
The accompanying notes are an integral part of these consolidated financial statements.<br />
114 . <strong>TELUS</strong> 2012 ANNUAL REPORT
Notes to consolidated financial statements<br />
December 31, 2012<br />
FINANCIAL STATEMENTS & NOTES<br />
<strong>TELUS</strong> Corporation is one of Canada’s largest telecommunications companies, providing a wide range of telecommunications services and products<br />
including wireless, data, Internet protocol, voice and television.<br />
<strong>TELUS</strong> Corporation was incorporated under the Company Act (British Columbia) on October 26, 1998, under the name BCT.<strong>TELUS</strong><br />
Communications Inc. (BCT). On January 31, 1999, pursuant to a court-approved plan of arrangement under the Canada Business Corporations<br />
Act among BCT, BC TELECOM Inc. and the former Alberta-based <strong>TELUS</strong> Corporation (TC), BCT acquired all of the shares of BC TELECOM Inc.<br />
and TC in exchange for Common Shares and Non-Voting Shares of BCT, and BC TELECOM Inc. was dissolved. On May 3, 2000, BCT changed<br />
its name to <strong>TELUS</strong> Corporation and in February 2005, <strong>TELUS</strong> Corporation transitioned under the Business Corporations Act (British Columbia),<br />
successor to the Company Act (British Columbia). <strong>TELUS</strong> Corporation maintains its registered office at Floor 5, 3777 Kingsway, Burnaby, British<br />
Columbia, V5H 3Z7.<br />
The terms “<strong>TELUS</strong>”, “we”, “us” “our” or “ourselves” are used to refer to <strong>TELUS</strong> Corporation and, where the context of the narrative permits,<br />
or requires, its subsidiaries.<br />
Notes to consolidated financial statements Page Description<br />
GENERAL APPLICATION<br />
1. Summary of significant accounting policies 116 Summary review of accounting policies and principles and the methods we use in their application<br />
2. Accounting policy developments 122 Summary review of generally accepted accounting principle developments that do, will or may<br />
affect us<br />
3. Capital structure financial policies 123 Summary review of our objectives, policies and processes for managing our capital structure<br />
4. Financial instruments 125 Summary schedules and review of financial instruments, including the management of associated<br />
risks and fair values<br />
CONSOLIDATED RESULTS OF OPERATIONS FOCUSED<br />
5. Segmented information 131 Summary disclosure of segmented information regularly <strong>report</strong>ed to our chief operating<br />
decision-maker<br />
6. Other operating income 132 Summary schedule and review of items comprising other operating income<br />
7. Employee benefits expense 132 Summary schedule of employee benefits expense<br />
8. Financing costs 133 Summary schedule of items comprising financing costs<br />
9. Income taxes 133 Summary schedule of income tax expense, reconciliations of statutory rate income tax expense<br />
to income tax expense and analyses of deferred income tax liability<br />
10. Other comprehensive income 135 Details of other comprehensive income and accumulated amounts<br />
11. Per share amounts 135 Summary schedule and review of numerators and denominators used in calculating per share<br />
amounts and related disclosures<br />
12. Dividends per share 136 Summary schedule of dividends declared and review of dividend reinvestment plan<br />
13. Share-based compensation 137 Summary schedules and review of compensation arising from share option awards, restricted<br />
stock units and employee share purchase plan<br />
14. Employee future benefits 140 Summary schedules and review of employee future benefits and related disclosures<br />
CONSOLIDATED FINANCIAL POSITION FOCUSED<br />
15. Property, plant and equipment 147 Summary schedule of items comprising property, plant and equipment<br />
16. Intangible assets and goodwill 148 Summary schedule of items comprising intangible assets, including goodwill, review of <strong>annual</strong><br />
impairment testing and review of <strong>report</strong>ed fiscal year acquisitions from which intangible assets,<br />
including goodwill, arose<br />
17. Real estate joint venture 154 Summary review of real estate joint venture and related disclosures<br />
18. Short-term borrowings 156 Review of short-term borrowings and related disclosures<br />
19. Provisions 156 Summary schedules and review of items comprising provisions, including restructuring activities<br />
20. Long-term debt 159 Summary schedule of long-term debt and related disclosures<br />
21. Common Share and Non-Voting Share capital 161 Review of authorized share capital<br />
22. Commitments and contingent liabilities<br />
OTHER<br />
162 Summary review of lease obligations, contingent liabilities, claims and lawsuits<br />
23. Related party transactions 163 Summary schedules, including review of transactions with key management personnel<br />
24. Additional financial information 164 Summary schedules of items comprising certain primary financial statement line items<br />
<strong>TELUS</strong> 2012 ANNUAL REPORT . 115
1<br />
Summary of significant accounting policies<br />
The accompanying consolidated financial statements are expressed<br />
in Canadian dollars. The generally accepted accounting principles<br />
we use are International Financial Reporting Standards as issued by<br />
the International Accounting Standards Board (IFRS-IASB) and these<br />
consolidated financial statements comply with IFRS-IASB and Canadian<br />
generally accepted accounting principles. The date of our transition<br />
to IFRS-IASB was January 1, 2010, and the date of our adoption was<br />
January 1, 2011.<br />
Our consolidated financial statements for the years ended December<br />
31, 2012 and 2011 were authorized by our Board of Directors for<br />
issue on February 27, 2013.<br />
(a) Consolidation<br />
Our consolidated financial statements include our accounts and the<br />
accounts of all of our subsidiaries, of which the principal one is <strong>TELUS</strong><br />
Communications Inc. Currently, through the <strong>TELUS</strong> Communications<br />
Company partnership and the TELE-MOBILE COMPANY partnership,<br />
<strong>TELUS</strong> Communications Inc. includes substantially all of our Wireline<br />
segment’s operations and substantially all of our Wireless segment’s<br />
operations. With the exception of non-controlling interests in an<br />
immaterial subsidiary held for sale as at December 31, 2011 (which<br />
was sold during the year ended December 31, 2012), all of our<br />
subsidiaries are wholly owned.<br />
Our financing arrangements and those of our subsidiaries do not<br />
impose restrictions on inter-corporate dividends.<br />
On a continuing basis, we review our corporate organization and<br />
effect changes as appropriate so as to enhance the value of <strong>TELUS</strong><br />
Corporation. This process can, and does, affect which of our subsidiaries<br />
are considered principal subsidiaries at any particular point in time.<br />
(b) Use of estimates and judgements<br />
The preparation of financial statements in conformity with generally<br />
accepted accounting principles requires management to make estimates,<br />
assumptions and judgements that affect: the <strong>report</strong>ed amounts of assets<br />
and liabilities at the date of the financial statements; the disclosure of<br />
contingent assets and liabilities at the date of the financial statements;<br />
and the <strong>report</strong>ed amounts of revenues and expenses during the <strong>report</strong>ing<br />
period. Actual results could differ from those estimates.<br />
116 . <strong>TELUS</strong> 2012 ANNUAL REPORT<br />
Estimates<br />
Examples of the significant estimates and assumptions that we<br />
make include:<br />
. the allowance for doubtful accounts;<br />
. the allowance for inventory obsolescence;<br />
. the estimated useful lives of assets;<br />
. the recoverability of tangible and intangible assets subject<br />
to amortization;<br />
. the recoverability of intangible assets with indefinite lives;<br />
. the recoverability of goodwill;<br />
. the recoverability of long-term investments;<br />
. the amount and composition of income tax assets and income<br />
tax liabilities, including the amount of unrecognized tax benefits;<br />
and<br />
. certain actuarial and economic assumptions used in determining<br />
defined benefit pension costs, accrued pension benefit obligations<br />
and pension plan assets.<br />
Judgements<br />
Examples of significant judgements, apart from those involving<br />
estimation, include:<br />
. The decision to depreciate and amortize any property, plant,<br />
equipment and intangible assets that are subject to amortization<br />
on a straight-line basis, as we believe that this method reflects<br />
the consumption of resources related to the economic lifespan<br />
of those assets better than an accelerated method and is more<br />
representative of the economic substance of the underlying<br />
use of those assets.<br />
. The view that our spectrum licences granted by Industry Canada<br />
will likely be renewed by Industry Canada; that we intend to renew<br />
them; that we believe we have the financial and operational ability<br />
to renew them and, thus, they are deemed to have an indefinite<br />
life, as discussed further in Note 16(c).<br />
. In respect of claims and lawsuits, as discussed further in Note 22(c),<br />
the determination of whether an item is a contingent liability or<br />
whether an outflow of resources is probable and thus needs to<br />
be accounted for as a provision.
(c) Financial instruments – recognition and measurement<br />
In respect of the recognition and measurement of financial instruments, we have adopted the following policies:<br />
FINANCIAL STATEMENTS & NOTES: 1<br />
Accounting classification<br />
Fair value Part of a cash<br />
through net Loans and Available- Amortized flow hedging<br />
Financial instrument income (1)(2) receivables -for-sale (3) cost relationship (3)<br />
Measured at amortized cost<br />
Accounts receivable X<br />
Construction credit facilities advances to real estate joint venture X<br />
Short-term obligations X<br />
Accounts payable X<br />
Provisions X<br />
Long-term debt<br />
Measured at fair value<br />
X<br />
Cash and temporary investments X<br />
Short-term investments X<br />
Long-term investments (not subject to significant influence) (4) X<br />
Foreign exchange derivatives X X<br />
Share-based compensation derivatives X X<br />
Cross currency interest rate swap derivatives (5) X<br />
(1) Classification includes financial instruments held for trading. Certain qualifying financial instruments that are not required to be classified as held for trading may be classified as held<br />
for trading if we so choose.<br />
(2) Unrealized changes in the fair values of financial instruments are included in net income.<br />
(3) Unrealized changes in the fair values of financial instruments classified as available-for-sale, or the effective portion of unrealized changes in the fair values of financial instruments held<br />
for hedging are included in other comprehensive income.<br />
(4) Long-term investments over which we do not have significant influence are classified as available-for-sale. In respect of investments in securities for which the fair values can be<br />
reliably measured, we determine the classification on an instrument-by-instrument basis at the time of initial recognition.<br />
(5) The cross currency interest rate swap derivatives matured in fiscal 2011, as discussed further in Note 20(b).<br />
. Trade receivables that may be sold to an arm’s-length securitization<br />
trust are accounted for as loans and receivables. We have selected<br />
this classification as the benefits that would have been expected<br />
to arise from selecting the available-for-sale classification were not<br />
expected to exceed the costs of selecting and implementing that<br />
classification.<br />
. Short-term marketable securities investments are accounted<br />
for as held for trading and thus are measured at fair value through<br />
net income. Long-term investments over which we do not have<br />
significant influence are accounted for as available-for-sale. We have<br />
selected these classifications as they better reflect management’s<br />
investment intentions.<br />
. Derivatives that are part of an established and documented cash<br />
flow hedging relationship are accounted for as held for hedging.<br />
We believe that classification as held for hedging results in a better<br />
matching of the change in the fair value of the derivative financial<br />
instrument with the risk exposure being hedged.<br />
In respect of hedges of anticipated transactions, which in our<br />
specific instance currently relate to inventory purchase commitments,<br />
hedge gains/losses will be included in the cost of the inventory and<br />
will be expensed when the inventory is sold. We have selected this<br />
method as we believe that a better matching with the risk exposure<br />
being hedged is achieved.<br />
Derivatives that are not part of a documented cash flow hedging<br />
relationship are accounted for as held for trading and thus are<br />
measured at fair value through net income.<br />
. Regular-way purchases or sales (those which require actual delivery<br />
of financial assets or financial liabilities) are recognized on the settlement<br />
date. We have selected this method as the benefits that would<br />
have been expected to arise from using the trade date method were<br />
not expected to exceed the costs of selecting and implementing<br />
that method.<br />
. Transaction costs, other than in respect of held for trading items,<br />
are added to the initial fair value of the acquired financial asset or<br />
financial liability. We have selected this method as we believe that this<br />
results in a better matching of the transaction costs with the periods<br />
benefiting from the transaction costs.<br />
(d) Hedge accounting<br />
General<br />
We apply hedge accounting to the financial instruments used to:<br />
. establish designated currency hedging relationships for our U.S. dollar<br />
denominated long-term debt, which matured in fiscal 2011, as further<br />
discussed in Note 20(b);<br />
. establish designated currency hedging relationships for certain<br />
U.S. dollar denominated future purchase commitments, as set out<br />
in Note 4(d); and<br />
. fix the compensation cost arising from specific grants of restricted<br />
stock units, as set out in Note 4(f) and further discussed in Note 13(c).<br />
Hedge accounting<br />
The purpose of hedge accounting, in respect of our designated hedging<br />
relationships, is to ensure that counterbalancing gains and losses are<br />
recognized in the same periods. We chose to apply hedge accounting as<br />
we believe this is more representative of the economic substance of the<br />
underlying transactions.<br />
In order to apply hedge accounting, a high correlation (which<br />
indicates effectiveness) is required in the offsetting changes in the values<br />
of the financial instruments (the hedging items) used to establish the<br />
designated hedging relationships and all, or a part, of the asset, liability<br />
or transaction having an identified risk exposure that we have taken steps<br />
to modify (the hedged items). We assess the anticipated effectiveness<br />
of designated hedging relationships at inception and actual effectiveness<br />
for each <strong>report</strong>ing period thereafter. We consider a designated hedging<br />
<strong>TELUS</strong> 2012 ANNUAL REPORT . 117
elationship to be effective if the following critical terms match between<br />
the hedging item and the hedged item: the notional amount of the<br />
hedging item and the principal amount of the hedged item; maturity<br />
dates; payment dates; and interest rate index (if, and as, applicable).<br />
As set out in Note 4(i), any ineffectiveness, such as would result from<br />
a difference between the notional amount of the hedging item and<br />
the principal of the hedged item, or from a previously effective designated<br />
hedging relationship becoming ineffective, is reflected in the<br />
Consolidated Statements of Income and Other Comprehensive Income<br />
as Financing costs if in respect of long-term debt, as Goods and services<br />
purchased if in respect of U.S. dollar denominated future purchase<br />
commitments or as Employee benefits expense if in respect of sharebased<br />
compensation.<br />
Hedging assets and liabilities<br />
In the application of hedge accounting, an amount (the hedge value)<br />
is recorded on the Consolidated Statements of Financial Position in<br />
respect of the fair value of the hedging items. The net difference, if any,<br />
between the amounts recognized in the determination of net income<br />
and the amount necessary to reflect the fair value of the designated cash<br />
flow hedging items on the Consolidated Statements of Financial Position<br />
is recognized as a component of other comprehensive income, as set<br />
out in Note 10.<br />
In the application of hedge accounting to U.S. dollar denominated<br />
long-term debt that matured in fiscal 2011, the amount recognized in<br />
the determination of net income was the amount that counterbalanced<br />
the difference between the Canadian dollar equivalent of the value<br />
of the hedged items at the rate of exchange at the statement of financial<br />
position date and the Canadian dollar equivalent of the value of the<br />
hedged items at the rate of exchange in the hedging items.<br />
In the application of hedge accounting to the compensation cost<br />
arising from share-based compensation, the amount recognized in the<br />
determination of net income is the amount that counterbalances the<br />
difference between the quoted market price of our Non-Voting Shares at<br />
the statement of financial position date and the price of our Non-Voting<br />
Shares in the hedging items.<br />
(e) Revenue recognition<br />
General<br />
We earn the majority of our revenue (wireless: voice and data; wireline:<br />
data (including: television, Internet, enhanced data and hosting services<br />
and managed and legacy data services), voice local and voice long<br />
distance) from access to, and usage of, our telecommunications infrastructure.<br />
The majority of the balance of our revenue (other and wireless<br />
equipment) arises from providing services and products facilitating<br />
access to, and usage of, our telecommunications infrastructure.<br />
We offer complete and integrated solutions to meet our customers’<br />
needs. These solutions may involve the delivery of multiple services<br />
and products occurring at different points in time and/or over different<br />
periods of time. As appropriate, these multiple element arrangements<br />
are separated into their component accounting units, consideration<br />
is measured and allocated amongst the accounting units based upon<br />
their relative fair values (derived using Company-specific objective<br />
evidence) and then our relevant revenue recognition policies are applied<br />
to the accounting units. A limitation cap restricts the consideration<br />
allocated to services or products currently transferred in multiple element<br />
arrangements to an amount that is not contingent upon the delivery<br />
of additional items or meeting other specified performance conditions.<br />
118 . <strong>TELUS</strong> 2012 ANNUAL REPORT<br />
Our view is that the limitation cap results in a faithful depiction of the<br />
transfer of services and products as it reflects the telecommunications<br />
industry’s generally accepted understanding of the transfer of services<br />
and products as well as reflecting the related cash flows.<br />
Multiple contracts with a single customer are normally accounted<br />
for as separate arrangements. In instances where multiple contracts are<br />
entered into with a customer in a short period of time, they are reviewed<br />
as a group to ensure that, as with multiple element arrangements,<br />
relative fair values are appropriate.<br />
Lease accounting is applied to an accounting unit if it conveys the<br />
right to use a specific asset to a customer but does not convey the risks<br />
and/or benefits of ownership.<br />
Our revenues are recorded net of any value-added, sales and/or<br />
use taxes billed to the customer concurrent with a revenue-producing<br />
transaction.<br />
When we receive no identifiable, separable benefit for consideration<br />
given to a customer (e.g. discounts and rebates), the consideration is<br />
recorded as a reduction of revenue rather than as an expense.<br />
Voice and data<br />
We recognize revenues on an accrual basis and include an estimate<br />
of revenues earned but unbilled. Wireless and wireline service revenues<br />
are recognized based upon access to, and usage of, our telecommunications<br />
infrastructure and upon contract fees.<br />
Advance billings are recorded when billing occurs prior to rendering<br />
the associated service; such advance billings are recognized as<br />
revenue in the period in which the services are provided. Similarly,<br />
and as appropriate, upfront customer activation and connection fees<br />
are deferred and recognized over the average expected term of the<br />
customer relationship.<br />
We follow the liability method of accounting for the amounts of<br />
our quality of service rate rebates that arise from the jurisdiction of the<br />
Canadian Radio-television and Telecommunications Commission (CRTC).<br />
The CRTC has established a mechanism to subsidize local exchange<br />
carriers, such as ourselves, that provide residential basic telephone<br />
service to high cost serving areas. The CRTC has determined the per<br />
network access line/per band subsidy rate for all local exchange carriers.<br />
We recognize the subsidy on an accrual basis by applying the subsidy<br />
rate to the number of residential network access lines we have in high<br />
cost serving areas, as further discussed in Note 6. Differences, if any,<br />
between interim and final subsidy rates set by the CRTC are accounted<br />
for as a change in estimate in the period in which the CRTC finalizes<br />
the subsidy rate.<br />
Other and wireless equipment<br />
We recognize product revenues, including amounts related to wireless<br />
handsets sold to re-sellers and customer premises equipment, when the<br />
products are delivered and accepted by the end-user customers. With<br />
respect to wireless handsets sold to re-sellers, we consider ourselves to<br />
be the principal and primary obligor to the end-user customer. Revenues<br />
from operating leases of equipment are recognized on a systematic and<br />
rational basis (normally a straight-line basis) over the term of the lease.<br />
Non-high cost serving area deferral account<br />
In 2002 the CRTC issued Decisions 2002-34 and 2002-43 which<br />
affected regulated services in our Wireline segment. In an effort to foster<br />
competition for residential basic service in non-high cost serving areas,<br />
the concept of a deferral account mechanism was introduced by the<br />
CRTC, as an alternative to mandating price reductions.
The deferral account arises from the CRTC requiring us to defer<br />
the statement of income recognition of a portion of the monies received<br />
in respect of residential basic services provided to non-high cost serving<br />
areas. We have adopted the liability method of accounting for the deferral<br />
account. As a result, we recorded incremental liability amounts, subject<br />
to reductions for the mitigating activities, during the Decisions’ four-year<br />
price cap periods. The deferral account balance also reflects an interest<br />
expense component based on our applicable short-term cost of borrowing,<br />
such expense being included in the Consolidated Statements<br />
of Income and Other Comprehensive Income as Financing costs.<br />
We discharge the deferral account liability by undertaking qualifying<br />
actions, including providing broadband services to rural and remote<br />
communities and enhancing the accessibility to telecommunications<br />
services for individuals with disabilities, with the balance having been<br />
provided in customer rebates. We recognize the drawdown and<br />
amortization (over a period no longer than three years) of a proportionate<br />
share of the deferral account as qualifying actions are completed.<br />
Such amortization is included in Other operating income.<br />
(f) Government assistance<br />
We recognize government assistance on an accrual basis as<br />
the sub sidized services are provided or as the subsidized costs are<br />
incurred. As set out in Note 6, government assistance is included<br />
in the Consolidated Statements of Income and Other Comprehensive<br />
Income as Other operating income.<br />
(g) Cost of acquisition and advertising costs<br />
Costs of acquiring customers that are expensed as incurred include the<br />
total cost of hardware sold to customers and any commissions, advertising<br />
and promotion related to the initial customer acquisition. Costs of<br />
acquiring customers that are capitalized as incurred include the cost of<br />
hardware we own that is situated at customers’ premises and associated<br />
installation costs. Costs of acquisition that are expensed are included<br />
in the Consolidated Statements of Income and Other Comprehensive<br />
Income as a component of Goods and services purchased except for<br />
commissions paid to our employees, which are included as Employee<br />
benefits expense. Costs of advertising production, advertising airtime<br />
and advertising space are expensed as incurred.<br />
(h) Research and development<br />
Research and development costs are expensed except in cases where<br />
development costs meet certain identifiable criteria for capitalization.<br />
Capitalized development costs are amortized over the life of the related<br />
commercial production, or in the case of serviceable property, plant<br />
and equipment, are included in the appropriate property group and are<br />
depreciated over its estimated useful life.<br />
(i) Leases<br />
Leases are classified as finance or operating depending upon the terms<br />
and conditions of the contracts.<br />
Where we are the lessee, asset values recorded under finance leases<br />
are amortized on a straight-line basis over the period of expected use.<br />
Obligations recorded under finance leases are reduced by lease payments<br />
net of imputed interest.<br />
For the year ended December 31, 2012, real estate and vehicle operating<br />
lease expenses, which are net of the amortization of the deferred<br />
gain on the sale-leaseback of buildings, were $283 million (2011 –<br />
$290 million); of these amounts, $NIL (2011 – less than $1 million) was<br />
in respect of real estate leased from our pension plans, as discussed<br />
FINANCIAL STATEMENTS & NOTES: 1<br />
further in Note 14(b). The unamortized balances of the deferred gains<br />
on the sale-leaseback of buildings are set out in Note 24(a).<br />
(j) Depreciation, amortization and impairment<br />
Depreciation and amortization<br />
Assets are depreciated on a straight-line basis over their estimated<br />
useful lives as determined by a continuing program of asset life studies.<br />
Depreciation includes amortization of assets under finance leases and<br />
amortization of leasehold improvements. Leasehold improvements are<br />
normally amortized over the lesser of their expected average service<br />
life or the term of the lease. Intangible assets with finite lives (intangible<br />
assets subject to amortization) are amortized on a straight-line basis<br />
over their estimated lives; estimated lives are reviewed at least <strong>annual</strong>ly<br />
and are adjusted as appropriate.<br />
Estimated useful lives for the majority of our property, plant and<br />
equipment subject to depreciation are as follows:<br />
Estimated<br />
useful lives (1)<br />
Network assets<br />
Outside plant 17 to 40 years<br />
Inside plant 4 to 16 years<br />
Wireless site equipment 6.5 to 10 years<br />
Balance of depreciable property, plant and equipment 3 to 40 years<br />
(1) The composite depreciation rate for the year ended December 31, 2012, was 5.1%<br />
(2011 – 5.0%). The rate is calculated by dividing depreciation expense by an average<br />
gross book value of depreciable assets for the <strong>report</strong>ing period. One result of this<br />
methodology is that the composite depreciation rate will be lower in a period that has<br />
a higher proportion of fully depreciated assets remaining in use (Note 15).<br />
Estimated useful lives for the majority of our intangible assets subject<br />
to amortization are as follows:<br />
Estimated<br />
useful lives<br />
Wireline subscriber base 40 years<br />
Customer contracts, related customer relationships<br />
and leasehold interests 6 to 10 years<br />
Software 3 to 5 years<br />
Access to rights-of-way and other 8 to 30 years<br />
Impairment – general<br />
Impairment testing compares the carrying values of the assets or cashgenerating<br />
units being tested with their recoverable amounts (recoverable<br />
amounts being the greater of the assets’ or cash-generating units’<br />
values in use or their fair values less costs to sell). Impairment losses are<br />
immediately recognized to the extent that the asset or cash-generating<br />
unit carrying values exceed their recoverable amounts. Should the<br />
recoverable amounts for previously impaired assets or cash-generating<br />
units subsequently increase, the impairment losses previously recognized<br />
(other than in respect of goodwill) may be reversed to the extent<br />
that the reversal is not a result of “unwinding of the discount” and<br />
that the resulting carrying value does not exceed the carrying value<br />
that would have been the result if no impairment losses had been<br />
previously recognized.<br />
Impairment – property, plant and equipment;<br />
intangible assets subject to amortization<br />
The continuing program of asset life studies considers such items as<br />
timing of technological obsolescence, competitive pressures and future<br />
infrastructure utilization plans; such considerations could also indicate<br />
that carrying values of assets may not be recoverable. If the carrying<br />
values of assets were not considered recoverable, an impairment loss<br />
would be recorded.<br />
<strong>TELUS</strong> 2012 ANNUAL REPORT . 119
Impairment – intangible assets with indefinite lives; goodwill<br />
The carrying values of intangible assets with indefinite lives and goodwill<br />
are periodically tested for impairment. The frequency of the impairment<br />
tests generally is the reciprocal of the stability of the relevant events and<br />
circumstances, but intangible assets with indefinite lives and goodwill<br />
must, at a minimum, be tested <strong>annual</strong>ly; we have selected December<br />
as our <strong>annual</strong> test date.<br />
We assess our intangible assets with indefinite lives by comparing<br />
the recoverable amounts of our cash-generating units to the carrying<br />
amounts of our cash-generating units (including the intangible assets<br />
with indefinite lives allocated to the cash-generating unit, but excluding<br />
any goodwill allocated to the cash-generating unit). To the extent that<br />
the carrying amount of the cash-generating unit (including the intangible<br />
assets with indefinite lives allocated to the cash-generating unit, but<br />
excluding any goodwill allocated to the cash-generating unit) exceeds its<br />
recoverable amount, the excess would reduce the carrying amount of<br />
intangible assets with indefinite lives.<br />
Subsequent to assessing our intangible assets with indefinite lives,<br />
we then assess our goodwill by comparing the recoverable amounts of<br />
our cash-generating units to the carrying amounts of our cash-generating<br />
units (including the intangible assets with indefinite lives and the goodwill<br />
allocated to the cash-generating unit). To the extent that the carrying<br />
amount of the cash-generating unit (including the intangible assets with<br />
indefinite lives and the goodwill allocated to the cash-generating unit)<br />
exceeds its recoverable amount, the excess would first reduce the<br />
carrying value of goodwill and any remainder would reduce the carrying<br />
values of the assets of the cash-generating units on a pro-rated basis.<br />
We have determined that our current cash-generating units are our<br />
<strong>report</strong>able segments, Wireless and Wireline, as the <strong>report</strong>able segments<br />
are the smallest identifiable groups of assets that generate net cash<br />
inflows that are largely independent of each other.<br />
(k) Translation of foreign currencies<br />
Trade transactions completed in foreign currencies are translated into<br />
Canadian dollars at the rates prevailing at the time of the transactions.<br />
Monetary assets and liabilities denominated in foreign currencies are<br />
translated into Canadian dollars at the rate of exchange in effect at<br />
the statement of financial position date with any resulting gain or loss<br />
being included in the Consolidated Statements of Income and Other<br />
Comprehensive Income as a component of Financing costs, as set out<br />
in Note 8. Hedge accounting is applied in specific instances as further<br />
discussed in (d) preceding.<br />
We have minor foreign subsidiaries that do not have the Canadian<br />
dollar as their functional currency. Accordingly, foreign exchange gains<br />
and losses arising from the translation of the minor foreign subsidiaries’<br />
accounts into Canadian dollars subsequent to, or on, January 1, 2010,<br />
the date of our transition to IFRS-IASB, are <strong>report</strong>ed as a component<br />
of other comprehensive income, as set out in Note 10. The cumulative<br />
foreign currency translation difference balance at January 1, 2010, was<br />
recognized directly in retained earnings at the transition date to, and<br />
as permitted by, IFRS-IASB.<br />
(l) Income taxes<br />
We follow the liability method of accounting for income taxes. Under<br />
this method, current income taxes are recognized for the estimated<br />
income taxes payable for the current year. Deferred income tax assets<br />
and liabilities are recognized for temporary differences between the<br />
tax and accounting bases of assets and liabilities, as well as for<br />
the benefit of losses and Investment Tax Credits available to be carried<br />
120 . <strong>TELUS</strong> 2012 ANNUAL REPORT<br />
forward to future years for tax purposes that are more likely than not<br />
to be realized. The amounts recognized in respect of deferred income<br />
tax assets and liabilities are based upon the expected timing of the<br />
reversal of temporary differences or usage of tax losses and application<br />
of the substantively enacted tax rates at the time of reversal or usage.<br />
We account for changes in substantively enacted tax rates affecting<br />
deferred income tax assets and liabilities in full in the period in which<br />
the changes are substantively enacted; we have selected this method<br />
as its emphasis on the statement of financial position is more consistent<br />
with the liability method of accounting for income taxes. We account<br />
for changes in the estimates of prior year(s) tax balances as estimate<br />
revisions in the period in which the changes in estimate arise; we have<br />
selected this method as its emphasis on the statement of financial<br />
position is more consistent with the liability method of accounting for<br />
income taxes.<br />
Our operations are complex and the related tax interpretations,<br />
regulations and legislation are continually changing. As a result, there are<br />
usually some tax matters in question that result in uncertain tax positions.<br />
We only recognize the income tax benefit of an uncertain tax position<br />
when it is more likely than not that the ultimate determination of the tax<br />
treatment of the position will result in that benefit being realized. We<br />
accrue for interest charges on current tax liabilities that have not been<br />
funded, which would include interest and penalties arising from uncertain<br />
tax positions. We include such charges in the Consolidated Statements<br />
of Income and Other Comprehensive Income as a component of<br />
Financing costs.<br />
Our research and development activities may be eligible to earn<br />
Investment Tax Credits; the determination of eligibility is a complex<br />
matter. We only recognize Investment Tax Credits when there is reasonable<br />
assurance that the ultimate determination of the eligibility of our<br />
research and development activities will result in the Investment Tax<br />
Credits being received, at which time they are accounted for using the<br />
cost reduction method whereby such credits are deducted from the<br />
expenditures or assets to which they relate, as set out in Note 9.<br />
(m) Share-based compensation<br />
For share option awards granted after 2001, a fair value is determined<br />
for share option awards at the date of grant and that fair value is recognized<br />
in the financial statements. Proceeds arising from the exercise of<br />
share option awards are credited to share capital, as are the recognized<br />
grant-date fair values of the exercised share option awards.<br />
Share option awards which have a net-equity settlement feature, as<br />
set out in Note 13(b), and which do not also have a net-cash settlement<br />
feature, are accounted for as equity instruments. We have selected<br />
the equity instrument fair value method of accounting for the net-equity<br />
settlement feature as it is consistent with the accounting treatment<br />
afforded to the associated share option awards.<br />
Share option awards which had a net-cash settlement feature, as<br />
set out in Note 13(b), were accounted for as liability instruments. If share<br />
option awards which had the net-cash settlement feature and which<br />
were granted subsequent to 2001 were settled using other than the netcash<br />
settlement feature, they were accounted for as equity instruments.<br />
As at December 31, 2012, no share option awards with the net-cash<br />
settlement feature remained outstanding.<br />
In respect of restricted stock units, as set out in Note 13(c), we<br />
accrue a liability equal to the product of the vesting restricted stock units<br />
multiplied by the fair market value of the corresponding shares at the<br />
end of the <strong>report</strong>ing period (unless hedge accounting is applied, as set<br />
out in (d) preceding). The expense for restricted stock units that do not
ultimately vest is reversed against the expense that had been previously<br />
recorded in their respect.<br />
When share-based compensation vests in its entirety at one future<br />
point in time (cliff vesting), we recognize the expense on a straight-line<br />
basis over the vesting period. When share-based compensation vests in<br />
tranches (graded vesting), we recognize the expense using the accelerated<br />
expense attribution method. An estimate of forfeitures during the<br />
vesting period is made at the date of grant; this estimate is adjusted for<br />
actual experience.<br />
(n) Employee future benefit plans<br />
Defined benefit plans<br />
We accrue for our obligations under employee defined benefit plans,<br />
and the related costs, net of plan assets. The cost of pensions and other<br />
retirement benefits earned by employees is actuarially determined using<br />
the projected benefit method pro-rated on service and management’s<br />
best estimate of expected plan investment performance, salary escalation<br />
and retirement ages of employees. For the purpose of calculating the<br />
expected return on plan assets, those assets are valued at fair value.<br />
Actuarial gains (losses) arising subsequent to, or on, January 1, 2010,<br />
the date of our transition to IFRS-IASB, are recognized in other comprehensive<br />
income in the period in which they arise as we believe that this<br />
better reflects the long-term nature of employee future benefits. See<br />
Note 2(b) for significant amendments to the employee benefits accounting<br />
standard which are not yet effective and have not yet been applied.<br />
Unamortized actuarial gains (losses), past service costs and transitional<br />
assets (obligations) at January 1, 2010, were recognized directly<br />
in retained earnings at the transition date to, and as permitted by,<br />
IFRS-IASB.<br />
On an <strong>annual</strong> basis, at a minimum, the defined benefit plan key<br />
assumptions are assessed and revised as appropriate. When the defined<br />
benefit plan key assumptions fluctuate significantly relative to their<br />
immediately preceding year-end values, actuarial gains (losses) arising<br />
from such significant fluctuations are recognized on an interim basis.<br />
Defined contribution plans<br />
We use defined contribution accounting for the Telecommunication<br />
Workers Pension Plan and the British Columbia Public Service Pension<br />
Plan that cover certain of our employees, both of which provide defined<br />
benefits to their members. In the absence of any regulations governing<br />
the calculation of the share of the underlying financial position and<br />
plan performance attributable to each employer-participant, and in the<br />
absence of contractual agreements between the plans and the employerparticipants<br />
related to the financing of any shortfall (or distribution of any<br />
surplus), we treat these plans as defined contribution plans in accordance<br />
with International Accounting Standard 19, Employee Benefits.<br />
(o) Cash and temporary investments, net<br />
Cash and temporary investments, which may include investments<br />
in money market instruments that are purchased three months or less<br />
from maturity, are presented net of outstanding items including cheques<br />
written but not cleared by the bank as at the statement of financial<br />
position date. Cash and temporary investments, net, are classified as<br />
a liability on the statement of financial position when the amount of the<br />
cheques written but not cleared by the bank exceeds the amount of<br />
cash and temporary investments. When cash and temporary investments,<br />
net, are classified as a liability, they may also include overdraft amounts<br />
drawn on our bilateral bank facilities, which revolve daily and are<br />
discussed further in Note 18.<br />
FINANCIAL STATEMENTS & NOTES: 1<br />
(p) Sales of trade receivables<br />
Sales of trade receivables in securitization transactions are recognized<br />
as collateralized short-term borrowings and thus do not result in our<br />
derecognition of the trade receivables sold.<br />
(q) Inventories<br />
Our inventories consist primarily of wireless handsets, parts and<br />
accessories and communications equipment held for resale. Inventories<br />
are valued at the lower of cost and net realizable value, with cost being<br />
determined on an average cost basis. Previous write-downs to net<br />
realizable value are reversed if there is a subsequent increase in the<br />
value of the related inventories.<br />
(r) Property, plant and equipment; intangible assets<br />
General<br />
Property, plant and equipment and intangible assets are recorded at<br />
historical cost and, with respect to self-constructed property, plant and<br />
equipment, include materials, direct labour and applicable overhead costs.<br />
With respect to internally developed, internal-use software, recorded<br />
historical costs include materials, direct labour and direct labour-related<br />
costs. Where property, plant and equipment construction projects are<br />
of a sufficient size and duration, an amount is capitalized for the cost of<br />
funds used to finance construction. The rate for calculating the capitalized<br />
financing costs is based on our weighted-average cost of borrowing<br />
experienced during the <strong>report</strong>ing period.<br />
When we sell property, plant and/or equipment, the net book value<br />
is netted against the sale proceeds and the difference, as set out in<br />
Note 6, is included in the Consolidated Statements of Income and Other<br />
Comprehensive Income as Other operating income.<br />
Asset retirement obligations<br />
Provisions for liabilities, as set out in Note 19, are recognized for statutory,<br />
contractual or legal obligations, normally when incurred, associated<br />
with the retirement of property, plant and equipment (primarily certain<br />
items of outside plant and wireless site equipment) when those obligations<br />
result from the acquisition, construction, development and/or<br />
normal operation of the assets. The obligations are measured initially<br />
at fair value, determined using present value methodology, and the<br />
resulting costs are capitalized into the carrying amount of the related<br />
asset. In subsequent periods, the liability is adjusted for the accretion<br />
of discount, for any changes in the market-based discount rate and<br />
for any changes in the amount or timing of the underlying future cash<br />
flows. The capitalized asset retirement cost is depreciated on the same<br />
basis as the related asset and the discount accretion, as set out in<br />
Note 8, is included in the Consolidated Statements of Income and Other<br />
Comprehensive Income as a component of Financing costs.<br />
(s) Investments<br />
We account for our investments in companies over which we have<br />
significant influence using the equity method of accounting whereby the<br />
investments are initially recorded at cost and subsequently adjusted to<br />
recognize our share of earnings or losses of the investee companies and<br />
any earnings distributions received. The excess of the cost of an equity<br />
investment over its underlying book value at the date of acquisition,<br />
except for goodwill, is amortized over the estimated useful lives of the<br />
underlying assets to which it is attributed.<br />
Similarly, we account for our 50% interest in the real estate joint<br />
venture, discussed further in Note 17, using the equity method of<br />
accounting. Unrealized gains and losses from transactions (including<br />
<strong>TELUS</strong> 2012 ANNUAL REPORT . 121
contributions) with the real estate joint venture are deferred in proportion<br />
to our remaining interest in the real estate joint venture.<br />
We account for our other investments as available-for-sale at<br />
their fair values unless they are investment securities that do not have<br />
quoted market prices in an active market or do not have other clear<br />
and objective evidence of fair value. When we do not account for our<br />
available-for-sale investments at their fair values, we use the cost<br />
basis of accounting whereby the investments are initially recorded at<br />
cost and earnings from such investments are recognized only to the<br />
extent received or receivable. The cost of investments sold or amounts<br />
reclassified out of other com prehensive income into earnings are<br />
determined on a specific identification basis.<br />
2<br />
Accounting policy developments<br />
(a) Initial application of standards, interpretations<br />
and amendments to standards and interpretations<br />
in the <strong>report</strong>ing period<br />
In December 2010, the IASB issued amendments to IAS 12, Income<br />
Taxes, and in May 2012 issued Annual Improvements to IFRSs:<br />
2009-2011 Cycle, both of which, in our current instance, had no<br />
effect on our financial performance.<br />
(b) Standards, interpretations and amendments<br />
to standards not yet effective and not yet applied<br />
Unless otherwise indicated, the following standards are required to be<br />
applied for periods beginning on or after January 1, 2013. Unless otherwise<br />
indicated, based upon current facts and circumstances, we do<br />
not expect to be materially affected by the application of the following<br />
standards and are currently determining which date(s) we will select<br />
for initial compliance if earlier than the required compliance date(s).<br />
. IFRS 7, Financial Instruments: Disclosures (amended 2011).<br />
. IFRS 9, Financial Instruments, is required to be applied for periods<br />
beginning on or after January 1, 2015.<br />
. Other than for the disclosure requirements therein, the following<br />
standards and amended standards must be initially applied<br />
concurrently:<br />
. IFRS 10, Consolidated Financial Statements<br />
. IFRS 11, Joint Arrangements<br />
. IFRS 12, Disclosure of Interests in Other Entities<br />
. IAS 27, Separate Financial Statements (amended 2011)<br />
. IAS 28, Investments in Associates (amended 2011).<br />
. IFRS 13, Fair Value Measurement.<br />
122 . <strong>TELUS</strong> 2012 ANNUAL REPORT<br />
Unless there is an other than temporary decline in the value of an<br />
available-for-sale investment, the carrying values of available-for-sale<br />
investments are adjusted to estimated fair values, with such adjustment<br />
being included in the Consolidated Statements of Income and Other<br />
Comprehensive Income as a component of other comprehensive income.<br />
When there is an other than temporary decline in the value of an investment,<br />
the carrying value of any such investment accounted for using<br />
the equity, available-for-sale or cost method is reduced to estimated fair<br />
value with the amount of any such reduction being included in the<br />
Consolidated Statements of Income and Other Comprehensive Income<br />
as Other operating income.<br />
. IAS 32, Financial Instruments (amended 2011), is required to be<br />
applied for periods beginning on or after January 1, 2014.<br />
. IAS 19, Employee Benefits (amended 2011): Relative to our current<br />
accounting policies and presentation and disclosure practices,<br />
the key difference in the amended standard is that the expected<br />
long-term rate of return on plan assets will no longer be used for<br />
defined benefit plan expense measurement purposes. In the determination<br />
of net income in our instance, the effect is that the defined<br />
benefit plan expense concepts of “interest cost” and “return on<br />
plan assets” will be replaced with the concept of “net interest”.<br />
Net interest for each plan is the product of the plan’s surplus (deficit)<br />
multiplied by the discount rate. Unchanged is that the amended<br />
standard does not prescribe where in the results of operations the<br />
net interest amount is to be presented, but we expect that we will<br />
present such amount as a component of financing costs upon<br />
application of the amended standard.<br />
As set out in Note 14, our current view, consistent with long-term<br />
historical experience, is that the expected long-term rate of return on<br />
plan assets would exceed the discount rate (a result of targeting a<br />
significant percentage of the defined benefit plan assets for investment<br />
in equity securities); the relative effect of the amended standard is<br />
expected to be a decrease in net income and associated per share<br />
amounts. The variance, if any, between the actual rate of return<br />
on defined benefit plan assets and the discount rate, as well as the<br />
related impact of the limit on defined benefit assets, if any, would<br />
be included in other comprehensive income as a re-measurement.<br />
The amended standard is not expected to affect our statement<br />
of financial position or statement of cash flows.
FINANCIAL STATEMENTS & NOTES: 2–3<br />
The amended standard would have affected our Consolidated Statements of Income and Other Comprehensive Income as follows:<br />
Years ended December 31 (millions except per share amounts) 2012 2011<br />
As currently Amended As currently Amended<br />
<strong>report</strong>ed IAS 19 effects Adjusted <strong>report</strong>ed IAS 19 effects Adjusted<br />
Operating expenses<br />
Employee benefits expense $ß2,129 $ß 113 $ß2,242 $ß1,893 $ßß 113 $ß2,006<br />
Financing costs $ß 332 42 $ß 374 $ß 377 6 $ß 383<br />
Income taxes $ß 457 (41) $ß 416 $ß 376 (30) $ß 346<br />
Net income<br />
Other comprehensive income<br />
Item never subsequently reclassified to income<br />
(114) (89)<br />
Defined benefit plans re-measurements $ß (400) 114 $ß (286) $ß (851) 89 $ß (762)<br />
Comprehensive income $ßß – $ßß –<br />
Net income per Common Share and Non-Voting Share<br />
Basic $ß 4.05 $ß(0.36) $ß 3.69 $ß 3.76 $ß(0.28) $ß 3.48<br />
Diluted $ß 4.03 $ß(0.36) $ß 3.67 $ß 3.74 $ß(0.28) $ß 3.46<br />
We will initially apply the amended standard for periods beginning on or after January 1, 2013.<br />
3<br />
Capital structure financial policies<br />
Our objective when managing capital is to maintain a flexible capital struc-<br />
ture that optimizes the cost and availability of capital at acceptable risk.<br />
In the management and definition of capital, we include Common<br />
Share and Non-Voting Share equity (excluding accumulated other<br />
comprehensive income), long-term debt (including any associated<br />
hedging assets or liabilities, net of amounts recognized in accumulated<br />
other comprehensive income), cash and temporary investments and<br />
securitized trade receivables.<br />
We manage our capital structure and make adjustments to it in<br />
the light of changes in economic conditions and the risk characteristics<br />
of the underlying assets. In order to maintain or adjust our capital<br />
structure, we may adjust the amount of dividends paid to holders of<br />
<strong>TELUS</strong> Corporation shares, purchase shares for cancellation pursuant<br />
to normal course issuer bids, issue new shares, issue new debt,<br />
issue new debt to replace existing debt with different characteristics<br />
and/or increase or decrease the amount of trade receivables sold<br />
to an arm’s-length securitization trust.<br />
We monitor capital utilizing a number of measures, including: net<br />
debt to earnings before interest, taxes, depreciation and amortization –<br />
excluding restructuring costs (EBITDA – excluding restructuring costs);<br />
and dividend payout ratios.<br />
Net debt to EBITDA – excluding restructuring costs is calculated<br />
as net debt at the end of the period divided by twelve-month trailing<br />
EBITDA – excluding restructuring costs. This measure, historically,<br />
is substantially the same as the leverage ratio covenant in our credit<br />
facilities. Net debt and EBITDA – excluding restructuring costs are<br />
measures that do not have any standardized meanings prescribed<br />
by IFRS-IASB and are therefore unlikely to be comparable to similar<br />
measures presented by other companies; the calculation of these<br />
measures is as set out in the following schedule. Net debt is one component<br />
of a ratio used to determine compliance with debt covenants.<br />
The <strong>report</strong>ed dividend payout ratio is calculated as the quarterly<br />
dividend declared per Common Share and Non-Voting Share, as<br />
recorded in the financial statements, multiplied by four and divided by<br />
the sum of basic earnings per share for the most recent four quarters<br />
for interim <strong>report</strong>ing periods (divided by <strong>annual</strong> basic earnings per<br />
share if <strong>report</strong>ed amount is in respect of a fiscal year); the <strong>report</strong>ed<br />
dividend payout ratio of adjusted net earnings differs in that it excludes:<br />
income tax-related adjustments; and the ongoing impacts of share<br />
options with the net-cash settlement feature.<br />
<strong>TELUS</strong> 2012 ANNUAL REPORT . 123
During 2012, our strategy, which was unchanged from 2011, included<br />
maintaining the financial policy set out in the table below. We believe<br />
that our financial policies and guidelines, which are reviewed <strong>annual</strong>ly,<br />
124 . <strong>TELUS</strong> 2012 ANNUAL REPORT<br />
are currently at the optimal level and, by maintaining credit ratings in<br />
the range of BBB+ to A–, or the equivalent, provide reasonable access<br />
to capital.<br />
As at, or years ended, December 31 ($ in millions) Policy 2012 2011<br />
Components of debt and coverage ratios<br />
Net debt (1) $ß6,577 $ß6,959<br />
EBITDA – excluding restructuring costs (2) $ß4,020 $ß3,813<br />
Net interest cost (3) $ß 332 $ß 377<br />
Debt ratio<br />
Net debt to EBITDA – excluding restructuring costs 1.5 – 2.0 1.6 1.8<br />
Coverage ratios<br />
Earnings coverage (4) 6.0 5.1<br />
EBITDA – excluding restructuring costs interest coverage (5) 12.1 10.1<br />
Other measures<br />
Dividend payout ratio of adjusted net earnings (6) 64% 64%<br />
Dividend payout ratio 63% 62%<br />
(1) Net debt is calculated as follows:<br />
2012 2011<br />
Long-term debt (Note 20) $ß6,256 $ß6,574<br />
Debt issuance costs netted against long-term debt 26 27<br />
Cash and temporary investments, net (107) (46)<br />
Short-term borrowings 402 404<br />
Net debt $ß6,577 $ß6,959<br />
(2) EBITDA – excluding restructuring costs is calculated as follows:<br />
2012 2011<br />
EBITDA (Note 5) $ß3,972 $ß3,778<br />
Restructuring costs (Note19(b)) 48 35<br />
EBITDA – excluding restructuring costs $ß4,020 $ß3,813<br />
(3) Net interest cost is defined as financing costs before gains on redemption and<br />
repayment of debt, calculated on a twelve-month trailing basis (losses recorded<br />
on the redemption of long-term debt, if any, are included in net interest cost).<br />
(4) Earnings coverage is defined as net income attributable to Common Shares and<br />
Non-Voting Shares before gross interest expense and income tax expense, divided<br />
by gross interest expense.<br />
The net debt to EBITDA – excluding restructuring costs ratio<br />
was 1.6 times at December 31, 2012, down 0.2 times from one year<br />
earlier due to the reduction in net debt and increase in EBITDA –<br />
excluding restructuring costs. The earnings coverage ratio for the year<br />
ended December 31, 2012, was 6.0 times, up from 5.1 times a year<br />
earlier; lower gross interest expenses increased the ratio by 0.5,<br />
(5) EBITDA – excluding restructuring costs interest coverage is defined as EBITDA –<br />
excluding restructuring costs divided by net interest cost. This measure is substantially<br />
the same as the coverage ratio covenant in our credit facilities.<br />
(6) Adjusted net earnings attributable to Common Shares and Non-Voting Shares<br />
is calculated as follows:<br />
2012 2011<br />
Net income attributable to Common Shares<br />
and Non-Voting Shares $ß1,318 $ß1,219<br />
Income tax-related adjustments<br />
After tax gain net of equity losses related to<br />
the residential condominium tower component<br />
(12) (21)<br />
of the <strong>TELUS</strong> Garden real estate joint venture<br />
Impacts of share options with the net-cash<br />
(6) –<br />
settlement feature, net of income taxes<br />
Gain on 51% Transactel (Barbados) Inc. interest<br />
re-measured at acquisition-date fair value<br />
and subsequent adjustment to contingent<br />
(2) (14)<br />
consideration, net of income taxes<br />
Adjusted net earnings attributable to<br />
– (12)<br />
Common Shares and Non-Voting Shares $ß1,298 $ß1,172<br />
while increased income before gross interest expense and income<br />
taxes increased the ratio by 0.4. The EBITDA – excluding restructuring<br />
costs interest coverage ratio for the year ended December 31, 2012,<br />
was 12.1 times, up from 10.1 times one year earlier; lower net interest<br />
expenses increased the ratio by 0.6, while higher EBITDA – excluding<br />
restructuring costs increased the ratio by 1.4.
4<br />
(a) Risks – overview<br />
Financial instruments<br />
Our financial instruments and the nature of certain risks which they may be subject to are as set out in the following table.<br />
FINANCIAL STATEMENTS & NOTES: 4<br />
Risks<br />
Financial instrument Credit Liquidity Currency<br />
Market risks<br />
Interest rate Other price<br />
Measured at amortized cost<br />
Accounts receivable X X<br />
Construction credit facilities advances to real estate joint venture X<br />
Short-term obligations X X X<br />
Accounts payable X X<br />
Provisions (including restructuring accounts payable) X X X<br />
Long-term debt<br />
Measured at fair value<br />
X X X<br />
Cash and temporary investments X X X<br />
Short-term investments X X<br />
Long-term investments (not subject to significant influence) (1) X X<br />
Foreign exchange derivatives (2) X X X<br />
Share-based compensation derivatives (2) X X X<br />
Cross currency interest rate swap derivatives (2)(3) X X X X<br />
(1) Long-term investments over which we do not have significant influence are measured at fair value if the fair values can be reliably measured.<br />
(2) Use of derivative financial instruments is subject to a policy which requires that no derivative transaction is to be entered into for the purpose of establishing a speculative or leveraged<br />
position (the corollary being that all derivative transactions are to be entered into for risk management purposes only) and sets criteria for the creditworthiness of the transaction<br />
counterparties.<br />
(3) The cross currency interest rate swap derivatives matured in fiscal 2011, as discussed further in Note 20(b).<br />
(b) Credit risk<br />
Excluding credit risk, if any, arising from currency swaps settled on a<br />
gross basis (see (c)), the best representation of our maximum exposure<br />
(excluding income tax effects) to credit risk, which is a worst-case<br />
scenario and does not reflect results we expect, is as set out in the<br />
following table:<br />
As at December 31 (millions) 2012 2011<br />
Cash and temporary investments, net $ß 107 $ß 46<br />
Accounts receivable 1,541 1,428<br />
Derivative assets 12 17<br />
$ß1,660 $ß1,491<br />
Cash and temporary investments<br />
Credit risk associated with cash and temporary investments is managed<br />
by ensuring that these financial assets are placed with: governments;<br />
major financial institutions that have been accorded strong investment<br />
grade ratings by a primary rating agency; and/or other creditworthy<br />
counterparties. An ongoing review is performed to evaluate changes<br />
in the status of counterparties.<br />
Accounts receivable<br />
Credit risk associated with accounts receivable is inherently managed<br />
by our large and diverse customer base, which covers substantially all<br />
consumer and business sectors in Canada. We follow a program of<br />
credit evaluations of customers and limit the amount of credit extended<br />
when deemed necessary.<br />
The following table presents an analysis of the age of customer<br />
accounts receivable for which an allowance has not been made<br />
as at the dates of the Consolidated Statements of Financial Position.<br />
As at December 31, 2012, the weighted average life of customer<br />
accounts receivable was 29 days (2011 – 29 days) and the weighted<br />
average life of past-due customer accounts receivable was 63 days<br />
(2011 – 61 days). No interest is charged on customer accounts that are<br />
current. Thereafter, interest is charged at an industry-based market<br />
rate on outstanding balances.<br />
As at December 31 (millions) 2012 2011<br />
Customer accounts receivable<br />
net of allowance for doubtful accounts<br />
Less than 30 days past billing date $ß 860 $ß 796<br />
30–60 days past billing date 218 224<br />
61–90 days past billing date 67 65<br />
Greater than 90 days past billing date 72 57<br />
$ß1,217 $ß1,142<br />
Customer accounts receivable (Note 24(a)) $ß1,261 $ß1,178<br />
Allowance for doubtful accounts (44) (36)<br />
$ß1,217 $ß1,142<br />
We maintain allowances for potential credit losses related to doubtful<br />
accounts. Current economic conditions, historical information, reasons<br />
for the accounts being past-due and line of business from which the<br />
customer accounts receivable arose are all considered when determining<br />
whether allowances should be made for past-due accounts; the same<br />
factors are considered when determining whether to write off amounts<br />
charged to the allowance account against the customer accounts<br />
receivable. The doubtful accounts expense is calculated on a specificidentification<br />
basis for customer accounts receivable over a specific<br />
balance threshold and on a statistically derived allowance basis for the<br />
remainder. No customer accounts receivable are written off directly to<br />
the doubtful accounts expense.<br />
<strong>TELUS</strong> 2012 ANNUAL REPORT . 125
The following table presents a summary of the activity related to our<br />
allowance for doubtful accounts.<br />
Years ended December 31 (millions) 2012 2011<br />
Balance, beginning of period $ß36 $ß41<br />
Additions (doubtful accounts expense) 40 43<br />
Net use (32) (48)<br />
Balance, end of period $ß44 $ß36<br />
Derivative assets (and derivative liabilities)<br />
Counterparties to our share-based compensation cash-settled equity<br />
forward agreements and foreign exchange derivatives are major financial<br />
institutions that have all been accorded investment grade ratings by<br />
a primary rating agency. The dollar amount of credit exposure under<br />
contracts with any one financial institution is limited and counterparties’<br />
credit ratings are monitored. We do not give or receive collateral on swap<br />
agreements and hedging items due to our credit rating and those of our<br />
counterparties. While we are exposed to potential credit losses due to<br />
the possible non-performance of our counterparties, we consider the<br />
risk of this remote. Our derivative liabilities do not have credit risk-related<br />
contingent features.<br />
126 . <strong>TELUS</strong> 2012 ANNUAL REPORT<br />
(c) Liquidity risk<br />
As a component of our capital structure financial policies, discussed<br />
further in Note 3, we manage liquidity risk by:<br />
. maintaining a daily cash pooling process that enables us to manage<br />
our liquidity surplus and liquidity requirements according to our<br />
actual needs and those of our subsidiaries;<br />
. maintaining bilateral bank facilities (Note 18) and a syndicated credit<br />
facility (Note 20(d));<br />
. the sales of trade receivables to an arm’s-length securitization trust<br />
(Note 18);<br />
. maintaining a commercial paper program (Note 20(b));<br />
. continuously monitoring forecast and actual cash flows; and<br />
. managing maturity profiles of financial assets and financial liabilities.<br />
As disclosed in Note 20(f), we have significant debt maturities<br />
in future years. As at December 31, 2012, we have access to a shelf<br />
prospectus, in effect until November 2013, pursuant to which we can<br />
offer $2.0 billion (2011 – $2.5 billion) of debt or equity securities. We<br />
believe that our investment grade credit ratings contribute to reasonable<br />
access to capital markets.<br />
We closely match the derivative financial liability contractual maturities<br />
with those of the risk exposures they are being used to manage.<br />
Our undiscounted financial liability expected maturities do not differ significantly from the contractual maturities, other than as noted below.<br />
Our undiscounted financial liability contractual maturities, including interest thereon (where applicable), are as set out in the following tables:<br />
Non-derivative Derivative<br />
Non-interest<br />
bearing<br />
financial Short-term Long-term debt<br />
Construction<br />
credit facilities<br />
commitment<br />
Currency swap agreement<br />
amounts to be exchanged<br />
As at December 31, 2012 (millions) liabilities borrowings (1) (Note 20) (Note 17(c)) (2) (Receive) Pay Total<br />
2013<br />
First quarter $ß 881 $ß 3 $ß 297 $ß182 $ß (51) $ß 51 $ß 1,363<br />
Balance of year 526 5 558 – (90) 88 1,087<br />
2014 5 405 997 – – – 1,407<br />
2015 47 – 889 – – – 936<br />
2016 2 – 824 – – – 826<br />
2017 2 – 895 – – – 897<br />
Thereafter 5 – 3,783 – – – 3,788<br />
Total $ß1,468 $ß413 $ß8,243 $ß182 $ß(141) $ß139 $ß10,304<br />
(1) Interest payment cash outflows in respect of short-term borrowings, commercial paper and amounts drawn under our credit facilities (if any) have been calculated based upon<br />
the interest rates in effect as at December 31, 2012.<br />
(2) The draw-downs on the construction credit facilities are expected to occur as construction progresses through 2015.<br />
Non-derivative Derivative<br />
Non-interest<br />
bearing<br />
financial Short-term Long-term debt<br />
Currency swap agreement<br />
amounts to be exchanged<br />
As at December 31, 2011 (millions) liabilities borrowings (1) (Note 20) (Receive) Pay Total<br />
2012<br />
First quarter $ß 804 $ß 6 $ß1,111 $ß (77) $ß 75 $ß 1,919<br />
Balance of year 513 5 276 (91) 89 792<br />
2013 18 7 605 – – 630<br />
2014 – 405 980 – – 1,385<br />
2015 10 – 873 – – 883<br />
2016 – – 807 – – 807<br />
Thereafter – – 4,070 – – 4,070<br />
Total $ß1,345 $ß423 $ß8,722 $ß(168) $ß164 $ß10,486<br />
(1) Interest payment cash outflows in respect of short-term borrowings, commercial paper and amounts drawn under our credit facilities (if any) have been calculated based upon<br />
the interest rates in effect as at December 31, 2011.
(d) Currency risk<br />
Our functional currency is the Canadian dollar, but certain routine<br />
revenues and operating costs are denominated in U.S. dollars and<br />
some inventory purchases and capital asset acquisitions are sourced<br />
internationally. The U.S. dollar is the only foreign currency to which<br />
we have a significant exposure.<br />
Our foreign exchange risk management includes the use of foreign<br />
currency forward contracts and currency options to fix the exchange rates<br />
on short-term U.S. dollar denominated transactions and commitments.<br />
Hedge accounting is applied to these short-term foreign currency<br />
forward contracts and currency options only on a limited basis.<br />
Net income and other comprehensive income for the years ended<br />
December 31, 2012 and 2011, could have varied if Canadian dollar:<br />
U.S. dollar exchange rates varied from the actual transaction date rates.<br />
The following Canadian dollar: U.S. dollar exchange rate sensitivity<br />
analysis has been based upon a hypothetical change having occurred<br />
throughout the <strong>report</strong>ing period (other than no change is reflected as<br />
at the statement of financial position date – see (g), which isolates the<br />
statement of financial position date hypothetical effects) and having<br />
been applied to all relevant Consolidated Statement of Income and Other<br />
Comprehensive Income transactions. Income tax expense, which is<br />
reflected net in the sensitivity analysis, reflects the applicable weighted<br />
average statutory income tax rates for the <strong>report</strong>ing periods.<br />
Net income and<br />
comprehensive Capital<br />
Years ended December 31<br />
income expenditures<br />
($ increase (decrease) in millions) 2012 2011 2012 2011<br />
10% change in Cdn.$: U.S.$<br />
exchange rate (1)<br />
Canadian dollar appreciates $ßß23 $ßß27 $ß(20) $ß(23)<br />
Canadian dollar depreciates $ß(23) $ß(27) $ßß20 $ßß23<br />
(1) These sensitivities are hypothetical and should be used with caution. Changes in net<br />
income and comprehensive income generally cannot be extrapolated because the<br />
relationship of the change in assumption to the change in net income and comprehensive<br />
income may not be linear. In this table, the effect of a variation in the Canadian<br />
dollar: U.S. dollar exchange rate on the amount of net income and comprehensive<br />
income is calculated without changing any other analysis inputs; in reality, changes in<br />
the Canadian dollar: U.S. dollar exchange rate may result in changes in another factor<br />
(for example, increased strength of the Canadian dollar may result in more favourable<br />
market interest rates), which might magnify or counteract the sensitivities.<br />
The sensitivity analysis assumes that we would realize the changes in exchange<br />
rates; in reality, the competitive marketplace in which we operate would have an effect<br />
on this assumption. The sensitivity analysis is prepared based on the simple average<br />
of the Canadian dollar: U.S. dollar exchange rate for the period.<br />
In respect of U.S. dollar denominated inventory purchases, the current period’s<br />
purchases have been included in the sensitivity analysis by assuming that all items<br />
are sold in the period purchased. Similarly, this sensitivity analysis is based on the<br />
assumption that all U.S. dollar denominated accounts receivable and accounts payable<br />
arising in the period are collected and paid, respectively, in the period.<br />
In respect of U.S. dollar denominated capital expenditures, the current period’s<br />
expenditures have been included in the sensitivity analysis by assuming one-half<br />
period’s straight-line depreciation and amortization in the year of acquisition and<br />
an estimated useful life of 10 years; no consideration has been made for U.S. dollar<br />
denominated capital expenditures made in prior periods.<br />
(e) Interest rate risk<br />
Changes in market interest rates will cause fluctuations in the fair value<br />
or future cash flows of temporary investments, short-term investments,<br />
construction credit facility advances made to the real estate joint venture,<br />
short-term obligations, long-term debt and interest rate swap derivatives.<br />
When we have temporary investments, they have short maturities<br />
and fixed rates, thus their fair value will fluctuate with changes in market<br />
interest rates; absent monetization prior to maturity, the related future cash<br />
flows will not change due to changes in market interest rates.<br />
FINANCIAL STATEMENTS & NOTES: 4<br />
If the balance of short-term investments includes debt instruments<br />
and/or dividend-paying equity instruments, we could be exposed to<br />
interest rate risks.<br />
Due to the short-term nature of the applicable rates of interest<br />
charged, the fair value of the construction credit facilities advances made<br />
to the real estate joint venture are not materially affected by changes in<br />
market interest rates; associated cash flows representing interest payments<br />
will be affected until such advances are repaid.<br />
As short-term obligations arising from bilateral bank facilities, which<br />
typically have variable interest rates, are rarely outstanding for periods<br />
that exceed one calendar week, interest rate risk associated with this<br />
item is not material.<br />
Short-term borrowings arising from the sales of trade receivables to<br />
an arm’s-length securitization trust are fixed-rate debt. Due to the short<br />
maturities of these borrowings, interest rate risk associated with this item<br />
is not material.<br />
In respect of our currently outstanding long-term debt, other than for<br />
commercial paper and amounts drawn on our credit facilities (Note 20(d)),<br />
it is all fixed-rate debt. The fair value of fixed-rate debt fluctuates with<br />
changes in market interest rates; absent early redemption, the related<br />
future cash flows will not change. Due to the short maturities of commercial<br />
paper, its fair value is not materially affected by changes in market<br />
interest rates but its cash flows representing interest payments may be if<br />
the commercial paper is rolled over.<br />
Amounts drawn on our short-term and long-term credit facilities will<br />
be affected by changes in market interest rates in a manner similar to<br />
commercial paper.<br />
Similar to fixed-rate debt, the fair value of our interest rate swap<br />
derivatives fluctuated with changes in market interest rates as the<br />
interest rate swapped to was fixed; absent early redemption, the related<br />
future cash flows would not have changed due to changes in market<br />
interest rates.<br />
(f) Other price risk<br />
Provisions<br />
We are exposed to other price risk arising from written put options<br />
provided for non-controlling interests, as discussed further in Note 16(e).<br />
Short-term investments<br />
If the balance of the short-term investments line item on the statement<br />
of financial position includes equity instruments, we would be exposed<br />
to equity price risks.<br />
Long-term investments<br />
We are exposed to equity price risks arising from investments classified<br />
as available-for-sale. Such investments are held for strategic rather than<br />
trading purposes.<br />
Share-based compensation derivatives<br />
We are exposed to other price risk arising from cash-settled share-based<br />
compensation (appreciating Non-Voting Share prices increase both the<br />
expense and the potential cash outflow). Certain cash-settled equity<br />
swap agreements had been entered into that established a cap on our<br />
cost associated with our net-cash settled share options (Note 13(b))<br />
and others have been entered into that fix the cost associated with our<br />
restricted stock units (Note 13(c)).<br />
<strong>TELUS</strong> 2012 ANNUAL REPORT . 127
(g) Market risk<br />
Net income and other comprehensive income for the years ended<br />
December 31, 2012 and 2011, could have varied if the Canadian dollar:<br />
U.S. dollar exchange rates, market interest rates and our Non-Voting<br />
Share prices varied by reasonably possible amounts from their actual<br />
statement of financial position date values.<br />
The sensitivity analysis of our exposure to currency risk at<br />
the <strong>report</strong>ing date has been determined based upon a hypothetical<br />
change taking place at the relevant statement of financial position<br />
date (as contrasted with applying the hypothetical change to all relevant<br />
transactions during the <strong>report</strong>ed periods – see (d)). The U.S. dollar<br />
denominated balances and derivative financial instrument notional<br />
amounts as at the statement of financial position dates have been<br />
used in the calculations.<br />
128 . <strong>TELUS</strong> 2012 ANNUAL REPORT<br />
The sensitivity analysis of our exposure to interest rate risk at the<br />
<strong>report</strong>ing date has been determined based upon a hypothetical change<br />
taking place at the beginning of the relevant fiscal year and being held<br />
constant through to the statement of financial position date. The relevant<br />
statement of financial position date principal amounts and notional<br />
amounts have been used in the calculations.<br />
The sensitivity analysis of our exposure to other price risk arising from<br />
share-based compensation at the <strong>report</strong>ing date has been determined<br />
based upon a hypothetical change taking place at the relevant statement<br />
of financial position date. The relevant statement of financial position<br />
date notional number of shares, which includes those in the cash-settled<br />
equity swap agreements, has been used in the calculations.<br />
Income tax expense, which is reflected net in the sensitivity analysis,<br />
reflects the applicable weighted average statutory income tax rates for<br />
the <strong>report</strong>ing periods.<br />
Years ended December 31<br />
Net income Other comprehensive income Comprehensive income<br />
($ increase (decrease) in millions) 2012 2011 2012 2011 2012 2011<br />
Reasonably possible changes in market risks (1)<br />
10% change in Cdn.$: U.S.$ exchange rate<br />
Canadian dollar appreciates $ß(6) $ß(6) $ß(4) $ß(7) $ß(10) $ß(13)<br />
Canadian dollar depreciates<br />
25 basis point change in market interest rate<br />
$ßß6 $ßß6 $ßß4 $ßß7 $ßß10 $ßß13<br />
Rate increases $ß(1) $ß(2) $ß – $ – $ß (1) $ß (2)<br />
Rate decreases $ßß1 $ßß2 $ß – $ – $ß ß1 $ß ß2<br />
25% (2) change in Non-Voting Share prices (3)<br />
Price increases $ß(3) $ß(2) $ßß7 $ßß5 $ß ß4 $ß ß3<br />
Price decreases $ßß3 $ßß2 $ß(7) $ß(5) $ß (4) $ß (3)<br />
(1) These sensitivities are hypothetical and should be used with caution. Changes in net income and/or other comprehensive income generally cannot be extrapolated because the<br />
relationship of the change in assumption to the change in net income and/or other comprehensive income may not be linear. In this table, the effect of a variation in a particular<br />
assumption on the amount of net income and/or other comprehensive income is calculated without changing any other assumption; in reality, changes in one factor may result in<br />
changes in another (for example, increases in market interest rates may result in more favourable foreign exchange rates (increased strength of the Canadian dollar)), which might<br />
magnify or counteract the sensitivities.<br />
The sensitivity analysis assumes that we would realize the changes in exchange rates and market interest rates; in reality, the competitive marketplace in which we operate<br />
would have an effect on this assumption.<br />
No consideration has been made for a difference in the notional number of shares associated with share-based compensation awards made during the <strong>report</strong>ing period that<br />
may have arisen due to a difference in the Non-Voting Share price.<br />
(2) To facilitate ongoing comparison of sensitivities, a constant variance of approximate magnitude has been used. Reflecting a 4.75-year data period and calculated on a monthly<br />
basis, which is consistent with the current assumptions and methodology set out in Note 13(b), the volatility of our Non-Voting Share price as at December 31, 2012, was 20.4%<br />
(2011 – 4.25-year data period, 24.1%); reflecting the twelve-month data period ended December 31, 2012, the volatility was 8.5% (2011 – 13.5%).<br />
(3) The hypothetical effects of changes in the prices of our Non-Voting Shares are restricted to those which would arise from our share-based compensation items that are accounted<br />
for as liability instruments and the associated cash-settled equity swap agreements.<br />
(h) Fair values<br />
General<br />
The carrying values of cash and temporary investments, accounts<br />
receivable, short-term obligations, short-term borrowings, accounts<br />
payable and certain provisions (including restructuring accounts<br />
payable) approximate their fair values due to the immediate or shortterm<br />
maturity of these financial instruments. The carrying values of<br />
our investments accounted for using the cost method do not exceed<br />
their fair values.<br />
The carrying value of short-term investments, if any, equals<br />
their fair value as they are classified as held for trading. The fair<br />
value is determined directly by reference to quoted market prices<br />
in active markets.<br />
The fair value of our long-term debt is based on quoted market<br />
prices in active markets.<br />
The fair values of the derivative financial instruments we use to<br />
manage exposure to currency risks are estimated based on quoted<br />
market prices in active markets for the same or similar financial instruments<br />
or on the current rates offered to us for financial instruments<br />
of the same maturity, as well as the use of discounted future cash flows<br />
using current rates for similar financial instruments subject to similar<br />
risks and maturities (such fair values being largely based on Canadian<br />
dollar: U.S. dollar forward exchange rates as at the statement of<br />
financial position dates).<br />
The fair values of the derivative financial instruments we use<br />
to manage our exposure to increases in compensation costs arising<br />
from certain forms of share-based compensation are based upon<br />
fair value estimates of the related cash-settled equity forward agreements<br />
provided by the counterparty to the transactions (such fair<br />
value estimates being largely based upon our Non-Voting Share prices<br />
as at the statement of financial position dates (see Note 21)).
FINANCIAL STATEMENTS & NOTES: 4<br />
The financial instruments that we measure at fair value on a recurring basis in periods subsequent to initial recognition and the level within the fair<br />
value hierarchy used to measure them are as set out in the following table.<br />
Fair value measurements at <strong>report</strong>ing date using<br />
Quoted prices in active Significant other Significant<br />
markets for identical items observable inputs unobservable inputs<br />
Carrying value (Level 1) (Level 2) (Level 3)<br />
As at December 31 (millions) 2012 2011 2012 2011 2012 2011 2012 2011<br />
Assets<br />
Foreign exchange derivatives $ß 2 $ß 4 $ – $ß– $ß 2 $ß 4 $ß– $ß–<br />
Share-based compensation derivatives 10 13 – – 10 13 – –<br />
Available-for-sale portfolio investments (1) 45 – 29 – 16 – – –<br />
$ß57 $ß17 $ß29 $ß– $ß28 $ß17 $ß– $ß–<br />
(1) During the year ended December 31, 2012, fair value information became available for, and fair value accounting was thus applied to, a portion of our portfolio investments that are<br />
classified as available-for-sale and which were previously accounted for on the cost basis (see Note 1(s) and Note 10).<br />
Derivative<br />
The derivative financial instruments that we measure at fair value on a recurring basis subsequent to initial recognition are as set out in the following table.<br />
As at December 31 (millions) 2012 2011<br />
Maximum Notional Carrying Fair Notional Carrying Fair<br />
Designation maturity date amount amount value amount amount value<br />
Current Assets<br />
Derivatives used to manage<br />
Currency risks arising from<br />
U.S. dollar revenues HFT (1) 2012 $ – $ – $ – $ß26 $ – $ –<br />
Currency risks arising from<br />
U.S. dollar denominated purchases HFT (1) 2013 $ß59 1 1 $ß50 1 1<br />
Currency risks arising from<br />
U.S. dollar denominated purchases HFH (2) 2013 $ß59 1 1 $ß89 3 3<br />
Changes in share-based<br />
compensation costs (Note 13(c)) HFH (2) 2013 $ß24 7 7 $ß20 10 10<br />
$ß9 $ß9 $ß14 $ß14<br />
Other Long-Term Assets<br />
Derivatives used to manage<br />
Changes in share-based<br />
compensation costs (Note 13(c)) HFH (2) Deduct: Net amounts due to<br />
2015 $ß31 $ß3 $ß3 $ß22 $ß 3 $ß 2<br />
derivative counterparties – – (1)<br />
$ß3 $ß3 $ß 2 $ß 2<br />
Current Liabilities<br />
Derivatives used to manage<br />
Currency risks arising from<br />
U.S. dollar revenues HFT (1) 2013 $ß20 $ – $ – $ß – $ – $ –<br />
Changes in share-based<br />
compensation costs (Note 13(b)) HFT (1) 2012 $ – – – $ß 4 – –<br />
(1) Designated as held for trading (HFT) upon initial recognition; hedge accounting is not applied.<br />
(2) Designated as held for hedging (HFH) upon initial recognition (cash flow hedging item); hedge accounting is applied.<br />
Non-derivative<br />
Our long-term debt, which is measured at amortized cost, and the fair<br />
value thereof, are as set out in the following table.<br />
As at December 31 (millions) 2012 2011<br />
Carrying Fair Carrying Fair<br />
amount value amount value<br />
Long-term debt $ß6,256 $ß7,109 $ß6,574 $ß7,359<br />
$ – $ – $ – $ –<br />
<strong>TELUS</strong> 2012 ANNUAL REPORT . 129
(i) Recognition of derivative gains and losses<br />
The following table sets out the gains and losses, excluding income tax effects, on derivative instruments classified as cash flow hedging items and their<br />
location within the Consolidated Statements of Income and Other Comprehensive Income; there was no ineffective portion of derivative instruments<br />
classified as cash flow hedging items for the periods presented.<br />
Amount of gain (loss) recognized<br />
in other comprehensive income<br />
Gain (loss) reclassified from other comprehensive<br />
income into income (effective portion) (Note 10)<br />
(effective portion) (Note 10) Amount<br />
Years ended December 31 (millions) 2012 2011 Location 2012 2011<br />
Derivatives used to manage currency risks<br />
– Associated with U.S. dollar denominated debt $ – $ß(6) Financing costs $ß – $ß(8)<br />
– Arising from U.S. dollar denominated purchases<br />
Derivatives used to manage changes in share-based<br />
– 8 Goods and services purchased 2 3<br />
compensation costs (Note 13(c))<br />
Derivatives used to manage interest rate risk<br />
13 13 Employee benefits expense 14 12<br />
associated with debt issuance (3) – Financing costs – –<br />
$ß10 $ß15 $ß16 $ßß7<br />
The following table sets out the gains and losses arising from derivative instruments that are classified as held for trading and that are not designated<br />
as being in a hedging relationship, and their location within the Consolidated Statements of Income and Other Comprehensive Income.<br />
Years ended December 31 (millions) Location<br />
Gain (loss) recognized in income on derivatives<br />
2012 2011<br />
Derivatives used to manage currency risks Financing costs $ß2 $ß 7<br />
Derivatives used to manage changes in share-based compensation costs (Note 13(b)) Employee benefits expense 1 6<br />
$ß3 $ß13<br />
130 . <strong>TELUS</strong> 2012 ANNUAL REPORT
5<br />
General<br />
Segmented information<br />
Our operating segments regularly <strong>report</strong>ed to our Chief Executive<br />
Officer (our chief operating decision-maker) are Wireless and Wireline.<br />
Operating segments are components of an entity that engage in<br />
business activities from which they earn revenues and incur expenses<br />
(including revenues and expenses related to transactions with the<br />
other component(s)) and whose operating results are regularly reviewed<br />
by a chief operating decision-maker to make resource allocation<br />
decisions and to assess performance.<br />
The following segmented information is regularly <strong>report</strong>ed to our chief operating decision-maker.<br />
FINANCIAL STATEMENTS & NOTES: 5<br />
As we do not currently aggregate operating segments, our<br />
<strong>report</strong>able segments are also Wireless and Wireline. The Wireless<br />
segment includes voice, data and equipment sales. The Wireline<br />
segment includes data (which includes: television; Internet, enhanced<br />
data and hosting services; and managed and legacy data services),<br />
voice local, voice long distance, and other telecommunications services<br />
excluding wireless. Segmentation is based on similarities in technology,<br />
the technical expertise required to deliver the services and products,<br />
customer characteristics, the distribution channels used and regulatory<br />
treatment. Intersegment sales are recorded at the exchange value,<br />
which is the amount agreed to by the parties.<br />
Wireless Wireline Eliminations Consolidated<br />
Years ended December 31 (millions) 2012 2011 2012 2011 2012 2011 2012 2011<br />
Operating revenues<br />
External revenue $ß5,845 $ß5,462 $ß5,076 $ß4,935 $ß – $ß – $ß10,921 $ß10,397<br />
Intersegment revenue 41 38 170 164 (211) (202) – –<br />
$ß5,886 $ß5,500 $ß5,246 $ß5,099 $ß(211) $ß(202) $ß10,921 $ß10,397<br />
EBITDA (1) CAPEX, excluding<br />
$ß2,467 $ß2,186 $ß1,505 $ß1,592 $ß – $ß – $ß 3,972 $ß 3,778<br />
spectrum licences (2) EBITDA less CAPEX,<br />
excluding spectrum<br />
$ß 711 $ß 508 $ß1,270 $ß1,339 $ß – $ß – $ß 1,981 $ß 1,847<br />
licences $ß1,756 $ß1,678 $ß 235 $ß 253 $ß – $ß – $ß 1,991 $ß 1,931<br />
Operating revenues (above) $ß10,921 $ß10,397<br />
Goods and services purchased 4,820 4,726<br />
Employee benefits expense 2,129 1,893<br />
EBITDA (above) 3,972 3,778<br />
Depreciation 1,422 1,331<br />
Amortization 443 479<br />
Operating income 2,107 1,968<br />
Financing costs 332 377<br />
Income before income taxes $ß 1,775 $ß 1,591<br />
(1) Earnings before interest, taxes, depreciation and amortization (EBITDA) does not have any standardized meaning prescribed by IFRS-IASB and is therefore unlikely to be comparable<br />
to similar measures presented by other issuers; we define EBITDA as operating revenues less goods and services purchased and employee benefits expense. We have issued<br />
guidance on, and <strong>report</strong>, EBITDA because it is a key measure that management uses to evaluate the performance of our business and is also utilized in measuring compliance<br />
with certain debt covenants.<br />
(2) Total capital expenditures (CAPEX); see Note 24(b) for reconciliation of capital expenditures excluding spectrum licences to cash payments for capital assets, excluding spectrum<br />
licences <strong>report</strong>ed on the Consolidated Statement of Cash Flows.<br />
Geographical information<br />
We attribute revenues from external customers to individual countries on<br />
the basis of the location of the permanent establishment providing the<br />
goods and/or services. We do not have material revenues that we attribute<br />
to countries other than Canada (our country of domicile), nor do we have<br />
material amounts of property, plant, equipment, intangible assets and/or<br />
goodwill located outside of Canada; information about such non-material<br />
amounts is not regularly <strong>report</strong>ed to our chief operating decision-maker.<br />
<strong>TELUS</strong> 2012 ANNUAL REPORT . 131
6<br />
Other operating income<br />
Years ended December 31 (millions) Note 2012 2011<br />
Government assistance, including<br />
deferral account amortization $ß58 $ß54<br />
Investment income (loss) – (2)<br />
Interest income 17(c) 1 –<br />
Gain on disposal of assets<br />
Gain on 51% Transactel (Barbados) Inc.<br />
interest re-measured at acquisition-date<br />
10 3<br />
fair value 16(e) – 17<br />
$ß69 $ß72<br />
We receive government assistance, as defined by IFRS-IASB, from a<br />
number of sources and include such receipts in Other operating income.<br />
CRTC subsidy<br />
Local exchange carriers’ costs of providing the level of residential basic<br />
telephone services that the CRTC requires to be provided in high cost<br />
serving areas are greater than the amounts the CRTC allows the local<br />
exchange carriers to charge for the level of service. To ameliorate the<br />
situation, the CRTC directs the collection of contribution payments, in a<br />
central fund, from all registered Canadian telecommunications service<br />
providers (including voice, data and wireless service providers) that are<br />
7<br />
Employee benefits expense<br />
Years ended December 31 (millions) Note 2012 2011<br />
Employee benefits expense – gross<br />
Wages and salaries $ß2,211 $ß2,049<br />
Share-based compensation 13 74 51<br />
Pensions – defined benefit 14(b) (11) (34)<br />
Pensions – defined contribution 14(g) 70 66<br />
Other defined benefits 14(c) 1 2<br />
Restructuring costs 19(b) 38 13<br />
Other 129 124<br />
Capitalized internal labour costs<br />
2,512 2,271<br />
Property, plant and equipment (266) (284)<br />
Intangible assets subject to amortization (117) (94)<br />
(383) (378)<br />
$ß2,129 $ß1,893<br />
132 . <strong>TELUS</strong> 2012 ANNUAL REPORT<br />
then disbursed to incumbent local exchange carriers as subsidy payments<br />
to subsidize the costs of providing residential basic telephone services<br />
in non-forborne high cost serving areas. The subsidy payments are based<br />
upon a total subsidy requirement calculated on a per network access<br />
line/per band subsidy rate. For the year ended December 31, 2012, our<br />
subsidy receipts were $27 million (2011 – $32 million).<br />
The CRTC currently determines, at a national level, the total <strong>annual</strong><br />
contribution requirement necessary to pay the subsidies and then collects<br />
contribution payments from the Canadian telecommunications service<br />
providers, calculated as a percentage of their CRTC-defined telecommunications<br />
service revenue. The final contribution expense rate for 2012<br />
was 0.63% and the interim rate for 2013 has been similarly set at 0.63%.<br />
For the year ended December 31, 2012, our contributions to the central<br />
fund, which are accounted for as goods and services purchased, were<br />
$36 million (2011 – $40 million).<br />
Government of Québec<br />
Salaries for qualifying employment positions in the province of Québec,<br />
mainly in the information technology sector, are eligible for tax credits.<br />
In respect of such tax credits, for the year ended December 31, 2012,<br />
we recorded $11 million (2011 – $14 million).
8<br />
Financing costs<br />
Years ended December 31 (millions) Note 2012 2011<br />
Interest expense (1)<br />
Interest on long-term debt $ß338 $ß374<br />
Interest on short-term borrowings and other<br />
Interest accretion on asset retirement<br />
12 11<br />
obligation 19(a) 5 4<br />
355 389<br />
Foreign exchange (8) (9)<br />
Interest income<br />
347 380<br />
Interest on tax refunds (14) (2)<br />
Other (1) (1)<br />
(15) (3)<br />
$ß332 $ß377<br />
(1) No financing costs were capitalized to property, plant, equipment and/or intangible<br />
assets during the years ended December 31, 2012 and 2011.<br />
9<br />
Income taxes<br />
(a) Expense composition and rate reconciliation<br />
Years ended December 31 (millions) 2012 2011<br />
Current income tax expense (recovery)<br />
For current <strong>report</strong>ing period<br />
Consequential adjustments from reassessment<br />
$ß331 $ß186<br />
of prior year income tax issues (37) (15)<br />
Deferred income tax expense (recovery)<br />
Arising from the origination and reversal<br />
294 171<br />
of temporary differences<br />
Revaluation of deferred income tax liability<br />
127 247<br />
to reflect future statutory income tax rates<br />
Consequential adjustments from reassessment<br />
12 (37)<br />
of prior year income tax issues 24 (5)<br />
163 205<br />
$ß457 $ß376<br />
FINANCIAL STATEMENTS & NOTES: 6 – 9<br />
Our income tax expense differs from that calculated by applying<br />
statutory rates for the following reasons:<br />
Years ended December 31 ($ in millions) 2012 2011<br />
Basic blended tax at weighted<br />
average statutory income tax rates<br />
Tax rate differential on, and<br />
consequential adjustments from,<br />
reassessment of prior year<br />
$ß456 25.7% $ß433 27.2%<br />
tax issues<br />
Revaluation of deferred income tax<br />
liability to reflect future statutory<br />
(13) (20)<br />
income tax rates 12 (37)<br />
Share option award compensation 2 (1)<br />
Other<br />
Income tax expense per Consolidated<br />
Statements of Income and Other<br />
– 1<br />
Comprehensive Income $ß457 25.7% $ß376 23.6%<br />
Our basic blended weighted average statutory income tax rate<br />
is the aggregate of the following:<br />
Years ended December 31 2012 2011<br />
Basic federal rate 14.7% 16.2%<br />
Weighted average provincial rate 10.3 10.4<br />
Other tax jurisdictions 0.7 0.6<br />
25.7% 27.2%<br />
<strong>TELUS</strong> 2012 ANNUAL REPORT . 133
(b) Temporary differences<br />
We must make significant estimates in respect of the composition of our<br />
deferred income tax liability. Our operations are complex and the related<br />
134 . <strong>TELUS</strong> 2012 ANNUAL REPORT<br />
income tax interpretations, regulations and legislation are continually<br />
changing. As a result, there are usually some income tax matters<br />
in question.<br />
Temporary differences comprising the net deferred income tax liability and the amounts of deferred income tax expense recognized in the<br />
Consolidated Statements of Income and Other Comprehensive Income for each temporary difference are estimated as follows:<br />
Property, plant Partnership<br />
and equipment income Net pension and Losses<br />
and intangible Intangible unallocated share-based Reserves available to Net deferred<br />
assets subject to assets with for income compensation not currently be carried income tax<br />
(millions) amortization indefinite lives tax purposes amounts deductible forward (1) Other liability<br />
As at January 1, 2011<br />
Recognized in<br />
$ß326 $ß1,092 $ß398 $ß (23) $ß(92) $ß(36) $ß18 $ß1,683<br />
Net income 68 19 23 65 6 1 23 205<br />
Other comprehensive income – – – (288) – – 2 (286)<br />
Business acquisitions and other – 2 – – – – (4) (2)<br />
As at December 31, 2011<br />
Recognized in<br />
394 1,113 421 (246) (86) (35) 39 1,600<br />
Net income 62 40 35 49 (11) 2 (14) 163<br />
Other comprehensive income – – – (145) – – 3 (142)<br />
Business acquisitions and other – 2 – – – – 1 3<br />
As at December 31, 2012 $ß456 $ß1,155 $ß456 $ß(342) $ß(97) $ß(33) $ß29 $ß1,624<br />
(1) We expect to be able to utilize our non-capital losses prior to expiry.<br />
IFRS-IASB requires the separate disclosure of temporary differences<br />
arising from the carrying value of the investment in subsidiaries and<br />
partnerships exceeding their tax base and for which no deferred income<br />
tax liabilities have been recognized. In our specific instance this is relevant<br />
to our investment in Canadian subsidiaries and Canadian partnerships.<br />
We are not required to recognize such deferred income tax liabilities<br />
as we are in a position to control the timing and manner of the reversal<br />
of the temporary differences, which would not be expected to be exigible<br />
to income tax, and it is probable that such differences will not reverse in<br />
the foreseeable future. Although we are in a position to control the timing<br />
and reversal of temporary differences in respect of our non-Canadian<br />
subsidiaries, and it is not probable that such differences will reverse in the<br />
foreseeable future, we do recognize all potential taxes for repatriation of<br />
substantially all unremitted earnings of our non-Canadian subsidiaries.<br />
(c) Other<br />
We have net capital losses and such losses may only be applied<br />
against realized taxable capital gains. We expect to include a net capital<br />
loss carry-forward of $4 million (2011 – $5 million) in our Canadian<br />
income tax returns. During the year ended December 31, 2012, we<br />
recognized the benefit of $1 million (2011 – $NIL) in net capital losses.<br />
We conduct research and development activities, which are<br />
eligible to earn Investment Tax Credits. During the year ended<br />
December 31, 2012, we recorded Investment Tax Credits of $8 million<br />
(2011 – $8 million). Of the Investment Tax Credits we recorded during<br />
the year ended December 31, 2012, $5 million (2011 – $6 million)<br />
was recorded as a reduction of property, plant and equipment and/<br />
or intangible assets and the balance was recorded as a reduction<br />
of Goods and services purchased.
10<br />
Other comprehensive income<br />
FINANCIAL STATEMENTS & NOTES: 10 –11<br />
Items that may subsequently be reclassified to income<br />
Change in unrealized fair value of derivatives<br />
designated as cash flow hedges (Note 4(i))<br />
Item never<br />
reclassified<br />
to income<br />
Prior period Change in Cumulative<br />
(gains) losses Cumulative unrealized Accumulated employee<br />
Gains (losses) transferred to foreign currency fair value of other defined benefit Other<br />
arising in net income in the translation available-for-sale comprehensive plan actuarial comprehensive<br />
(millions) current period current period Total adjustment financial assets income gains (losses) (1) income<br />
Accumulated balance<br />
as at January 1, 2011<br />
Other comprehensive income (loss)<br />
$ß1 $ – $ – $ß 1 $ß (214)<br />
Amount arising $ß15 $ß (7) 8 4 – 12 (1,139) $ß(1,127)<br />
Income taxes $ß 5 $ß (3) 2 – – 2 (288) (286)<br />
Net 6 4 – 10 (851) $ß (841)<br />
Accumulated balance<br />
as at December 31, 2011<br />
Other comprehensive income (loss)<br />
7 4 – 11 (1,065)<br />
Amount arising $ß10 $ß(16) (6) – 38 32 (545) $ß (513)<br />
Income taxes $ß 2 $ß (4) (2) – 5 3 (145) (142)<br />
Net (4) – 33 29 (400) $ß (371)<br />
Accumulated balance<br />
as at December 31, 2012 $ß3 $ß4 $ß33 $ß40 $ß(1,465)<br />
(1) Cumulative employee defined benefit plan actuarial gains (losses) are only those amounts arising on or after January 1, 2010; excluding the tax effects thereon,<br />
the cumulative net gain (loss) charged to other comprehensive income at December 31, 2012, was $1,971 (2011 – $(1,426)).<br />
As at December 31, 2012, our estimate of the net amount of<br />
existing gains (losses) arising from the unrealized fair value of derivatives<br />
designated as cash flow hedges that are <strong>report</strong>ed in accumulated other<br />
11<br />
Per share amounts<br />
Basic net income per Common Share and Non-Voting Share is calculated<br />
by dividing net income attributable to Common Shares and Non-Voting<br />
Shares by the total weighted average number of Common Shares and<br />
Non-Voting Shares outstanding during the period. Diluted net income per<br />
Common Share and Non-Voting Share is calculated to give effect to share<br />
option awards and restricted stock units.<br />
The following table presents the reconciliations of the denominators<br />
of the basic and diluted per share computations. Net income attributable<br />
to Common Shares and Non-Voting Shares equalled diluted net income<br />
attributable to Common Shares and Non-Voting Shares for all periods<br />
presented.<br />
comprehensive income and are expected to be reclassified<br />
to net income in the next twelve months, excluding tax effects,<br />
is $2 million.<br />
Years ended December 31 (millions) 2012 2011<br />
Basic total weighted average number<br />
of Common Shares and Non-Voting<br />
Shares outstanding<br />
Effect of dilutive securities<br />
326 324<br />
Share option awards<br />
Diluted total weighted average number<br />
of Common Shares and Non-Voting<br />
1 2<br />
Shares outstanding 327 326<br />
For the year ended December 31, 2012, certain outstanding share<br />
option awards, in the amount of NIL (2011 – 1 million), were not included<br />
in the computation of diluted income per Common Share and Non-Voting<br />
Share because the share option awards’ exercise prices were greater<br />
than the average market price of the Common Shares and Non-Voting<br />
Shares during the <strong>report</strong>ed periods.<br />
<strong>TELUS</strong> 2012 ANNUAL REPORT . 135
12<br />
(a) Dividends declared<br />
Dividends per share<br />
Years ended December 31<br />
(millions except per share amounts) 2012 2011<br />
Common Share and Declared<br />
Paid to Declared<br />
Paid to<br />
Non-Voting Share dividends Effective Per share shareholders Total Effective Per share shareholders Total<br />
Quarter 1 dividend Mar. 9, 2012 $ß0.580 Apr. 2, 2012 $ß189 Mar. 11, 2011 $ß0.525 Apr. 1, 2011 $ß170<br />
Quarter 2 dividend June 8, 2012 0.610 July 3, 2012 198 June 10, 2011 0.550 July 4, 2011 178<br />
Quarter 3 dividend Sep. 10, 2012 0.610 Oct. 1, 2012 199 Sep. 9, 2011 0.550 Oct. 3, 2011 179<br />
Quarter 4 dividend Dec. 11, 2012 0.640 Jan. 2, 2013 208 Dec. 9, 2011 0.580 Jan. 3, 2012 188<br />
$ß2.440 $ß794 $ß2.205 $ß715<br />
On February 13, 2013, the Board of Directors declared a quarterly<br />
dividend of $0.64 per share on our issued and outstanding Common<br />
Shares payable on April 1, 2013, to holders of record at the close of<br />
business on March 11, 2013. The final amount of the dividend payment<br />
depends upon the number of Common Shares issued and outstanding<br />
at the close of business on March 11, 2013.<br />
(b) Dividend Reinvestment and Share Purchase Plan<br />
General<br />
We have a Dividend Reinvestment and Share Purchase Plan under which<br />
eligible holders of Common Shares and Non-Voting Shares may acquire<br />
Non-Voting Shares (Common Shares, effective February 4, 2013 – see<br />
Note 21) by reinvesting dividends and by making additional optional<br />
cash payments to the trustee. Under this Plan, we have the option of<br />
offering shares from Treasury or having the trustee acquire shares in<br />
the stock market.<br />
136 . <strong>TELUS</strong> 2012 ANNUAL REPORT<br />
Reinvestment of dividends<br />
We may, at our discretion, offer the Non-Voting Shares (Common Shares,<br />
effective February 4, 2013) at a discount of up to 5% from the market<br />
price. In respect of dividends reinvested during the three-month period<br />
ended March 31, 2011, we issued Non-Voting Shares from Treasury at<br />
a discount of 3%. We opted to have the trustee acquire the Non-Voting<br />
Shares (Common Shares, effective February 4, 2013) in the stock<br />
market commencing March 1, 2011, with no discount offered. In respect<br />
of Common Share and Non-Voting Share dividends declared during<br />
the year ended December 31, 2012, $32 million (2011 – $34 million) was<br />
to be reinvested in Non-Voting Shares.<br />
Optional cash payments<br />
Shares purchased through optional cash payments are subject to a<br />
minimum investment of $100 per transaction and a maximum investment<br />
of $20,000 per calendar year.
13<br />
Share-based compensation<br />
(a) Details of share-based compensation expense<br />
FINANCIAL STATEMENTS & NOTES: 12–13<br />
Reflected in the Consolidated Statements of Income and Other Comprehensive Income as employee benefits expense and in the Consolidated<br />
Statements of Cash Flows are the following share-based compensation amounts:<br />
Years ended December 31 2012 2011<br />
Employee Associated Statement Employee Associated Statement<br />
benefits operating of cash flows benefits operating of cash flows<br />
(millions) expense cash outflows adjustment expense cash outflows adjustment<br />
Share option awards (1) $ß 6 $ ßß – $ß6 $ß(10) $ß (7) $ß(17)<br />
Restricted stock units (2) 37 (34) 3 31 (26) 5<br />
Employee share purchase plan 31 (31) – 30 (30) –<br />
$ß74 $ß(65) $ß9 $ßß51 $ß(63) $ß(12)<br />
(1) The expense (recovery) arising from share options with the net-cash settlement feature, net of cash-settled equity swap agreement effects (see Note 4(i)), was $(3) (2011 – $(19)).<br />
(2) The expense arising from restricted stock units was net of cash-settled equity swap agreement effects (see Note 4(i)).<br />
For the year ended December 31, 2012, the associated operating<br />
cash outflows in respect of share option awards include cash outflows<br />
arising from the cash-settled equity swap agreements of $NIL (2011 –<br />
$7 million). Similarly, for the year ended December 31, 2012, the associated<br />
operating cash outflows in respect of restricted stock units are net of<br />
cash inflows arising from the cash-settled equity swap agreements<br />
of $14 million (2011 – $7 million). For the year ended December 31, 2012,<br />
the income tax benefit arising from share-based compensation was<br />
$17 million (2011 – $15 million); as disclosed in Note 9, not all sharebased<br />
compensation amounts are deductible for income tax purposes.<br />
(b) Share option awards<br />
General<br />
We use share option awards as a form of retention and incentive compensation.<br />
We have a number of share option plans under which employees<br />
may receive options to purchase Common Shares or Non-Voting Shares<br />
The following table presents a summary of the activity related to our share option plans.<br />
at a price equal to the fair market value at the time of grant.<br />
Effective February 4, 2013, outstanding share options to acquire<br />
Non-Voting Shares were exchanged for share options to acquire<br />
Common Shares on a one-for-one basis (see Note 21); all other<br />
terms of the share options remained the same. Share option awards<br />
currently granted under the plans may be exercised over specific<br />
periods not to exceed seven years from the time of grant; prior<br />
to 2003, share option awards were granted with exercise periods<br />
not to exceed 10 years.<br />
We apply the fair value method of accounting for share-based<br />
compensation awards granted to officers and other employees. Share<br />
option awards typically have a three-year vesting period (the requisite<br />
service period), but may vest over periods of up to five years. The vesting<br />
method of share option awards, which is determined on or before<br />
the date of grant, may be either cliff or graded; all share option awards<br />
granted subsequent to 2004 have been cliff-vesting awards.<br />
Years ended December 31 2012 2011<br />
Weighted Weighted<br />
Number of average share Number of average share<br />
share options option price share options option price<br />
Outstanding, beginning of period 9,573,701 $ß39.41 11,741,666 $ß37.83<br />
Granted 1,072,072 $ß58.39 1,522,639 $ß46.67<br />
Exercised (1) (3,095,787) $ß37.46 (2,963,147) $ß37.56<br />
Forfeited (248,626) $ß40.81 (617,796) $ß37.41<br />
Expired (30,671) $ß29.50 (109,661) $ß32.57<br />
Outstanding, end of period 7,270,689 $ß43.03 9,573,701 $ß39.41<br />
(1) The total intrinsic value of share option awards exercised for the year ended December 31, 2012, was $65 million (2011 – $35 million) (reflecting a weighted average price at the dates<br />
of exercise of $58.44 per share (2011 – $49.48 per share)).<br />
The following table reconciles the number of share options exercised and the associated number of Non-Voting Shares issued.<br />
Years ended December 31 2012 2011<br />
Non-Voting Shares issued or issuable pursuant to exercise of share options 52,400 745,340<br />
Non-Voting Shares issued or issuable pursuant to use of share option award net-equity settlement feature 1,062,021 422,076<br />
Impact of our choosing to settle share option award exercises using net-equity settlement feature 1,981,366 1,795,731<br />
Share options exercised 3,095,787 2,963,147<br />
<strong>TELUS</strong> 2012 ANNUAL REPORT . 137
The following is a life and exercise price stratification of our share options outstanding, all of which are for Non-Voting Shares, as at<br />
December 31, 2012. Effective February 4, 2013, outstanding share options to acquire Non-Voting Shares were exchanged for share options<br />
to acquire Common Shares on a one-for-one basis; all other terms of the share options remained the same.<br />
Options outstanding Options exercisable<br />
Range of option prices Total<br />
Low<br />
High<br />
$ß29.70<br />
$ß39.67<br />
$ß41.56<br />
$ß49.26<br />
$ß50.01<br />
$ß58.96<br />
$ß60.29<br />
$ß64.64<br />
$ß29.70<br />
$ß64.64 Number<br />
Weighted<br />
average<br />
Year of expiry and number of shares of shares price<br />
2013 – 304,393 12,326 – 316,719 316,719 $ß44.05<br />
2014 – 5,030 645,376 27,430 677,836 677,836 $ß56.65<br />
2015 4,875 775,896 – – 780,771 780,771 $ß43.87<br />
2016 612,725 – – – 612,725 612,725 $ß30.64<br />
2017 2,348,393 51,760 – – 2,400,153 – $ß –<br />
2018 – 1,368,871 53,490 – 1,422,361 – $ß –<br />
2019 – – 1,051,879 8,245 1,060,124 – $ß –<br />
2,965,993 2,505,950 1,763,071 35,675 7,270,689 2,388,051<br />
Weighted average remaining<br />
contractual life (years) 4.0 3.6 4.4 2.6 3.9<br />
Weighted average price $ß32.36 $ß45.28 $ß57.39 $ß63.82 $ß43.03<br />
Aggregate intrinsic value (1) (millions) $ß 96 $ß 48 $ß 13 $ß – $ß 157<br />
Options exercisable<br />
Number of shares<br />
Weighted average remaining<br />
617,600 1,085,319 657,702 27,430 2,388,051<br />
contractual life (years) 3.2 1.6 1.2 1.4 1.9<br />
Weighted average price $ß30.68 $ß43.84 $ß56.40 $ß63.95 $ß44.13<br />
Aggregate intrinsic value (1) (millions) $ß 21 $ß 23 $ß 5 $ß – $ß 49<br />
(1) The aggregate intrinsic value is calculated upon the December 31, 2012, price of $64.68 per Non-Voting Share.<br />
Share option awards accounted for as equity instruments<br />
The weighted average fair value of share option awards granted, and<br />
the weighted average assumptions used in the fair value estimation at the<br />
time of grant, calculated by using the Black-Scholes model (a closed-form<br />
option pricing model), are as follows:<br />
Years ended December 31 2012 2011<br />
Share option award fair value (per share option) $ß 7.36 $ß 6.75<br />
Risk free interest rate 1.7% 2.3%<br />
Expected lives (1) (years) 4.75 4.25<br />
Expected volatility 22.9% 25.7%<br />
Dividend yield 4.2% 4.5%<br />
(1) The maximum contractual term of the share option awards granted in 2012 and 2011<br />
was seven years.<br />
The risk free interest rate used in determining the fair value of the<br />
share option awards is based on a Government of Canada yield curve<br />
that is current at the time of grant. The expected lives of the share<br />
option awards are based on our historical share option award exercise<br />
data. Similarly, expected volatility considers the historical volatility in the<br />
price of our Non-Voting Shares. The dividend yield is the <strong>annual</strong>ized<br />
dividend current at the date of grant divided by the share option award<br />
exercise price. Dividends are not paid on unexercised share option<br />
awards and are not subject to vesting.<br />
138 . <strong>TELUS</strong> 2012 ANNUAL REPORT<br />
Had the weighted average assumptions for grants of share option<br />
awards that are reflected in the expense disclosures above varied by<br />
10% and 20%, the compensation cost arising from share option awards<br />
for the year ended December 31, 2012, would have varied as follows:<br />
Hypothetical change<br />
in assumptions (1)<br />
(millions) 10% 20%<br />
Risk free interest rate $ ß – $ ß –<br />
Expected lives (years) $ ß – $ ß –<br />
Expected volatility $ß 1 $ß 2<br />
Dividend yield $ß 1 $ß 1<br />
(1) These sensitivities are hypothetical and should be used with caution. Favourable<br />
hypothetical changes in the assumptions result in a decreased amount, and<br />
unfavourable hypothetical changes in the assumptions result in an increased amount,<br />
of the compensation cost arising from share option awards. As the figures indicate,<br />
changes in fair value based on a 10% variation in assumptions generally cannot<br />
be extrapolated because the relationship of the change in assumption to the<br />
change in fair value may not be linear; in particular, variations in expected lives are<br />
constrained by vesting periods and legal lives. Also, in this table, the effect of a<br />
variation in a particular assumption on the amount of the compensation cost arising<br />
from share option awards is calculated without changing any other assumption;<br />
in reality, changes in one factor may result in changes in another (for example,<br />
increases in risk free interest rates may result in increased dividend yields), which<br />
might magnify or counteract the sensitivities.<br />
Some share option awards have a net-equity settlement feature.<br />
The optionee does not have the choice of exercising the net-equity<br />
settlement feature; it is at our option whether the exercise of a share<br />
option award is settled as a share option or settled using the net-equity<br />
settlement feature.
Share option awards accounted for as liability instruments<br />
Substantially all of our outstanding share option awards that were<br />
granted prior to January 1, 2005, had a net-cash settlement feature;<br />
the optionee had the choice of exercising their share option award<br />
using the net-cash settlement feature. The outstanding share option<br />
awards with this feature largely took on the characteristics of liability<br />
instruments rather than equity instruments. For the out standing<br />
share option awards that were amended and were granted subsequent<br />
to 2001, the minimum expense recognized was their grant-date<br />
fair values.<br />
We entered into a cash-settled equity swap agreement that<br />
established a cap on our cost associated with substantially all of the<br />
outstanding share option awards with this feature.<br />
As at December 31, 2012, no share option awards with the net-cash<br />
settlement feature remained outstanding.<br />
The following table presents a summary of the activity related to our restricted stock units.<br />
FINANCIAL STATEMENTS & NOTES: 13<br />
(c) Restricted stock units<br />
We use restricted stock units as a form of retention and incentive<br />
com pensation. Each restricted stock unit is nominally equal in value to<br />
one Non-Voting Share (one Common Share, effective February 4, 2013 –<br />
see Note 21) together with the dividends that would have arisen thereon<br />
had it been an issued and outstanding Non-Voting Share (Common<br />
Share, effective February 4, 2013); the notional dividends are recorded<br />
as additional issuances of restricted stock units during the life of the<br />
restricted stock unit. Due to the notional dividend mechanism, the grantdate<br />
fair value of restricted stock units equals the fair market value of<br />
the corresponding shares at the grant date. The restricted stock units<br />
become payable when vesting is completed. The restricted stock units<br />
typically vest over a period of 33 months (the requisite service period).<br />
The vesting method of restricted stock units, which is determined<br />
on or before the date of grant, may be either cliff or graded; the majority<br />
of restricted stock units outstanding have cliff vesting. The associated<br />
liability is normally cash-settled.<br />
Years ended December 31 2012 2011<br />
Number of restricted stock units<br />
Weighted<br />
average grant-<br />
Number of restricted stock units<br />
Weighted<br />
average grant-<br />
Non-vested Vested date fair value Non-vested Vested date fair value<br />
Outstanding, beginning of period<br />
Non-vested 1,471,836 – $ß40.60 1,359,066 – $ß32.46<br />
Vested<br />
Issued<br />
– 15,951 $ß38.39 – 24,689 $ß31.86<br />
Initial award 731,456 – $ß58.29 801,137 – $ß46.75<br />
In lieu of dividends 72,113 87 $ß60.53 83,717 59 $ß49.98<br />
Vested (750,601) 750,601 $ß34.90 (627,281) 627,281 $ß31.57<br />
Settled in cash – (754,186) $ß34.73 – (636,078) $ß31.62<br />
Forfeited and cancelled<br />
Outstanding, end of period<br />
(55,868) (21) $ß41.94 (144,803) – $ß35.91<br />
Non-vested 1,468,936 – $ß52.57 1,471,836 – $ß40.60<br />
Vested – 12,432 $ß48.21 – 15,951 $ß38.39<br />
With respect to certain issuances of restricted stock units, we have entered into cash-settled equity forward agreements that fix our cost; that<br />
information, as well as a schedule of our non-vested restricted stock units outstanding as at December 31, 2012, is set out in the following table.<br />
Number of Number of Total number<br />
fixed-cost Our fixed cost variable-cost of non-vested<br />
restricted per restricted restricted restricted<br />
Vesting in years ending December 31 stock units stock unit stock units stock units<br />
2013 477,000 $ß51.48 288,066 765,066<br />
2014 30,000 $ß60.60 62,787 92,787<br />
2015 506,000 $ß62.10 105,083 611,083<br />
1,013,000 455,936 1,468,936<br />
<strong>TELUS</strong> 2012 ANNUAL REPORT . 139
(d) Employee share purchase plan<br />
We have an employee share purchase plan under which eligible<br />
employees up to a certain job classification can purchase our Common<br />
Shares through regular payroll deductions by contributing between<br />
1% and 10% of their pay; for more highly compensated job classifications,<br />
employees may contribute between 1% and 55% of their pay.<br />
For every dollar contributed by an employee, up to a maximum of<br />
6% of eligible employee pay, we are required to contribute a percentage<br />
between 20% and 40% as designated by us. For the years ended<br />
December 31, 2012 and 2011, we contributed 40% for employees up<br />
to a certain job classification; for more highly compensated job classifications,<br />
we contributed 35%. We record our contributions as a<br />
component of Employee benefits expense and our contribution vests<br />
on the earlier of a plan participant’s last day in our employ or the<br />
14<br />
Employee future benefits<br />
We have a number of defined benefit and defined contribution plans<br />
providing pension and other retirement and post-employment benefits<br />
to most of our employees. As at December 31, 2012 and 2011, all registered<br />
defined benefit pension plans are closed to substantially all new<br />
participants and substantially all benefits have vested. Other employee<br />
benefit plans include a <strong>TELUS</strong> Québec Inc. retiree healthcare plan.<br />
The benefit plan(s) in which an employee is a participant is a reflection<br />
of the development of our corporate history.<br />
<strong>TELUS</strong> Corporation Pension Plan<br />
Management and professional employees in Alberta who joined us<br />
prior to January 1, 2001, and certain unionized employees who joined<br />
us prior to June 9, 2011, are covered by this contributory defined<br />
benefit pension plan, which comprises slightly more than one-half of<br />
our total accrued benefit obligation. The plan contains a supplemental<br />
benefit account which may provide indexation up to 70% of the <strong>annual</strong><br />
change of a specified cost-of-living index. Pensionable remuneration<br />
is determined by the average of the best five years in the last ten years<br />
preceding retirement.<br />
Pension Plan for Management and Professional<br />
Employees of <strong>TELUS</strong> Corporation<br />
This defined benefit pension plan which, subject to certain limited<br />
exceptions, ceased accepting new participants on January 1, 2006,<br />
and which comprises approximately one-quarter of our total accrued<br />
benefit obligation, provides a non-contributory base level of pension<br />
benefits. Additionally, on a contributory basis, employees <strong>annual</strong>ly<br />
can choose increased and/or enhanced levels of pension benefits over<br />
the base level of pension benefits. At an enhanced level of pension<br />
benefits, the defined benefit pension plan has indexation of 100% of<br />
a specified cost-of-living index, to an <strong>annual</strong> maximum of 2%.<br />
Pensionable remuneration is determined by the <strong>annual</strong>ized average<br />
of the best 60 consecutive months.<br />
<strong>TELUS</strong> Québec Defined Benefit Pension Plan<br />
This contributory defined benefit pension plan, which ceased accepting<br />
new participants on April 14, 2009, covers any employee not governed<br />
by a collective agreement in Quebec who joined us prior to April 1, 2006,<br />
any non-supervisory employee governed by a collective agreement<br />
140 . <strong>TELUS</strong> 2012 ANNUAL REPORT<br />
last business day of the calendar year of our contribution, unless the<br />
plan participant’s employment is terminated with cause, in which case<br />
the plan participant will forfeit any in-year contribution from us.<br />
Years ended December 31 (millions) 2012 2011<br />
Employee contributions $ß 84 $ß 78<br />
Employer contributions 31 30<br />
$ß115 $ß108<br />
Under this plan, we have the option of offering shares from Treasury<br />
or having the trustee acquire shares in the stock market. For the years<br />
ended December 31, 2012 and 2011, all Common Shares issued to<br />
employees under the plan were purchased in the stock market at normal<br />
trading prices.<br />
who joined us prior to September 6, 2006, and certain other unionized<br />
employees. The plan comprises approximately one-tenth of our total<br />
accrued benefit obligation. The plan has no indexation and pensionable<br />
remuneration is determined by the average of the best four years.<br />
<strong>TELUS</strong> Edmonton Pension Plan<br />
This contributory defined benefit pension plan ceased accepting new<br />
participants on January 1, 1998. Indexation is 60% of the <strong>annual</strong> change<br />
of a specified cost-of-living index and pensionable remuneration is determined<br />
by the <strong>annual</strong>ized average of the best 60 consecutive months.<br />
Other defined benefit pension plans<br />
In addition to the foregoing plans, we have non-registered, noncontributory<br />
supplementary defined benefit pension plans which have<br />
the effect of maintaining the earned pension benefit once the allowable<br />
maximums in the registered plans are attained. As is common with<br />
non-registered plans of this nature, these plans are primarily funded<br />
only as benefits are paid.<br />
We have three contributory, non-indexed defined benefit pension<br />
plans arising from a pre-merger acquisition, which comprise less than 1%<br />
of our total accrued benefit obligation; these plans ceased accepting new<br />
participants in September 1989.<br />
Other defined benefit plans<br />
Other defined benefit plans, which are all non-contributory, are comprised<br />
of a disability income plan, a healthcare plan for retired employees<br />
and a life insurance plan. The healthcare plan for retired employees<br />
and the life insurance plan ceased accepting new participants effective<br />
January 1, 1997. In connection with the collective agreement signed in<br />
2005, an external supplier commenced providing a new long-term disability<br />
plan effective January 1, 2006. The existing disability income<br />
plan will continue to provide payments to previously approved claimants<br />
and qualified eligible employees.<br />
Telecommunication Workers Pension Plan<br />
Certain employees in British Columbia are covered by a negotiated-cost,<br />
target-benefit union pension plan. Our contributions are determined in<br />
accordance with provisions of negotiated labour contracts, the current<br />
one of which is in effect until December 31, 2015, and are generally<br />
based on employee gross earnings. We are not required to guarantee
the benefits or assure the solvency of the plan and are not liable to the<br />
plan for other participating employers’ obligations. For the years ended<br />
December 31, 2012 and 2011, our contributions comprised a significant<br />
proportion of the employer contributions to the union pension plan;<br />
similarly, a significant proportion of the plan participants were our active<br />
and retired employee participants.<br />
British Columbia Public Service Pension Plan<br />
Certain employees in British Columbia are covered by a public service<br />
pension plan. Contributions are determined in accordance with provisions<br />
of labour contracts negotiated by the Province of British Columbia and<br />
are generally based on employee gross earnings.<br />
(a) Defined benefit plans – funded status overview<br />
FINANCIAL STATEMENTS & NOTES: 14<br />
Defined contribution pension plans<br />
We offer two defined contribution pension plans, which are contributory,<br />
and are the pension plans that we sponsor that are available to<br />
non-unionized and certain unionized employees. Generally, employees<br />
<strong>annual</strong>ly can choose to contribute to the plans at a rate of between<br />
3% and 6% of their pensionable earnings. We will match 100% of the<br />
contributions of employees up to 5% of their pensionable earnings and<br />
will match 80% of employee contributions greater than that. Generally,<br />
membership in a defined contribution pension plan is voluntary until<br />
an employee’s third-year service anniversary. In the event that <strong>annual</strong><br />
contributions exceed allowable maximums, excess amounts are in<br />
certain cases contributed to a non-registered supplementary defined<br />
contribution pension plan.<br />
Information concerning our defined benefit plans, in aggregate, is as follows:<br />
Pension benefit plans Other benefit plans<br />
(millions) 2012 2011 2012 2011<br />
Accrued benefit obligation:<br />
Balance at beginning of year $ßß7,748 $ßß6,958 $ßß75 $ßß75<br />
Current service cost 124 110 – 1<br />
Past service cost 3 – – –<br />
Interest cost<br />
Actuarial loss (gain) arising from:<br />
345 360 2 2<br />
Demographic assumptions (7) (26) (7) (2)<br />
Financial assumptions 667 700 2 4<br />
Benefits paid (369) (354) (5) (5)<br />
Balance at end of year<br />
Plan assets:<br />
8,511 7,748 67 75<br />
Fair value at beginning of year<br />
Return on plan assets<br />
6,751 6,765 26 29<br />
Expected long-term rate of return on plan assets (1) Actual return on plan assets greater (less) than<br />
453 474 1 1<br />
expected long-term rate of return on plan assets<br />
Contributions<br />
111 (461) (1) –<br />
Employer contributions (e) 171 297 2 1<br />
Employees’ contributions 30 30 – –<br />
Benefits paid (369) (354) (5) (5)<br />
Fair value at end of year<br />
Effect of asset ceiling limit<br />
7,147 6,751 23 26<br />
Beginning of year (5) (5) (2) –<br />
Change – – – (2)<br />
End of year (5) (5) (2) (2)<br />
Fair value of plan assets at end of year, net of asset ceiling limit 7,142 6,746 21 24<br />
Funded status – plan surplus (deficit) $ß(1,369) $ß(1,002) $ß(46) $ß(51)<br />
(1) See Note 2(b) for significant amendments to the employee benefits accounting standard which are not yet effective and have not yet been applied.<br />
The plan surplus (deficit) is reflected in the Consolidated Statements<br />
of Financial Position as follows:<br />
As at December 31 (millions) 2012 2011<br />
Funded status – plan surplus (deficit)<br />
Pension benefit plans $ß(1,369) $ß(1,002)<br />
Other benefit plans<br />
Presented in the Consolidated Statements<br />
of Financial Position as:<br />
(46) (51)<br />
Other long-term liabilities (Note 24(a)) $ß(1,415) $ß(1,053)<br />
The measurement date used to determine the plan assets and<br />
accrued benefit obligation was December 31.<br />
<strong>TELUS</strong> 2012 ANNUAL REPORT . 141
(b) Defined benefit pension plans – details<br />
Expense<br />
Our defined benefit pension plan expense was as follows:<br />
Years ended December 31 (millions) 2012 2011<br />
Employee Other Employee Other<br />
benefits comprehensive benefits comprehensive<br />
expense income expense income<br />
Recognized in (Note 7) (Note 10) Total (Note 7) (Note 10) Total<br />
Current service cost $ßß94 $ – $ß 94 $ßß80 $ß – $ß 80<br />
Past service cost<br />
Return on plan assets net of interest<br />
3 – 3 – – –<br />
Interest cost on accrued benefit obligation 345 – 345 360 – 360<br />
Return on plan assets (1) (453) (111) (564) (474) 461 (13)<br />
Actuarial loss (gain) arising from:<br />
(108) (111) (219) (114) 461 347<br />
Demographic assumptions – (7) (7) – (26) (26)<br />
Financial assumptions – 667 667 – 700 700<br />
– 660 660 – 674 674<br />
$ß(11) $ß549 $ß538 $ß(34) $ß1,135 $ß1,101<br />
(1) The return on plan assets included in employee benefits expense reflects management’s expected long-term rate of return, as discussed further in (f). See Note 2(b) for significant<br />
amendments to the employee benefits accounting standard which are not yet effective and have not yet been applied.<br />
Experience adjustments<br />
Our defined benefit pension plan experience adjustments were as follows:<br />
As at, or for the years ended, December 31 (millions) 2012 2011 2010 2009 2008<br />
Funded status<br />
Fair value of plan assets $ßß7,142 $ßß6,746 $ß6,760 $ß6,311 $ß5,649<br />
Accrued benefit obligation 8,511 7,748 6,958 6,376 5,243<br />
Plan surplus (deficit)<br />
Actuarial loss (gain) arising from:<br />
$ß(1,369) $ß(1,002) $ßß (198) $ßß (65) $ß 406<br />
(1)<br />
Fair value of plan assets<br />
Accrued benefit obligation<br />
$ß (111) $ßß 461 $ßß (169) $ßß (364) $ß1,596<br />
Demographic assumptions (7) (26) (32) 61 96<br />
Financial assumptions (f) 667 700 484 930 (1,376)<br />
660 674 452 991 (1,280)<br />
Net $ßß 549 $ßß1,135 $ß 283 $ß 627 $ß 316<br />
(1) The actuarial losses (gains) experienced subsequent to December 31, 2009, have been recognized in other comprehensive income, as set out in Note 1(n) and Note 10.<br />
Disaggregation of defined benefit pension plan funding status<br />
Accrued benefit obligations are the actuarial present values of benefits attributed to employee services rendered to a particular date. Our disaggregation<br />
of defined benefit pension plan surpluses and deficits at year-end is as follows:<br />
As at December 31 (millions) 2012 2011<br />
Accrued Funded status Accrued Funded status<br />
benefit – plan surplus benefit – plan surplus<br />
obligation Plan assets (deficit) obligation Plan assets (deficit)<br />
Pension plans that have plan assets<br />
in excess of accrued benefit obligations<br />
Pension plans that have accrued benefit<br />
obligations in excess of plan assets<br />
$ß 21 $ß 21 $ßß – $ß 22 $ß 22 $ßß –<br />
Funded 8,218 7,121 (1,097) 7,474 6,724 (750)<br />
Unfunded 272 – (272) 252 – (252)<br />
8,490 7,121 (1,369) 7,726 6,724 (1,002)<br />
$ß8,511 $ß7,142 $ß(1,369) $ß7,748 $ß6,746 $ß(1,002)<br />
As at December 31, 2012 and 2011, undrawn Letters of Credit secured certain of the unfunded defined benefit pension plans.<br />
142 . <strong>TELUS</strong> 2012 ANNUAL REPORT
FINANCIAL STATEMENTS & NOTES: 14<br />
Accumulated pension benefit obligations<br />
Accumulated benefit obligations differ from accrued benefit obligations in that accumulated benefit obligations do not include assumptions about future<br />
compensation levels. Our disaggregation of defined benefit pension plan accumulated benefit obligations and plan assets at year-end is as follows:<br />
As at December 31 (millions) 2012 2011<br />
Accumulated Accumulated<br />
benefit benefit<br />
obligation Plan assets Difference obligation Plan assets Difference<br />
Pension plans that have plan assets<br />
in excess of accumulated benefit obligations<br />
Pension plans that have accumulated benefit<br />
obligations in excess of plan assets<br />
$ß 562 $ß 577 $ßß 15 $ß 516 $ß 540 $ßß 24<br />
Funded 7,308 6,565 (743) 6,683 6,206 (477)<br />
Unfunded 248 – (248) 232 – (232)<br />
7,556 6,565 (991) 6,915 6,206 (709)<br />
$ß8,118 $ß7,142 $ß(976) $ß7,431 $ß6,746 $ß(685)<br />
Future benefit payments<br />
Estimated future benefit payments from our defined benefit pension<br />
plans, calculated as at December 31, 2012, are as follows:<br />
Years ending December 31 (millions)<br />
2013 $ß 386<br />
2014 402<br />
2015 416<br />
2016 430<br />
2017 443<br />
2018–2022 2,344<br />
Fair value measurements<br />
Information about the fair value measurements of our defined benefit pension plan assets, in aggregate, is as follows:<br />
Fair value measurements at <strong>report</strong>ing date using<br />
Total<br />
Quoted prices in active<br />
markets for identical items Other<br />
As at December 31 (millions) 2012 2011 2012 2011 2012 2011<br />
Asset class<br />
Equity securities<br />
Canadian $ß2,151 $ß1,998 $ß1,602 $ß1,632 $ß 549 $ß 366<br />
Foreign<br />
Debt securities<br />
2,076 1,771 1,481 1,285 595 486<br />
Issued by national, provincial or local governments 1,081 1,346 814 946 267 400<br />
Corporate debt securities 967 692 – – 967 692<br />
Asset-backed securities 38 38 – – 38 38<br />
Commercial mortgages 195 253 – – 195 253<br />
Cash and cash equivalents 222 213 2 1 220 212<br />
Real estate 417 440 33 55 384 385<br />
7,147 6,751 $ß3,932 $ß3,919 $ß3,215 $ß2,832<br />
Effect of asset ceiling limit (5) (5)<br />
$ß7,142 $ß6,746<br />
As at December 31, 2012, we administered pension and other benefit trusts that held shares of <strong>TELUS</strong> Corporation that had a fair value of<br />
approximately $2 million (2011 – $2 million). As at December 31, 2012 and 2011, pension and other benefit trusts that we administered did not lease<br />
real estate to us.<br />
<strong>TELUS</strong> 2012 ANNUAL REPORT . 143
(c) Other defined benefit plans – details<br />
Expense<br />
Our other defined benefit plan expense was as follows:<br />
Years ended December 31 (millions) 2012 2011<br />
Employee Other Employee Other<br />
benefits comprehensive benefits comprehensive<br />
expense income expense income<br />
Recognized in (Note 7) (Note 10) Total (Note 7) (Note 10) Total<br />
Current service cost<br />
Return on plan assets net of interest<br />
$ß – $ß – $ß – $ßß1 $ß – $ß 1<br />
Interest cost on accrued benefit obligation 2 – 2 2 – 2<br />
Return on plan assets (1) (1) 1 – (1) – (1)<br />
Actuarial loss (gain) arising from:<br />
1 1 2 1 – 1<br />
Demographic assumptions – (7) (7) – (2) (2)<br />
Financial assumptions – 2 2 – 4 4<br />
Change in the effect of limiting net defined<br />
– (5) (5) – 2 2<br />
benefit assets to the asset ceiling – – – – 2 2<br />
$ßß1 $ß(4) $ß(3) $ßß2 $ßß4 $ß 6<br />
(1) The return on plan assets included in employee benefits expense reflects management’s expected long-term rate of return, as discussed further in (f). See Note 2(b) for significant<br />
amendments to the employee benefits accounting standard which are not yet effective and have not yet been applied.<br />
Disaggregation of other defined benefit plan funding status<br />
Accrued benefit obligations are the actuarial present values of benefits attributed to employee services rendered to a particular date. Our disaggregation<br />
of other defined benefit plan surpluses and deficits at year-end is as follows:<br />
As at December 31 (millions) 2012 2011<br />
Accrued Funded status Accrued Funded status<br />
benefit – plan surplus benefit – plan surplus<br />
obligation Plan assets (deficit) obligation Plan assets (deficit)<br />
Other benefit plan that has plan assets<br />
in excess of accrued benefit obligations<br />
Unfunded other benefit plans that have accrued<br />
$ß21 $ß21 $ ßß – $ß24 $ß24 $ ßß –<br />
benefit obligations in excess of plan assets 46 – (46) 51 – (51)<br />
$ß67 $ß21 $ß(46) $ß75 $ß24 $ß(51)<br />
Future benefit payments<br />
Estimated future benefit payments from our other defined benefit plans,<br />
calculated as at December 31, 2012, are as follows:<br />
Years ending December 31 (millions)<br />
2013 $ß 5<br />
2014 5<br />
2015 5<br />
2016 4<br />
2017 4<br />
2018–2022 18<br />
Fair value measurements<br />
As at December 31, 2012 and 2011, we had only one funded other defined<br />
benefit plan and it had only one asset, an experience related underwriting<br />
agreement, which does not have a fair value determinable by reference<br />
to a quoted price in an active market for an identical item.<br />
144 . <strong>TELUS</strong> 2012 ANNUAL REPORT<br />
(d) Plan investment strategies and policies<br />
Our primary goal for the defined benefit pension plans is to ensure the<br />
security of the retirement income and other benefits of the plan members<br />
and their beneficiaries. A secondary goal is to maximize the long-term<br />
rate of return on the defined benefit plans’ assets within a level of risk<br />
acceptable to us.<br />
Risk management<br />
We consider absolute risk (the risk of contribution increases, inadequate<br />
plan surplus and unfunded obligations) to be more important than relative<br />
return risk. Accordingly, the defined benefit plans’ designs, the nature<br />
and maturity of defined benefit obligations and the characteristics of<br />
the plans’ memberships significantly influence investment strategies and<br />
policies. We manage risk through specifying allowable and prohibited<br />
investment types, setting diversification strategies and determining target<br />
asset allocations.
Allowable and prohibited investment types<br />
Allowable and prohibited investment types, along with associated<br />
guidelines and limits, are set out in each fund’s required Statement of<br />
Investment Policies and Procedures (SIP&P), which is reviewed and<br />
approved <strong>annual</strong>ly by the designated governing body. The SIP&P guidelines<br />
and limits are further governed by the Pension Benefits Standards<br />
Regulations, 1985’s permitted investments and lending limits. As well<br />
as conventional investments, each fund’s SIP&P may provide for the use<br />
of derivative products to facilitate investment operations and to manage<br />
risk, provided that no short position is taken, no use of leverage is<br />
made and there is no violation of guidelines and limits established in the<br />
SIP&P. Internally managed funds are prohibited from increasing grandfathered<br />
investments in our securities; grandfathered investments were<br />
made prior to the merger of BC TELECOM Inc. and <strong>TELUS</strong> Corporation,<br />
our predecessors. Externally managed funds are permitted to invest<br />
in our securities, provided that the investments are consistent with the<br />
funds’ mandate and are in compliance with the relevant SIP&P.<br />
Diversification<br />
Our strategy for equity security investments is to be broadly diversified<br />
across individual securities, industry sectors and geographical regions.<br />
A meaningful portion (20–30% of total plan assets) of the investment in<br />
equity securities is allocated to foreign equity securities with the intent<br />
of further increasing the diversification of the plan assets. Debt securities<br />
Asset allocations<br />
Our defined benefit plans’ target asset allocations and actual asset allocations are as follows:<br />
FINANCIAL STATEMENTS & NOTES: 14<br />
may include a meaningful allocation to mortgages with the objective<br />
of enhancing cash flow and providing greater scope for the manage-<br />
ment of the bond component of the plan assets. Debt securities also<br />
may include real return bonds to provide inflation protection, consistent<br />
with the indexed nature of some defined benefit obligations. Real<br />
estate investments are used to provide diversification of plan assets,<br />
hedging of potential long-term inflation and comparatively stable<br />
investment income.<br />
Relationship between plan assets and benefit obligations<br />
With the objective of lowering the long-term costs of our defined benefit<br />
pension plans, we purposely mismatch plan assets and benefit obligations.<br />
This mismatching is effected by including equity investments in the<br />
long-term asset mix as well as fixed income securities and mortgages<br />
with durations that differ from the benefit obligations.<br />
As at December 31, 2012, the present value-weighted average<br />
timing of obligation estimated cash flows (duration) of the defined benefit<br />
pension plans was 13.9 years (2011 – 13.6 years) and of the other defined<br />
benefit plans was 7.1 years (2011 – 7.0 years).<br />
Compensation for liquidity issues that may have otherwise arisen<br />
from the mismatching of plan assets and benefit obligations comes<br />
from broadly diversified investment holdings (including cash and shortterm<br />
investments) and cash flows from dividends, interest and rents<br />
from diversified investment holdings.<br />
Pension benefit plans Other benefit plans<br />
Target Percentage of plan assets Target Percentage of plan assets<br />
allocation at end of year allocation at end of year<br />
2013 2012 2011 2013 2012 2011<br />
Equity securities 45–60% 59% 56% – – –<br />
Debt securities 35–45% 35% 37% – – –<br />
Real estate 4–8% 6% 7% – – –<br />
Other 0–2% – – 100% 100% 100%<br />
100% 100% 100% 100%<br />
(e) Employer contributions<br />
The determination of the minimum funding amounts for substantially<br />
all of our registered defined benefit pension plans is governed by the<br />
Pension Benefits Standards Act, 1985, which requires that, in addition<br />
to current service costs being funded, both going-concern and solvency<br />
valuations be performed on a specified periodic basis.<br />
. Any excess of plan assets over plan liabilities determined in the<br />
going-concern valuation reduces our minimum funding requirement<br />
for current service costs, but may not reduce the requirement to<br />
an amount less than the employees’ contributions. The going-concern<br />
valuation generally determines the excess (if any) of a plan’s assets<br />
over its liabilities, determined on a projected benefit basis.<br />
. As of the date of these consolidated financial statements, the solvency<br />
valuation generally requires that a plan’s liabilities, determined on the<br />
basis that the plan is terminated on the valuation date, in excess of<br />
its assets (if any) be funded, at a minimum, in equal <strong>annual</strong> amounts<br />
over a period not exceeding five years.<br />
The best estimates of fiscal 2013 employer contributions to our<br />
defined benefit plans are approximately $195 million for defined benefit<br />
pension plans and $NIL for other defined benefit plans. These estimates<br />
are based upon the mid-year 2012 <strong>annual</strong> funding <strong>report</strong>s that were<br />
prepared by actuaries using December 31, 2011, actuarial valuations.<br />
The funding <strong>report</strong>s are based on the pension plans’ fiscal years, which<br />
are calendar years. The next <strong>annual</strong> funding valuations are expected to<br />
be prepared mid-year 2013.<br />
(f) Assumptions<br />
Management is required to make significant estimates about certain<br />
actuarial and economic assumptions that are used in determining<br />
defined benefit pension costs, accrued benefit obligations and pension<br />
plan assets. These significant estimates are of a long-term nature,<br />
which is consistent with the nature of employee future benefits.<br />
Demographic assumptions<br />
We use the 1994 Uninsured Pensioner Mortality Table (UP94 Table)<br />
with generational projection for future mortality improvements using<br />
Mortality Table Projection Scale AA.<br />
Financial assumptions<br />
The discount rate, which is used to determine a plan’s accrued benefit<br />
obligation, is based upon the yield on long-term, high-quality fixed term<br />
investments, and is set <strong>annual</strong>ly. The expected long-term rate of return<br />
is based upon forecasted returns of the major asset categories and<br />
weighted by the plans’ target asset allocations (see Note 2(b)). The rate<br />
of future increases in compensation is based upon the current benefits<br />
policies and economic forecasts.<br />
<strong>TELUS</strong> 2012 ANNUAL REPORT . 145
The significant weighted average actuarial assumptions arising from these estimates and adopted in measuring our accrued benefit obligations<br />
are as follows:<br />
Pension benefit plans Other benefit plans<br />
2012 2011 2012 2011<br />
Discount rate used to determine:<br />
Net benefit costs for the year ended December 31 4.50% 5.25% 4.50% 4.97%<br />
Accrued benefit obligation as at December 31<br />
Expected long-term rate of return<br />
3.90% 4.50% 3.90% 4.50%<br />
(1) on plan assets used to determine:<br />
Net benefit costs for the year ended December 31 6.75% 7.00% 2.50% 2.50%<br />
Accrued benefit obligation as at December 31<br />
Rate of future increases in compensation used to determine:<br />
n.a. 6.75% n.a. 2.50%<br />
Net benefit costs for the year ended December 31 3.00% 3.00% – –<br />
Accrued benefit obligation as at December 31 3.00% 3.00% – –<br />
(1) The expected long-term rate of return is based upon forecasted returns of the major asset categories and weighted by the plans’ target asset allocations (see (d)). Forecasted<br />
returns are based upon our ongoing review of trends, economic conditions, data provided by actuaries and updating of underlying historical information. See Note 2(b) for significant<br />
amendments to the employee benefits accounting standard which are not yet effective and have not yet been applied.<br />
n.a. – not applicable. Please see Note 2(b).<br />
Sensitivity (1) of key assumptions<br />
Pension benefit plans Other benefit plans<br />
(years ended, or as at, December 31) 2012 2011 2012 2011<br />
Change in Change in Change in Change in Change in Change in Change in Change in<br />
Increase (decrease) (millions) obligation expense obligation expense obligation expense obligation expense<br />
Sensitivity of key assumptions to<br />
a hypothetical 25 basis point<br />
decrease (1) in:<br />
Discount rate<br />
Expected long-term rate<br />
$ß306 $ßß(1) $ß262 $ ßß– $ß 1 $ß – $ß 1 $ß –<br />
of return on plan assets<br />
Rate of future increases<br />
$ß17 $ß17 $ß – $ß –<br />
in compensation $ßß(31) $ßß(3) $ (27) $ßß(4) $ – $ß – $ ßß– $ß –<br />
(1) These sensitivities are hypothetical and should be used with caution. Favourable hypothetical changes in the assumptions result in decreased amounts, and unfavourable hypothetical<br />
changes in the assumptions result in increased amounts, of the obligations and expenses. Changes in amounts based on a 25 basis point variation in assumptions generally cannot<br />
be extrapolated because the relationship of the change in assumption to the change in amounts may not be linear. Also, in this table, the effect of a variation in a particular assumption<br />
on the change in obligation or change in expense is calculated without changing any other assumption; in reality, changes in one factor may result in changes in another (for example,<br />
increases in discount rates may result in increased expectations about the long-term rate of return on plan assets), which might magnify or counteract the sensitivities.<br />
(g) Defined contribution plans<br />
Our total defined contribution pension plan costs recognized were<br />
as follows:<br />
Years ended December 31 (millions) 2012 2011<br />
Union pension plan and public service<br />
pension plan contributions $ß27 $ß27<br />
Other defined contribution pension plans 43 39<br />
$ß70 $ß66<br />
We expect that our 2013 union pension plan and public service<br />
pension plan contributions will be approximately $26 million.<br />
146 . <strong>TELUS</strong> 2012 ANNUAL REPORT
15<br />
Property, plant and equipment<br />
FINANCIAL STATEMENTS & NOTES: 15<br />
Buildings and<br />
leasehold Assets under Assets under<br />
(millions) Network assets improvements finance lease Other Land construction Total<br />
At cost<br />
As at January 1, 2011 $ß22,691 $ß2,351 $ß21 $ß1,550 $ß49 $ß438 $ß27,100<br />
Additions (1) Additions arising from business<br />
516 20 1 41 7 887 1,472<br />
acquisitions (Note 16(e)) – 11 – 7 – – 18<br />
Dispositions, retirements and other (220) (8) 1 (51) (1) – (279)<br />
Reclassifications 779 99 – 75 – (953) –<br />
As at December 31, 2011 23,766 2,473 23 1,622 55 372 28,311<br />
Additions (1) Additions arising from business<br />
569 21 – 42 – 980 1,612<br />
acquisitions (Note 16(e)) – – – 2 – – 2<br />
Dispositions, retirements and other (1,126) (16) (17) (80) – – (1,239)<br />
Reclassifications 795 142 – 38 – (975) –<br />
As at December 31, 2012 $ß24,004 $ß2,620 $ß 6 $ß1,624 $ß55 $ß377 $ß28,686<br />
Accumulated depreciation<br />
As at January 1, 2011 $ß16,555 $ß1,443 $ß10 $ß1,261 $ßß – $ßß – $ß19,269<br />
Depreciation 1,091 121 2 117 – – 1,331<br />
Dispositions, retirements and other (218) (4) 8 (39) – – (253)<br />
As at December 31, 2011 17,428 1,560 20 1,339 – – 20,347<br />
Depreciation 1,192 126 3 101 – – 1,422<br />
Dispositions, retirements and other (1,127) (12) (17) (92) – – (1,248)<br />
As at December 31, 2012 $ß17,493 $ß1,674 $ß 6 $ß1,348 $ßß – $ßß – $ß20,521<br />
Net book value<br />
As at December 31, 2011 $ß 6,338 $ß 913 $ß 3 $ß 283 $ß55 $ß372 $ß 7,964<br />
As at December 31, 2012 $ß 6,511 $ß 946 $ßß – $ß 276 $ß55 $ß377 $ß 8,165<br />
(1) For the year ended December 31, 2012, additions include $49 (2011 – $15) in respect of asset retirement obligations (see Note 19(a)).<br />
The gross carrying amount of fully depreciated property, plant and<br />
equipment that was still in use as at December 31, 2012, was $2.9 billion<br />
(2011 – $3.0 billion).<br />
As at December 31, 2012, our contractual commitments for the<br />
acquisition of property, plant and equipment were $187 million over<br />
a period through to 2014 (2011 – $188 million over a period through<br />
to 2013).<br />
<strong>TELUS</strong> 2012 ANNUAL REPORT . 147
16<br />
Intangible assets and goodwill<br />
(a) Intangible assets and goodwill, net<br />
Customer<br />
148 . <strong>TELUS</strong> 2012 ANNUAL REPORT<br />
Intangible assets subject to amortization<br />
contracts,<br />
related<br />
customer<br />
relationships<br />
Access to Assets<br />
Intangible assets<br />
with indefinite lives<br />
Total<br />
Total<br />
intangible<br />
Subscriber and lease- rights-of-way under Spectrum Acquired intangible assets and<br />
(millions) base hold interests Software and other construction Total licences brand Total assets Goodwill (1) goodwill<br />
At cost<br />
As at January 1, 2011 $ß245 $ß137 $ß2,495 $ß112 $ß240 $ß3,229 $ß4,867 $ß 7 $ß4,874 $ß8,103 $ß3,936 $ß12,039<br />
Additions<br />
Additions arising from<br />
– – 39 4 347 390 – – – 390 – 390<br />
business acquisitions (e)<br />
Dispositions, retirements<br />
– 60 1 – – 61 – – – 61 110 171<br />
and other – – (256) (23) – (279) – – – (279) (21) (300)<br />
Reclassifications – – 422 – (422) – – – – – – –<br />
As at December 31, 2011 245 197 2,701 93 165 3,401 4,867 7 4,874 8,275 4,025 12,300<br />
Additions<br />
Additions arising from<br />
– – 10 3 405 418 – – – 418 – 418<br />
business acquisitions (e)<br />
Dispositions, retirements<br />
– 9 33 – – 42 – – – 42 41 83<br />
and other – – (240) (1) – (241) 9 – 9 (232) – (232)<br />
Reclassifications – – 385 – (385) – – – – – – –<br />
As at December 31, 2012 $ß245 $ß206 $ß2,889 $ß 95 $ß185 $ß3,620 $ß4,876 $ß 7 $ß4,883 $ß8,503 $ß4,066 $ß12,569<br />
Accumulated amortization<br />
As at January 1, 2011 $ß 58 $ß 41 $ß1,772 $ß 80 $ßß – $ß1,951 $ß – $ßß – $ß – $ß1,951 $ß 364 $ß 2,315<br />
Amortization (2) Dispositions, retirements<br />
6 19 431 4 – 460 – – – 460 19 479<br />
and other – – (267) (22) – (289) – – – (289) (19) (308)<br />
As at December 31, 2011 64 60 1,936 62 – 2,122 – – – 2,122 364 2,486<br />
Amortization<br />
Dispositions, retirements<br />
7 21 408 7 – 443 – – – 443 – 443<br />
and other – – (242) (1) – (243) – – – (243) – (243)<br />
As at December 31, 2012 $ß 71 $ß 81 $ß2,102 $ß 68 $ßß – $ß2,322 $ß – $ßß – $ß – $ß2,322 $ß 364 $ß 2,686<br />
Net book value<br />
As at December 31, 2011 $ß181 $ß137 $ß 765 $ß 31 $ß165 $ß1,279 $ß4,867 $ß 7 $ß4,874 $ß6,153 $ß3,661 $ß 9,814<br />
As at December 31, 2012 $ß174 $ß125 $ß 787 $ß 27 $ß185 $ß1,298 $ß4,876 $ß 7 $ß4,883 $ß6,181 $ß3,702 $ß 9,883<br />
(1) Accumulated amortization of goodwill is amortization recorded prior to 2002; there are no accumulated impairment losses in the accumulated amortization of goodwill.<br />
(2) Includes a goodwill impairment relating to an immaterial Wireline segment subsidiary classified as held for sale at, and disposed of subsequent to, December 31, 2011.<br />
The gross carrying amount of fully amortized intangible assets<br />
subject to amortization that were still in use as at December 31, 2012,<br />
was $683 million (2011 – $662 million).<br />
As at December 31, 2012, our contractual commitments for the<br />
acquisition of intangible assets were $119 million over a period through<br />
to 2018 (2011 – $142 million over a period through to 2018).
(b) Intangible assets subject to amortization<br />
Estimated aggregate amortization expense for intangible assets subject<br />
to amortization, calculated for such assets held as at December 31, 2012,<br />
for each of the next five fiscal years is as follows:<br />
Years ending December 31 (millions)<br />
2013 $ß361<br />
2014 269<br />
2015 171<br />
2016 97<br />
2017 42<br />
(d) Impairment testing of intangible assets with indefinite lives and goodwill<br />
FINANCIAL STATEMENTS & NOTES: 16<br />
(c) Intangible assets with indefinite lives –<br />
spectrum licences<br />
Our intangible assets with indefinite lives include spectrum licences<br />
granted by Industry Canada. Industry Canada’s spectrum licence policy<br />
terms indicate that the spectrum licences will likely be renewed. We<br />
expect our spectrum licences to be renewed every 20 years following<br />
a review by Industry Canada of our compliance with licence terms.<br />
In addition to current usage, our licensed spectrum can be used for<br />
planned and new technologies. As a result of the combination of these<br />
significant factors, our spectrum licences are currently considered to<br />
have indefinite lives.<br />
General<br />
As referred to in Note 1(j), the carrying values of intangible assets with indefinite lives and goodwill are periodically tested for impairment and this test<br />
represents a significant estimate for us.<br />
The carrying amounts of intangible assets with indefinite lives and goodwill allocated to each cash-generating unit are as set out in the following table.<br />
Intangible assets<br />
with indefinite lives Goodwill Total<br />
As at December 31 (millions) 2012 2011 2012 2011 2012 2011<br />
Wireless $ß4,883 $ß4,874 $ß2,644 $ß2,644 $ß7,527 $ß7,518<br />
Wireline – – 1,058 1,017 1,058 1,017<br />
$ß4,883 $ß4,874 $ß3,702 $ß3,661 $ß8,585 $ß8,535<br />
The recoverable amounts of the cash-generating units’ assets have<br />
been determined based on a value in use calculation. There is a material<br />
degree of uncertainty with respect to the estimates of the recoverable<br />
amounts of the cash-generating units’ assets given the necessity of<br />
making key economic assumptions about the future.<br />
We validate our value in use calculation results through the use<br />
of the market-comparable approach and analytical review of industry<br />
facts and facts that are specific to us. The market-comparable approach<br />
uses current (at time of test) market consensus estimates and equity<br />
trading prices for U.S. and Canadian firms in the same industry. In<br />
addition, we ensure that the combination of the valuations of the cashgenerating<br />
units is reasonable based on our current (at time of test)<br />
market values.<br />
Key assumptions<br />
The value in use calculation uses discounted cash flow projections<br />
which employ the following key assumptions: future cash flows and<br />
growth projections, including economic risk assumptions and estimates<br />
of achieving key operating metrics and drivers; the future weighted<br />
average cost of capital; and earnings multiples. We consider a range<br />
of reasonably possible amounts to use for key assumptions and<br />
decide upon amounts that represent management’s best estimates.<br />
In the normal course, we make changes to key assumptions to reflect<br />
current (at time of test) economic conditions, updating of historical<br />
information used to develop the key assumptions and changes (if any)<br />
in our debt ratings.<br />
The cash flow projection key assumptions are based upon our<br />
approved financial forecasts, which span a period of three years and<br />
are discounted, for December 2012 <strong>annual</strong> test purposes, at a consolidated<br />
pre-tax notional rate of 9.06% (2011 – 9.39%). For impairment<br />
testing valuation purposes, the cash flows subsequent to the threeyear<br />
projection period are extrapolated, for December 2012 <strong>annual</strong><br />
test purposes, using perpetual growth rates of 1.75% (2011 – 1.75%)<br />
for the wireless cash-generating unit and 0.50% (2011 – zero) for the<br />
wireline cash-generating unit; these growth rates do not exceed<br />
the observed long-term average growth rates for the markets in which<br />
we operate.<br />
We believe that any reasonably possible change in the key assumptions<br />
on which the calculation of our cash-generating units’ recoverable<br />
amounts is based would not cause the cash-generating units’ carrying<br />
amounts (including the intangible assets with indefinite lives and the<br />
goodwill allocated to the cash-generating unit) to exceed their recoverable<br />
amounts. If the future were to adversely differ from management’s best<br />
estimate of key assumptions and associated cash flows were to be materially<br />
adversely affected, we could potentially experience future material<br />
impairment charges in respect of our intangible assets with indefinite lives<br />
and goodwill.<br />
Sensitivity testing<br />
Sensitivity testing was conducted as a part of the December 2012 <strong>annual</strong><br />
test. A component of the sensitivity testing was a break-even analysis.<br />
Stress testing included moderate declines in <strong>annual</strong> cash flows with all<br />
other assumptions being held constant; this too resulted in our continuing<br />
to be able to recover the carrying value of our intangible assets with<br />
indefinite lives and goodwill for the foreseeable future.<br />
<strong>TELUS</strong> 2012 ANNUAL REPORT . 149
(e) Business acquisitions<br />
<strong>TELUS</strong>-branded wireless dealership businesses<br />
During the years ended December 31, 2012 and 2011, we acquired 100%<br />
ownership of certain <strong>TELUS</strong>-branded wireless dealership businesses.<br />
There was no contingent consideration in the transactions. The investments<br />
were made with a view to enhancing our distribution of wireless<br />
products and customer services across Western Canada. The 2012<br />
acquisitions were immaterial in total.<br />
The primary factor that contributed to the recognition of goodwill was<br />
the earnings capacity of the acquired businesses in excess of the net<br />
tangible assets and net intangible assets acquired (such excess arising<br />
from: the acquired workforce; and the benefits of acquiring established<br />
businesses in multiple locations). Approximately $NIL was assigned to<br />
goodwill during the year ended December 31, 2012 (2011 – $16 million),<br />
and may be deductible for tax purposes.<br />
Other<br />
During the year ended December 31, 2012, we acquired businesses<br />
complementary to our existing lines of business; with the exception<br />
of one acquisition of 55% of the shares of a business, all acquisitions<br />
were for 100% ownership. There was $1 million of contingent consideration<br />
recorded in association with the transactions; payment of<br />
contingent consideration is dependent upon achievement of revenue<br />
and key employee retention targets through 2014.<br />
In respect of the 55% acquired business, we concurrently provided<br />
two written put options to the remaining selling shareholder: the first<br />
of these is for 40% of the shares and would become exercisable<br />
December 31, 2015, if certain business metrics are achieved; and the<br />
second of these is for the remaining 5% of the shares, and would<br />
become exercisable no later than 18 months after the exercise of the<br />
first written put option. The first and second written put options set<br />
out that the share pricing methodology will be dependent upon the<br />
future earnings and market value, respectively, of the acquired business.<br />
150 . <strong>TELUS</strong> 2012 ANNUAL REPORT<br />
The acquisition-date fair value of the puttable shares held by the noncontrolling<br />
shareholder has been recorded as a provision, as further<br />
discussed in Note 19(a). Also concurrent with our acquisition of the initial<br />
55% economic interest, the non-controlling shareholder provided us<br />
with two purchased call options, which substantially mirror the written<br />
put options except that we can exercise our first purchased call option<br />
prior to December 31, 2015, if certain business financial metrics<br />
are exceeded.<br />
The primary factor that contributed to the recognition of goodwill<br />
was the earnings capacity of the acquired businesses in excess of<br />
the net tangible assets and net intangible assets acquired (such<br />
excess arising from: the low degree of tangible assets relative to the<br />
earnings capacity of the businesses; expected synergies; the benefits<br />
of acquiring established businesses with certain capabilities in<br />
the industry; and the geographic locations of the acquired businesses).<br />
A portion of the amount assigned to goodwill may be deductible<br />
for tax purposes.<br />
Transactel (Barbados) Inc.<br />
During the year ended December 31, 2011, we acquired control<br />
of Transactel (Barbados) Inc., a business process outsourcing and<br />
call centre company with facilities in two Central American countries.<br />
The investment was made with a view to enhancing our business<br />
process outsourcing capacity, particularly regarding Spanish-language<br />
capabilities, and acquiring multi-site redundancy in support of<br />
other facilities.<br />
The primary factor that contributed to the recognition of goodwill<br />
was the earnings capacity of the acquiree in excess of the net tangible<br />
assets and net intangible assets acquired (such excess arising from:<br />
the assembled workforce; the established operation with certain capabilities<br />
in the industry; and the geographic location of the acquiree).<br />
The amount assigned to goodwill is not expected to be deductible<br />
for tax purposes.
Our investment in Transactel (Barbados) Inc. is summarized as follows:<br />
FINANCIAL STATEMENTS & NOTES: 16<br />
Interest in Transactel (Barbados) Inc. attributable to:<br />
Common Shares Non-controlling interest (2) Total<br />
Economic Economic Economic<br />
($ in millions) interest interest interest<br />
December 2008 tranche<br />
Cash $ß 19<br />
Contingent consideration 10<br />
29 29.99%<br />
January 2011 tranche<br />
Equity accounting adjustments through<br />
20 21.01%<br />
February 1, 2011 (2)<br />
47 51.00%<br />
Gain on 51% interest re-measured<br />
at acquisition-date fair value<br />
Relative acquisition-date (February 1, 2011)<br />
16<br />
fair values 63 51.00% $ß60 49.00% $ß123 100.00%<br />
May 2011 equity transaction (1) 56 44.00% (56) (44.00%) – –<br />
$ß119 95.00% $ß 4 5.00% $ß123 100.00%<br />
(1) The difference between the amount we paid for the incremental 44% economic interest and the associated proportionate share of the non-controlling interest in the net assets<br />
of Transactel (Barbados) Inc. was recorded as a credit to retained earnings in the Consolidated Statements of Changes in Owners’ Equity.<br />
(2) The non-controlling interest at December 31, 2012 and 2011, is included in the Consolidated Statements of Financial Position as a non-current provision due to the provision<br />
of a written put option for the 5% economic interest we did not own.<br />
The acquisition was effected as follows:<br />
. On December 22, 2008, we acquired an initial 29.99% economic<br />
interest in Transactel (Barbados) Inc. for $19 million cash. Contingent<br />
consideration payable was dependent upon Transactel (Barbados)<br />
Inc. earnings for the year ended December 31, 2011. We initially<br />
accounted for our investment in Transactel (Barbados) Inc. using<br />
the equity method.<br />
. On January 7, 2011, we exercised our first purchased call option<br />
(obtained December 22, 2008) to acquire an additional 21.01%<br />
economic interest in Transactel (Barbados) Inc. from the vendor<br />
for $20 million cash.<br />
Upon such exercise, we continued to account for our resulting<br />
direct 51% economic interest in Transactel (Barbados) Inc. using the<br />
equity method. Although we had the right to elect a simple majority<br />
of the board of directors at the direct 51% economic interest level,<br />
the vendor’s remaining direct 49% economic interest effectively had<br />
a veto right over the strategic operating, investing and financing<br />
policies of Transactel (Barbados) Inc. and thus we did not have the<br />
control necessary to apply consolidation accounting.<br />
. Subsequently in the first quarter of 2011, Transactel (Barbados) Inc.<br />
achieved the business growth target necessary to allow us to exercise<br />
our second purchased call option (also obtained December 22, 2008)<br />
and we asserted our control effective February 1, 2011 (the acquisition<br />
date). The effects of the exercise included that we:<br />
. accounted for our 51% economic interest in Transactel (Barbados)<br />
Inc. on a consolidated basis (as the vendor no longer had an<br />
effective veto over the strategic operating, investing and financing<br />
policies) and included Transactel (Barbados) Inc.’s results in our<br />
Wireline segment effective February 1, 2011;<br />
. were required to re-measure our pre-acquisition 51% economic<br />
interest at the acquisition-date fair value, resulting in the recognition<br />
of a gain of $16 million (see Note 6) (such gain being<br />
net of a contingent consideration liability estimate of $10 million;<br />
concurrent with preparing our 2011 financial statements, the<br />
contingent consideration liability was confirmed at $9 million,<br />
as discussed further in Note 19(a), and the gain was thus<br />
revised to $17 million);<br />
. were required to initially measure the non-controlling interest’s<br />
49% economic interest at acquisition-date fair value, resulting in<br />
an increase of $60 million in the non-controlling interest; and<br />
. recorded, in the second quarter of 2011, a post-acquisition equity<br />
transaction with the vendor for the incremental 44% economic<br />
interest for $51 million cash.<br />
Concurrent with acquiring the incremental 44% economic interest,<br />
we provided a written put option to the vendor. This third written put<br />
option becomes exercisable on December 22, 2015, and allows the<br />
vendor to put the remaining 5% economic interest to us (our effective<br />
interest in Transactel (Barbados) Inc. would become 100%). The written<br />
put option sets out that the pricing methodology is to use an independent<br />
party that will apply common practice valuation techniques.<br />
Also concurrently, the vendor has provided us with a purchased<br />
call option which substantially mirrors the third written put option.<br />
<strong>TELUS</strong> 2012 ANNUAL REPORT . 151
Acquisition-date fair values<br />
The acquisition-date fair values assigned to assets acquired and liabilities assumed are as set out in the following table:<br />
Years ended December 31 2012 2011<br />
Individually <strong>TELUS</strong>-branded<br />
immaterial Transactel wireless dealership<br />
acquisitions (1) (Barbados) Inc. businesses<br />
As at (millions) Various 2012 February 1, 2011 Various 2011<br />
Assets<br />
Current assets<br />
Cash $ß 2 $ßß – $ßß –<br />
Accounts receivable (2) 4 25 2<br />
Other – 5 1<br />
Non-current assets<br />
6 30 3<br />
Property, plant and equipment<br />
Intangible assets<br />
Intangible assets subject to amortization<br />
2 12 6<br />
(3)<br />
Customer contracts, customer relationships (including those<br />
related to customer contracts) and leasehold interests 9 21 39<br />
Software 33 1 –<br />
42 22 39<br />
Deferred income taxes – – 2<br />
Total non-current assets 44 34 47<br />
Total identifiable assets acquired<br />
Liabilities<br />
50 64 50<br />
Current liabilities<br />
Non-current liabilities<br />
5 13 5<br />
Other long-term liabilities – – 1<br />
Deferred income taxes 2 – 1<br />
Total non-current liabilities 2 – 2<br />
Total liabilities assumed 7 13 7<br />
Net identifiable assets acquired 43 51 43<br />
Goodwill 41 72 38<br />
Net assets acquired<br />
Acquisition effected by way of:<br />
$ß84 $ß123 $ß81<br />
Cash consideration $ß46 $ßß – $ß81<br />
Accrued liabilities 5 – –<br />
Non-current provisions 31 – –<br />
Re-measured pre-acquisition interest at acquisition-date fair value (4) 2 63 n.a.<br />
84 63 81<br />
Non-controlling interest measured at fair value (5) n.a. 60 n.a.<br />
152 . <strong>TELUS</strong> 2012 ANNUAL REPORT<br />
$ß84 $ß123 $ß81<br />
(1) Including <strong>TELUS</strong>-branded wireless dealership businesses.<br />
(2) The fair value of the accounts receivable is equal to the gross contractual amounts receivable and reflects the best estimates at the acquisition dates of the contractual cash flows<br />
expected to be collected.<br />
(3) The customer contracts and related customer relationships and the software acquired in conjunction with Transactel (Barbados) Inc. are being amortized over periods of six years<br />
and three years, respectively. The customer contracts, related customer relationships and leasehold interests acquired in conjunction with the <strong>TELUS</strong>-branded wireless dealership<br />
and other businesses are being amortized over a period of six years; software acquired is being amortized over a period of five years.<br />
(4) In respect of individually immaterial transactions in 2012, re-measurement of our previously held interest resulted in the recognition of an acquisition-date gain of less than $1.<br />
In respect of Transactel (Barbados) Inc., re-measurement of our previously held 51% economic interest resulted in the recognition of an acquisition-date gain of $16 which is<br />
included in our Consolidated Statements of Income and Other Comprehensive Income as a component of Other operating income (see Note 6). The previously held 51% economic<br />
interest was comprised of an initial 29.99% acquired December 22, 2008, and a 21.01% economic interest obtained January 7, 2011.<br />
The acquisition-date fair value of our 51% interest included the recognition of $10 for contingent consideration, which was contractually based upon a multiple of an estimate<br />
of Transactel (Barbados) Inc. fiscal 2011 earnings in excess of a threshold amount.<br />
Concurrent with preparing our 2011 financial statements, the contingent consideration liability was confirmed at $9, as discussed further in Note 19(a), and the gain was thus<br />
revised to $17.<br />
(5) The remaining non-controlling interest, representing a 49% economic interest, had a fair value of $60 as of February 1, 2011 (acquisition-date fair value). The non-controlling interest<br />
fair value (the recorded amount of which is based upon net assets acquired) was determined by discounted cash flows. The fair value estimate is based upon: a going-concern basis;<br />
market participant synergies; a perpetuity terminal value based on sustaining cash flows; and costs (taxes) associated with future repatriation of funds.<br />
n.a. – not applicable
FINANCIAL STATEMENTS & NOTES: 16<br />
Pro forma disclosures<br />
The following pro forma supplemental information represents certain results of operations as if the business acquisitions noted above had been<br />
completed at the beginning of the fiscal years presented.<br />
Years ended December 31 2012 2011<br />
(millions except per share amounts) As <strong>report</strong>ed (1) Pro forma (2) As <strong>report</strong>ed Pro forma (2)<br />
Operating revenues $ß10,921 $ß10,934 $ß10,397 $ß10,424<br />
Net income<br />
Net income per Common Share and Non-Voting Share<br />
$ß 1,318 $ß 1,318 $ß 1,215 $ß 1,212<br />
– Basic $ß 4.05 $ß 4.05 $ß 3.76 $ß 3.75<br />
– Diluted $ß 4.03 $ß 4.03 $ß 3.74 $ß 3.73<br />
(1) Operating revenues and net income (loss) for the year ended December 31, 2012, include $21 and $(1), respectively, in respect of the acquired businesses.<br />
(2) Pro forma amounts for the years ended December 31, 2012 and 2011, reflect the acquired businesses. The results of the acquired businesses have been included in our Consolidated<br />
Statements of Income and Other Comprehensive Income effective the dates of acquisition.<br />
The pro forma supplemental information is based on estimates<br />
and assumptions which are believed to be reasonable. The pro forma<br />
supplemental information is not necessarily indicative of our consolidated<br />
financial results in future periods or the results that actually would<br />
have been realized had the business acquisitions been completed at<br />
the beginning of the periods presented. The pro forma supplemental<br />
information includes incremental intangible asset amortization, financing<br />
and other charges as a result of the acquisitions, net of the related<br />
tax effects.<br />
<strong>TELUS</strong> 2012 ANNUAL REPORT . 153
17<br />
(a) General<br />
Real estate joint venture<br />
In the first quarter of 2011, we announced that we had partnered, as<br />
equals, with an arm’s-length party in a residential condominium, retail<br />
and commercial real estate redevelopment project, <strong>TELUS</strong> Garden,<br />
in Vancouver, British Columbia. The project will result in us, as one of the<br />
tenants, having new national headquarters. The new-build office tower,<br />
scheduled for completion in 2014, is to be built to the 2009 Leadership<br />
in Energy and Environmental Design (LEED) Platinum standard and<br />
the neighbouring new-build residential condominium tower, scheduled<br />
for completion in 2015, is to be built to the LEED Gold standard.<br />
154 . <strong>TELUS</strong> 2012 ANNUAL REPORT<br />
(b) Real estate joint venture summarized<br />
financial information<br />
As at December 31 (millions) 2012<br />
Assets<br />
Current assets<br />
Cash and temporary investments, net $ß 5<br />
Sales contract deposits held by arm’s-length trustee 26<br />
Other 6<br />
Non-current assets<br />
Property under development<br />
Office 57<br />
Residential condominiums (subject to sales contracts) 52<br />
37<br />
109<br />
$ß146<br />
Liabilities and owners’ equity<br />
Current liabilities<br />
Accounts payable and accrued liabilities<br />
Non-current liabilities<br />
$ß 7<br />
Sales contract deposits held by arm’s-length trustee 26<br />
Construction credit facilities 54<br />
Construction holdback liabilities 1<br />
Other financial liabilities (1) 18<br />
Liabilities 106<br />
Owners’ equity<br />
<strong>TELUS</strong> (2) 20<br />
Other partner 20<br />
40<br />
$ß146<br />
(1) Non-current other financial liabilities are due to us; such amounts are non-interest<br />
bearing, are secured (as set out in (c) following), are payable in cash and are due<br />
subsequent to repayment of construction credit facilities.<br />
(2) The equity amount recorded by the real estate joint venture differs from that recorded<br />
by us by the amount of the deferred gain on our real estate contributed (as set out<br />
in (c) following).<br />
During the year ended December 31, 2012, the real estate joint<br />
venture capitalized $3 million of financing costs.
(c) Our transactions with the real estate joint venture<br />
FINANCIAL STATEMENTS & NOTES: 17<br />
Year ended December 31 (millions) 2012<br />
Loans and<br />
receivables;<br />
other Equity Total<br />
Related to real estate joint venture statement of income and other comprehensive income<br />
Comprehensive income (loss) attributable to us $ßß – $ßß(2) $ßß(2)<br />
Related to real estate joint venture statement of financial position<br />
Items not affecting currently <strong>report</strong>ed cash flows<br />
Our real estate contributed 11 28 39<br />
Deferral of gain on our remaining interest in our real estate contributed – (9) (9)<br />
Financing costs charged by us, excluding those arising from construction credit facilities<br />
Cash flows in the currently <strong>report</strong>ed period<br />
Construction credit facilities<br />
1 – 1<br />
Amounts advanced 27 – 27<br />
Financing costs paid to us (1) – (1)<br />
Funds we advanced (1) or contributed, excluding construction credit facilities 18 28 46<br />
Cash repayment of loans and receivables, excluding construction credit facilities (12) – (12)<br />
Cash distribution – (18) (18)<br />
Cash payment arising from joint venture capital account rebalancing – (16) (16)<br />
44 13 57<br />
Net increase in account with real estate joint venture and balance, end of period $ß44 $ß11 $ß55<br />
Account with real estate joint venture<br />
Non-current assets (2) $ß45 $ß11 $ß56<br />
Current and non-current liabilities (1) – (1)<br />
$ß44 $ß11 $ß55<br />
(1) As security for the non-interest bearing note underlying the funds advanced during the three-month period ended June 30, 2012, we have an $18 mortgage on the residential<br />
condominium tower and such mortgage is subordinate to the construction financing security. The note is to be repaid prior to any unit sales-related distributions to the owners<br />
arising from the residential condominium tower, excepting repayment of construction credit facilities.<br />
(2) Non-current loans and receivables are included in our Consolidated Statements of Financial Position as Other long-term assets.<br />
(d) Commitments and contingent liabilities<br />
Construction commitment<br />
The real estate joint venture is expected to spend a combined total of<br />
approximately $470 million on the construction of an office tower and<br />
a residential condominium tower. Construction activity has commenced<br />
on both the office tower and the residential condominium tower. As at<br />
December 31, 2012, the real estate joint venture’s construction-related<br />
contractual commitments were approximately $150 million through<br />
to 2015.<br />
Operating lease<br />
In the first quarter of 2012, as one of the future office tower tenants,<br />
we entered into a 20-year operating lease for our new national headquarter<br />
premises with the real estate joint venture at market rates.<br />
The future minimum lease payments under this lease are as follows:<br />
Years ending December 31 Occupancy<br />
(millions) Rent costs Gross<br />
2013 $ßß – $ ßß– $ßß –<br />
2014 – – –<br />
2015 6 4 10<br />
2016 6 4 10<br />
2017 6 4 10<br />
Thereafter<br />
Total future minimum lease payments<br />
121 79 200<br />
as at December 31, 2012 (1) $ß139 $ß91 $ß230<br />
(1) The amounts in this table have been included with the corresponding amounts<br />
in Note 22(a).<br />
Construction credit facilities<br />
In the third quarter of 2012, the real estate joint venture signed definitive<br />
credit agreements with two Canadian financial institutions (as 50%<br />
lender) and <strong>TELUS</strong> Corporation (as 50% lender) to provide approximately<br />
$413 million of construction financing for the <strong>TELUS</strong> Garden project.<br />
The facilities contain customary real estate construction financing<br />
representations, warranties and covenants and are secured by demand<br />
debentures constituting first fixed and floating charge mortgages over<br />
the underlying real estate assets. The facilities are available by way of<br />
bankers’ acceptance or prime loan and bear interest at rates in line with<br />
similar construction financing facilities.<br />
Other<br />
We are to receive 50% of the earnings from the sale of residential<br />
condominium tower units in excess of the first $18 million of earnings;<br />
we are to receive 25% of the first $18 million of earnings and the<br />
arm’s-length co-owner is to receive 75%.<br />
We have guaranteed the payment of 50% of the real estate joint<br />
venture’s construction credit facility carrying costs and costs to complete.<br />
We have also provided an environmental indemnity in favour of the<br />
construction lenders. If we pay out under such guarantee or indemnity<br />
because the arm’s-length co-owner has not paid its pro rata share of<br />
project costs, then we have recourse options available, including against<br />
the arm’s-length co-owner’s interest in the real estate joint venture.<br />
As at December 31, 2012, we had no liability recorded in respect<br />
of real estate joint venture obligations and guarantees.<br />
<strong>TELUS</strong> 2012 ANNUAL REPORT . 155
18<br />
Short-term borrowings<br />
On July 26, 2002, one of our subsidiaries, <strong>TELUS</strong> Communications<br />
Inc. (see Note 23(a)), entered into an agreement with an arm’s-length<br />
securitization trust associated with a major Schedule I bank under<br />
which <strong>TELUS</strong> Communications Inc. is able to sell an interest in certain<br />
trade receivables up to a maximum of $500 million (2011 – $500 million).<br />
This revolving-period securitization agreement’s current term ends<br />
August 1, 2014. <strong>TELUS</strong> Communications Inc. is required to maintain at<br />
least a BBB (low) credit rating by Dominion Bond Rating Service or the<br />
securitization trust may require the sale program to be wound down<br />
prior to the end of the term.<br />
19 Provisions<br />
(a) General<br />
156 . <strong>TELUS</strong> 2012 ANNUAL REPORT<br />
When we sell our trade receivables, we retain reserve accounts, which<br />
are retained interests in the securitized trade receivables, and servicing<br />
rights. As at December 31, 2012, we had transferred, but continued to<br />
recognize, trade receivables of $454 million (2011 – $456 million). Shortterm<br />
borrowings of $400 million (2011 – $400 million) are comprised<br />
of amounts loaned to us by the arm’s-length securitization trust pursuant<br />
to the sale of trade receivables.<br />
The balance of short-term borrowings (if any) comprised amounts<br />
drawn on our bilateral bank facilities.<br />
Asset<br />
retirement Employee<br />
(millions) Regulatory obligation related (b) Other (b) Total<br />
As at January 1, 2011 $ß104 $ß 85 $ß105 $ß32 $ß326<br />
Addition – – 20 101 121<br />
Use (104) – (73) (52) (229)<br />
Reversal – – (15) (12) (27)<br />
Interest effect (1) – 19 – – 19<br />
As at December 31, 2011 – 104 37 69 210<br />
Addition – 2 40 48 90<br />
Use – (2) (41) (36) (79)<br />
Reversal – – (2) – (2)<br />
Interest effect (1) – 52 – – 52<br />
As at December 31, 2012 $ßß – $ß156 $ß 34 $ß81 $ß271<br />
Current $ßß – $ß 3 $ß 36 $ß49 $ß 88<br />
Non-current – 101 1 20 122<br />
As at December 31, 2011 $ßß – $ß104 $ß 37 $ß69 $ß210<br />
Current $ßß – $ß 3 $ß 33 $ß13 $ß 49<br />
Non-current – 153 1 68 222<br />
As at December 31, 2012 $ßß – $ß156 $ß 34 $ß81 $ß271<br />
(1) The difference, if any, between the interest effect in this table and the amount disclosed in Note 8, is in respect of any change in the discount rate applicable to the provision,<br />
such difference being included in the cost of the associated asset(s).
Regulatory<br />
In 2002, the CRTC issued Decisions 2002-34 and 2002-43 which<br />
resulted in the creation of non-high cost serving area deferral accounts.<br />
The deferral account arises from the CRTC requiring us to defer the<br />
statement of income and other comprehensive income recognition of<br />
a portion of the monies received in respect of residential basic services<br />
provided to non-high cost serving areas. In order to extinguish the<br />
deferral account liability, we will be: expanding broadband services in<br />
our incumbent local exchange carrier territories to rural and remote<br />
communities; enhancing accessibility to telecommunications services<br />
for individuals with disabilities; and rebating the balance of the deferral<br />
account to local residential customers in non-high cost serving areas.<br />
The CRTC rendered its final decision on the use of the deferral account<br />
in August 2010. The decision required $54 million in customer rebates<br />
to be effected by February 2011, and the remaining $111 million is<br />
to be applied to providing broadband services and initiatives for the<br />
disabled, both of which are to be completed by 2014. The amounts<br />
used, rebated, to be applied in the next 12 months or for which<br />
the timing or amount are no longer uncertain are reflected in the<br />
table above as a use.<br />
Asset retirement obligation<br />
We recognize liabilities associated with the retirement of property,<br />
plant and equipment when those obligations result from the acquisition,<br />
construction, development and/or normal operation of the assets.<br />
We expect that the cash outflows in respect of the balance accrued<br />
as at the financial statement date will occur proximate to the dates<br />
these long-term assets are retired.<br />
Employee related<br />
The employee related provisions are largely in respect of restructuring<br />
activities (as discussed further in (b) following). The timing of the cash<br />
outflows in respect of the balance accrued as at the financial statement<br />
date is substantially short-term in nature.<br />
FINANCIAL STATEMENTS & NOTES: 18 –19<br />
Other<br />
The provision for other includes legal disputes and non-employee<br />
related restructuring activities (as discussed further in (b) following), as<br />
well as written put options related to business acquisitions. Other than<br />
as set out following, we expect that the cash outflows in respect of the<br />
balance accrued as at the financial statement date will occur over<br />
an indeterminate, multi-year period.<br />
As discussed further in Note 22(c), we are involved in a number<br />
of legal disputes and are aware of certain other possible legal disputes.<br />
In respect of legal disputes, we have established provisions, when<br />
warranted, after taking into account legal assessment, information<br />
presently available, and the expected availability of insurance or other<br />
recourse. The timing of cash outflows associated with legal claims<br />
cannot be reasonably determined.<br />
As discussed further in Note 16(e), we incurred a liability for<br />
contingent consideration in connection with acquiring an initial 29.99%<br />
economic interest in Transactel (Barbados) Inc. in December 2008;<br />
as at December 31, 2011, the timing and amount of the contingent consideration<br />
were no longer uncertain and thus the amount that was to<br />
be paid is reflected in the table above as a use and the difference of<br />
$1 million is reflected as a reversal. Also as discussed in Note 16(e), we<br />
have provided written put options in respect of non-controlling interests;<br />
cash outflows are not expected to occur prior to initial exercisability<br />
of the written put options in December 2015.<br />
(b) Restructuring<br />
Employee related provisions and other provisions, in (a) preceding,<br />
include amounts in respect of restructuring activities. In 2012, restructuring<br />
activities included ongoing efficiency initiatives such as:<br />
. simplifying or automating processes to achieve operating efficiencies,<br />
which includes workforce reductions;<br />
. simplifying organizational structures through consolidation of functions<br />
and reducing organizational layers;<br />
. consolidating administrative real estate to create a smaller environmental<br />
footprint through mobile working, encouraging less inter-city<br />
travel, reduced daily commutes, and use of reduced real estate<br />
space, which includes vacating premises; and<br />
. decommissioning uneconomic services and products.<br />
<strong>TELUS</strong> 2012 ANNUAL REPORT . 157
Years ended December 31 (millions) 2012 2011<br />
158 . <strong>TELUS</strong> 2012 ANNUAL REPORT<br />
Employee Employee<br />
related (1) Other (1) Total (1) related (1) Other (1) Total (1)<br />
Restructuring costs<br />
Addition<br />
Workforce<br />
Voluntary $ß15 $ßß – $ß15 $ß 7 $ßß – $ß 7<br />
Involuntary 25 – 25 11 – 11<br />
Other<br />
Reversal<br />
Workforce<br />
– 10 10 – 22 22<br />
Involuntary (2) – (2) – – –<br />
Voluntary – – – (5) – (5)<br />
Use<br />
Workforce<br />
38 10 48 13 22 35<br />
Voluntary 21 – 21 45 – 45<br />
Involuntary and other 20 – 20 27 – 27<br />
Other – 11 11 – 11 11<br />
41 11 52 72 11 83<br />
Expenses greater (less) than disbursements<br />
Restructuring accounts payable<br />
and accrued liabilities<br />
(3) (1) (4) (59) 11 (48)<br />
Balance, beginning of period 36 27 63 95 16 111<br />
Balance, end of period $ß33 $ß26 $ß59 $ß36 $ß27 $ß63<br />
(1) The transactions and balances in this column are included in, and thus are a subset of, the transactions and balances in the columns with the same caption in (a) preceding.<br />
These initiatives were intended to improve our long-term operating productivity and competitiveness. We expect that substantially all of the cash<br />
outflows in respect of the balance accrued as at the financial statement date will occur within twelve months thereof.
20<br />
(a) Details of long-term debt<br />
FINANCIAL STATEMENTS & NOTES: 20<br />
As at December 31 ($ in millions) 2012 2011<br />
Series Rate of interest Maturity<br />
<strong>TELUS</strong> Corporation Notes<br />
CB 5.00% (1) June 2013 $ß 300 $ß 300<br />
CC 4.50% (1) March 2012 – 300<br />
CD 4.95% (1) March 2017 693 692<br />
CE 5.95% (1) April 2015 499 498<br />
CF 4.95% (1) May 2014 699 698<br />
CG 5.05% (1) December 2019 992 991<br />
CH 5.05% (1) July 2020 994 993<br />
CI 3.65% (1) May 2016 596 595<br />
CJ 3.35% (1) March 2023 496 –<br />
5,269 5,067<br />
<strong>TELUS</strong> Corporation Commercial Paper<br />
<strong>TELUS</strong> Communications Inc. Debentures<br />
1.14% Through March 2013 245 766<br />
2 11.90% (1) November 2015 125 124<br />
3 10.65% (1) June 2021 174 174<br />
5 9.65% (1) April 2022 245 245<br />
B 8.80% (1) September 2025 198 198<br />
742 741<br />
Long-Term Debt $ß6,256 $ß6,574<br />
Current $ß 545 $ß1,066<br />
Non-current 5,711 5,508<br />
Long-Term Debt $ß6,256 $ß6,574<br />
(1) Interest is payable semi-<strong>annual</strong>ly.<br />
Long-term debt<br />
(b) <strong>TELUS</strong> Corporation notes<br />
General<br />
The notes are our senior, unsecured and unsubordinated obligations<br />
and rank equally in right of payment with all of our existing and future<br />
unsecured, unsubordinated obligations, are senior in right of payment<br />
to all of our existing and future subordinated indebtedness, and are<br />
effectively subordinated to all existing and future obligations of,<br />
or guaranteed by, our subsidiaries.<br />
The indentures governing the notes contain certain covenants<br />
which, among other things, place limitations on our ability and the<br />
ability of certain of our subsidiaries to: grant security in respect of<br />
indebtedness, enter into sale and lease-back transactions and incur<br />
new indebtedness.<br />
Principal face amount<br />
Redemption<br />
Outstanding present<br />
Originally at financial value spread<br />
Series Issued Maturity Issue price issued statement date (basis points)<br />
5.00% Notes, Series CB May 2006 June 2013 $998.80 $300 million $300 million 16 (1)<br />
4.95% Notes, Series CD March 2007 March 2017 $999.53 $700 million $700 million 24 (1)<br />
5.95% Notes, Series CE (2) April 2008 April 2015 $998.97 $500 million $500 million 66 (1)<br />
4.95% Notes, Series CF (2) May 2009 May 2014 $999.96 $700 million $700 million 71 (1)<br />
5.05% Notes, Series CG (2) December 2009 December 2019 $994.19 $1.0 billion $1.0 billion 45.5 (1)<br />
5.05% Notes, Series CH (2) July 2010 July 2020 $997.44 $1.0 billion $1.0 billion 47 (1)<br />
3.65% Notes, Series CI (2) May 2011 May 2016 $996.29 $600 million $600 million 29.5 (1)<br />
3.35% Notes, Series CJ (2) December 2012 March 2023 $998.83 $500 million $500 million 40 (3)<br />
(1) The notes are redeemable at our option, in whole at any time, or in part from time to time, on not fewer than 30 and not more than 60 days’ prior notice. The redemption price is<br />
equal to the greater of (i) the present value of the notes discounted at the Government of Canada yield plus the redemption present value spread, or (ii) 100% of the principal amount<br />
thereof. In addition, accrued and unpaid interest, if any, will be paid to the date fixed for redemption.<br />
(2) This series of notes requires us to make an offer to repurchase the notes at a price equal to 101% of their principal amount plus accrued and unpaid interest to the date of repurchase<br />
upon the occurrence of a change in control triggering event, as defined in the supplemental trust indenture.<br />
(3) At any time prior to December 15, 2022, the notes are redeemable at our option, in whole at any time, or in part from time to time, on not fewer than 30 and not more than 60 days’<br />
prior notice. The redemption price is equal to the greater of (i) the present value of the notes discounted at the Government of Canada yield plus the redemption present value spread,<br />
or (ii) 100% of the principal amount thereof. In addition, accrued and unpaid interest, if any, will be paid to the date fixed for redemption. On or after December 15, 2022, the notes are<br />
redeemable at our option, in whole, but not in part, on not fewer than 30 and not more than 60 days’ prior notice, at a redemption price equal to 100% of the principal amount thereof.<br />
<strong>TELUS</strong> 2012 ANNUAL REPORT . 159
2011 Cross Currency Interest Rate Swap Agreements<br />
With respect to the 2011 (U.S. Dollar) Notes, which were repaid during<br />
fiscal 2011, we entered into cross currency interest rate swap agreements<br />
concurrent with the debt issuance in 2001 which effectively converted<br />
the principal repayments and interest obligations to Canadian dollar<br />
obli gations with an effective fixed interest rate of 8.493% and an effective<br />
fixed economic exchange rate of $1.5327. The counterparties of the<br />
swap agreements were highly rated financial institutions and we did not<br />
anticipate any non-performance. We did not require collateral or other<br />
security from the counterparties due to our assessment of their<br />
creditworthiness.<br />
(c) <strong>TELUS</strong> Corporation commercial paper<br />
<strong>TELUS</strong> Corporation has an unsecured commercial paper program,<br />
that is backstopped by our $2.0 billion syndicated credit facility, enabling<br />
us to issue commercial paper up to a maximum aggregate amount of<br />
$1.2 billion, which is to be used for general corporate purposes, including<br />
capital expenditures and investments. Commercial paper debt is due<br />
within one year and is classified as a current portion of long-term debt as<br />
the amounts are fully supported, and we expect that they will continue<br />
to be supported, by the revolving credit facility, which has no repayment<br />
requirements within the next year.<br />
(d) <strong>TELUS</strong> Corporation credit facility<br />
<strong>TELUS</strong> Corporation has an unsecured, revolving $2.0 billion bank credit<br />
facility, expiring on November 3, 2016, with a syndicate of financial<br />
institutions, which is to be used for general corporate purposes, including<br />
the backstop of commercial paper.<br />
<strong>TELUS</strong> Corporation’s credit facility bears interest at prime rate,<br />
U.S. Dollar Base Rate, a bankers’ acceptance rate or London interbank<br />
offered rate (LIBOR) (all such terms as used or defined in the credit<br />
facility), plus applicable margins. The credit facility contains customary<br />
representations, warranties and covenants, including two financial<br />
quarter-end financial ratio tests. The financial ratio tests are that we may<br />
not permit our net debt to operating cash flow ratio to exceed 4.0:1<br />
and may not permit our operating cash flow to interest expense ratio<br />
to be less than 2.0:1, each as defined under the credit facility.<br />
Continued access to <strong>TELUS</strong> Corporation’s credit facility is not<br />
contingent on the maintenance by <strong>TELUS</strong> Corporation of a specific<br />
credit rating.<br />
As at December 31 (millions) 2012 2011<br />
Net available $ß1,755 $ß1,234<br />
Backstop of commercial paper 245 766<br />
Gross available $ß2,000 $ß2,000<br />
In addition to the ability to provide letters of credit pursuant to our<br />
$2.0 billion bank credit facility, we have $120 million (2011 – $115 million)<br />
of letter of credit facilities expiring mid-2013, of which $120 million was<br />
utilized at December 31, 2012 (2011 – $115 million).<br />
160 . <strong>TELUS</strong> 2012 ANNUAL REPORT<br />
(e) <strong>TELUS</strong> Communications Inc. debentures<br />
The outstanding Series 1 through 5 debentures were issued by a predecessor<br />
corporation of <strong>TELUS</strong> Communications Inc., BC TEL, under<br />
a Trust Indenture dated May 31, 1990, and are non-redeemable.<br />
The outstanding Series B Debentures were issued by a predecessor<br />
corporation of <strong>TELUS</strong> Communications Inc., AGT Limited, under a Trust<br />
Indenture dated August 24, 1994, and a supplemental trust indenture<br />
dated September 22, 1995. They are redeemable at our option, in whole<br />
at any time, or in part from time to time, on not less than 30 days’ notice<br />
at the higher of par and the price calculated to provide the Government<br />
of Canada Yield plus 15 basis points.<br />
Pursuant to an amalgamation on January 1, 2001, the Debentures<br />
became obligations of <strong>TELUS</strong> Communications Inc. The debentures<br />
are not secured by any mortgage, pledge or other charge and are governed<br />
by certain covenants, including a negative pledge and a limitation<br />
on issues of additional debt, subject to a debt to capitalization ratio<br />
and interest coverage test. Effective June 12, 2009, <strong>TELUS</strong> Corporation<br />
guaranteed the payment of the debentures’ principal and interest.<br />
(f) Long-term debt maturities<br />
Anticipated requirements to meet long-term debt repayments, calculated<br />
upon such long-term debts owing as at December 31, 2012, for each<br />
of the next five fiscal years are as follows:<br />
Years ending December 31 (millions)<br />
2013 $ß 545<br />
2014 700<br />
2015 625<br />
2016 600<br />
2017 700<br />
Thereafter<br />
Future cash outflows in respect of<br />
3,124<br />
long-term debt principal repayments<br />
Future cash outflows in respect of<br />
6,294<br />
associated interest and like carrying costs (1) 1,949<br />
Undiscounted contractual maturities (Note 4(c)) $ß8,243<br />
(1) Future cash outflows in respect of associated interest and like carrying costs for<br />
commercial paper and amounts drawn under our credit facilities (if any) have been<br />
calculated based upon the rates in effect as at December 31, 2012.
21<br />
Common Share and Non-Voting Share capital<br />
As at December 31, 2012 and 2011, our authorized share capital consisted<br />
of one billion no par value shares of each of the following classes:<br />
First Preferred Shares; Second Preferred Shares; Common Shares;<br />
and Non-Voting Shares. Only holders of Common Shares may vote at<br />
our general meetings with each holder of Common Shares being entitled<br />
to one vote per Common Share held at all such meetings. Non-Voting<br />
Shares have conversion rights in certain instances, such as if there are<br />
changes in Canadian telecommunications, radiocommunication and<br />
broadcasting regulations so that there is no restriction on non-Canadians<br />
owning or controlling our Common Shares. In that instance, shareholders<br />
have the right to convert their Non-Voting Shares into Common Shares<br />
on a one-for-one basis, and we have the right to require conversion on<br />
the same basis.<br />
With respect to priority in payment of dividends and in the distribution<br />
of assets in the event of our liquidation, dissolution or winding-up,<br />
whether voluntary or involuntary, or any other distribution of our assets<br />
among our shareholders for the purpose of winding up our affairs,<br />
preferences are as follows: First Preferred Shares; Second Preferred<br />
Shares; and finally Common Shares and Non-Voting Shares participating<br />
equally, without preference or distinction.<br />
As at December 31, 2012, approximately 27 million Non-Voting Shares<br />
were reserved for issuance, from Treasury, under the share option plans<br />
(see Note 13(b)).<br />
On February 21, 2012, we announced a proposal which contemplated<br />
a court-approved plan of arrangement under the Business<br />
Corporations Act (British Columbia) providing for, among other things,<br />
the conversion of all outstanding Non-Voting Shares into Common<br />
Shares on a one-for-one basis and the removal of the Non-Voting Shares<br />
from our authorized share structure pursuant to an amendment to<br />
our Articles.<br />
. On April 10, 2012, Mason Capital Management LLC (Mason)<br />
submitted an Alternative Monthly Reporting System Report which<br />
disclosed that funds managed by Mason beneficially owned<br />
approximately 32.7 million Common Shares (18.7% of the class)<br />
and approximately 0.6 million Non-Voting Shares, while Mason,<br />
together with its joint actors, had obligations under securities<br />
lending arrangements to return to lenders approximately 11.0 million<br />
Common Shares and 21.7 million Non-Voting Shares. Mason also<br />
disclosed in the filing that they intended to vote against our proposal.<br />
FINANCIAL STATEMENTS & NOTES: 21<br />
. On May 8, 2012, we announced that we were withdrawing the initial<br />
proposal but that we remained committed to collapsing our dual<br />
class structure on a one-for-one basis in due course.<br />
. On August 2, 2012, Mason, through CDS, the Canadian Depository<br />
for Securities, submitted a requisition for a general meeting of<br />
common shareholders to establish amongst other matters conditions<br />
under which any future share conversion could be completed.<br />
. On August 21, 2012, we announced a new proposal which involved<br />
a court-approved plan of arrangement that provided for a one-time<br />
exchange of all of the issued and outstanding Non-Voting Shares<br />
for Common Shares on a one-for-one basis and no amendments<br />
to our Articles. Approval of the new proposal would be subject<br />
to a simple majority of the votes cast by the holders of Common<br />
Shares and two-thirds of the votes cast by the holders of Non-Voting<br />
Shares, each voting separately as a class.<br />
. On October 15, 2012, we obtained an Order from the Supreme<br />
Court of British Columbia directing that the meeting to consider<br />
our new proposal and the resolutions described in Mason’s<br />
meeting requisition proceed jointly on October 17, 2012. At the<br />
joint meeting, we announced that our plan of arrangement obtained<br />
the necessary approvals from the holders of Common Shares<br />
and holders of Non-Voting Shares and that Mason’s resolutions<br />
had not obtained the necessary approvals. From November 7 to 9,<br />
2012, the Supreme Court of British Columbia held a hearing<br />
to consider the fairness of our new proposal and various appeals<br />
raised by Mason.<br />
. On December 18, 2012, the Supreme Court of British Columbia<br />
approved our proposal and dismissed all appeals raised by Mason.<br />
Mason filed a notice to appeal this decision and obtained a stay<br />
preventing completion of the plan of arrangement.<br />
. On January 25, 2013, Mason and ourselves agreed to abandon<br />
all litigation, allowing the share exchange to be completed effective<br />
February 4, 2013. The agreement did not involve the payment of<br />
funds to either party.<br />
. The effective time of the plan of arrangement is February 4, 2013,<br />
12:01 a.m. Pacific Standard Time.<br />
<strong>TELUS</strong> 2012 ANNUAL REPORT . 161
22<br />
(a) Leases<br />
Commitments and contingent liabilities<br />
We occupy leased premises in various locations and have land, buildings and equipment under operating leases. As set out in Note 19(b), we have<br />
consolidated administrative real estate and, in some instances, this has resulted in subletting land and buildings. The future minimum lease payments<br />
under operating leases are as follows:<br />
Operating lease payments<br />
Land and buildings<br />
Operating<br />
(1)<br />
Vehicles lease receipts<br />
Occupancy and other from sublet land<br />
Years ending December 31 (millions) Rent costs Gross equipment Total and buildings<br />
2013 $ß 186 $ß 92 $ß 278 $ß15 $ß 293 $ß 14<br />
2014 172 88 260 8 268 16<br />
2015 165 89 254 6 260 21<br />
2016 141 77 218 4 222 10<br />
2017 116 71 187 1 188 7<br />
Thereafter 738 486 1,224 – 1,224 34<br />
Total future minimum lease payments<br />
as at December 31, 2012 $ß1,518 $ß903 $ß2,421 $ß34 $ß2,455 $ß102<br />
(1) As set out in Note 17(d), we entered into a lease for our new national headquarters premises with the real estate joint venture, and the associated amounts have been included<br />
in this table.<br />
Operating lease payments<br />
Land and buildings<br />
Vehicles<br />
Operating<br />
lease receipts<br />
Occupancy and other from sublet land<br />
Years ending December 31 (millions) Rent costs Gross equipment Total and buildings<br />
2012 $ß 179 $ß 92 $ß 271 $ß16 $ß 287 $ß 11<br />
2013 165 88 253 8 261 14<br />
2014 151 80 231 4 235 21<br />
2015 136 76 212 3 215 20<br />
2016 123 73 196 1 197 18<br />
Thereafter<br />
Total future minimum lease payments<br />
665 466 1,131 – 1,131 82<br />
as at December 31, 2011 $ß1,419 $ß875 $ß2,294 $ß32 $ß2,326 $ß166<br />
Of the gross amount in respect of land and buildings as at<br />
December 31, 2012:<br />
. approximately 52% (2011 – 56%) of this amount was in respect<br />
of our five largest leases, all of which were for office premises<br />
over various terms, with expiry dates that range from 2022 to 2034<br />
(2011 – range from 2016 to 2026).<br />
. approximately 18% (2011 – 17%) of this amount was in respect<br />
of wireless site leases; the weighted average length of the leases,<br />
which have various terms, is 7 years (2011 – 7 years).<br />
(b) Indemnification obligations<br />
In the normal course of operations, we provide indemnification in<br />
conjunction with certain transactions. The terms of these indemnification<br />
obligations range in duration. In some cases, these indemnifications<br />
would require us to compensate the indemnified parties for costs incurred<br />
as a result of litigation claims or statutory sanctions or damages that<br />
may be suffered by an indemnified party. In many cases, there is<br />
no maximum limit on these indemnification obligations and the overall<br />
162 . <strong>TELUS</strong> 2012 ANNUAL REPORT<br />
maximum amount of such indemnification obligations cannot be<br />
reasonably estimated. Where appropriate, an indemnification obligation<br />
is recorded as a liability. Other than obligations recorded as liabilities<br />
at the time of the transaction, historically we have not made significant<br />
payments under these indemnifications.<br />
In connection with the 2001 disposition of our directory business,<br />
we agreed to bear a proportionate share of the new owner’s increased<br />
directory publication costs if the increased costs were to arise from<br />
a change in the applicable CRTC regulatory requirements. Our proportionate<br />
share is 15% through, and ending, May 2016. As well, should<br />
the CRTC take any action which would result in the owner being<br />
prevented from carrying on the directory business as specified in the<br />
agreement, <strong>TELUS</strong> would indemnify the owner in respect of any<br />
losses that the owner incurs.<br />
See Note 17 for details regarding our guarantees to the <strong>TELUS</strong><br />
Garden real estate joint venture.<br />
As at December 31, 2012, we had no liability recorded in respect<br />
of indemnification obligations.
(c) Claims and lawsuits<br />
General<br />
A number of claims and lawsuits (including class actions) seeking damages<br />
and other relief are pending against us. As well, we have received<br />
or are aware of certain possible claims (including intellectual property<br />
infringement claims) against us and, in some cases, numerous other<br />
wireless carriers and telecommunications service providers.<br />
It is not currently possible for us to predict the outcome of such<br />
claims, possible claims and lawsuits due to various factors, including:<br />
the preliminary nature of some claims; uncertain damage theories and<br />
demands; an incomplete factual record; uncertainty concerning legal<br />
theories, procedures and their resolution by the courts, both at the trial<br />
and the appeal level; and the unpredictable nature of opposing parties<br />
and their demands.<br />
However, subject to the foregoing limitations, management is<br />
of the opinion, based upon legal assessment and information presently<br />
available, that it is unlikely that any liability, to the extent not provided<br />
for through insurance or otherwise, would have a material effect on our<br />
financial position and the results of our operations, with the exception<br />
of the following items.<br />
Certified class actions<br />
Certified class actions against us include a class action brought in<br />
August 2004, in Saskatchewan, against a number of past and present<br />
wireless service providers including us. The claim alleges that each of<br />
the carriers is in breach of contract and has violated competition,<br />
trade practices and consumer protection legislation across Canada<br />
in con nection with the collection of system access fees, and seeks<br />
direct and punitive damages in an unspecified amount. In September<br />
2007, a national class was certified by the Saskatchewan Court of<br />
Queen’s Bench. Our appeal of the certification order was dismissed on<br />
November 15, 2011. An application for leave to appeal this decision<br />
to the Supreme Court of Canada was denied on June 28, 2012. Since<br />
the enactment of opt-out class action legislation in Saskatchewan,<br />
plaintiffs’ counsel applied to certify a new national class in Saskatchewan<br />
23<br />
Related party transactions<br />
(a) Investments in significant controlled entities<br />
As at December 31 2012<br />
Per cent of<br />
2011<br />
Country of equity held by<br />
incorporation immediate parent<br />
Parent entity<br />
<strong>TELUS</strong> Corporation<br />
Controlled entities<br />
Canada<br />
<strong>TELUS</strong> Communications Inc. Canada 100% 100%<br />
TELE-MOBILE COMPANY Canada 100% 100%<br />
<strong>TELUS</strong> Communications Company Canada 100% 100%<br />
FINANCIAL STATEMENTS & NOTES: 22–23<br />
making substantially the same allegations. That application was stayed<br />
by the court in December 2009 upon an application by the defendants<br />
to dismiss it for abuse of process, conditional on possible future changes<br />
in circumstance. The plaintiff’s application for leave to appeal the stay<br />
was heard on November 14, 2012, and the decision was reserved. In late<br />
2011, a further class action relating to system access fees was filed in<br />
British Columbia; this action is not yet certified. We believe that we have<br />
good defences to these actions.<br />
Should the ultimate resolution of these actions differ from management’s<br />
assessments and assumptions, a material adjustment<br />
to our financial position and the results of our operations could result;<br />
management’s assessments and assumptions include that a reliable<br />
estimate of the exposure cannot be made at this preliminary stage<br />
of the lawsuits.<br />
Uncertified class actions<br />
Uncertified class actions against us include: a 2008 class action brought<br />
in Saskatchewan alleging that, among other things, Canadian telecommunications<br />
carriers including us have failed to provide proper notice of<br />
9-1-1 charges to the public and have been deceitfully passing them off<br />
as government charges; a 2008 class action brought in Ontario alleging<br />
that we have misrepresented our practice of “rounding up” wireless<br />
airtime to the nearest minute and charging for the full minute; and a 2012<br />
class action brought in Quebec alleging that we improperly unilaterally<br />
amended customer contracts to increase various wireless service rates.<br />
The plaintiffs in these actions seek direct and punitive damages and<br />
other relief. We are assessing the merits of these claims but the potential<br />
for liability and magnitude of potential loss cannot be readily determined<br />
at this time.<br />
Intellectual property infringement claims<br />
Claims and possible claims received by us include notice of one claim<br />
that certain wireless products used on our network infringe two thirdparty<br />
patents. We are assessing the merits of this claim but the potential<br />
for liability and magnitude of potential loss cannot be readily determined<br />
at this time.<br />
(b) Transactions with key management personnel<br />
Our key management personnel have authority and responsibility for<br />
overseeing, planning, directing and controlling our activities and consist<br />
of our Board of Directors and our Executive Leadership Team.<br />
Total compensation expense for key management personnel, and the<br />
composition thereof, is as follows:<br />
Years ended December 31 (millions) 2012 2011<br />
Short-term benefits $ß11 $ß 9<br />
Post-employment pension (1) and other benefits 6 3<br />
Share-based compensation (2) 21 16<br />
$ß38 $ß28<br />
(1) Our Executive Leadership Team members are either: members of our Pension<br />
Plan for Management and Professional Employees of <strong>TELUS</strong> Corporation and<br />
non-registered, non-contributory supplementary defined benefit pension plans;<br />
or members of one of our defined contribution pension plans.<br />
(2) For the year ended December 31, 2012, share-based compensation is net of<br />
$4 (2011 – $2) of effects of derivatives used to manage share-based compensation<br />
costs (Note 13(b)-(c)).<br />
<strong>TELUS</strong> 2012 ANNUAL REPORT . 163
As disclosed in Note 13, we made awards of share-based compensation<br />
in fiscal 2012 and 2011. In respect of our key management<br />
personnel, for the year ended December 31, 2012, the total fair value,<br />
at date of grant, of restricted stock units awarded was $16 million<br />
(2011 – $15 million); no share options were awarded to our key management<br />
personnel in fiscal 2012 or 2011. As most of these awards<br />
are cliff-vesting or graded-vesting and have multi-year requisite service<br />
periods, the expense will be recognized ratably over a period of years<br />
and thus only a portion of the fiscal 2012 and 2011 awards are included<br />
in the amounts in the table above.<br />
During the year ended December 31, 2012, key management personnel<br />
exercised 703,943 share options (2011 – 736,908 share options)<br />
which had an intrinsic value of $17 million (2011 – $8 million) at the time<br />
of exercise, reflecting a weighted average price at the date of exercise<br />
of $58.61 (2011 – $50.48).<br />
The liability amounts accrued for share-based compensation awards<br />
to key management personnel are as follows:<br />
As at December 31 (millions) 2012 2011<br />
Restricted stock units $ß18 $ß12<br />
Deferred share units (1) 26 22<br />
$ß44 $ß34<br />
(1) Our Directors’ Deferred Share Unit Plan (formerly the Directors Share Option and<br />
Compensation Plan) provides that, in addition to his or her <strong>annual</strong> equity grant of<br />
deferred share units, a director may elect to receive his or her <strong>annual</strong> retainer and<br />
meeting fees in deferred share units, Non-Voting Shares (Common Shares, effective<br />
February 4, 2013 – see Note 21) or cash. Deferred share units entitle directors to<br />
a specified number of, or a cash payment based on the value of, <strong>TELUS</strong>’ Common<br />
Shares and Non-Voting Shares (Common Shares, effective February 4, 2013). Deferred<br />
share units are paid out when a director ceases to be a director, for any reason, at<br />
a time elected by the director in accordance with the Directors’ Deferred Share Unit<br />
Plan; during the year ended December 31, 2012, $3 (2011 – $3) was paid out.<br />
24<br />
Additional financial information<br />
(a) Statement of financial position<br />
As at December 31 (millions) 2012 2011<br />
Accounts receivable<br />
Customer accounts receivable $ß1,261 $ß1,178<br />
Accrued receivables – customer 114 111<br />
Allowance for doubtful accounts (44) (36)<br />
1,331 1,253<br />
Accrued receivables – other 210 172<br />
Other – 3<br />
Inventories<br />
$ß1,541 $ß1,428<br />
(1)<br />
Wireless handsets, parts and accessories $ß 307 $ß 307<br />
Other 43 46<br />
$ß 350 $ß 353<br />
(1) Cost of goods sold for the year ended December 31, 2012 was $1,462<br />
(2011 – $1,522).<br />
164 . <strong>TELUS</strong> 2012 ANNUAL REPORT<br />
Our key management personnel receive telecommunications services<br />
from us, which are immaterial and domestic in nature.<br />
Employment agreements with members of the Executive Leadership<br />
Team typically provide for severance payments if an executive’s employment<br />
is terminated without cause: 18 months (24 months for the<br />
Chief Executive Officer) of base salary, benefits and accrual of pension<br />
service in lieu of notice and 50% of base salary in lieu of an <strong>annual</strong><br />
cash bonus (other than for the Chief Executive Officer, who would receive<br />
twice the average of the preceding three years’ <strong>annual</strong> cash bonus).<br />
In the event of a change in control (as defined), the Executive Leadership<br />
Team members are not entitled to treatment any different than our<br />
other employees with respect to unvested share-based compensation,<br />
other than the Chief Executive Officer, whose unvested share-based<br />
compensation would immediately vest.<br />
(c) Transactions with defined benefit pension plans<br />
During the year ended December 31, 2012, we provided management<br />
and administrative services to our defined benefit pension plans; the<br />
charges for these services were on a cost recovery basis and amounted<br />
to $5 million (2011 – $5 million).<br />
During the years ended December 31, 2012 and 2011, we made<br />
employer contributions to our defined benefit pension plans as set out<br />
in Note 14(a).<br />
(d) Transactions with real estate joint venture<br />
During the year ended December 31, 2012, we had transactions with the<br />
real estate joint venture, which is a related party, as set out in Note 17.<br />
As at December 31 (millions) 2012 2011<br />
Accounts payable and accrued liabilities<br />
Accrued liabilities $ß 611 $ß 579<br />
Payroll and other employee related liabilities 332 287<br />
Restricted stock units liability<br />
Accrual for net-cash settlement feature<br />
34 29<br />
for share option awards (Note 13(b)) – 3<br />
977 898<br />
Trade accounts payable 423 406<br />
Interest payable 65 68<br />
Other 46 47<br />
Advance billings and customer deposits<br />
$ß1,511 $ß1,419<br />
Advance billings $ß 627 $ß 575<br />
Regulatory deferral accounts 23 24<br />
Deferred customer activation and connection fees 26 32<br />
Customer deposits 27 24<br />
$ß 703 $ß 655
As at December 31 (millions) 2012 2011<br />
Other long-term liabilities<br />
Pension and other post-retirement liabilities $ßß1,415 $ßß1,053<br />
Other<br />
Restricted stock units and<br />
116 116<br />
deferred share units liabilities 38 35<br />
1,569 1,204<br />
Regulatory deferral accounts 60 77<br />
Deferred customer activation and connection fees 51 59<br />
Deferred gain on sale-leaseback of buildings 2 3<br />
$ßß1,682 $ßß1,343<br />
(b) Supplementary cash flow information<br />
Years ended December 31 (millions) Note 2012 2011<br />
Net change in non-cash operating<br />
working capital<br />
Accounts receivable $ß (113) $ß (79)<br />
Inventories 3 (69)<br />
Prepaid expenses (34) (36)<br />
Accounts payable and accrued liabilities<br />
Income and other taxes receivable<br />
69 (47)<br />
and payable, net 118 13<br />
Advance billings and customer deposits 48 (3)<br />
Provisions (39) (34)<br />
Cash payments for capital assets,<br />
excluding spectrum licences<br />
Capital asset additions, excluding<br />
spectrum licences<br />
Capital expenditures<br />
$ßß 52 $ß (255)<br />
Property, plant and equipment 15 $ß(1,563) $ß(1,457)<br />
Intangible assets 16(a) (418) (390)<br />
Additions arising from asset<br />
(1,981) (1,847)<br />
retirement obligations (49) (15)<br />
Non-cash items included above<br />
Change in associated non-cash<br />
(2,030) (1,862)<br />
investing working capital<br />
Non-cash change in asset<br />
33 (20)<br />
retirement obligation 47 15<br />
80 (5)<br />
$ß(1,950) $ß(1,867)<br />
FINANCIAL STATEMENTS & NOTES: 24<br />
Years ended December 31 (millions) Note 2012 2011<br />
Cash payments for acquisitions<br />
and related investments<br />
Acquisitions and related investments 16(e) $ß (82) $ß (110)<br />
Cash acquired<br />
Change in associated non-cash<br />
2 –<br />
investing working capital (4) 9<br />
Change in associated non-current provisions 31 –<br />
Proceeds on dispositions<br />
$ß (53) $ß (101)<br />
Proceeds on dispositions<br />
Change in associated non-cash<br />
$ßß 16 $ßß 4<br />
investing working capital 4 (4)<br />
Dividends paid to holders of Common<br />
$ßß 20 $ßß –<br />
Shares and Non-Voting Shares<br />
Dividends declared in a previous fiscal<br />
12<br />
period, payable in current fiscal period<br />
Re-invested in Non-Voting Shares<br />
$ß (188) $ß (169)<br />
issued from Treasury – 54<br />
Current period dividends<br />
(188) (115)<br />
Declared (794) (715)<br />
Payable at end of period 208 188<br />
(586) (527)<br />
Long-term debt issued<br />
$ß (774) $ß (642)<br />
<strong>TELUS</strong> Corporation Commercial Paper $ßß5,488 $ßß3,468<br />
Other 500 600<br />
Redemptions and repayment<br />
of long-term debt<br />
$ßß5,988 $ßß4,068<br />
<strong>TELUS</strong> Corporation Commercial Paper $ß(6,009) $ß(2,806)<br />
Other (300) (1,140)<br />
$ß(6,309) $ß(3,946)<br />
<strong>TELUS</strong> 2012 ANNUAL REPORT . 165
Glossary<br />
3G (third generation): Describes wireless technology that offers<br />
high-speed packet data mobile wireless Internet access and multimedia<br />
capabilities. 3G commonly refers to HSPA networks.<br />
4G (fourth generation): As defined by the International Telecommunications<br />
Union, 4G is the next generation of wireless technologies,<br />
including HSPA+ and LTE, which offers a substantial improvement in<br />
speed over HSPA.<br />
ADSL2+ (asymmetric digital subscriber line 2+): An IP technology<br />
that allows existing copper telephone lines to carry voice, data and video,<br />
and enables three simultaneous video streams into a home.<br />
app: A program or application that delivers functionality to users on<br />
their mobile device, television or computer to address a specific need<br />
or purpose.<br />
AWS (advanced wireless services) spectrum: AWS spectrum<br />
in the 1.7 and 2.1 GHz ranges that is utilized in North America for 4G<br />
services. It is commonly used in urban and suburban areas but,<br />
due to propagation limitations, is not economical for rural deployment.<br />
broadband: Refers to telecommunications services that allow highspeed<br />
transmission of voice, data and video simultaneously at rates<br />
of 1.5 Mbps and above.<br />
CDMA (code division multiple access): A wireless technology that<br />
spreads a signal over a frequency band that is larger than the signal to<br />
enable the use of a common band by many users and to achieve signal<br />
security and privacy.<br />
cloud computing: A system in which software, data and services reside<br />
in data centres accessed over the Internet from any connected device.<br />
CRTC (Canadian Radio-television and Telecommunications<br />
Commission): The federal regulator for radio and television broadcasters,<br />
and cable-TV and telecommunications companies in Canada.<br />
digital: A transmission method employing a sequence of discrete,<br />
distinct pulses that represent binary digits 0 and 1 to indicate specific<br />
information, in contrast to the continuous signal of analogue. Digital<br />
networks provide improved clarity, capacity, features and privacy<br />
compared to analogue systems.<br />
EVDO (evolution data optimized): Part of the CDMA family of<br />
standards, EVDO is a wireless radio broadband protocol that delivers<br />
data download rates of up to 2.4 Mbps. EVDO Rev A increased data<br />
download rates to up to 3.1 Mbps.<br />
fibre network: Hair-thin glass fibres along which light pulses are<br />
transmitted. Fibre networks are used to transmit large amounts of data<br />
between locations.<br />
166 . <strong>TELUS</strong> 2012 ANNUAL REPORT<br />
forbearance: Policies refraining from the regulation of telecom services,<br />
allowing for greater reliance on competition and market forces.<br />
FTTx (fibre to the x): A collective term for any broadband network<br />
architecture using optical fibre to replace all or part of the existing copper<br />
local loops. FTTH denotes fibre to the home, while FTTN can denote<br />
node or neighbourhood.<br />
GPON (gigabit-capable passive optical network): A fibre-based<br />
transmission technology that delivers data download rates of up to<br />
2.5 Gbps and upload rates of up to 1.25 Gbps.<br />
hosting: The management of data, which incorporates the business<br />
of housing, serving and maintaining files for one or more websites.<br />
HSPA+ (high-speed packet access plus): A 4G technology capable<br />
of delivering manufacturer-rated wireless data download speeds of up<br />
to 21 Mbps (typical speeds of 4 to 6 Mbps expected).<br />
HSPA+ dual-cell technology: A 4G technology that uses advanced<br />
multiplexing techniques to combine two wireless data carriers, each<br />
capable of delivering download speeds of up to 21 Mbps, into a single<br />
carrier with manufacturer-rated download speeds of up to 42 Mbps<br />
(typical speeds of 7 to 14 Mbps expected).<br />
IDC (Internet data centre): A facility for hosted applications and<br />
data storage and management. Through <strong>TELUS</strong>’ IDCs, we manage<br />
applications and content for our customers, including email, web<br />
hosting, voice / text messaging services, e-commerce, data archiving,<br />
personal content and advanced web services.<br />
iDEN (integrated digital enhanced network): A digital network<br />
technology developed by Motorola, utilizing 800 MHz channels, that<br />
<strong>TELUS</strong> uses for its Mike service, which also includes PTT service.<br />
ILEC (incumbent local exchange carrier): An established<br />
telecommunications company providing local telephone service.<br />
IP (Internet protocol): A packet-based protocol for delivering data<br />
across networks.<br />
IP-based network: A network designed using IP and QoS (quality<br />
of service) technology to reliably and efficiently support all types of<br />
customer traffic, including voice, data and video. An IP-based network<br />
enables a variety of IP devices and advanced applications to<br />
communicate over a single common network.<br />
IP TV (Internet protocol television): Television service that uses a<br />
two-way digital broadcast signal sent through a switched telephone or<br />
other network by way of streamed broadband connection to a dedicated<br />
set-top box. The <strong>TELUS</strong> service is trademarked as Optik TV.
local loop: The transmission path between the telecommunications<br />
network and a customer’s terminal equipment.<br />
LTE (long-term evolution): A 4G mobile telecommunications<br />
technology, capable of advanced wireless broadband speeds, that has<br />
emerged as the leading global wireless industry standard. <strong>TELUS</strong>’ 4G<br />
LTE coverage is capable of delivering manufacturer-rated peak download<br />
speeds of up to 75 Mbps (typical speeds of 12 to 25 Mbps expected).<br />
Mbps (megabits per second): A measurement of data transmission<br />
speed for the amount of data transferred in a second between two<br />
telecommunications points or within a network. Mbps is millions of bits<br />
per second and Gbps (gigabits per second) is billions.<br />
MDU (multiple dwelling unit): An apartment or condominium.<br />
MMS (multimedia messaging service): Allows wireless customers<br />
to send and receive messages that contain formatted text, graphics,<br />
photographs, and audio and video clips.<br />
non-ILEC (non-incumbent local exchange carrier): The telecommunications<br />
operations of <strong>TELUS</strong> outside its traditional ILEC operating<br />
territories, where <strong>TELUS</strong> competes with the incumbent telephone<br />
company (e.g. Ontario, most of Quebec, etc.).<br />
OTT (over-the-top): Content, services and applications in a video<br />
environment where the delivery occurs through a medium other than<br />
the main video delivery infrastructure.<br />
PCS (personal communications services): Digital wireless voice,<br />
data and text messaging services in the 1.9 GHz frequency range.<br />
penetration: The degree, expressed as a percentage, to which a<br />
product or service has been adopted by a base of potential customers<br />
in a given geographic area or market segment.<br />
POP: One person living in a populated area that is included in a<br />
network’s coverage area.<br />
postpaid: A conventional method of payment for service where a<br />
subscriber is billed and pays for a significant portion of services and<br />
usage in arrears, after consuming the services.<br />
prepaid: A method of payment for wireless service that allows a<br />
customer to prepay for a set amount of airtime and/or data in advance<br />
of actual usage.<br />
PTT (Push to Talk): A two-way communication service that works<br />
like a walkie-talkie using a button switch. With PTT, communication<br />
can only travel in one direction at any given moment. We provide PPT<br />
through the <strong>TELUS</strong> Mike service using iDEN technology.<br />
GLOSSARY<br />
PVR (personal video recorder): An interactive TV set-top box that<br />
records and plays back video content.<br />
roaming: A service offered by wireless network operators that allows<br />
subscribers to use their mobile phones while in the service area of<br />
another operator.<br />
set-top box: A device that connects to a television and converts a signal<br />
into content that is displayed by the television. In IP TV, a set-top box<br />
allows two-way communications on the IP network.<br />
SIM (subscriber identification module) card: A small electronic<br />
chip used to identify a particular wireless subscriber on the network as<br />
a legitimate user. Subscribers can switch between devices and carrier<br />
networks by removing the SIM card and inserting it into another unlocked<br />
mobile device. The SIM card can store personal information, phone<br />
numbers, text messages and other data.<br />
spectrum: The range of electromagnetic radio frequencies used in<br />
the transmission of sound, data and video. The capacity of a wireless<br />
network is in part a function of the amount of spectrum licensed and<br />
utilized by the carrier.<br />
VDSL2 (very high bit-rate digital subscriber line 2): Fibre-to-thenode<br />
technology offering typical data download speeds of 5 to 25 Mbps,<br />
which enables four simultaneous video streams into a home. These rates<br />
can be increased further by bonding multiple lines together.<br />
VOD (video on demand): An interactive TV technology that allows<br />
customers to access content at their convenience, allowing them to<br />
view programming in real time or download and view it later. SVOD<br />
(subscription VOD) provides customers with unlimited access to specific<br />
subscribed programming.<br />
VoIP (voice over Internet protocol): The transmission of voice signals<br />
over the Internet or IP network.<br />
Wi-Fi (wireless fidelity): The commercial name for networking<br />
technology that allows any user with a Wi-Fi-enabled device to connect<br />
to a wireless access point (e.g. hotspot) in high-traffic public locations,<br />
usually for free.<br />
For financial definitions, see Section 11<br />
of Management’s discussion and analysis<br />
in this <strong>report</strong>.<br />
<strong>TELUS</strong> 2012 ANNUAL REPORT . 167
Investor information<br />
Stock exchanges and <strong>TELUS</strong> trading symbols<br />
Toronto Stock Exchange (TSX)<br />
Common shares T CUSIP: 87971M103<br />
New York Stock Exchange (NYSE)<br />
Common shares TU CUSIP: 87971M103<br />
(listed on February 4, 2013)<br />
Member of<br />
. S&P/TSX Composite Index . S&P/TSX 60 Index<br />
. S&P/TSX Telecom Index . FTSE4Good Index<br />
. Jantzi Social Index . MSCI World Telecom Index<br />
. Dow Jones Sustainability North America Index<br />
Estimated share<br />
ownership 1<br />
18%<br />
168 . <strong>TELUS</strong> 2012 ANNUAL REPORT<br />
Share exchange facts<br />
. Following a shareholder and<br />
court-approved plan of arrangement,<br />
non-voting shares (CUSIP:<br />
87971M202) were exchanged<br />
one-for-one for common shares<br />
effective February 4, 2013<br />
. Non-voting shares (CUSIP:<br />
87971M202) were delisted<br />
from the NYSE on February 4,<br />
82% 2013 and from the TSX on<br />
Canada<br />
February 8, 2013<br />
Foreign<br />
. Common shares were listed and<br />
1 Common and non-voting began trading on the NYSE for<br />
share ownership as of<br />
December 31, 2012.<br />
the first time on February 4, 2013<br />
under the symbol TU, the same<br />
symbol under which the non-voting shares had traded previously<br />
. Common shares continue to trade under the symbol T on the TSX.<br />
Registered shareholders 1 at December 31, 2012<br />
2012 2011<br />
<strong>TELUS</strong> common 30,586 30,616<br />
<strong>TELUS</strong> non-voting 26,610 27,281<br />
1 The Canadian Depository for Securities (CDS) represents one registration and holds<br />
securities for many institutions. At the end of 2012, it was estimated that <strong>TELUS</strong> had<br />
approximately 290,000 non-registered shareholders combined in the two classes<br />
of shares.<br />
Ownership at December 31, 2012<br />
Number of<br />
shares held % of total<br />
<strong>TELUS</strong> Employee Share Plan 7,640,800 2.3<br />
Common shares widely held 167,386,063 51.4<br />
Non-voting shares widely held 150,936,169 46.3<br />
Total outstanding shares 325,963,032 100.0<br />
<strong>TELUS</strong> estimates that approximately three-quarters of its shares are held<br />
by institutional investors and one-quarter by retail investors.<br />
Dividend developments<br />
The January 2013 quarterly dividend paid was 64 cents or $2.56 on an<br />
<strong>annual</strong>ized basis, representing a 10.3% increase from the previous year.<br />
In 2012, we increased the dividend twice by three cents.<br />
In May 2011, we announced plans to continue with two dividend<br />
increases per year to 2013, normally declared in May and November, and<br />
expect the increase to be in the range of circa 10% <strong>annual</strong>ly. Dividend<br />
decisions continue to be subject to the Board’s assessment and determination<br />
of the Company’s financial situation and outlook.<br />
<strong>TELUS</strong> advises that, unless noted otherwise, all common and nonvoting<br />
share quarterly dividends paid since January 2006 are eligible<br />
dividends under the Income Tax Act. Under this legislation, Canadian<br />
residents may be entitled to enhanced dividend tax credits that reduce<br />
the income tax otherwise payable. More information is available at<br />
telus.com/dividends.<br />
Total dividends to shareholders ($ millions)<br />
12<br />
11<br />
10<br />
09<br />
08<br />
07<br />
Fourth quarter dividend shown in declaration year.<br />
521<br />
601<br />
584<br />
642<br />
Dividend reinvestment and share purchase plan<br />
As of February 4, 2013, the dividend reinvestment and share purchase<br />
plan has been amended so that purchases and issuances in the plan<br />
are common shares.<br />
Investors may take advantage of automatic dividend reinvestment<br />
to acquire additional shares without fees. Under this feature, eligible<br />
shareholders have had their common and non-voting share dividends<br />
reinvested automatically into additional non-voting shares acquired<br />
at market price up to January 2013.<br />
Under the share purchase feature, eligible shareholders can, on a<br />
monthly basis, buy <strong>TELUS</strong> common shares (maximum $20,000 per calendar<br />
year and minimum $100 per transaction) at market price without<br />
brokerage commissions or service charges. Previously, non-voting shares<br />
were acquired with optional cash payments. After February 4, 2013,<br />
common shares will be acquired with the optional cash payments.<br />
715<br />
Visit telus.com/drisp or contact<br />
Computershare for information<br />
and enrolment forms.<br />
794
2013 planned dividend 1 and earnings release dates<br />
Per-share data<br />
INVESTOR INFORMATION<br />
2012 2011 2010<br />
(IFRS) (IFRS) (IFRS) 2009 2008 2007 2006 2005<br />
Basic earnings1 $ß 4.05 $ß 3.76 $ß 3.27 $ß 3.14 $ß 3.52 $ß 3.79 $ß 3.33 $ß 2.01<br />
Dividends declared1 Dividends declared as<br />
$ß 2.44 $ß2.205 $ß 2.00 $ß 1.90 $ß1.825 $ß1.575 $ß 1.20 $ß0.875<br />
per cent of basic earnings 60% 59% 61% 61% 52% 42% 36% 44%<br />
Free cash flow1 $ß 4.06 $ß 3.08 $ß 2.93 $ß 1.53 $ß 1.13 $ß 4.18 $ß 4.19 $ß 3.74<br />
Common shares<br />
Closing price $ß65.10 $ß57.64 $ß45.48 $ß34.11 $ß37.17 $ß49.44 $ß53.52 $ß47.86<br />
Dividend yield 3.7% 3.8% 4.4% 5.6% 4.9% 3.2% 2.2% 1.8%<br />
Price to earnings ratio 16 15 14 11 11 13 16 24<br />
Non-voting shares<br />
Closing price $ß64.68 $ß54.64 $ß43.25 $ß32.75 $ß34.90 $ß48.01 $ß52.03 $ß46.67<br />
Dividend yield 3.8% 4.0% 4.6% 5.8% 5.2% 3.3% 2.3% 1.9%<br />
Price to earnings ratio 16 15 13 10 10 13 16 23<br />
1 Per common and non-voting share.<br />
Share prices and volumes<br />
Toronto Stock Exchange<br />
Common shares (T) 2012 2011<br />
(C$ except volume) Year 2012 Q4 Q3 Q2 Q1 Year 2011 Q4 Q3 Q2 Q1<br />
High 65.96 65.96 65.39 61.24 59.98 57.74 57.74 55.04 53.59 49.98<br />
Low 55.19 61.14 60.25 57.11 55.19 44.98 50.00 49.47 48.08 44.98<br />
Close 65.10 65.10 62.01 61.14 57.88 57.64 57.64 51.35 53.10 49.57<br />
Volume (millions) 1 250.7 64.7 46.8 53.0 86.2 145.8 39.7 38.9 32.5 34.7<br />
Dividend declared (per share) 2.44 0.64 0.61 0.61 0.58 2.205 0.58 0.55 0.55 0.525<br />
Non-voting shares (T.A) 2012 2011<br />
(C$ except volume) Year 2012 Q4 Q3 Q2 Q1 Year 2011 Q4 Q3 Q2 Q1<br />
High 65.57 65.57 63.89 59.94 58.61 54.77 54.77 52.67 51.39 47.98<br />
Low 52.90 60.68 59.50 55.62 52.90 42.90 47.45 46.86 46.00 42.90<br />
Close 64.68 64.68 61.50 59.57 56.75 54.64 54.64 48.85 50.82 47.10<br />
Volume (millions) 1 154.5 36.8 28.6 26.6 62.4 80.1 24.3 21.4 15.6 18.7<br />
Dividend declared (per share) 2.44 0.64 0.61 0.61 0.58 2.205 0.58 0.55 0.55 0.525<br />
1 In addition, 133 million common shares and 94 million non-voting shares traded on alternative exchanges in 2012, as compared to 68 million common shares and 37 million<br />
non-voting shares in 2011.<br />
New York Stock Exchange<br />
Ex-dividend dates 2 Dividend record dates Dividend payment dates Earnings release dates<br />
Quarter 1 March 7 March 11 April 1 May 9<br />
Quarter 2 June 6 June 10 July 2 August 8<br />
Quarter 3 September 6 September 10 October 1 November 8<br />
Quarter 4 December 9 December 11 January 2, 2014 February 14, 2014<br />
1 Dividends are subject to Board of Directors’ approval.<br />
2 Shares purchased on this date forward will not be entitled to the dividend payable on the corresponding dividend payment date.<br />
Non-voting shares (TU) 2012 2011<br />
(US$ except volume) Year 2012 Q4 Q3 Q2 Q1 Year 2011 Q4 Q3 Q2 Q1<br />
High 66.54 66.54 64.59 58.97 58.78 55.15 53.75 55.15 53.04 48.95<br />
Low 51.56 61.21 58.15 55.10 51.56 43.09 44.63 46.20 47.80 43.09<br />
Close 65.14 65.14 62.53 58.48 56.84 53.55 53.55 46.24 52.60 48.49<br />
Volume (millions) 26.4 4.7 7.7 5.7 8.2 35.1 8.3 12.7 8.1 6.0<br />
Dividend declared (per share) 2.441 0.647 0.621 0.593 0.58 2.233 0.572 0.557 0.562 0.542<br />
<strong>TELUS</strong> 2012 ANNUAL REPORT . 169
<strong>TELUS</strong> shares – five-year daily closing prices ($)<br />
70<br />
60<br />
50<br />
TSX (C$)<br />
40 NYSE (US$)<br />
30<br />
20<br />
175<br />
150<br />
125<br />
100<br />
75<br />
50<br />
Q1 Q2 Q3 Q4 Q1 Q2 Q3 Q4 Q1 Q2 Q3 Q4 Q1 Q2 Q3 Q4 Q1 Q2 Q3 Q4<br />
2008 2009 2010 2011 2012<br />
Assuming an investment of $100 on December 31, 2007<br />
and reinvestment of dividends<br />
170 . <strong>TELUS</strong> 2012 ANNUAL REPORT<br />
Toronto Stock Exchange<br />
Common (T)<br />
Non-voting (T.A)<br />
New York Stock Exchange<br />
Non-voting (TU)<br />
<strong>TELUS</strong> total shareholder return comparison ($)<br />
<strong>TELUS</strong> common shares<br />
S&P/TSX Composite Index<br />
MSCI World Telecom Index<br />
Q1 Q2 Q3 Q4 Q1 Q2 Q3 Q4 Q1 Q2 Q3 Q4 Q1 Q2 Q3 Q4 Q1 Q2 Q3 Q4<br />
2008 2009 2010 2011 2012<br />
<strong>TELUS</strong> Corporation notes<br />
Canadian dollar Notes Rate Face value Maturing<br />
Series CB 5.0% $300 million June 2013<br />
Series CF 4.95% $700 million May 2014<br />
Series CE 5.95% $500 million April 2015<br />
Series CI 3.65% $600 million May 2016<br />
Series CD 4.95% $700 million March 2017<br />
Series CG 5.05% $1.0 billion December 2019<br />
Series CH 5.05% $1.0 billion July 2020<br />
Series CJ 3.35% $500 million March 2023<br />
For details and a complete list of notes, debentures and other publicly<br />
traded debt of the Company and the Company’s subsidiaries, refer to<br />
Note 20 of the Consolidated financial statements.<br />
Credit rating summary<br />
Standard & Moody’s<br />
Poor’s Rating Investors Fitch<br />
As of December 31, 2012<br />
<strong>TELUS</strong> Corporation<br />
DBRS Ltd. Services Service Ratings<br />
Notes A (low) BBB+ Baa1 BBB+<br />
Commercial paper R-1 (low) – – –<br />
<strong>TELUS</strong> Communications Inc.<br />
Debentures A (low) BBB+ – BBB+<br />
$166<br />
$104<br />
Long-term debt principal maturities<br />
as at December 31, 2012 ($ millions)<br />
2025<br />
2024<br />
200<br />
2023<br />
500<br />
2022 249<br />
2021<br />
2020<br />
2019<br />
2018<br />
175<br />
2017<br />
700<br />
2016 600<br />
2015<br />
625<br />
2014<br />
700<br />
1,000<br />
1,000<br />
2013 300 245 545<br />
<strong>TELUS</strong> Corporation notes and <strong>TELUS</strong> Communications Inc. debentures<br />
<strong>TELUS</strong> Corporation commercial paper<br />
<strong>TELUS</strong> has an excellent debt maturity schedule with only $1 billion<br />
or less coming due each year, which reduces refinancing and<br />
capital market risk.<br />
$95
Investor relations activities<br />
Conferences and meetings 2012 2011<br />
Conference calls with webcast:<br />
Quarterly earnings calls and targets call 4 5<br />
Shareholder meetings 2 1<br />
Investor conference presentations and tours 7 7<br />
Investor meetings 137 167<br />
For certain investor meetings and to reduce travel expenses and time,<br />
we use Cisco Telepresence, a high-definition video-conference service,<br />
between <strong>TELUS</strong> locations across Canada.<br />
Key <strong>TELUS</strong> investment events<br />
. We launched our next generation 4G LTE wireless network and by<br />
year-end it provided coverage to more than two-thirds of Canadians<br />
. We began construction of the <strong>TELUS</strong> Garden office tower and the<br />
sold-out 415-unit condo tower in Vancouver, which are scheduled for<br />
occupancy in 2014 and 2015, respectively. <strong>TELUS</strong> Garden is a real<br />
estate joint venture between <strong>TELUS</strong> and Westbank<br />
. Consistent with our plan for two dividend increases per year to<br />
2013, we raised the dividend in February and November, bringing<br />
the quarterly dividend to 64 cents or $2.56 <strong>annual</strong>ly, up 10.3%<br />
from the previous year<br />
. In November, Robert McFarlane, EVP and CFO of 12 years,<br />
announced he would retire at the end of 2012. At the same time,<br />
John Gossling was announced as EVP and next CFO<br />
. In December, we issued $500 million of 10-year 3.35% senior<br />
unsecured notes with the proceeds applied to repay short-term<br />
commercial paper<br />
. We made several small acquisitions in electronic medical records,<br />
wireless distribution and international contact centre operations.<br />
Share exchange proposal<br />
. On February 21, we proposed the conversion of <strong>TELUS</strong> non-voting<br />
shares into voting shares on a one-for-one basis if approved by<br />
two-thirds of votes cast by holders of common shares and two-thirds<br />
of votes cast by holders of non-voting shares<br />
. On March 22, we advised that non-Canadian common share<br />
ownership was approaching the federal limit of 33.3% due to<br />
purchases by an unidentified hedge fund. On April 10, Mason Capital<br />
disclosed an approximate 19% common share ownership position<br />
offset by short positions in non-voting and common shares<br />
. On May 8, unable to attain common shareholder approval, we<br />
withdrew the proposal despite 92.4% overall shareholder support,<br />
excluding Mason’s common share position<br />
. On August 21, a new share exchange proposal was introduced on<br />
a one-for-one basis with one key modification – it required approval<br />
of a simple majority of the votes cast by holders of common shares<br />
and two-thirds approval by holders of non-voting shares<br />
. On October 17, the share exchange proposal was approved by<br />
62.9% of the 128.8 million common shares voted and 99.5% of<br />
the 127.7 million non-voting shares voted<br />
. On December 18, the Supreme Court of B.C. gave the share<br />
exchange final approval, and on January 25, 2013, Mason and<br />
<strong>TELUS</strong> agreed to abandon all litigation. The share exchange<br />
was effective on February 4, 2013.<br />
Awards<br />
INVESTOR INFORMATION<br />
. Captured top honours at the Corporate Reporting Awards from<br />
the Canadian Institute of Chartered Accountants for the fifth time<br />
in six years, and received Honourable Mentions for Excellence in<br />
Sustainable Development and Corporate Governance Disclosures<br />
. The <strong>TELUS</strong> 2011 <strong>annual</strong> <strong>report</strong> placed 14th in the world in the Annual<br />
Report on Annual Reports, making us one of only two companies<br />
to rank in the top 15 for the past nine years<br />
. Investor Relations Magazine Canada ranked <strong>TELUS</strong> as having<br />
the best financial <strong>report</strong>ing and fourth best investor relations team<br />
. Received one of the inaugural Prime Minister’s Volunteer Awards<br />
for Business Leader (British Columbia and the North)<br />
. Recognized by Mediacorp Canada as one of:<br />
. Canada’s Top 100 Employers for fourth year<br />
. Canada’s Greenest Employers<br />
. Canada’s Best Diversity Employers for fourth year<br />
. Canada’s Best Employers for Young People for second year<br />
. Canada’s Best Employers for New Canadians for second year<br />
. Named one of Canada’s 10 Most Admired Corporate Cultures<br />
by Waterstone Human Capital and inducted into its Hall of Fame<br />
. Recognized for corporate social responsibility by being included in the:<br />
. Dow Jones Sustainability North America Index for 12th year<br />
. Corporate Knights 2013 Global 100 Most Sustainable Corporations<br />
. Carbon Disclosure Leadership Index<br />
. Canada’s Top 50 Socially Responsible Corporations for fourth<br />
year by Maclean’s / Sustainalytics<br />
. NASDAQ OMX CRD Global Sustainability Index<br />
. First organization to be named Philanthropic Company of the Year<br />
by the Association of Fundraising Professionals – Quebec Chapter<br />
. Received the BEST award for employee learning and development<br />
from American Society for Training and Development for seventh year.<br />
Analyst coverage<br />
As of February 2013, 17 equity analysts covered <strong>TELUS</strong>. For a detailed<br />
list, see the investor information section at telus.com/investors.<br />
Information for security holders outside of Canada<br />
Cash dividends paid to shareholders resident in countries with which<br />
Canada has an income tax convention are usually subject to Canadian<br />
non-resident withholding tax of 15%. If you have any questions, contact<br />
Computershare. For individual investors who are U.S. citizens and/or<br />
U.S. residents, quarterly dividends paid on <strong>TELUS</strong> Corporation common<br />
and non-voting shares are considered qualified dividends under the<br />
Internal Revenue Code and may be eligible for special U.S. tax treatment.<br />
Foreign ownership monitoring – non-Canadian<br />
common shares<br />
Under federal legislation, total non-Canadian ownership of common<br />
shares of Canadian telecommunications companies, including <strong>TELUS</strong>, is<br />
limited to 331 ⁄3%. For registered shareholders and shares trading on the<br />
TSX, a reservation system controls and monitors this level. This system<br />
requires non-Canadian purchasers of common shares to obtain a reservation<br />
number from Computershare by contacting the Reservations Unit<br />
at 1-877-267-2236 (toll-free) or telusreservations@computershare.com.<br />
The purchaser is notified within two hours if common shares are available<br />
for registration. For shares trading on the NYSE, non-Canadian ownership<br />
is monitored by utilizing Depository Trust & Clearing Corporation’s<br />
SEG-100 Account program.<br />
<strong>TELUS</strong> 2012 ANNUAL REPORT . 171
e-delivery of shareholder documents<br />
We invite you to sign up for electronic delivery of <strong>TELUS</strong> information by visiting telus.com/electronicdelivery. The benefits of e-delivery include<br />
access to important Company documents in a convenient, timely and environmentally friendly way that also reduces printing and mailing costs.<br />
Approximately 46,000 of our shareholders receive information by e-delivery.<br />
Registered shareholders<br />
Registered shareholders may access Company documents at telus.com or by registering online at www.computershare.com/eDelivery.<br />
If you DO NOT want to receive an <strong>annual</strong> <strong>report</strong>, you may do one of the following:<br />
. Phone 1-800-558-0046<br />
. email telus@computershare.com, providing your name and account number, and indicate that you do not want to receive an <strong>annual</strong> <strong>report</strong>,<br />
or<br />
. Visit Computershare’s website at www.computershare.com/eDelivery, download and complete the e-delivery form and mail to Computershare.<br />
Beneficial shareholders<br />
For shareholders who hold their shares with an investment dealer or financial institution, access investordeliverycanada.com or contact your<br />
investment advisor to enrol for the convenient electronic delivery service.<br />
Annual meeting of shareholders<br />
On Thursday, May 9, 2013, the <strong>annual</strong> meeting will be held at 10 a.m. (local time) at the Palais des congrès de Montréal located at 1001 Place<br />
Jean-Paul-Riopelle, Montreal, Quebec H2Z 1H5. An Internet webcast, complete with video and audio, will be available to shareholders around<br />
the world. Shareholders unable to attend the meeting in person can vote by Internet, telephone or mail. Visit telus.com/agm for details.<br />
For more information<br />
For questions on:<br />
. Direct registration system (DRS) advice or accounts<br />
. Dividend payments and the Dividend Reinvestment and Share<br />
Purchase Plan<br />
. Change of address and e-delivery of shareholder documents<br />
. Transfer or loss of share certificates and estate settlements<br />
. Exchange of share certificates due to a merger or acquisition<br />
Contact the transfer agent and registrar:<br />
Computershare Trust Company of Canada<br />
1-800-558-0046 or +1 (514) 982-7129 (outside North America)<br />
email: telus@computershare.com<br />
Visit: computershare.com<br />
<strong>TELUS</strong> executive office<br />
555 Robson Street<br />
Vancouver, British Columbia<br />
Canada V6B 3K9<br />
phone (604) 697-8044<br />
fax (604) 432-9681<br />
Merger and acquisitions – shareholder impacts<br />
Visit telus.com/m&a for information on how your shareholdings have been affected by various<br />
merger and acquisition transactions (BC TELECOM and <strong>TELUS</strong> in 1999, QuébecTel in 2000,<br />
Clearnet in 2000 and Emergis in 2008). Information is also available at telus.com/m&a regarding<br />
capital gains, valuation dates and prices for 1971 and 1994.<br />
172 . <strong>TELUS</strong> 2012 ANNUAL REPORT<br />
<strong>TELUS</strong> general information<br />
British Columbia (604) 432-2151<br />
Alberta (403) 530-4200<br />
Ontario (416) 279-9000<br />
Quebec (514) 665-3050<br />
For questions on:<br />
. Additional financial or statistical information<br />
. Industry and Company developments<br />
. The latest news releases and investor presentations<br />
Contact <strong>TELUS</strong> Investor Relations:<br />
1-800-667-4871 or +1 (604) 643-4113 (outside North America)<br />
email: ir@telus.com<br />
Visit: telus.com/investors<br />
Ethics Line<br />
As part of our ethics policy, this hotline<br />
allows team members and others to<br />
anonymously and confidentially raise<br />
accounting, internal control and ethical<br />
inquiries or complaints.<br />
phone 1-888-265-4112<br />
website telus.ethicspoint.com<br />
Auditors<br />
Deloitte LLP
Online information<br />
You want more information.<br />
You can find it instantly.<br />
At <strong>TELUS</strong>, we are unleashing the power of the Internet to deliver the best solutions to Canadians at<br />
home, in the workplace and on the move. That is why we spend a lot of time and effort developing<br />
our websites to ensure you can find what you want, when you want it.<br />
For our<br />
customers<br />
For our<br />
investors<br />
For the<br />
community<br />
We are working hard to put you first and make sure you have the information<br />
you need online…<br />
. How we are putting you first telus.com/you<br />
. Our residential products and services telus.com<br />
. Managing your residential account telus.com<br />
. Managing your wireless account telusmobility.com<br />
. Our business solutions telus.com/business<br />
. News, weather, phone book, <strong>TELUS</strong> webmail and more mytelus.com<br />
. Healthcare solutions, resources and tools telushealth.com<br />
. Answers to your health questions myhealthreference.com<br />
…and on the go from your mobile device.<br />
. Manage your wireless account m.telusmobility.com<br />
. Get the most from your smartphone telusmobility.com/learn<br />
Stay current with the latest <strong>TELUS</strong> investor information and sign up for email alerts<br />
by visiting telus.com/investors.<br />
. Annual meeting shareholder information telus.com/agm<br />
. <strong>TELUS</strong> <strong>annual</strong> <strong>report</strong> telus.com/<strong>annual</strong><strong>report</strong><br />
. Dividend Reinvestment and Share Purchase Plan details telus.com/drisp<br />
. Signing up for e-delivery of shareholder documents telus.com/electronicdelivery<br />
. Latest quarterly financial documents telus.com/quarterly<br />
We give where we live to support our communities and endeavour to make a<br />
positive impact on society through our business and human resources practices.<br />
. <strong>TELUS</strong> corporate social responsibility <strong>report</strong> telus.com/csr<br />
. How customers help us give where we live telus.com/community<br />
. How charitable organizations can apply for funding telus.com/community
Why invest in <strong>TELUS</strong>?<br />
You want investment value.<br />
We are striving to deliver.<br />
<strong>TELUS</strong> is delivering value by:<br />
. Putting customers first with our Clear and Simple marketing approach to strengthen our<br />
competitive position and financial performance<br />
. Enhancing our advanced wireless network with 4G LTE technology, delivering significantly<br />
higher data speeds on the latest devices to attract and retain clients<br />
. Driving growth through a superior home entertainment experience with Optik TV and<br />
high-speed Internet services and marketing enhanced service bundles<br />
. Targeting 2013 growth in revenue and earnings<br />
. Generating strong cash flow, driven by higher operating earnings, to fund investments<br />
in infrastructure, spectrum and shareholder dividends<br />
. Offering investors a clear dividend growth model targeting two dividend increases<br />
per year to January 2014 of circa 10 per cent <strong>annual</strong>ly subject to the <strong>TELUS</strong> Board’s<br />
determination<br />
. Adhering to our financial policies to maintain strong investment grade credit ratings,<br />
which provide ready access to capital market funding<br />
. Providing transparent and award-winning financial, corporate<br />
governance and sustainable development disclosure.<br />
Visit telus.com/<strong>annual</strong><strong>report</strong> to view this<br />
<strong>report</strong> online with your computer, tablet or<br />
smartphone. Ce rapport annuel est disponible<br />
en français en ligne à telus.com/rapportannuel.<br />
facebook.com/telus @telus<br />
youtube.com/telus<br />
<strong>TELUS</strong> Corporation<br />
555 Robson Street, Vancouver,<br />
British Columbia, Canada V6B 3K9<br />
phone (604) 697-8044<br />
fax (604) 432-9681<br />
telus.com<br />
By choosing environmentally friendly paper, we are saving*:<br />
. 120 trees<br />
. 204,044 litres of wastewater<br />
. 1,636 kilograms of solid waste<br />
. 4,507 kilograms of greenhouse gases<br />
. 52 million BTUs of energy.<br />
*Environmental impact estimates were made using the Environmental Paper Network Paper Calculator.<br />
For more information, visit papercalculator.org<br />
Printed in Canada Please recycle
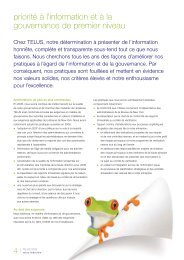
![DISK004:[98CLG6.98CLG3726]BA3726A.;28 - About TELUS](https://img.yumpu.com/16786670/1/190x245/disk00498clg698clg3726ba3726a28-about-telus.jpg?quality=85)