AGNSW_AnnRep_00 full.pdf - Parliament of New South Wales ...
AGNSW_AnnRep_00 full.pdf - Parliament of New South Wales ...
AGNSW_AnnRep_00 full.pdf - Parliament of New South Wales ...

You also want an ePaper? Increase the reach of your titles
YUMPU automatically turns print PDFs into web optimized ePapers that Google loves.
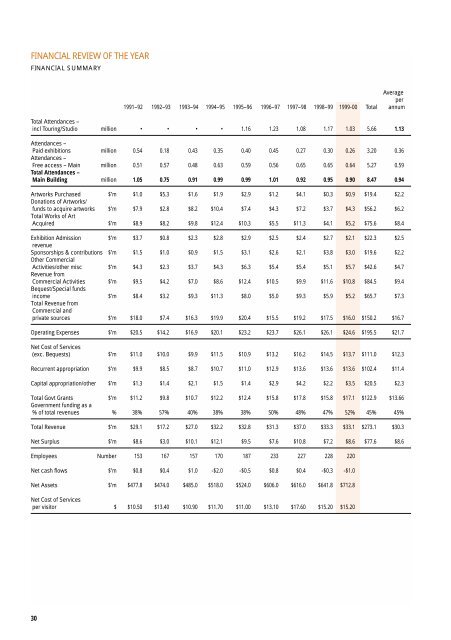
FINANCIAL REVIEW OF THE YEAR<br />
FINANCIAL SUMMARY<br />
30<br />
Average<br />
per<br />
1991–92 1992–93 1993–94 1994–95 1995–96 1996–97 1997–98 1998–99 1999-<strong>00</strong> Total annum<br />
Total Attendances –<br />
incl Touring/Studio million • • • • 1.16 1.23 1.08 1.17 1.03 5.66 1.13<br />
Attendances –<br />
Paid exhibitions million 0.54 0.18 0.43 0.35 0.40 0.45 0.27 0.30 0.26 3.20 0.36<br />
Attendances –<br />
Free access – Main million 0.51 0.57 0.48 0.63 0.59 0.56 0.65 0.65 0.64 5.27 0.59<br />
Total Attendances –<br />
Main Building million 1.05 0.75 0.91 0.99 0.99 1.01 0.92 0.95 0.90 8.47 0.94<br />
Artworks Purchased $’m $1.0 $5.3 $1.6 $1.9 $2.9 $1.2 $4.1 $0.3 $0.9 $19.4 $2.2<br />
Donations <strong>of</strong> Artworks/<br />
funds to acquire artworks $’m $7.9 $2.8 $8.2 $10.4 $7.4 $4.3 $7.2 $3.7 $4.3 $56.2 $6.2<br />
Total Works <strong>of</strong> Art<br />
Acquired $’m $8.9 $8.2 $9.8 $12.4 $10.3 $5.5 $11.3 $4.1 $5.2 $75.6 $8.4<br />
Exhibition Admission $’m $3.7 $0.8 $2.3 $2.8 $2.9 $2.5 $2.4 $2.7 $2.1 $22.3 $2.5<br />
revenue<br />
Sponsorships & contributions $’m $1.5 $1.0 $0.9 $1.5 $3.1 $2.6 $2.1 $3.8 $3.0 $19.6 $2.2<br />
Other Commercial<br />
Activities/other misc $’m $4.3 $2.3 $3.7 $4.3 $6.3 $5.4 $5.4 $5.1 $5.7 $42.6 $4.7<br />
Revenue from<br />
Commercial Activities $’m $9.5 $4.2 $7.0 $8.6 $12.4 $10.5 $9.9 $11.6 $10.8 $84.5 $9.4<br />
Bequest/Special funds<br />
income $’m $8.4 $3.2 $9.3 $11.3 $8.0 $5.0 $9.3 $5.9 $5.2 $65.7 $7.3<br />
Total Revenue from<br />
Commercial and<br />
private sources $’m $18.0 $7.4 $16.3 $19.9 $20.4 $15.5 $19.2 $17.5 $16.0 $150.2 $16.7<br />
Operating Expenses $’m $20.5 $14.2 $16.9 $20.1 $23.2 $23.7 $26.1 $26.1 $24.6 $195.5 $21.7<br />
Net Cost <strong>of</strong> Services<br />
(exc. Bequests) $’m $11.0 $10.0 $9.9 $11.5 $10.9 $13.2 $16.2 $14.5 $13.7 $111.0 $12.3<br />
Recurrent appropriation $’m $9.9 $8.5 $8.7 $10.7 $11.0 $12.9 $13.6 $13.6 $13.6 $102.4 $11.4<br />
Capital appropriation/other $’m $1.3 $1.4 $2.1 $1.5 $1.4 $2.9 $4.2 $2.2 $3.5 $20.5 $2.3<br />
Total Govt Grants $’m $11.2 $9.8 $10.7 $12.2 $12.4 $15.8 $17.8 $15.8 $17.1 $122.9 $13.66<br />
Government funding as a<br />
% <strong>of</strong> total revenues % 38% 57% 40% 38% 38% 50% 48% 47% 52% 45% 45%<br />
Total Revenue $’m $29.1 $17.2 $27.0 $32.2 $32.8 $31.3 $37.0 $33.3 $33.1 $273.1 $30.3<br />
Net Surplus $’m $8.6 $3.0 $10.1 $12.1 $9.5 $7.6 $10.8 $7.2 $8.6 $77.6 $8.6<br />
Employees Number 153 167 157 170 187 233 227 228 220<br />
Net cash flows $’m $0.8 $0.4 $1.0 -$2.0 -$0.5 $0.8 $0.4 -$0.3 -$1.0<br />
Net Assets $’m $477.8 $474.0 $485.0 $518.0 $524.0 $606.0 $616.0 $641.8 $712.8<br />
Net Cost <strong>of</strong> Services<br />
per visitor $ $10.50 $13.40 $10.90 $11.70 $11.<strong>00</strong> $13.10 $17.60 $15.20 $15.20