part7 - Cbs
part7 - Cbs
part7 - Cbs

Create successful ePaper yourself
Turn your PDF publications into a flip-book with our unique Google optimized e-Paper software.
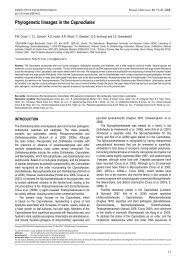
STUDIES IN MYCOLOGY 49: 243-251, 2004<br />
Classification of Terverticillate Penicillia by Electrospray Mass Spectrometric<br />
Profiling<br />
Jørn Smedsgaard*, Michael Edberg Hansen and Jens C. Frisvad<br />
Center for Microbial Biotechnology, BioCentrum-DTU, Technical University of Denmark, Søltofts Plads Build. 221, DK-<br />
2800 Kgs. Lyngby, Denmark. *corresponding author js@biocentrum.dtu.dk.<br />
Abstract: 429 isolates of 58 species belonging to Penicillium subgenus Penicillium are classified from direct infusion<br />
electrospray mass spectrometry (diMS) analysis of crude extracts by automated data processing. The study shows that about<br />
70% of the species can be classified correctly into species using only the analysis of metabolites produced on one growth<br />
medium. This classification is in concurrence with the taxonomic delimitation of the accepted species obtained by a polyphasic<br />
approach. Other relations between species can be read from the dendrograms and the efficient classification shows the<br />
potential of this semi- automated identification system.<br />
Keywords: electrospray mass spectrometry. taxonomy, subgenus Penicillium,<br />
Introduction<br />
Species belonging to Penicillium subgenus Penicillium<br />
are well known to produce a broad range of extrolites<br />
whereof many are known as mycotoxins<br />
(Frisvad & Samson 2004). Furthermore, the chemical<br />
structures of many metabolites have not been elucidated.<br />
Several studies have shown that the production<br />
of these extrolites form profiles which are unique to<br />
each species and therefore allow classification and<br />
identification of these species (Frisvad 1994).<br />
The first use of extrolites for identification of<br />
fungi was the agar-plug TLC method by Filtenborg et<br />
al. (Filtenborg & Frisvad 1980; Filtenborg et al.<br />
1983). This method is based on TLC profiles made<br />
directly from agar plugs cut from cultures that after<br />
selective spraying can be was to aid identification of<br />
the species. This method was later extended where<br />
extracts of cultures were analysed by HPLC (Frisvad<br />
1987; Frisvad & Thrane 1987). Svendsen and Frisvad<br />
(1994) used extensive HPLC-UV analysis of species<br />
in the subgenus Penicillium to select diagnostic metabolites<br />
and grouped into chromophore families<br />
based on similarity of UV spectra that indicate a<br />
structural resemblance (Svendsen & Frisvad 1994).<br />
Their study showed that these species could be classified<br />
by their pattern of these selected metabolites as<br />
seen as peaks in HPLC-UV analyses using both the<br />
pattern of known or distinct unique unknown metabolites.<br />
Furthermore, they showed that the species delimitation<br />
agreed the classical phenotypical characterization<br />
The HPLC-UV method is rather laborious<br />
and time consuming as compared to the agar-plug<br />
TLC method, but it gives much more information<br />
about the unknown metabolites than TLC. The extraction<br />
procedure was much simplified by Smeds-<br />
gaard (1997a) which combined with optimised HPLC<br />
analyses greatly increased the sample throughput.<br />
A major limitation of the TLC and HPLC approaches<br />
is that they require experience to recognize<br />
the significant spots on a TLC plate or peaks/UVspectra<br />
in a HPLC chromatogram. This can be assisted<br />
by analysis of metabolite standards and by the<br />
use of reference data (e.g. Frisvad & Thrane 1993;<br />
Nielsen & Smedsgaard 2003). However, the data<br />
evaluation is time consuming and difficult to automate<br />
(Nielsen et al. 1998; 1999).<br />
In the beginning of the 1990’s the commercialisation<br />
of electrospray mass spectrometry (ES-MS)<br />
greatly expanded the range of compounds that can be<br />
analysed by MS. A major feature of ES-MS is that<br />
the ionisation is very soft and by optimisation will<br />
produce mostly protonated or sodiated ions at low<br />
molecular mass. Therefore ES-MS allow a broad<br />
range of extrolites from fungi to be determined as<br />
their protonated or in some cases as their sodiated<br />
molecular ion with very high sensitivity (Smedsgaard<br />
& Frisvad, 1996). As ES-MS is compatible with<br />
HPLC, mass information can be obtained along with<br />
e.g. retention times and also UV spectra. These techniques<br />
are now in routine use in many laboratories<br />
and reference data have been published (e.g. Nielsen<br />
& Smedsgaard 2003). But as mentioned above processing<br />
of LC-MS data is also laborious, requires some<br />
expertise and is difficult to automate.<br />
The most direct approach is to infuse the crude<br />
extracts directly into the electrospray source of the<br />
mass spectrometer (ES-MS) in positive mode to get a<br />
mass spectrum or rather a mass profile of the compounds<br />
in the sample, thus omitting the chromatographic<br />
column (Smedsgaard & Frisvad, 1996).<br />
243
ELECTROSPRAY MASS SPECTROMETRY OF PENICILLIUM<br />
These profiles can be measured in the order of minutes<br />
and are easily adapted for automated processing,<br />
see below. Matrix effects can interfere significant in<br />
ES-MS spectra of complex mixtures, most notably by<br />
ion suppression where ions at high concentration,<br />
high surface potential or high proton affinity suppress<br />
other ions. However, it was demonstrated by Smedsgaard<br />
and Frisvad (1996) that the Penicillium species<br />
in Series Viridicata could be classified from their<br />
quite unique ES-MS spectra (mass profiles). These<br />
nominal mass spectra also showed ions corresponding<br />
to the protonated molecular mass of many of the<br />
metabolites produced by these species (Smedsgaard<br />
& Frisvad 1996). In a later study Smedsgaard & Frisvad<br />
(1997) included most species of subgenus Penicillium<br />
of which about 72% could be classified correctly<br />
(36 species out of about 50 species from 339<br />
isolates examined on two media). Although a direct<br />
infusion mass spectrum cannot in its own right be<br />
used to identify metabolites, it can give an indication<br />
of the occurrence of a particular metabolite. The major<br />
advantage of direct infusion nominal mass spectra<br />
is that they are well suited for automated data processing<br />
and most mass spectrometers comes with<br />
software for library storage and retrieval. An efficient<br />
use of standard library software was demonstrated in<br />
an extension of the above study by Smedsgaard<br />
(1997b).<br />
The most recent generation of mass spectrometers<br />
have the ability to produce high resolution spectra<br />
with a mass accuracy in the range of 5 ppm maintaining<br />
a very high sensitivity. By this accuracy only<br />
relatively few different formulae are possible for each<br />
ion seen in the spectrum, thus it is much more likely<br />
that different masses originate from different metabolites.<br />
However, reaching the high mass accuracy requires<br />
an internal mass reference. As at least one metabolite<br />
is known from most Penicillium species,<br />
these metabolites can be used as a native internal<br />
mass reference which can be used to correct the spectrum<br />
e.g. roquefortine C with the protonated mass<br />
390.1930 Da is produced by about half of the terverticillate<br />
Penicillia. These accurate high resolution<br />
mass profiles contain much more information than<br />
nominal mass spectra, thus a better chemoclassification<br />
can be expected. Furthermore, due to<br />
the high precision, only a few structures are possible<br />
for each ion (in the range of 3-9 depending on mass<br />
and accuracy) giving a much more reliable confirmation<br />
of metabolite production.<br />
Automated processing of high resolution mass<br />
spectra requires a somewhat different approach than<br />
nominal mass spectra. Whereas a series of nominal<br />
mass spectra easily can be transform into a grid structure<br />
(aligned) of integer mass without loss of information,<br />
this cannot be done as easily from accurate<br />
spectra. In an accurate spectrum the masses falls on a<br />
244<br />
continuous mass scale, therefore it is not straight forward<br />
to find out which mass compares to which. The<br />
approach mostly used is binning, where a narrow grid<br />
is designed to fit over the data in such a way that each<br />
ion in each spectrum is placed in designated bins, e.g.<br />
using a bin width of 0.1 Da will combine ion with<br />
masses in the interval 252.0000 Da to 252.1000 Da<br />
into the same bin thus to be used as one variable for<br />
further data processing. Selection of bin width depends<br />
on mass resolution and accuracy. A more efficient<br />
method is the accurate mass spectrum (AMS)<br />
distance (Hansen & Smedsgaard 2004a; 2004b) by<br />
which the similarity between both accurate and nominal<br />
spectra can be calculated without alignment of the<br />
spectra (thus without applying a grid for binning the<br />
ions into variables). In short a correspondence map is<br />
determined by matching ion peaks pairs across two<br />
spectra according to the shortest distance. For each<br />
pair of corresponding masses, the difference is<br />
calculated giving a qualitative distance measure<br />
between “matched” masses. From this vector of differences<br />
the 90% quantile is calculated, defining the<br />
distance which at least 10% of the peaks have to be<br />
moved in order to give a perfect match. Finally, the<br />
correlation is calculated between the normalised intensities<br />
for all matched peak in each pair of spectra<br />
giving a correlation of one if there is a perfect match<br />
of peak heights. The product of the distance dissimilarity<br />
and (1 minus the intensity correlation) is collected<br />
into a dissimilarity matrix for all combinations<br />
of spectra.<br />
The objective of this study was to test the classification<br />
of the 429 isolates representing 58 species belonging<br />
to subgenus Penicillium proposed by Frisvad<br />
and Samson (2004) with direct infusion ESMS accurate<br />
mass spectra.<br />
Material and methods<br />
Species from the study by Frisvad and Samson on the<br />
terverticillate Penicillia (Frisvad & Samson 2004),<br />
(58 species, approx. 8 isolates of most species, together<br />
429 isolates) were analysed by direct infusion<br />
ES-MS. Each isolate was cultivated on CYA and<br />
YES agar (Samson et al. 2004) and incubated for 7<br />
days in the dark at 25 o C. Extracts were prepared from<br />
both the CYA and YES cultures by the plug extraction<br />
procedure (Smedsgaard 1997a) modified to use a<br />
two-step extraction procedure. Three 6 mm agar<br />
plugs were extracted using 0.5 ml ethyl acetate containing<br />
0.5% formic acid in the first extraction and<br />
0.5 ml 2-propanol in the second extraction. The combined<br />
extracts was evaporated to dryness and redissolved<br />
in methanol and filtered before injection<br />
into the mass spectrometer.
SMEDSGAARD ET AL.<br />
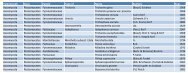
Table 1. Metabolites used as internal mass reference for mass scale correction. Prioritised, thus first mass reference 1 is searched in the<br />
spectrum, if not found then a search for mass reference 2 is performed. If neither masses are found no internal correction is performed. The<br />
metabolites are selected from Frisvad et al. (2004) on the basis of their general occurrence and good ionisation properties.<br />
First choice<br />
Metabolite M+H + Species<br />
anacine 343.1770 P. thymicola, P. nordicum<br />
asperphenamate 507.2284 P. bialowiezense, P. olsonii<br />
aurantiamine 303.1821 P. aurantiogriseum, P. neoechinulatum<br />
brevianamide A 311.1032 P. brevicompactum<br />
cyclopenol 311.1032 P. freii , P. discolor, P. echinulatum, P. solitum<br />
cyclopeptin 281.1290 P. caseifulvum<br />
cyclopiazonic acid 337.1552 P. palitans, P. dipodomyicola, P. commune, P. camemberti<br />
deoxybrevianamide E 352.2025 P. italicum, P. ulaiense<br />
dipodazin 242.0929 P. cavernicola, P. dipodomyis<br />
glyanthrypine 346.1555 P. gladioli<br />
griseofulvin 353.0792 P. aethiopicum<br />
nalgiovensin 329.1025 P. nalgiovense<br />
norlichexanthone 259.0606 P. clavigerum<br />
patulin 155.0344 P. formosanum<br />
puberuline 444.2287 P. cyclopium, P. polonicum, P. tricolor<br />
roquefortine C 390.1930 P. chrysogenum, P. expansum, P. marinum, P. griseofulvum, P. paneum, P.<br />
albocoremium, P. allii, P. concentricum, P. confertum, P. coprobium, P.<br />
coprophilum, P. flavigenum, P. glandicola, P. radicicola, P. atramentosum, P.<br />
melanoconidium, P. crustosum, P. hirsutum, P. hordei, P. roqueforti, P. sclerotigenum,<br />
P. tulipae, P. venetum, P. vulpinum, P. carneum<br />
tryptoquialanine A 547.2192 P. digitatum<br />
verrucin A 377.1613 P. verrucosum<br />
verrucologen 400.2752 P. mononematosum<br />
viridic acid 455.2294 P. viridicatum<br />
Second choice<br />
alantrypinone 375.1457 P. thymicola<br />
asperfuran 219.1021 P. clavigerum<br />
asteltoxin 419.2070 P. cavernicola<br />
auranthine 331.1195 P. aurantiogriseum<br />
aurantiamine 303.1821 P. freii<br />
brevianamide A 366.1817 P. viridicatum<br />
chrysogine 191.0820 P. chrysogenum<br />
communesin B 509.2916 P. expansum, P. marinum<br />
cyclopaldic acid 239.0555 P. mononematosum<br />
cyclopenol 311.1032 P. neoechinulatum<br />
fumigaclavine A 299.1759 P. palitans<br />
griseofulvin 353.0792 P. dipodomyicola, P. griseofulvum<br />
marcfortin A 478.2706 P. paneum<br />
meleagrin 434.1828 P. albocoremium, P. allii, P. concentricum, P. confertum, P. coprobium, P.<br />
coprophilum, P. flavigenum, P. glandicola, P. radicicola<br />
mycophenolic acid 321.1338 P. bialowiezense, P. brevicompactum, P. carneum<br />
ochratoxin A 404.0901 P. nordicum, P. verrucosum<br />
oxaline 448.1985 P. atramentosum, P. melanoconidium<br />
penicillin G 335.1065 P. nalgiovense<br />
rugulovasine A 334.1555 P. commune<br />
tryptoquialanine A 547.2192 P. aethiopicum<br />
verrucofortine 410.2443 P. cyclopium, P. polonicum, P. tricolor<br />
245
ELECTROSPRAY MASS SPECTROMETRY OF PENICILLIUM<br />
The sample was analysed by direct injection positive<br />
electrospray mass spectrometry (di-ESMS) on a<br />
Micromass Q-Tof time of flight mass spectrometer<br />
with a 3.6 GHz time-to-digital detection. The general<br />
procedure (Smedsgaard & Frisvad 1996) was modified<br />
to add the modifiers (formic acid and water)<br />
online by a syringe pump rather than adding modifier<br />
to the samples. 1 μl extract was infused at 15 μl/min<br />
by a methanol carrier flow. Just prior to the source<br />
water containing 2% formic acid was added at a rate<br />
of 5 μl/min giving a combined flow of 20 μl/min going<br />
into the source. Continuum scans was collected at<br />
a rate of 1 scan per second from m/z 150 to 1000 with<br />
0.1 second interscan time. Data was collected from 0<br />
to 2 minutes after injection and samples were injected<br />
at approx. 3 minutes interval. The instrument was<br />
tuned to a resolution better than 8500 and calibrated<br />
on a solution of PEG giving a residual error less than<br />
2 mDa for all reference peaks (more than 28) by a 5 th<br />
order calibration.<br />
Data processing<br />
From each file a centroid mass spectrum were calculated<br />
by combining the scans during the elution of the<br />
extract, followed applying the calibration collected at<br />
the time of analysis and finally using one of the prioritised<br />
metabolites, see table 1, as internal mass references<br />
to correct the mass scale for optimum accuracy<br />
(Hansen & Smedsgaard 2004a; 2004b). These<br />
corrected centroid spectra were used for classification<br />
and collected in a chemotaxonomic database.<br />
A classification was done using accurate mass<br />
spectrum (AMS) distance (Hansen & Smedsgaard<br />
2004a) as described in the introduction. The data<br />
from cultures on YES and CYA are calculated separately.<br />
From the two dissimilarity matrices dendrograms<br />
(trees) are calculated by cluster analysis using<br />
UPGMA linkages. The raw data files were processed<br />
using in-house written software (see www.metabolomics.biocentrum.dtu.dk)<br />
and statistical analysis<br />
using the “R” statistical package (that can be<br />
downloaded from www.r-project.org) and NTSys<br />
2.11 (Exeter Software, NY, USA).<br />
246<br />
Results and discussion<br />
Figure 1 illustrates the structure of the raw data and<br />
the pre-processing. The elution profile at the top<br />
shows the crude extract eluting into the source. Scans<br />
are collected in the raw continuum format during the<br />
elution where data points are sampled at a fixed rate<br />
of about 139 points per Dalton (approx. 118000 point<br />
per spectrum). About 60 continuum scans are summarised<br />
into one continuum scan from which a centroid<br />
(stick) mass spectrum is calculated and the mass<br />
scale is corrected using an internal mass correction.<br />
This is done by search for ions corresponding to the<br />
metabolites and protonated masses given in table 1. If<br />
an ion is found the mass scale is corrected otherwise<br />
it used directly. In general a mass accuracy in the<br />
range 5 to 10 ppm can be obtained by internal mass<br />
correction, whereas the uncorrected accuracy is<br />
around 200 ppm. These centroid spectra are used for<br />
all further data processing. Between 100 and 600 ions<br />
are detected from each sample. Dendrograms from<br />
classifications by AMS dissimilarity - cluster analysis<br />
are shown on figure 2 and 3 keeping data from YES<br />
and CYA cultures separate. All in all 429 spectra<br />
were included in each analysis representing 57 species<br />
included. The overall performance is summarized<br />
in table 2.<br />
Using a strict criterion, 26 species were classified<br />
correctly from the YES data and 22 from the CYA<br />
data according to the study by Frisvad and Samson<br />
(2004). There is consensus on 16 taxa by analyses<br />
from both media, further 10 are correctly classified<br />
by the YES data and another 6 species are correctly<br />
classified by the CYA data. The strict criterion requires<br />
that all isolates of a given species are grouped<br />
with other isolates of the same species as the closest<br />
neighbours.<br />
Often a single isolate of a particular species shows<br />
poor growth, poor metabolite production or is missing<br />
a single characteristic metabolite, maybe due to<br />
long storage in a culture collection, therefore is too<br />
different from other isolates of the same species to<br />
end up in the correct cluster. If we accept clusters<br />
missing one isolate as correct classification, a further<br />
13 species are clustered correctly from the YES data<br />
and 4 from the CYA data.<br />
Table 2 Performance of the classification by cluster analysis from direct infusion ESI-MS analysis of crude extracts. Number of species<br />
classified correctly according to (Frisvad and Samson 2004) out of the 57 species examined.<br />
YES CYA<br />
Perfect classification of all examined isolates in unique cluster 26 22<br />
Unique cluster missing one isolate 13 4<br />
Perfect classification of all examined isolates in unique cluster but with<br />
alien isolate included<br />
2 0<br />
Considered correct 70 % 46 %
SMEDSGAARD ET AL.<br />
Fig. 1. Example of the raw data structure and processing from direct infusion ES-MS of a crude extract using Penicillium viridicatum as an<br />
example. From the elution profile a) about 60 scans are summarized into a continuum spectrum b) from which the centroid mass spectrum<br />
is calculated (centroid at 80% Full Width Half Maximum using viridic acid for internal mass correction see table 1) c). Finally the data are<br />
collected in a table) for further processing in this case 172 mass-ion count pairs. d. A small section is magnified to show the data structure.<br />
Also, a cluster analysis will always place a sample<br />
somewhere, thus an odd (unique) isolate may end up<br />
in a cluster as an alien, although this will require a<br />
certain similarity with its neighbours. If we look at<br />
the YES data we find two clusters where all isolates<br />
of the given species are found but with an alien isolate:<br />
In the P. hordei cluster a single P. tulipae isolate<br />
is found and in the P. echinulatum cluster a single P.<br />
commune isolate is found. If we accept these still<br />
rather strict criteria 70 % of the species are classified<br />
correctly by the data from YES and 46% of the data<br />
from CYA. We find that this is in agreement with our<br />
previous studies (Smedsgaard & Frisvad 1997) as the<br />
present study includes more species and the isolates<br />
were selected to give a broader representation of the<br />
species. Although the analytical and data processing<br />
procedures have greatly improved, it has also exposed<br />
several contamination problems previous not<br />
seen (e.g. PEG from plastics).<br />
In both dendrograms on figure 2 and 3 some clusters<br />
have been labelled by a letter as they cannot be<br />
described by a single or few species.<br />
247
ELECTROSPRAY MASS SPECTROMETRY OF PENICILLIUM<br />
Fig. 2 Complete dendrogram from cultures grown on YES. Cluster labelled A to H are single isolates or isolates not forming any clear clusters.<br />
Numbers after the species name tells how many isolates are found in that cluster with the total number of isolate examined in brackets.<br />
In a detailed analysis of the specific clusters we<br />
find that some species are divided in two groups, e.g.<br />
six of the seven P. flavigenum isolates are separated<br />
into the clusters labelled A and B with a significant<br />
outlier in the YES data (figure 2), whereas five isolates<br />
of P. flavigenum are found in a distinct cluster in<br />
the CYA data (figure 3) with the two remaining isolates<br />
in the cluster labelled K.<br />
248<br />
By both analyses an alien P. italicum isolate occurs<br />
in cluster of the closely related P. ulaiense, findings<br />
that are in agreement with those of (Frisvad and<br />
Samson 2004).<br />
In the cluster group labelled C in the YES data<br />
(figure 2) seven of the nine P. nalgiovense isolates<br />
were found together with isolates of the related species:<br />
P. camemberti (1) and P. solitum (2). However,<br />
the P. nalgiovense isolates are split in two, five P.
SMEDSGAARD ET AL.<br />
Fig. 3 Complete dendrogram from cultures grown on CYA. Clusters labelled A to K are single isolates or isolates not forming any clear<br />
clusters. Numbers after the species name tells how many isolates are found in that cluster with the total number of isolate examined in<br />
brackets.<br />
nalgiovense and the two P. solitum is closer to P.<br />
cavernicola than the two remaining P. nalgiovense<br />
and the P. camemberti. The remaining two P. nalgiovense<br />
isolates are found in a cluster of isolates<br />
with a very low abundance of ions.<br />
Analysing the YES data (figure 2) shows that P.<br />
nordicum is close to the related P. verrucosum, most<br />
noticeable divided into two separate clusters indicating<br />
two chemotypes. By the CYA data (figure 3) P.<br />
nordicum is distinctly separated from P. verrucosum,<br />
however 5 of the 14 included isolates are quite separate<br />
from the others. By analysing the CYA data (figure<br />
3) most isolates of the two related species P.<br />
paneum and P. roqueforti are found in a single cluster,<br />
close together with another related species P.<br />
carneum. These three species constitute the section<br />
Roqueforti. It also shows that all taxa from series Olsonii,<br />
P. brevicompactum, P. bialowiezense and P.<br />
olsonii are found in a common cluster.<br />
249
ELECTROSPRAY MASS SPECTROMETRY OF PENICILLIUM<br />
Fig. 4 Analysis of the series Viridicata alone gives a perfect classification in full agreement with recent classification (Frisvad and Samson<br />
2004). A: P. tricolor, B: P. cyclopium, C: P. viridicatum, D: P. melanoconidium, E: P. neoechinulatum, F: P. freii, G: P. aurantiogriseum,<br />
H: P. polonicum.<br />
P. aethiopicum is distinctly different from other<br />
species in both analyses and is also is accommodated<br />
in a separate series by Frisvad and Samson (2004).<br />
Most isolate from five of the species in the series<br />
Viridicata are found in a common cluster in the CYA<br />
data, whereas these species are more divided by the<br />
YES data, particularly P. aurantiogriseum which is<br />
split into two clusters in the YES data (figure 2)<br />
As the classification is based solely on chemical<br />
data one may ask the question what is bringing these<br />
clusters together. This is not an easy question to answer<br />
as any cluster analysis including the AMS distance<br />
will include all variables in this case 100 to 600<br />
ions detected in each spectrum. However some metabolites<br />
produce quite significant ions in the spectra<br />
e.g. meleagrin and several of the species producing<br />
meleagrin will do so in quite large amounts. These<br />
species also produce roquefortine C, another metabolite<br />
from the same pathway (Frisvad et al. 2004).<br />
Therefore a cluster grouping half the meleagrin producing<br />
species, all which are very good producers can<br />
be located near the top in dendrograms from both<br />
YES and CYA.<br />
In the YES dendrogram (figure 2) the species P.<br />
albocoremium, P. allii, P. chrysogenum, P. hirsutum,<br />
P. concentricum and P. glandicola are grouped most<br />
likely due to meleagrin and roquefortine C. The species<br />
in the cluster labelled A is also producing meleagrin.<br />
In the CYA dendrogram (figure 3) P. albocoremium,<br />
P. radicicola, P. allii, P. tulipae, P. glandicola,<br />
P. chrysogenum and P. hirsutum are group by<br />
melgarin and roquefortine C production. Even though<br />
these metabolites produce quite significant ions, there<br />
is still enough other information in the spectra to<br />
separate most of these species. The remaining meleagrin-roquefortine<br />
C producing species is distributed<br />
throughout the dendrograms.<br />
250<br />
The direct infusion ESMS methodology also presents<br />
some evidence on existence of chemical series<br />
as compared to natural series as presented by Frisvad<br />
and Samson (2004). In some case these may be quite<br />
similar, where in other cases the can be quite different.<br />
The species in the series Corymbifera with the<br />
exception of P. hordei, all produce meleagrin and<br />
most of these are found in the meleagrin cluster described<br />
above in the CYA data (figure 3). P. venetum,<br />
a rather poor producer, of meleagrin is located in a<br />
unique cluster elsewhere as is the non meleagrin producing<br />
P. hordei. In the YES data (figure 2) the taxa<br />
of the series Corymbifera are split into two clusters<br />
with the other meleagrin producing species.<br />
Another interesting observation is that several of<br />
the coprophilic species P. coprobium, P. coprophilium,<br />
P. griseofulvum, P. vulpinum are grouped with<br />
one or two characteristic soil species.<br />
If a smaller group of species is of interest and this<br />
group can be delimited by other means, it is possible<br />
to perform a much clearer cluster analysis. Figure 4<br />
illustrate this by a cluster analysis of a subset of the<br />
data selecting 80 isolates from the 8 species in the<br />
series Viridicata, generally considered as difficult to<br />
identify. In this case the classification is a perfect<br />
clustering of all isolates into correct species. Furthermore,<br />
a separation of P. cyclopium into the two<br />
taxa: P. cyclopium and P. aurantiovirens (Lund &<br />
Frisvad 1994) is supported only by these chemical<br />
data.<br />
The major advantage of direct infusion electrospray<br />
mass spectrometry is that a non biased chemical<br />
profile can be determined in minutes without requirement<br />
of metabolite knowledge. Also the samples<br />
can in most cases be prepared directly from the normal<br />
seven days old cultures using only one medium.<br />
This study does not conclude which medium is pref-
erable for automated classification. At first glance the<br />
data from YES separate most species into correct taxa<br />
and do in general increase the amount of metabolites<br />
produced (not published observations). However, for<br />
most of these species CYA will give a higher chemical<br />
diversity which in case will result in a more<br />
branched dendrogram. The use of direct positive electrospray<br />
mass spectrometry methodology favours<br />
alkaloids thus species producing unique or significant<br />
alkaloids will be more efficiently classified compared<br />
to species characterised by e.g. polyketides. To compensate<br />
for this bias a careful balance between the<br />
qualitative and quantitative features of the spectra<br />
have to be selected. The developed data processing<br />
methodology allow almost automated processing<br />
weighting both features. As seen from the cluster<br />
analysis a major part of the examined species can be<br />
classified directly from the ESI-MS spectra. As mass<br />
spectra are ideal for storage in databases with automated<br />
search and retrieval this forms an efficient base<br />
for an automated identification system.<br />
Acknowledgements<br />
We thank the Danish Technical Research Council for support<br />
for Program for Predictive Biotechnology (Functional<br />
biodiversity in Penicillium and Aspergillus) and Centre for<br />
Advanced Food Studies (LMC), Denmark, for additional<br />
financial support. Furthermore Ellen Kirstine Lyhne and<br />
Hanne Jakobsen are greatful acknowledged for their assistance<br />
in the laboratory cutting plugs, extracting and analyzing<br />
the samples.<br />
Note: Full dendrograms with culture references (IBT collection<br />
numbers) are available from the authors as pdf<br />
files.<br />
Literature cited<br />
Filtenborg O, Frisvad JC, (1980) A simple screening<br />
method for toxigenic moulds in pure cultures. Lebensm<br />
Wiss Technol 13: 128-130.<br />
Filtenborg O, Frisvad JC, Svendsen JA, (1983) Simple<br />
screening method for moulds producing intracellular<br />
mycotoxins in pure cultures. Applied and Environmental<br />
Microbiology 45: 581-585.<br />
Frisvad JC, (1987) High-performance liquid chromatographic<br />
determination of profiles of metabolites of<br />
mycotoxins and other secondary metabolites. Journal<br />
of Chromatography A 392: 333-347.<br />
Frisvad JC, (1994) Classification of organisms by secondary<br />
metabolites. In: Identification and characterization<br />
of pest organisms. (Hawksworth, D. L. ed.). CAB<br />
International, 303-320<br />
Frisvad JC, Samson RA, (2004) Polyphasic taxonomy of<br />
Penicillium subgenus Penicillium. A guide to identification<br />
of the food and air-borne terverticillate Penicillia<br />
and their mycotoxins. Studies in Mycology 49: 1-173.<br />
Frisvad JC, Smedsgaard J, Larsen TO, Samson R, (2004)<br />
Mycotoxins, drugs and other extrolites produced by<br />
SMEDSGAARD ET AL.<br />
species in the Penicillium subgenus Penicillium. Studies<br />
in Mycology 49.<br />
Frisvad JC, Thrane U, (1987) Standardized highperformance<br />
liquid chromatography of 182 mycotoxins<br />
and other fungal metabolites based on alkylphenone retention<br />
indices and UV-VIS spectra (diode array detection).<br />
Journal of Chromatography A 404: 195-214.<br />
Frisvad JC, Thrane U, (1993) Liquid column chromatography<br />
of mycotoxins. In: Chromatography of mycotoxins-<br />
Techniques and applications. (Betina, V. ed.). 1 edn.<br />
Elsevier Amsterdam, 253-372<br />
Hansen ME, Smedsgaard J, (2004a) A New Matching Algorithm<br />
for High Resolution Mass Spectra. Journal of<br />
the American Society of Mass Spectrometry. in press<br />
Hansen ME, Smedsgaard J, (2004b) Automated data processing<br />
of high-resolution mass spectra from direct infusion<br />
of complex fungal extracts. Journal of the American<br />
Society of Mass Spectrometry. in press<br />
Lund F, Frisvad JC, (1994) Chemotaxonomy of Penicillium<br />
auratiogriseum and related species. Mycological<br />
Research 98: 481-492.<br />
Nielsen KF, Smedsgaard J, (2003) Fungal metabolite<br />
screening: database of 474 mycotoxins and fungal metabolites<br />
for dereplication by standardised liquid chromatography-UV-mass<br />
spectrometry methodology.<br />
Journal of Chromatography A 1002: 111-136.<br />
Nielsen N-PV, Carstensen JM, Smedsgaard J, (1998)<br />
Aligning of single and multiple wavelength chromatographic<br />
profiles for chemometric data analysis using<br />
correlation optimised warping. Journal of Chromatography<br />
A 805: 17-35.<br />
Nielsen N-PV, Smedsgaard J, Frisvad JC, (1999) Full second-order<br />
chromatographic/spectrometric data matrices<br />
for automated sample identification and componenet<br />
analysis by non-data-reducing image analysis. Analytical<br />
Chemistry 71: 727-735.<br />
Samson RA, Hoekstra ES, Frisvad JC, Filtenborg O,<br />
(2004) Introduction to food-borne fungi. 7th edn.<br />
Baarn, The Netherlands, Centraalbureau voor<br />
Schimmelcultures.<br />
Smedsgaard J, (1997a) Micro-scale extraction procedure<br />
for standardized screening of fungal metabolite production<br />
in cultures. Journal of Chromatography A 760:<br />
264-270.<br />
Smedsgaard J, (1997b) Terverticillate penicillia studied by<br />
direct electrospray mass spectrometric profiling of<br />
crude extracts: II. Database and identification. Biochemical<br />
Systematics and Ecology 25: 65-71.<br />
Smedsgaard J, Frisvad JC, (1996) Using direct electrospray<br />
mass spectrometry in taxonomy and secondary metabolite<br />
profiling of crude fungal extracts. Journal of<br />
Microbiological Methods 25: 5-17.<br />
Smedsgaard J, Frisvad JC, (1997) Terverticillate penicillia<br />
studied by direct electrospray mass spectrometric profiling<br />
of crude extracts: I. Chemosystematics. Biochemical<br />
Systematics and Ecology 25: 51-64.<br />
Svendsen A, Frisvad JC, (1994) A chemotaxonomic study<br />
of the terverticillate penicillia based on high performance<br />
liquid chromatography of secondary metabolites.<br />
Mycological Research 98: 1317-1328.<br />
251