Standard Bank - Kitco
Standard Bank - Kitco Standard Bank - Kitco
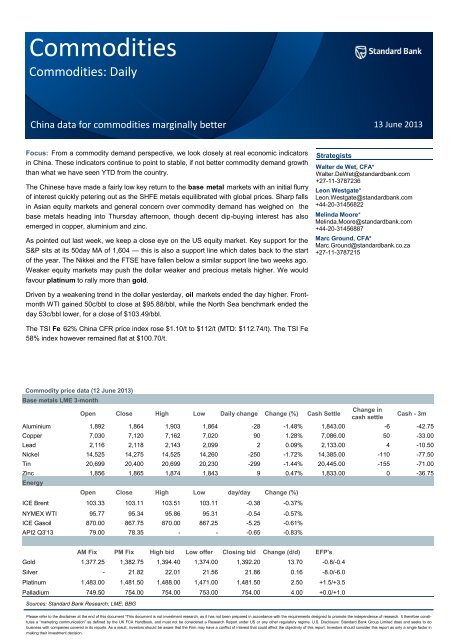
Commodities Commodities: Daily China data for commodities marginally better Focus: From a commodity demand perspective, we look closely at real economic indicators in China. These indicators continue to point to stable, if not better commodity demand growth than what we have seen YTD from the country. The Chinese have made a fairly low key return to the base metal markets with an initial flurry of interest quickly petering out as the SHFE metals equilibrated with global prices. Sharp falls in Asian equity markets and general concern over commodity demand has weighed on the base metals heading into Thursday afternoon, though decent dip-buying interest has also emerged in copper, aluminium and zinc. As pointed out last week, we keep a close eye on the US equity market. Key support for the S&P sits at its 50day MA of 1,604 — this is also a support line which dates back to the start of the year. The Nikkei and the FTSE have fallen below a similar support line two weeks ago. Weaker equity markets may push the dollar weaker and precious metals higher. We would favour platinum to rally more than gold. Driven by a weakening trend in the dollar yesterday, oil markets ended the day higher. Frontmonth WTI gained 50c/bbl to close at $95.88/bbl, while the North Sea benchmark ended the day 53c/bbl lower, for a close of $103.49/bbl. The TSI Fe 62% China CFR price index rose $1.10/t to $112/t (MTD: $112.74/t). The TSI Fe 58% index however remained flat at $100.70/t. Commodity price data (12 June 2013) Base metals LME 3-month Sources: Standard Bank Research; LME; BBG Strategists Open Close High Low Daily change Change (%) Cash Settle 13 June 2013 Walter de Wet, CFA* Walter.DeWet@standardbank.com +27-11-3787236 Change in cash settle Cash - 3m Aluminium 1,892 1,864 1,903 1,864 -28 -1.48% 1,843.00 -6 -42.75 Copper 7,030 7,120 7,162 7,020 90 1.28% 7,086.00 50 -33.00 Lead 2,116 2,118 2,143 2,099 2 0.09% 2,133.00 4 -10.50 Nickel 14,525 14,275 14,525 14,260 -250 -1.72% 14,385.00 -110 -77.50 Tin 20,699 20,400 20,699 20,230 -299 -1.44% 20,445.00 -155 -71.00 Zinc 1,856 1,865 1,874 1,843 9 0.47% 1,833.00 0 -36.75 Energy Open Close High Low day/day Change (%) ICE Brent 103.33 103.11 103.51 103.11 -0.38 -0.37% NYMEX WTI 95.77 95.34 95.86 95.31 -0.54 -0.57% ICE Gasoil 870.00 867.75 870.00 867.25 -5.25 -0.61% API2 Q3'13 79.00 78.35 - - -0.65 -0.83% AM Fix PM Fix High bid Low offer Closing bid Change (d/d) EFP's Gold 1,377.25 1,382.75 1,394.40 1,374.00 1,392.20 13.70 -0.8/-0.4 Silver - 21.82 22.01 21.56 21.86 0.16 -8.0/-6.0 Platinum 1,483.00 1,481.50 1,488.00 1,471.00 1,481.50 2.50 +1.5/+3.5 Palladium 749.50 754.00 754.00 753.00 754.00 4.00 +0.0/+1.0 Leon Westgate* Leon.Westgate@standardbank.com +44-20-31456822 Melinda Moore* Melinda.Moore@standardbank.com +44-20-31456887 Marc Ground, CFA* Marc.Ground@standardbank.co.za +27-11-3787215 Please refer to the disclaimer at the end of this document *This document is not investment research, as it has not been prepared in accordance with the requirements designed to promote the independence of research. It therefore constitutes a ―marketing communication‖ as defined by the UK FCA Handbook, and must not be considered a Research Report under US or any other regulatory regime. U.S. Disclosure: Standard Bank Group Limited does and seeks to do business with companies covered in its reports. As a result, investors should be aware that the Firm may have a conflict of interest that could affect the objectivity of this report. Investors should consider this report as only a single factor in making their investment decision.
- Page 2 and 3: 2 Focus: China data for commodities
- Page 4 and 5: 4 Bulks Commodities Commodities Dai
- Page 6 and 7: 6 Bulks Sources: Standard Bank; LME
- Page 8: 8 Commodities Commodities Daily —
Commodities<br />
Commodities: Daily<br />
China data for commodities marginally better<br />
Focus: From a commodity demand perspective, we look closely at real economic indicators<br />
in China. These indicators continue to point to stable, if not better commodity demand growth<br />
than what we have seen YTD from the country.<br />
The Chinese have made a fairly low key return to the base metal markets with an initial flurry<br />
of interest quickly petering out as the SHFE metals equilibrated with global prices. Sharp falls<br />
in Asian equity markets and general concern over commodity demand has weighed on the<br />
base metals heading into Thursday afternoon, though decent dip-buying interest has also<br />
emerged in copper, aluminium and zinc.<br />
As pointed out last week, we keep a close eye on the US equity market. Key support for the<br />
S&P sits at its 50day MA of 1,604 — this is also a support line which dates back to the start<br />
of the year. The Nikkei and the FTSE have fallen below a similar support line two weeks ago.<br />
Weaker equity markets may push the dollar weaker and precious metals higher. We would<br />
favour platinum to rally more than gold.<br />
Driven by a weakening trend in the dollar yesterday, oil markets ended the day higher. Frontmonth<br />
WTI gained 50c/bbl to close at $95.88/bbl, while the North Sea benchmark ended the<br />
day 53c/bbl lower, for a close of $103.49/bbl.<br />
The TSI Fe 62% China CFR price index rose $1.10/t to $112/t (MTD: $112.74/t). The TSI Fe<br />
58% index however remained flat at $100.70/t.<br />
Commodity price data (12 June 2013)<br />
Base metals LME 3-month<br />
Sources: <strong>Standard</strong> <strong>Bank</strong> Research; LME; BBG<br />
Strategists<br />
Open Close High Low Daily change Change (%) Cash Settle<br />
13 June 2013<br />
Walter de Wet, CFA*<br />
Walter.DeWet@standardbank.com<br />
+27-11-3787236<br />
Change in<br />
cash settle<br />
Cash - 3m<br />
Aluminium 1,892 1,864 1,903 1,864 -28 -1.48% 1,843.00 -6 -42.75<br />
Copper 7,030 7,120 7,162 7,020 90 1.28% 7,086.00 50 -33.00<br />
Lead 2,116 2,118 2,143 2,099 2 0.09% 2,133.00 4 -10.50<br />
Nickel 14,525 14,275 14,525 14,260 -250 -1.72% 14,385.00 -110 -77.50<br />
Tin 20,699 20,400 20,699 20,230 -299 -1.44% 20,445.00 -155 -71.00<br />
Zinc 1,856 1,865 1,874 1,843 9 0.47% 1,833.00 0 -36.75<br />
Energy<br />
Open Close High Low day/day Change (%)<br />
ICE Brent 103.33 103.11 103.51 103.11 -0.38 -0.37%<br />
NYMEX WTI 95.77 95.34 95.86 95.31 -0.54 -0.57%<br />
ICE Gasoil 870.00 867.75 870.00 867.25 -5.25 -0.61%<br />
API2 Q3'13 79.00 78.35 - - -0.65 -0.83%<br />
AM Fix PM Fix High bid Low offer Closing bid Change (d/d) EFP's<br />
Gold 1,377.25 1,382.75 1,394.40 1,374.00 1,392.20 13.70 -0.8/-0.4<br />
Silver - 21.82 22.01 21.56 21.86 0.16 -8.0/-6.0<br />
Platinum 1,483.00 1,481.50 1,488.00 1,471.00 1,481.50 2.50 +1.5/+3.5<br />
Palladium 749.50 754.00 754.00 753.00 754.00 4.00 +0.0/+1.0<br />
Leon Westgate*<br />
Leon.Westgate@standardbank.com<br />
+44-20-31456822<br />
Melinda Moore*<br />
Melinda.Moore@standardbank.com<br />
+44-20-31456887<br />
Marc Ground, CFA*<br />
Marc.Ground@standardbank.co.za<br />
+27-11-3787215<br />
Please refer to the disclaimer at the end of this document *This document is not investment research, as it has not been prepared in accordance with the requirements designed to promote the independence of research. It therefore constitutes<br />
a ―marketing communication‖ as defined by the UK FCA Handbook, and must not be considered a Research Report under US or any other regulatory regime. U.S. Disclosure: <strong>Standard</strong> <strong>Bank</strong> Group Limited does and seeks to do<br />
business with companies covered in its reports. As a result, investors should be aware that the Firm may have a conflict of interest that could affect the objectivity of this report. Investors should consider this report as only a single factor in<br />
making their investment decision.
2<br />
Focus: China data for commodities marginally better<br />
From a commodity demand perspective, we look closely at<br />
real economic indicators in China. These indicators continue<br />
to point to stable, if not better commodity demand growth than<br />
what we have seen YTD from the country.<br />
In terms of the latest data, we look at electricity and cement<br />
production. We believe that for the second month running,<br />
China’s electricity production data paints a picture of real economic<br />
activity that is steady and improving, although not spectacular<br />
yet. The latest data shows electricity production in<br />
China rose a relatively strong 5.3% y/y in May, marginally<br />
lower than the 7.4% y/y in April. China’s electricity production<br />
YTD (i.e. January to May) also looks slightly better — it grew<br />
5.1% YTD y/y, compared to 4.8% YTD y/y in 2012. The current<br />
trend may be similar to Q4:12 where electricity data<br />
showed a continued improvement and economic growth also<br />
picked up.<br />
Other data in the Chinese economy also points perhaps to an<br />
improvement in economic activity which could attract stronger<br />
industrial demand for commodities. China’s cement production<br />
grew 9.3% y/y in May and 9.2% y/y in April. This is up from a<br />
weak 4.3% in March. Compared to last year, the cement production<br />
also looks good. Growth in May 2012 was 4.5% y/y<br />
and 5.9% y/y in April (see Figure 2).<br />
That said, we note that the data out of China is not yet consistent<br />
and strong enough to make a case for commodity prices<br />
to move rapidly, and sustainably higher. For example, China’s<br />
PMI data is still relatively weak, and so is data on rail freight<br />
volumes and even the Chinese leading economic indicator.<br />
But we believe that the latest data is still positive and encouraging<br />
in the light of commodity price action since March this<br />
year. As pointed out in our Commodities Daily dated 15 May<br />
2013, market expectations and commodity prices seem to<br />
have adjusted already to reflect slower growth from China. As<br />
a result, much of the downside may be reflected in prices already.<br />
Perhaps the price surprise for commodities in general<br />
lies marginally to the upside rather than the downside.<br />
Base metals<br />
Commodities<br />
China electricity production<br />
480<br />
400<br />
320<br />
240<br />
160<br />
Sources: <strong>Standard</strong> <strong>Bank</strong> Research; CNBS<br />
China cement production<br />
260<br />
210<br />
160<br />
110<br />
60<br />
Jan<br />
Jan<br />
kWh (bn)<br />
Feb<br />
Sources: <strong>Standard</strong> <strong>Bank</strong> Research; CNBS<br />
Mar<br />
Apr<br />
May<br />
Commodities Daily — 13 June 2013<br />
Jun<br />
2008 2009 2010<br />
2011 2012 2013<br />
mt (million)<br />
By Walter de Wet<br />
Feb<br />
Mar<br />
Apr<br />
May<br />
Jun<br />
2008 2009 2010<br />
2011 2012 2013<br />
The Chinese have made a fairly low key return to the base metal markets with an initial flurry of interest quickly petering out as<br />
the SHFE metals equilibrated with global prices. Sharp falls in Asian equity markets and general concern over commodity demand<br />
has weighed on the base metals heading into Thursday afternoon, though decent dip-buying interest has also emerged<br />
in copper, aluminium and zinc.<br />
The recent weakness in LME copper prices saw the SHFE-LME arbitrage window open overnight, yielding a $36/mt profit<br />
(basis a bonded premium of $145). Overall, SHFE copper prices opened lower then drifted sideways after an initial rally, with<br />
October-13 - currently the most active contract - ending the day just over 2% lower than Friday. SHFE copper open interest<br />
meanwhile climbed by around 5%. LME prices also staged an initial rally higher in response the SHFE activity before falling<br />
back towards $7,050 during the course of Thursday morning.<br />
Freeport finally announced force majeure on concentrate shipments from its Grasberg mine yesterday afternoon. As noted, the<br />
impact will be felt in the concentrates market first of all. It’s also worth noting however that the accident probe has been com-<br />
Jul<br />
Jul<br />
Aug<br />
Aug<br />
Sep<br />
Sep<br />
Oct<br />
Oct<br />
Nov<br />
Nov<br />
Dec<br />
Dec
Commodities Daily — 13 June 2013<br />
pleted, with the investigation team due to report to the Energy and Mineral Resources Minister either over the weekend or<br />
early next week. The report will include the cause of the accident and recommendations on how to avoid similar incidents in<br />
the future. Aside from taking the recommendations on board, union displeasure may also need to be addressed before operations<br />
can ramp back up.<br />
One side effect of nickel’s continued price weakness is that LME prices are nearly at a breakeven level to allow imports into<br />
China, with a temporary floor to LME prices perhaps forming just above $14,000/mt. How aggressive any Chinese buying may<br />
turn out to be is debateable however, providing a respite to nickel’s price collapse rather than a catalyst for a sustained recovery.<br />
Nickel prices in China are trading around the 100,000 CNY level, considered by some to offer key psychological support.<br />
Aluminium has continued to weaken, trading around $1,860 heading into US trade and back around its mid-May levels. The<br />
weakness has seen some consumer-related buying interest emerge around the lows, albeit opportunistic in nature. Although<br />
the buying interest provides some near-term support, it is not enough to help spark a sustained rally higher.<br />
Precious metals<br />
By Leon Westgate<br />
The metals remain range-bound, although technically they look weak. That said, a weaker US dollar is assisting in providing<br />
support to prices.<br />
As pointed out last week, we keep a close eye on the US equity market. Key support for the S&P sits at its 50day MA of 1,604<br />
— this is also a support line which dates back to the start of the year. The Nikkei and the FTSE have fallen below a similar<br />
support line two weeks ago. Weaker equity markets may push the dollar weaker and precious metals higher. We would favour<br />
platinum to rally more than gold.<br />
We maintain that silver remains vulnerable on the back of weak fundamentals. The metal is still trading below $22, which has<br />
provided good support in the past two months. Silver might rally a bit on short-covering, but rallies should fade.<br />
Gold support is at $1,375 and $1,366. Resistance is at $1,388 and $1,400. Silver support is at $21.52 and $21.23, resistance<br />
is at $22.00 and $22.32.<br />
Platinum support is at $1,450 and $1,445. Resistance is at $1,500 and $1,525. Palladium support is at $733 and resistance at<br />
$765.<br />
Energy<br />
By Walter de Wet<br />
Driven by a weakening trend in the dollar yesterday, oil markets ended the day higher. Front-month WTI gained 50c/bbl to<br />
close at $95.88/bbl, while the North Sea benchmark ended the day 53c/bbl lower, for a close of $103.49/bbl.<br />
For Brent, another point of support was the IEA’s forecast of lower North Sea output due to planned oilfield maintenance. The<br />
agency predicts that some 330kbd will be lost over May to September. For the global supply picture, in the same report the<br />
IEA estimated that OPEC output reached a seven-month high in May of 30.89mbd. This exceeds the 30mbd target ceiling<br />
reaffirmed at OPEC’s last meeting, perhaps leading some participants to think that the cartel might reign in some supply over<br />
the coming month. To our mind, within OPEC, the decision to cut back rests largely with Saudi Arabia, and given its stated<br />
comfort with current price levels we don’t feel that there would be much incentive for it to do so.<br />
DOE numbers started the market on a downward trend later in the day. Crude oil inventories grew 2.5m bbls, especially<br />
surprising for a market expecting a 1.5m bbl drawdown (according to Bloomberg consensus, although after the API reported<br />
9.0m bbls the actual market expectation was probably quite different from this). On the bright side for WTI, Cushing inventories<br />
dropped considerably, falling 0.8m bbls. Gasoline inventories climbed 2.7m bbls, and implied gasoline and crude oil demand<br />
both fell to 9.0mbd (from 9.1mbd) and 14.7mbd (from 15.5mbd) respectively.<br />
This underscores the point we made in yesterday’s Focus section of this report (see Commodities Daily dated 12 June 2013).<br />
With the apparent resilience of the US consumer and an easing of retail gasoline prices in the US (which reflect these high<br />
levels of gasoline inventory), we are now more confident that robust gasoline demand over the coming months could see a<br />
working down of both gasoline and ultimately crude oil inventories in the US. However, we do feel that market participants<br />
might still be overestimating this work down if they simply extrapolate recent trends.<br />
By Marc Ground<br />
Commodities<br />
3
4<br />
Bulks<br />
Commodities<br />
Commodities Daily — 13 June 2013<br />
China’s steel markets behaved rather benignly today, despite being the first day back after the holidays, with last weekend’s<br />
May key economic data releases (IP, FAI, CPI, trade) needing to be absorbed. Shanghai Equities were less sanguine, falling<br />
2.74% back below the 2200 level, to 2148, as the market began to realise what the steel industry has known since mid-May:<br />
that China is in the midst of a cyclical slowdown, particularly in urban areas, where housing completions and new starts are<br />
both falling. With GDP growth at 7.7% in Q1, China could be heading for a slower rate for Q2. Some brokers have begun<br />
further downgrading their forecasts. Beijing’s new leadership, under Xi and Li, are therefore already being given their first test:<br />
will they buckle and support the market slightly with further monetary/fiscal policy measures, or will they continue on their<br />
market reforms/market forces industry restructuring path? CPI rates appear to be giving them some wiggle-room for the<br />
former.<br />
Meanwhile, the PBOC didn’t conduct any cash-draining repurchase offers into the market today, with the 7-day Shanghai<br />
interbank rate remaining at the high rate of 6.38%, significantly above our 3.5% squeal factor for ore and steel inventory<br />
holders. A month ago, rates were at just 2.9%.<br />
Shanghai Rebar Futures closed up a paltry RMB1/t at 3422. Although a Yangang weekly spot billet tender closed RMB26/t<br />
lower w/w, spot billet prices fell only RMB10/t, having risen RMB20/t last weekend. However, rebar in Shanghai and Tianjin<br />
enjoyed post-holiday restocking momentum, rising RMB30-50/t.<br />
Among physical cargoes, BHPB sold a MAC fines Fe 60.5% cargo (21-30 laycan) via tender at $111.85/t, while the miner sold<br />
a similar cargo on CBMX for $111.98/t, injecting confidence into the post-holiday market. globalORE has seen a number of<br />
bids for June and July delivery enter its screens across the $105-110/t range, suggesting a level of mill interest is creeping<br />
back into the markets. An off-screen offer of prompt Newman Fe 62.7% fines is being offered at $114/t. Meanwhile tomorrow,<br />
RioT plans to conduct an Fe 61.4% PB fines cape cargo (27 June-6 July laycan) tender.<br />
The TSI Fe 62% China CFR price index rose $1.10/t to $112/t (MTD: $112.74/t). The TSI Fe 58% index however remained flat<br />
at $100.70/t.<br />
Among IO supply news, China is to scrap its import licensing system from 1 July, opening the industry to ―market forces‖, in a<br />
complete turnaround from CISA’s previous belief that controlling imports would somehow give mills greater control over<br />
pricing. In reality, only greater supplies relative to demand can improve pricing for end-users. We are seeing this begin to take<br />
hold now, given the increase in expansion tonnes from key seaborne supplies, particularly in Australia’s Pilbara region.<br />
Guinea no longer expects RioT to begin shipping in 2015 from Simandou, which the government estimates could cost as much<br />
as $20-25bln to develop. The country has decided to apply a 5% royalty rate to ore exports, although some refinements may<br />
be required to the formula adopted thus far. Meanwhile, RioT continues to negotiate the sale of its stake in IOC.<br />
Coking coal remains in the $136-140/t range, with negotiations yet to be completed with the Japanese, for Q3 contract volume<br />
prices. Q2 prices had been set at $172/t Qld fob; although mills have given considerable push back subsequently, with prices<br />
believed to be crossing below $150/t Qld fob already for certain contract volumes.<br />
For Q3:13 thermal coal prices, API 2 is trading at $77.30/t; API 4 is trading at $77.30/t; while Newcastle is trading at $81.30/t.<br />
By Melinda Moore
Commodities Daily — 13 June 2013<br />
Base metals<br />
Daily LME Stock Movement (mt)<br />
Metal Today Yesterday In Out<br />
Energy<br />
Precious metals<br />
Sources: <strong>Standard</strong> <strong>Bank</strong>; LME; Bloomberg<br />
One day<br />
change<br />
YTD change<br />
(mt)<br />
Cancelled<br />
warrants<br />
(mt)<br />
Cancelled<br />
warrants (%)<br />
Contract<br />
turnover<br />
Aluminium 5,214,150 5,198,425 23,550 7,825 15,725 - 2,073,175 39.76 256,373<br />
Copper 609,550 609,250 1,125 825 300 289,500 223,100 36.60 155,717<br />
Lead 200,325 202,550 300 2,525 -2,225 -120,000 144,325 72.05 70,845<br />
Nickel 183,720 182,814 1,050 144 906 43,812 24,384 13.27 61,007<br />
Tin 14,495 14,505 0 10 -10 1,670 3,595 24.80 6,780<br />
Zinc 1,096,250 1,100,450 1,550 5,750 -4,200 -124,500 703,225 64.15 110,214<br />
Shanghai 3-month forward prices COMEX active month future prices<br />
Metal Open Last 1d Change Open Close Change Change (%)<br />
Aluminium 14,625 14,755 -185 Ali Jul'13 - - - -<br />
Copper 51,850 52,050 -1,140 Cu Jul'13 323 322.45 -0.10 -0.03%<br />
Zinc 14,540 14,575 -225<br />
ZAR metal prices<br />
Aluminium Copper Lead Nickel Tin Zinc ZAR/USD fix<br />
Cash 18,458 70,966 21,362 144,066 204,757 18,357 10.0150<br />
3-month 18,920 72,268 21,498 144,891 207,060 18,930 10.1500<br />
Energy futures pricing Price Change Price Change Price Change Price Change Price Change<br />
1 month 2 month 3 month 6 month 1 year<br />
Sing Gasoil ($/bbbl) 118.50 1.26 118.08 2.04 117.45 1.99 117.25 1.73 115.63 -1.25<br />
Gasoil 0.1% Rdam ($/mt) 867.75 -5.25 869.00 -5.75 872.25 -5.25 873.75 -6.00 869.00 9.75<br />
NWE CIF jet ($/mt) 939.60 11.27 944.89 16.84 947.38 15.16 951.58 13.33 939.04 -8.92<br />
Singapore Kero ($/bbl) 116.64 1.19 117.46 2.07 117.50 2.08 117.63 1.76 116.89 1.34<br />
3.5% Rdam barges ($/mt) 581.77 3.48 579.25 5.35 576.90 4.89 571.09 4.22 564.81 2.72<br />
1% Fuel Oil FOB ($/mt) 608.62 1.57 608.44 2.42 608.15 3.33 603.42 3.34<br />
Sing FO180 Cargo ($/mt) 621.53 4.70 614.25 7.35 608.22 6.02 603.09 4.72<br />
Thermal coal Q3-13<br />
Q4-13 Q1-14 Cal 13 Cal 14<br />
API2 (CIF ARA) 78.35 -0.65 81.60 -0.40 84.65 -0.20 87.75 -0.25 93.50 -0.20<br />
API4 (FOB RBCT) 78.05 -0.65 79.75 -0.35 82.40 -0.10 84.95 -0.15 89.40 -0.20<br />
Forwards (%) 1 month 2 months 3 months 6 months 12 months<br />
Gold 0.14667 0.16167 0.17667 0.20833 0.24667<br />
Silver 0.62000 0.61600 0.61800 0.61200 0.56800<br />
USD Libor 0.19250 0.22976 0.27325 0.41376 0.68320<br />
Technical Indicators 30-day RSI 10-day MA 20-day MA 100-day MA 200-day MA Support Resistance<br />
Gold 42.50 1,394.21 1,390.16 1,521.32 1,618.82 1,384.27 1,394.63<br />
Silver 37.53 22.16 22.34 26.53 29.55 21.67 21.98<br />
Platinum 46.57 1,493.10 1,478.36 1,553.54 1,582.25 1,465.56 1,481.08<br />
Palladium 54.32 757.03 750.70 737.21 700.35 753.33 758.48<br />
Active Month Future COMEX GLD COMEX SLV NYMEX PAL NYMEX PLAT DGCX GLD TOCOM GLD CBOT GLD<br />
Aug'13 Jul’13 Jul'13 Jul'13 Aug'13 Apr'14 Aug'13<br />
Settlement 1,389.10 21.7600 756.10 1,482.30 1,388.00 4,238.00 1,392.00<br />
Open Interest 373,844 147,175 37,301 62,964 981 102,943 531<br />
Change in Open Interest -2,799 -301 -11 477 -74 595 0<br />
Commodities<br />
5
6<br />
Bulks<br />
Sources: <strong>Standard</strong> <strong>Bank</strong>; LME; Bloomberg<br />
Commodities<br />
Commodities Daily — 13 June 2013<br />
Percentage change<br />
Latest Price<br />
Steel—Physical 1-day 1-week 1-month 3-month 6-month 1-year<br />
Turkish Scrap 80:20 (Iskinderun CFR) $/t 322.12 - -4.45% -10.86% -18.01% -15.55% -15.05%<br />
China Tangshan Steel Billet $/t 473.00 - -0.63% -6.52% -8.16% -4.83% -17.31%<br />
China HRC export (Shanghai FOB) $/t 505.00 - -0.98% -6.83% -16.94% -8.68% -18.94%<br />
North Europe HRC domestic (ex-works) $/t 437.50 - -1.13% -4.89% -12.94% -3.85% -14.63%<br />
North America HRC domestic (Midwest FOB) $/t 581.60 - 1.99% -1.05% -3.90% -9.61% -7.68%<br />
Steel—Futures<br />
LME Billet Cash $/t 136.50 - -3.70% -9.00% -43.60% -53.49% -64.27%<br />
LME Billet Futures (1-mth) $/t 137.50 - -4.35% -8.33% -43.65% -53.23% -64.12%<br />
LME Steel Billet Stocks—change -130.00 - - - - - -<br />
Shanghai Rebar Futures (Active contract) $/t 526.78 - -0.08% -5.87% -9.59% -8.88% -17.42%<br />
Shanghai Rebar Futures O/W Stocks—change - - - - - - -<br />
SHFE Rebar - Open Interest 300 - - - - - -<br />
SHFE Rebar - Total Volume - - - - - - -<br />
China Steel Inventory (million tonnes) 17.00 - -2.67% -9.75% -17.62% 38.44% 7.20%<br />
Iron ore<br />
China Iron Ore Fines (62% Fe; CFR Tianjin) $/t 110.90 - -2.63% -14.30% -20.22% -12.26% -17.05%<br />
China Iron Ore Fines (58% Fe; CFR Tianjin) $/t 100.70 - -5.45% -14.66% -24.46% -13.19% -17.53%<br />
SGX AsiaClear IO Swaps 62% Fe $/t (1-mth) 112.50 - 1.35% -13.05% -19.68% -9.33% -15.73%<br />
SGX AsiaClear IO Swaps 62% Fe—Open interest 31,397 - - - - - -<br />
China Iron Ore Inventory (million tonnes) 71.59 - 1.23% 4.96% 8.04% -5.27% -24.75%<br />
Coking coal<br />
Premium Hard Coking Coal (Qld FOB) $/t 142.00 - - -5.33% -16.47% -12.35% -36.89%<br />
Capesize freight<br />
Tubarao Brazil-Beilun China (C3) 17.52 - 0.11% -0.79% -0.34% 2.16% 1.10%<br />
Pilbara Australia-Qingdao China (C5) 7.51 - 3.16% 2.04% 0.27% -0.92% 10.93%<br />
Saldanha South Africa-Beilun China 13.00 - - 2.36% 0.39% -1.89% -<br />
Tubarao Brazil to Rotterdam Europe 7.86 - 4.38% 2.88% 4.38% 3.97% 8.12%<br />
Saldanha South Africa-Rotterdam Europe - - - - - - -<br />
Financials pricing<br />
RMB Currency 6.1397 0.10% 0.06% -0.11% -1.20% -1.49% -3.60%<br />
China 7-day repo 6.3000 5.0% 16.7% 117.1% 123.4% 134.2% 133.3%<br />
Shanghai Equities Composite 2,142.8113 -3.08% -4.43% -4.42% -5.35% 3.95% -7.59%
Commodities Daily — 13 June 2013<br />
Disclaimer<br />
THIS COMMUNICATION MAY CONTAIN RESEARCH. SUCH RESEARCH IS A MARKETING COMMUNICATION:<br />
It is not investment research as it is not the result of financial analysis and has not been prepared in accordance with legal requirements designed<br />
to promote investment research independence.<br />
Additional information with respect to any security referred to herein may be made available on request. This material is for the general information<br />
of institutional and market professionals’ clients of <strong>Standard</strong> <strong>Bank</strong> Group (SBG) only. Recipients who are not market professionals or<br />
institutional investor customers of SBG should seek advice of their independent financial advisor prior to taking any investment decision based<br />
on this communication or for any necessary explanation of its content. It does not take into account the particular investment objectives, financial<br />
situation or needs of individual clients. Before acting on any advice or recommendations in this material, clients should consider whether it<br />
is suitable for their particular circumstances and, if necessary, seek professional advice. The information, tools and material presented in this<br />
marketing communication are provided to you for information purposes only and are not to be used or considered as an offer or the solicitation<br />
of an offer to sell or to buy or subscribe for securities or other financial instruments, nor shall it, or the fact of its distribution, form the basis of,<br />
or be relied upon in connection with, any contract relating to such action. This material is based on information that we consider reliable, but<br />
SBG does not warrant or represent (expressly or impliedly) that it is accurate, complete, not misleading or as to its fitness for the purpose intended<br />
and it should not be relied upon as such. The information and opinions contained in this document were produced by SBG as per the<br />
date stated and may be subject to change without prior notification Opinions expressed are our current opinions as of the date appearing on<br />
this material only. We endeavour to update the material in this report on a timely basis, but regulatory compliance or other reasons may prevent<br />
us from doing so.<br />
SBG or its employees may from time to time have long or short positions in securities, warrants, futures, options, derivatives or other financial<br />
instruments referred to in this material. Where SBG designates research material to be a ―marketing communication‖, that term is used in<br />
SBG’s Research Policy. This policy is available from the Research Compliance Office at SBG. SBG does and seeks to do business with companies<br />
covered in its research reports including Research Communications. As a result, investors should be aware that the Firm may have a<br />
conflict of interest that could affect the objectivity of this report. Investors should consider this report as only a single factor in making their<br />
investment decision.<br />
SBG has published a Conflicts of Interest Policy that is available upon request which describes the organisational and administrative arrangements<br />
for the prevention and avoidance of conflicts of interest. Further disclosures required under the FCA Conduct of Business Sourcebook<br />
and other regulatory bodies are available on request from the Research Compliance Department and or Global Conflicts Control Room,<br />
unless otherwise stated, share prices provided within this material are as at the close of business on the day prior to the date of the material.<br />
None of the material, nor its content, nor any copy of it, may be altered in any way, transmitted to, copied or distributed to any other party,<br />
without the prior express written permission of SBG. All trademarks, service marks and logos used in this report are trademarks or service<br />
marks or registered trademarks or service marks of SBG or its affiliates.<br />
SBG believes the information and opinions in the Disclosure Appendix of this report are accurate and complete. Information and opinions presented<br />
in the other sections of this communication were obtained or derived from sources SBG believes are reliable, but SBG makes no representations<br />
as to their accuracy or completeness. Additional information is available upon request. SBG accepts no liability for loss arising from<br />
the use of the material presented in this report, except that this exclusion of liability does not apply to the extent that liability arises under specific<br />
statutes or regulations applicable to SBG.<br />
The services, securities and investments discussed in this material may not be available to nor suitable for all investors. Investors should make<br />
their own investment decisions based upon their own financial objectives and financial resources and it should be noted that investment involves<br />
risk, including the risk of capital loss. Past performance is no guide to future performance. In relation to securities denominated in foreign<br />
currency, movements in exchange rates will have an effect on the value, either favourable or unfavourable. Some investments discussed<br />
in this marketing communication have a high level of volatility. High volatility investments may experience sudden and large falls in their value<br />
causing losses when that investment is realised. Those losses may equal your original investment. Indeed, in the case of some investments<br />
the potential losses may exceed the amount of initial investment, in such circumstances you may be required to pay more money to support<br />
those losses. Income yields from investments may fluctuate and, in consequence, initial capital paid to make them investment may be used as<br />
part of that income yield. Some investments may not be readily realisable and it may be difficult to sell or realize those investments, similarly it<br />
may prove difficult for you to obtain reliable information about the value, or risks, to which such an investment is exposed.<br />
This report is issued and distributed in Europe <strong>Standard</strong> <strong>Bank</strong> PLC. 20 Gresham Street, London EC2V 7JE which is regulated in the United<br />
Kingdom by Prudential Regulation Authority (―PRA‖). This report is being distributed in the United States by <strong>Standard</strong> New York Securities<br />
(USA) LLC; in Kenya by CfC Stanbic Financial Services Ltd; in Nigeria by Stanbic IBTC; in Angola by <strong>Standard</strong> <strong>Bank</strong> de Angola S.A.; in Brazil<br />
by Banco <strong>Standard</strong> de Investimentos S.A.; in China by <strong>Standard</strong> Resources (China) Limited; in Australia by <strong>Standard</strong> <strong>Bank</strong> Plc – Sydney<br />
branch; in Botswana by Stanbic <strong>Bank</strong> Botswana Limited; in Democratic Republic of Congo by Stanbic <strong>Bank</strong> Congo s.a.r.l.; in Ghana by Stanbic<br />
<strong>Bank</strong> Ghana Limited; in Iran by <strong>Standard</strong> <strong>Bank</strong> Plc – representative office; in Isle of Man by <strong>Standard</strong> <strong>Bank</strong> Isle of Man Limited; in Jersey<br />
by <strong>Standard</strong> <strong>Bank</strong> Jersey Limited; in Mexico by <strong>Standard</strong> <strong>Bank</strong> Plc – representative office; in Madagascar by Union Commercial <strong>Bank</strong> S.A.; in<br />
Mozambique by <strong>Standard</strong> <strong>Bank</strong> s.a.r.l.; in Malawi by <strong>Standard</strong> <strong>Bank</strong> Limited; in Namibia by <strong>Standard</strong> <strong>Bank</strong> Namibia Limited; in Mauritius by<br />
<strong>Standard</strong> <strong>Bank</strong> (Mauritius) Limited; in Peru by <strong>Standard</strong> <strong>Bank</strong> Plc – representative Office; in Taiwan by The <strong>Standard</strong> <strong>Bank</strong> of South Africa; in<br />
Tanzania by Stanbic <strong>Bank</strong> Tanzania Limited; in Singapore by <strong>Standard</strong> Merchant <strong>Bank</strong> (Asia) Limited; in Swaziland by <strong>Standard</strong> <strong>Bank</strong> Swazi-<br />
Commodities<br />
7
8<br />
Commodities<br />
Commodities Daily — 13 June 2013<br />
land Limited; in Zambia by Stanbic <strong>Bank</strong> Zambia Limited; in Zimbabwe by Stanbic <strong>Bank</strong> Zimbabwe Limited; in UAE by <strong>Standard</strong> <strong>Bank</strong> Plc –<br />
Dubai branch<br />
In jurisdictions where SBG is not already registered or licensed to trade in securities, transactions will only be effected in accordance with applicable<br />
securities legislation, which will vary from jurisdiction to jurisdiction and may require that the trade be made in accordance with applicable<br />
exemptions from registration or licensing requirements.<br />
<strong>Standard</strong> <strong>Bank</strong> Group Ltd Reg.No.1962/000738/06) is listed on the JSE Limited. It is an Authorised Financial Services Provider and it also<br />
regulated by the South African Reserve <strong>Bank</strong>.<br />
Copyright 2013 SBG. All rights reserved. This report or any portion hereof may not be reprinted, sold or redistributed without the written consent<br />
of <strong>Standard</strong> <strong>Bank</strong> Group Ltd.


