Sorghum Diseases in India
Sorghum Diseases in India
Sorghum Diseases in India

Create successful ePaper yourself
Turn your PDF publications into a flip-book with our unique Google optimized e-Paper software.
Table 5. Yield and gray leaf spot severity levels<br />
for cv Tortillero, grown dur<strong>in</strong>g the 1984 cropp<strong>in</strong>g<br />
season at La Lujosa Experiment Station,<br />
Choluteca, the Honduras.<br />
Treatment<br />
Fungicide every<br />
2 weeks<br />
Fungicide every<br />
4 weeks<br />
Nonprotected control<br />
Yield<br />
(t ha- 1 )<br />
5.6250a 1<br />
5.5650a<br />
4.5250b<br />
Severity<br />
(%)<br />
1.0b 2<br />
7.5b<br />
21.0a<br />
1. Means with different letter are different at .05 level<br />
(Duncan's Multiple Range Test).<br />
2. Means with different letter are different at .01 level<br />
(Duncan's Multiple Range Test).<br />
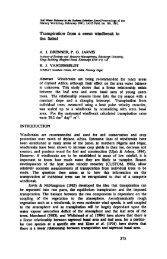
Effect of Downy Mildew on Gra<strong>in</strong><br />
Yield<br />
Peronosclerospora sorghi (Weston and Uppal) C.G.<br />
Shaw causes the disease sorghum downy mildew<br />
(SDM) on <strong>Sorghum</strong> bicolor. Plants systemically<br />
<strong>in</strong>fected by SDM are usually barren. The<br />
disease is generally recognized as one of the<br />
most important sorghum diseases (Frederiksen<br />
et al. 1973). <strong>Sorghum</strong> downy mildew was first<br />
reported <strong>in</strong> the Honduras <strong>in</strong> 1974, and is well<br />
established <strong>in</strong> Comayagua.<br />
Materials and methods<br />
Three near-isogenic sorghum populations were<br />
created with F3 progeny from a cross between<br />
the resistant l<strong>in</strong>e SC 414-12 and the susceptible<br />
<strong>in</strong>bred l<strong>in</strong>e Tx 412 (Craig et al 1988). The F3<br />
families were tested for reaction to disease, and<br />
were comb<strong>in</strong>ed <strong>in</strong>to a resistant, an <strong>in</strong>termediate,<br />
and a susceptible population. In the latter, the<br />
families showed more than 90% SDM <strong>in</strong>cidence,<br />
the <strong>in</strong>termediate family showed 25%; and the<br />
resistant population showed less than 10%.<br />
To test for yield differences between populations,<br />
all three were sown <strong>in</strong> a complete randomized-block<br />
design with four replications at<br />
Choluteca, where SDM was believed absent.<br />
Plots were four 5-m rows, with 0.8 m between<br />
310<br />
rows and 0.15 m between plants. Plots were<br />
sown on 3 Sep and harvested on 11 Dec, 1983.<br />
An identical test was sown 19 Sep <strong>in</strong> Comayagua,<br />
where SDM is endemic. Fertilizer application<br />
and cultivation were carried out <strong>in</strong> the<br />
same manner <strong>in</strong> both locations. The two central<br />
rows were harvested <strong>in</strong> each plot. The Comayagua<br />
experiment was harvested on Dec 27.<br />
The number of plants, panicles, plants with<br />
SDM 21 days after emergence, plants with SDM<br />
at harvest, panicle mass, and gra<strong>in</strong> mass were<br />
recorded for each plot.<br />
The SDM (%) data from Comayagua were<br />
subjected to an arcs<strong>in</strong>e transformation, then to<br />
analysis of variance. Gra<strong>in</strong> weight (yield) data<br />
were also subjected to analysis of variance.<br />
There were significant differences <strong>in</strong> SDM (%)<br />
and <strong>in</strong> yield between populations, so regression<br />
analysis were performed, us<strong>in</strong>g the nontransformed<br />
SDM (%) data as the <strong>in</strong>dependent variable<br />
and yield as the dependent variable.<br />
Results<br />
In Comayagua SDM significantly reduced yields.<br />
These losses were directly proportional with the<br />
<strong>in</strong>cidence of disease (Fig 4). In Choluteca, where<br />
there was no SDM, there were no yield differences<br />
between the near-isogenic sorghum<br />
populations.<br />
The resistant population <strong>in</strong> Comayagua, with<br />
a mean of 2.8% SDM, yielded 1.5 t ha- 1 . The<br />
1.8<br />
1.6<br />
1.4<br />
1.2<br />
1.0<br />
0.8<br />
y = 1425.83 -14.28 x<br />
r = -0.733354<br />
0.6<br />
0 10 20 30 40 50 60<br />
Incidence (%)<br />
Figure 4. Regression of yield on sorghum<br />
downy mildew <strong>in</strong>cidence on near-isogenic<br />
sorghum populations sown at Comayagua,<br />
the Honduras, <strong>in</strong> 1983.