Handbook of Food Analysis Instruments
Handbook of Food Analysis Instruments
Handbook of Food Analysis Instruments

You also want an ePaper? Increase the reach of your titles
YUMPU automatically turns print PDFs into web optimized ePapers that Google loves.
7<br />
CONTENTS<br />
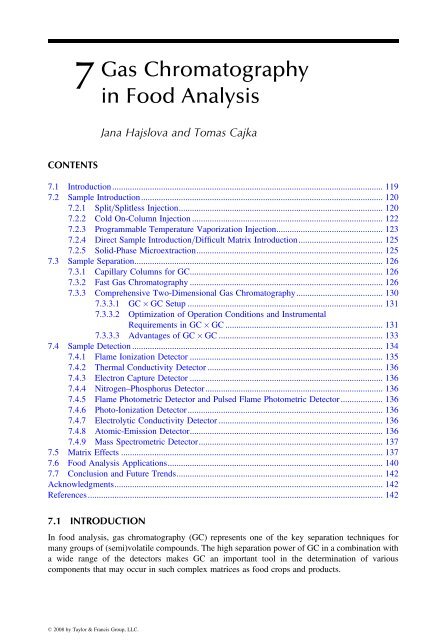
Gas Chromatography<br />
in <strong>Food</strong> <strong>Analysis</strong><br />
Jana Hajslova and Tomas Cajka<br />
7.1 Introduction.......................................................................................................................... 119<br />
7.2 Sample Introduction............................................................................................................. 120<br />
7.2.1 Split=Splitless Injection............................................................................................ 120<br />
7.2.2 Cold On-Column Injection ...................................................................................... 122<br />
7.2.3 Programmable Temperature Vaporization Injection................................................ 123<br />
7.2.4 Direct Sample Introduction=Difficult Matrix Introduction...................................... 125<br />
7.2.5 Solid-Phase Microextraction.................................................................................... 125<br />
7.3 Sample Separation................................................................................................................ 126<br />
7.3.1 Capillary Columns for GC....................................................................................... 126<br />
7.3.2 Fast Gas Chromatography ....................................................................................... 126<br />
7.3.3 Comprehensive Two-Dimensional Gas Chromatography....................................... 130<br />
7.3.3.1 GC GC Setup ........................................................................................ 131<br />
7.3.3.2 Optimization <strong>of</strong> Operation Conditions and Instrumental<br />
Requirements in GC GC ....................................................................... 131<br />
7.3.3.3 Advantages <strong>of</strong> GC GC .......................................................................... 133<br />
7.4 Sample Detection ................................................................................................................. 134<br />
7.4.1 Flame Ionization Detector ....................................................................................... 135<br />
7.4.2 Thermal Conductivity Detector ............................................................................... 136<br />
7.4.3 Electron Capture Detector ....................................................................................... 136<br />
7.4.4 Nitrogen–Phosphorus Detector................................................................................ 136<br />
7.4.5 Flame Photometric Detector and Pulsed Flame Photometric Detector ................... 136<br />
7.4.6 Photo-Ionization Detector........................................................................................ 136<br />
7.4.7 Electrolytic Conductivity Detector .......................................................................... 136<br />
7.4.8 Atomic-Emission Detector....................................................................................... 136<br />
7.4.9 Mass Spectrometric Detector................................................................................... 137<br />
7.5 Matrix Effects ...................................................................................................................... 137<br />
7.6 <strong>Food</strong> <strong>Analysis</strong> Applications................................................................................................. 140<br />
7.7 Conclusion and Future Trends............................................................................................. 142<br />
Acknowledgments......................................................................................................................... 142<br />
References..................................................................................................................................... 142<br />
7.1 INTRODUCTION<br />
In food analysis, gas chromatography (GC) represents one <strong>of</strong> the key separation techniques for<br />
many groups <strong>of</strong> (semi)volatile compounds. The high separation power <strong>of</strong> GC in a combination with<br />
a wide range <strong>of</strong> the detectors makes GC an important tool in the determination <strong>of</strong> various<br />
components that may occur in such complex matrices as food crops and products.<br />
ß 2008 by Taylor & Francis Group, LLC.
Conventional<br />
Advanced<br />
Split<br />
Sample<br />
preparation<br />
Sample<br />
introduction<br />
Classical splitless<br />
Pulsed splitless<br />
Cold on-column<br />
Programmable temperature<br />
vaporiser<br />
Direct sample introduction/<br />
Difficult matrix introduction<br />
Solid-phase microextraction<br />
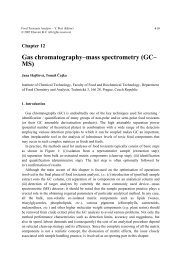
In practice, a GC-ba sed method consi sts typicall y <strong>of</strong> the follow ing steps : (1) isol ation <strong>of</strong><br />
analyt es from a representat ive sample (extr action); (2) separa tion <strong>of</strong> co-extract ed mat rix componen ts<br />
(clea nup); (3) ident i fication and quanti fica tion <strong>of</strong> targe t analyt es (dete rminativ e step) , and if the<br />
need is imp ortan t enough, this is foll owed by (4) con firmation <strong>of</strong> results by an addit ional analys is<br />
(Figur e 7.1). In any case, the sample prepar atio n pract ice plays a cruci al role for obtaining required<br />
param eters <strong>of</strong> a parti cular analytical method. Under some cond itions, especi ally when polar analytes<br />
are to be analyze d, derivatiz ation is ca rried out prior to the GC step to avoid hydroge n bondin g,<br />
hence incre asing the a nalyte volatil ity and reducing interacti on wi th acti ve sit es in the syst em.<br />
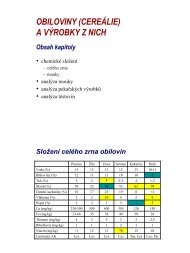
In Figure 7.2, the interrel ationshi p between solut e amoun ts and inst rumental options (inlet,<br />
colum n, and detector) is illust rated. GC users shoul d examine the relations hip <strong>of</strong> analyz ed samp les<br />
to the operat ing range <strong>of</strong> the instrum ent syst em. If the analyt e concent ration lies outside this range, a<br />
diff erent injectio n technique, column dim ension, or detector may be appropr iate.<br />
7.2 SAMPLE INTRODUCTION<br />
The re are a numbe r <strong>of</strong> options avail able for GC inlet syst ems; the most common (charac terized<br />
below) being spli t=splitless, progra mmed temperat ure vap orizer, and cold on-column (COC)<br />
inje ctor. The choice <strong>of</strong> an optimum samp le introduct ion strategy depend s mainly on the c oncentration<br />
range <strong>of</strong> targe t analyt es, thei r p hysico-chem ical proper ties, and the amount and natur e <strong>of</strong> mat rix<br />
co-ext racts presen t in the samp le.<br />
7.2.1 S PLIT=SPLITLESS INJECTION<br />
1D-GC<br />
2D-GC<br />
Data analysis<br />
Separation Detection<br />
Conventional GC<br />
Fast GC<br />
Very fast GC<br />
Ultra-fast GC<br />
Heart-cut GC<br />
Comprehensive twodimensional<br />
GC<br />
Split=splitl ess inje ction remains the main samp le introduct ion techniq ue in the analysis <strong>of</strong><br />
GC-am enable food compo nents mai nly due to its easy operat ions.<br />
Conventional<br />
Mass spec.<br />
Flame ionisation<br />
Thermal conductivity<br />
Electron capture<br />
Nitrogen–phosphorus<br />
(Pulsed) flame photometric<br />
Photo-ionisation<br />
Electrolytic conductivity<br />
Atomic-emission<br />
Quadrupole<br />
Quadrupole ion trap<br />
Magnetic sector<br />
Time-<strong>of</strong>-flight<br />
Hybrid instruments<br />
FIGURE 7.1 Basic steps typically involved in the determinative step <strong>of</strong> gas chromatographic analysis <strong>of</strong><br />
organic food compounds.<br />
ß 2008 by Taylor & Francis Group, LLC.
Mass and<br />
concentration<br />
Splitless, direct,<br />
on-column Split<br />
Column diameter<br />
and film thickness<br />
Detector minimum detection<br />
limit and dynamic range<br />
Femtograms<br />
parts per trillion<br />
Picograms<br />
parts per billion<br />
Nanograms<br />
parts per million<br />
Micrograms<br />
parts per thousand<br />
1 10 100 1 10 100 1 10 100 1 10 100 1000<br />
10 –15 10 –14<br />
10 –15 10 –14<br />
10 –13 10 –12<br />
10 –13 10 –12<br />
10 –11 10 –10<br />
10<br />
Splitless<br />
–11 10 –10<br />
Solute mass (g)<br />
10 –9 10 –8<br />
Percentage:<br />
Split 100:1<br />
dc df 530 µm 0.1 µm 5.0 µm<br />
320 µm<br />
0.1 µm 5.0 µm<br />
250 µm<br />
0.1 µm 1.0 µm<br />
180 µm<br />
0.1 µm 0.5 µm<br />
100 µm<br />
0.1 µm 0.5 µm<br />
Flame ionization<br />
Nitrogen–phosphorus<br />
Electron–capture<br />
MS (scan)<br />
MS (single-ion monitoring)<br />
Thermal conductivity<br />
10<br />
Solute mass (g)<br />
–15 10 –14 10 –13 10 –12 10 –11 10 –10 10 –9 10 –8 10 –7 10 –6 10 –5 10 –4 10 –3<br />
In a split inje ction mode, typically small volum e <strong>of</strong> samp le extra ct (0.1 –2 m L) is rapid ly<br />
delivered into a heated glass line r foll owed by its splitting into tw o streams: the large r part is<br />
vented , while the smal ler part is trans ferred onto the column. Conside ring that the most <strong>of</strong> injected<br />
samp le is lost, this techniqu e is obviou sly not suitable for trace analys is, where very low detection<br />
limits are requi red. Anot her problem associated with split injectio n is a potent ial discrim ination due<br />
to the heati ng <strong>of</strong> the syri nge during its introduct ion into a hot inje ctor resul ting in a change <strong>of</strong><br />
relative abund ances <strong>of</strong> samp le compo nents when a mixture <strong>of</strong> analytes large ly diff ering in boiling<br />
points is analyz ed. Another advers e phenomen on relat ed to this technique is n onlinear splitting due<br />
to adsorp tion <strong>of</strong> samp le compo nents on liner surfa ces or deposi ted mat rix ‘‘dirt. ’’<br />
Nowaday s, hot splitl ess injectio n repres ents the most comm only used injection techniq ue in<br />
trace quanti tative ana lysis since e ntire inje cted samp le is intr oduced onto the GC capillary . The<br />
major limitati on <strong>of</strong> this inlet is that it suffe rs from the potential therm al degrada tion and adsorption<br />
<strong>of</strong> susceptible analytes that may result either in matrix-induced response enhancement or its<br />
diminishment. In addition, the volume <strong>of</strong> injected sample=solvent is typically limited to 1 mL (for<br />
some solvents even less) due to the expansi on volume <strong>of</strong> solve nt used (T able 7.1), since the total<br />
liner volume is in a range <strong>of</strong> 150–1000 mL and the safety limit is typically 75% in maximum <strong>of</strong> the<br />
total liner volume.<br />
10 –9<br />
10 –8<br />
10 –7<br />
10 –7<br />
0.1% 1% 10% 100%<br />
FIGURE 7.2 GC dynamic range nomogram. Concentrations expressed in grams per microliter (g=mL).<br />
(Reproduced from Hinshaw, J.V., LC GC Eur., 20, 138, 2007. With permission.)<br />
ß 2008 by Taylor & Francis Group, LLC.<br />
10 –6<br />
10 –6<br />
10 –5<br />
10 –5<br />
10 –4<br />
10 –4<br />
10 –3<br />
10 –3
TABLE 7.1<br />
Expan sion Vol ume <strong>of</strong> So lvents Used in GC<br />
Solvent<br />
1 mL at 2508C<br />
and 69 kPa (10 psig)<br />
To overcome, or at least partly compensate for these problems, pulsed splitless injection can be<br />
applied. Increased column head pressure for a short period during the sample injection (usually 1–2min)<br />
leads to a higher carrier gas flow rate through the injector (8–9 versus0.5–1 mL=min during classical<br />
splitless injection), thus faster transport <strong>of</strong> sample vapors onto the GC column. In this way, the residence<br />
time <strong>of</strong> analytes and, consequently, their interaction with active sites in the GC inlet is fairly reduced [3].<br />
The detection limits <strong>of</strong> troublesome compounds obtained with pulsed splitless injection are thus lower<br />
and their further improvement can be obtained by injection <strong>of</strong> higher sample volumes (for most liners up<br />
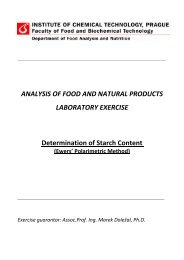
to 5 mL) without the risk <strong>of</strong> backflash (Table 7.1) [4]. It should be noted that for injections > 1–2 mL, a<br />
retention gap prior to the analytical column is generally required to avoid excessive contamination <strong>of</strong><br />
separation column and peak distortion (Figure 7.3).<br />
7.2.2 C OLD ON-COLUMN INJECTION<br />
Expansion Volume (mL)<br />
1 mL at 2508C<br />
and 345 kPa (50 psig)<br />
5 mL at 2508C<br />
and 345 kPa (50 psig)<br />
Water 1414 540 2700<br />
Methanol 631 241 1205<br />
Acetonitrile 487 186 929<br />
Acetone 347 133 663<br />
Ethyl acetate 261 100 498<br />
Toluene 241 92 460<br />
Hexane 195 75 373<br />
Isooctane 155 59 295<br />
Source: From Hewlett-Packard FlowCalc 2.0 s<strong>of</strong>tware. Available at http:==www.chem.agilent.<br />
com=cag=servsup=users<strong>of</strong>t=files=GCFC.htm via the Internet. Accessed July 1, 2007.<br />
Note: Calculated using Hewlett-Packard FlowCalc 2.0 s<strong>of</strong>tware.<br />
In COC injectio n, a sample aliq uot is directly introduced by a speci al syri nge onto the analyt ical<br />
colum n or a reten tion gap at tem peratures lower (608 C –80 8C) than those typicall y used in hot<br />
Pulsed splitless Pulsed splitless<br />
3 µL<br />
4 µL<br />
2 µL<br />
1 µL<br />
Splitless 1 µL<br />
(A) (B)<br />
FIGURE 7.3 Peak shapes obtained by pulsed splitless injections <strong>of</strong> different volumes <strong>of</strong> standard solution<br />
onto the GC column (A) without a retention gap; (B) with an installed retention gap. (Reproduced from Godula,<br />
M., Hajslova, J., and Alterova, K., J. High Resolut. Chromatogr., 22, 395, 1999. With permission.)<br />
ß 2008 by Taylor & Francis Group, LLC.<br />
5 µL<br />
3 µL<br />
2 µL<br />
1 µL
split=splitless mode (2008C–3008C). COC is therefore expected to cause less thermal stress<br />
on analytes during the injection process. This low-temperature injection eliminates both syringe<br />
needle and inlet discrimination and is suitable namely for high-boiling analytes. On the other hand,<br />
the introduction <strong>of</strong> the entire sample (both analytes and matrix components co-isolated from food<br />
matrix) into the GC system is associated with increased demands for cleaning and maintenance<br />
when such complex samples as food is analyzed [5].<br />
There are two alternative approaches available to perform on-column injection.<br />
1. Small volume on-column injection: In this approach, a small volume <strong>of</strong> the sample (up to<br />
1–2 mL) is injected onto the separation column, or preferably, in the case <strong>of</strong> dirty samples,<br />
onto a retention gap [6].<br />
2. Large volume on-column injection: In this mode, a large volume <strong>of</strong> the sample (up to<br />
1000 mL) can be introduced into the GC system [7]. The bulk <strong>of</strong> solvent is usually<br />
eliminated via a special solvent vapor exit. Once the venting is finished, the solvent<br />
vapor exit is closed and analytes, together with remaining traces <strong>of</strong> solvent, are transferred<br />
onto the analytical column. However, a modification <strong>of</strong> the GC system is required in this<br />
case to include a large diameter retention gap (10–15 m 0.53 mm), connected to a<br />
retaining precolumn (3–5 m 0.32 mm) assisting in retention <strong>of</strong> volatile analytes. In<br />
addition, injection speed has to be slowed down to prevent flooding <strong>of</strong> the system during<br />
large volume injections (LVI) with injection speeds in LVI-COC <strong>of</strong> 20–300 mL=min as<br />
compared to LVI-PTV at 50–1500 mL=min [8].<br />
7.2.3 PROGRAMMABLE TEMPERATURE VAPORIZATION INJECTION<br />
A programmable temperature vaporization (PTV) injector represents the most versatile GC inlet<br />
<strong>of</strong>fering significant reduction <strong>of</strong> most problems typically present when using hot vaporizing devices<br />
(splitless and=or cool on-column inlets) in trace analysis. The most important fact is that a PTV<br />
injector chamber is cool at the moment <strong>of</strong> injection. A rapid temperature increase, following<br />
withdrawal <strong>of</strong> the syringe from the inlet, allows efficient transfer <strong>of</strong> the volatile analytes onto the<br />
GC column while leaving behind nonvolatiles in the injection liner. With regard to these operational<br />
features, PTV is ideally suited for thermally labile analytes and samples with a wide boiling range<br />
(when needed, PTV operating temperature can be programmed even higher than the usual column<br />
temperature allowing injection <strong>of</strong> analytes that would not be vaporized through a classic split=splitless<br />
inlet). In addition eliminating a discrimination phenomenon and diminishing adverse affects <strong>of</strong><br />
nonvolatile matrix deposits on the recovery <strong>of</strong> injected analytes, PTV enables to introduce large<br />
sample volumes (up to hundreds <strong>of</strong> microliters) into the GC system. No retention gaps or precolumns<br />
are needed for this purpose; instead <strong>of</strong> that, the liner size is increased. This feature makes<br />
PTV particularly suitable for trace analysis and also enables its online coupling with various<br />
enrichment and cleanup techniques such as automated solid-phase extraction (SPE) approaches.<br />
From practical point <strong>of</strong> view, PTV is compatible with any capillary GC column diameter including<br />
microbore columns. However, to attain optimal PTV performance in particular application, many<br />
parameters have to be optimized (e.g., initial and final injector temperature, inlet heating rate,<br />
venting time, flow and pressure, transfer time, injection volume, type <strong>of</strong> liner). Due to the inherent<br />
complexity <strong>of</strong> this inlet, method development might become on some occasions a rather demanding<br />
task. Despite that, the use <strong>of</strong> PTV in food analysis is rapidly growing. The paragraphs below<br />
describe two most commonly used PTV operation modes.<br />
1. PTV splitless injection. The sample is introduced at a temperature below or close to the<br />
boiling point <strong>of</strong> the solvent. A split exit is closed during the sample evaporation and<br />
solvent vapors are vented via a GC column. PTV splitless injection can be employed for<br />
both LVI <strong>of</strong> up to 20 mL <strong>of</strong> sample and for conventional small volume injections [9]. The<br />
ß 2008 by Taylor & Francis Group, LLC.
advantage <strong>of</strong> this technique is that no losses <strong>of</strong> volatile analytes occur. Operating parameters<br />
have to be carefully optimized to avoid inlet overflow by sample vapors (losses <strong>of</strong><br />
volatile compounds) as well as column flooding by excessive solvent (poor peak shapes <strong>of</strong><br />
more volatile analytes). It has been reported that for some analytes the PTV splitless<br />
injection may produce better stability <strong>of</strong> responses and less matrix influence [10].<br />
2. PTV solvent vent injection. When employing this technique, a sample is injected at temperatures<br />
well below the boiling point <strong>of</strong> the solvent, holding the temperature <strong>of</strong> the injection<br />
port at low a value, thus enabling elimination <strong>of</strong> solvent vapors via a split exit. After the<br />
venting step, the inlet is rapidly heated and analytes are transferred onto the front part <strong>of</strong> a<br />
GC column. In this way, sample volumes <strong>of</strong> up to hundreds <strong>of</strong> microliters can be injected<br />
[11,12]. For injection <strong>of</strong> large volumes, injector liner is <strong>of</strong>ten packed with various sorbents<br />
(e.g., Tennax, polyimide, Chromosorb, glass wool, glass beads, PTFE, Dexsil) in order<br />
to protect solvent from reaching bottom <strong>of</strong> injector what may lead to column flooding<br />
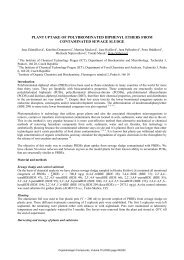
with liquid sample [13]. However, some labile compounds can be prone to degradation=<br />
rearrangement due to the catalytic effects <strong>of</strong> the sorbent; alternatively, strong binding onto<br />
the packing material causes poor desorption (Figure 7.4). If selection <strong>of</strong> a suitable inactive<br />
sorbent fails to prevent these adverse effects, then the only viable solution is the use <strong>of</strong> an<br />
empty or open liner. Under these conditions, rather smaller volumes (in maximum about<br />
50 mL) <strong>of</strong> sample can be injected, typically employing a concept <strong>of</strong> multiple injections to<br />
get a larger injection volume. Obtaining good performance <strong>of</strong> the PTV injector in solvent<br />
vent mode requires thorough experimental optimization <strong>of</strong> all relevant parameters as<br />
described above.<br />
pA<br />
1400<br />
1200<br />
1000<br />
800<br />
600<br />
400<br />
200<br />
0<br />
(A)<br />
(B)<br />
pA<br />
1400<br />
1200<br />
1000<br />
800<br />
600<br />
400<br />
200<br />
0<br />
Methamidophos<br />
12.255 12.328<br />
10 12.5 15 17.5 20 22.5 25 27.5 30 32.5 min<br />
12.041<br />
Acephate<br />
13.975<br />
14.194<br />
14.205<br />
Omethoate<br />
15.750<br />
Dimethoate<br />
17.742<br />
17.739<br />
19.182<br />
19.188<br />
20.906 Carbaryl<br />
21.156<br />
21.656<br />
22.185<br />
22.592<br />
20.915<br />
21.664<br />
22.600<br />
10 12.5 15 17.5 20 22.5 25 27.5 30 32.5 min<br />
FIGURE 7.4 Chromatograms obtained by programmable temperature vaporization (PTV) injection into<br />
(A) empty liner and (B) liner packed with glass wool plug. The differences in responses <strong>of</strong> sensitive analytes<br />
when injections were carried out into empty multibaffle liner and into single-baffle liner packed with glass<br />
wool. (Reproduced from Godula, M. et al., J. Sep. Sci., 24, 355, 2001. With permission.)<br />
ß 2008 by Taylor & Francis Group, LLC.<br />
24.749<br />
25.803<br />
25.801<br />
31.943 Phosalone<br />
31.950
7.2.4 DIRECT SAMPLE INTRODUCTION=DIFFICULT MATRIX INTRODUCTION<br />
Direct sample introduction (DSI) or its fully automated version, difficult matrix introduction (DMI),<br />
represents a novel LVI technique. The DSI approach involves adding up to 30 mL <strong>of</strong> the extract to a<br />
microvial that is placed in the adapted GC liner. The solvent is evaporated and vented at a relatively<br />
low temperature. After that, the injector is ballistically heated to volatilize the GC-amenable<br />
compounds, which are then focused at the front <strong>of</strong> a relatively cold GC column. The column then<br />
undergoes normal temperature programming to separate the analytes and cool to initial conditions,<br />
at which time the microvial is removed and discarded along with the nonvolatile matrix components<br />
that it contains. Only those compounds with the volatility range <strong>of</strong> the analytes enter the<br />
column [14]. In the commercial DMI approach, the entire liner along with the microvial is replaced<br />
after each injection [15].<br />
In this way, time-consuming and expensive purification steps can be omitted=significantly<br />
reduced for some matrices [15,16]. Since the bulk (semi)volatile matrix components introduced<br />
from the sample into the injector may influence the quantitative aspects <strong>of</strong> the injection process and<br />
interfere in analytes detection, instruments with MS analyzers (single or tandem) providing more<br />
accurate results should be preferably used [17]. In Figure 7.5 the distinct improvement obtained by<br />
sample cleanup is illustrated. Regardless sample preparation strategy, reduced demands for the GC<br />
system maintenance represents a positive feature <strong>of</strong> this technique.<br />
7.2.5 SOLID-PHASE MICROEXTRACTION<br />
Solid-phase microextraction (SPME) represents a solvent-free sampling technique employing a<br />
fused-silica fibre that is coated on the outside with an appropriate stationary phase. Volatile analytes<br />
emitted from the analyzed sample are isolated from the headspace or by direct immersion into the<br />
liquid sample and concentrated in fibre coating. After the extraction, thermal desorption in the hot<br />
GC injection port follows [18]. The main features <strong>of</strong> SPME include unattended operation via<br />
robotics (if a fully automated option is available) and the elimination <strong>of</strong> maintenance <strong>of</strong> the liner<br />
and column. However, this sample introduction technique is associated with strong matrix effects,<br />
1 2<br />
Metalcap (septum inside)<br />
O-rings<br />
Needle guide<br />
Microvial<br />
Liner<br />
FIGURE 7.5 Difficult matrix introduction (DMI) liner after injection <strong>of</strong> (1) purified baby-food extract,<br />
(2) crude extract, and (3) detail <strong>of</strong> microvials used for introduction <strong>of</strong> crude extracts. (Reproduced from<br />
Cajka, T. et al., J. Sep. Sci., 28, 1048, 2005. With permission.)<br />
ß 2008 by Taylor & Francis Group, LLC.<br />
3
thus compl ications in quanti fi cation. In addit ion, varia bility <strong>of</strong> limit <strong>of</strong> de tections for different<br />
analyt es depends on the equil ibrium b etween the coati ng mat erial and the matrix.<br />
7.3 SAMPLE SEPARATION<br />
To be amena ble for the GC analys is, an analyt e shoul d posses s not only appreci able volatil ity at<br />
tem peratures below 350 8C –400 8 C, but also must be able to wi thstand relative high tem peratures<br />
without degrada tion and reaction with other compo unds presen t in the GC syste m.<br />
Wit h regard to a typicall y co mplex mixture <strong>of</strong> matrix components occurring in food extrac ts<br />
(<strong>of</strong>t en even after its puri fication ), the optimizati on <strong>of</strong> GC separa tion requires careful attentio n to a<br />
numbe r <strong>of</strong> importan t varia bles and their interaction. Both physical (column length, internal diamet<br />
er, and stationar y phase incl uding its film thickness) , and param etric (temperat ure an d flow<br />
veloci ty) column varia bles affect the separa tion proces s.<br />
7.3.1 C APILLARY COLUMNS FOR GC<br />
To illustrate a wide range <strong>of</strong> combinations to be considered when selecting capillary GC column, the<br />
overview <strong>of</strong> commonly available internal diameters is shown in Table 7.2.<br />
Tab le 7. 3 shows relative polariti es <strong>of</strong> comm ercially available stationar y phases . The range <strong>of</strong><br />
stationary phases including also those dedicated for specific applications (e.g., volatiles, fatty acids,<br />
dioxins) is growing and also their quality characterized by reduced bleed and increased upper<br />
temperature limit is improving.<br />
In addition, the limits <strong>of</strong> inlet pressure, sampling system, and mass spectrometric detector<br />
(MSD) parameters have to be involved into consideration.<br />
7.3.2 FAST GAS CHROMATOGRAPHY<br />
A higher sample throughput together with the need to reduce laboratory operating costs has brought<br />
attention <strong>of</strong> many laboratories to the implementation <strong>of</strong> high-speed GC (HSGC) systems. Although<br />
the basic principles and theory <strong>of</strong> HSGC were formulated as early as in the 1960s, its practical<br />
development occurred at the end <strong>of</strong> last century from introduction <strong>of</strong> novel technologies such as new<br />
methods <strong>of</strong> fast and reproducible column heating, inlet devices allowing large sample volume<br />
introduction, and MS detectors with fast acquisition rates. It should be noted that full exploitation<br />
<strong>of</strong> the potential <strong>of</strong> this technique in routine practice is conditioned by reduction <strong>of</strong> sample<br />
TABLE 7.2<br />
Classification <strong>of</strong> Capillary Column<br />
Category<br />
Column Diameter<br />
Range (mm)<br />
Standard Commercial<br />
Column Diameters (mm)<br />
Max Flow Rate<br />
(mL=min) a<br />
Megabore 0.5 0.53 660<br />
Wide bore 0.3 to
TABLE 7.3<br />
Characterization <strong>of</strong> Stationary Phases Used in GC <strong>Analysis</strong><br />
Polarity Phase Composition Commercial Description<br />
Nonpolar 100% Dimethylpolysiloxane DB-1, DB-1 ms, HP-1, HP-1 ms, Ultra 1, DB-1ht,<br />
Equity-1, SPB-1, AT-1, AT-1MS, Optima 1, Optima-<br />
1 ms, BP-1, VF-1MS, CP Sil 5 CB, CP Sil 5 CB MS,<br />
ZB-1, 007-1, Elite-1, Rxi-1 ms, Rtx-1, Rtx-1MS<br />
5% Diphenyl–95% dimethylpolysiloxane DB-5, HP-5, DB-5 ms, HP-5 ms, Ultra 2, DB-5ht,<br />
Equity-5, SPB-5, AT-5, AT-5MS, Optima 5, Optima-5<br />
ms, BP-5, BPX-5, VF-5MS, CP Sil 8 CB, CP Sil 8 CB<br />
MS, ZB-5, 007-2, PE-2, Rxi-5 ms, Rtx-5, Rtx-5 ms,<br />
Rtx-5Sil MS<br />
20% Diphenyl–80% dimethylpolysiloxane Rtx-20, SPB-20, At-20, 007-7<br />
6% Cyanopropyl-phenyl–94%<br />
DB-1301, HP-1301, Rtx-1301, SPB-1301, AT-624,<br />
dimethylpolysiloxane<br />
Optima 1301, 007-1301<br />
35% Diphenyl–65% dimethylpolysiloxane DB-35, HP-35, DB-35 ms, Rtx-35, Rtx-35MS, SPB-35,<br />
AT-35, AT-35MS, BPX-35, VF-35MS, ZB-35, 007-11,<br />
PE-11<br />
Moderately polar 50% Diphenyl–50% dimethylpolysiloxane DB-17, DB-17 ms, HP-50 þ , DB-17ht, Rtx-17,<br />
VF-17MS, SPB-50, AT-50, AT-50MS, Optima 17,<br />
BPX-50, CP Sil 24 CB, ZB-50, 007-17, PE-17<br />
14% Cyanopropyl-phenyl–86%<br />
DB-1701, HP-1701, SPB-1701, AT-1701, Optima 1701,<br />
dimethylpolysiloxane<br />
BP-10, CP Sil 19 CB, ZB-1701, 007-1701, PE-1701<br />
50% Cyanopropyl-phenyl–50%<br />
DB-23, DB-225, DB-225 ms, Rtx-225, AT-225,<br />
dimethylpolysiloxane<br />
Optima 225, BP-225, CP Sil 43 CB, 007-225, PE-225<br />
Polar Polyethylene glycol DB-WAX, HP-INNOWax, Rtx-WAX, Stabilwax,<br />
Supelcowax-10, AT-Wax, Optima WAX, BP-20, CP<br />
Wax 52 CB, ZB-WAX, 007-CW, PE-CW<br />
Highly polar 70% Cyanopropyl-phenyl–30%<br />
dimethylpolysiloxane<br />
BPX-70<br />
100% Cyanopropylsiloxane SP-2340<br />
preparation time and other operations limiting laboratory throughput. Using approximate terms, the<br />
classification <strong>of</strong> GC analyses on the basis <strong>of</strong> their speed is summarized in Table 7.4.<br />
Alike in conventional GC, the separation time is defined as the retention time (t R) for the last<br />
target component peak eluting from the column:<br />
TABLE 7.4<br />
Classification <strong>of</strong> GC Analyses Based on Speed <strong>of</strong> Sample<br />
Separation<br />
Type <strong>of</strong><br />
GC <strong>Analysis</strong><br />
ß 2008 by Taylor & Francis Group, LLC.<br />
Typical Separation<br />
Time (min)<br />
Full Width at<br />
Half-Maximum<br />
Conventional >10 >1 s<br />
Fast 1–10 200–1000 ms<br />
Very fast 0.1–1 30–200 ms<br />
Ultra-fast
tR ¼ L<br />
( k þ 1) (7:1)<br />
u<br />
wher e<br />
k is the solut e c apacity ratio (capacity facto r, reten tion facto r) for the last compo und<br />
L is the column length<br />
u is the average linear carrier gas velocity<br />
On the b asis <strong>of</strong> this equation, the faster GC separa tion can be achiev ed by follow ing ways<br />
[19,20] :<br />
. Red uced c olumn length ( # L)<br />
. Decr eased retention factor ( # k): (1) increased isotherm al temperat ure, (2) faster temperature<br />
programm ing, (3) alte red stat ionary phase to imp rove selectivity, (4) thinner film <strong>of</strong><br />
the stationar y phase, (5) large r diameter c apillary colum n (for fixed length)<br />
. Increas ed carrier gas veloci ty ( " u ): (1) higher than opti mum carrier gas velocity,<br />
(2) increased optimum carrier gas veloci ty (hydro gen as a carrier gas and vac uum outlet<br />
operat ion)<br />
The increase in separa tion speed generally requi res a compromi se in terms <strong>of</strong> reduced resoluti on ( R)<br />
and=or samp le capacity ( Qc ). The accept ability <strong>of</strong> these losses has to be considered for each<br />
particu lar case separa tely . Availab ility <strong>of</strong> compa tible samp le introduct ion technique and detection<br />
param eters play an imp ortant role in selection <strong>of</strong> the analyt ical strategy.<br />
Red uction <strong>of</strong> column length repres ents a very sim ple approac h to decreas e time <strong>of</strong> GC analys is.<br />
In practice, almo st all fast GC analys es are perfor med wi th short colum ns (usually 10 m) in a<br />
combi nation with other approac hes (Figur e 7.6). On this accou nt, reduct ion <strong>of</strong> the length <strong>of</strong> a given<br />
colum n results in reduced resol ution ( R ~ p L), which can be compe nsated to some extent by<br />
suitable MS detector (spectral resolutio n).<br />
Use <strong>of</strong> a colum n with a small internal diam eter is anothe r attracti ve way tow ards faster GC<br />
analys is. How ever, the inst rumental requireme nts especiall y the dif fi culties with the samp le introducti<br />
on <strong>of</strong> large r sample volumes and also the lower samp le capaci ty limit their applicati on in many<br />
real- world analyses.<br />
Use <strong>of</strong> a column with a thin fi lm <strong>of</strong> stationar y phase results in the decreas e <strong>of</strong> the capacity<br />
(ret ention) factor and thus in the faster GC analysis. In addit ion, due to the decreas ed contribut ion <strong>of</strong><br />
mass trans fer in the stationar y phase, separa tion ef ficiency is incre ased. On the other hand, reduced<br />
ruggedn ess and samp le capacity are the fees for analys is speed.<br />
Fa st temperat ure progra mming is the most popula r approac h in applicati on <strong>of</strong> fast GC in food<br />
analys is. Ei ther convect ion heating facil itated by a convent ional GC ov en or resistive heati ng can be<br />
empl oyed. If ‘‘fast ’’ separa tion in terms <strong>of</strong> class ifi cation show n in Tab le 7.4 is required, a convent ional<br />
GC oven can be used. At fast er progra mming rates , heat losses from the oven to the surrounding may<br />
cause poor oven tempe rature pro file, hence lower reprod ucibili ty <strong>of</strong> analyt e elution.<br />
Oper ation <strong>of</strong> colum n outlet at low p ressure (low-pr essure GC) is anothe r fast GC alte rnative that<br />
may find a wide use in routine labor atories concern ed wi th food analysis. Because o f o perating a<br />
megab ore separa tion colum n (typicall y 10 m length 0.53 mm inte rnal diameter 0.25 –1 mm<br />
phase) at low pressure, optimum carrier gas linear velocity is attained at higher value because <strong>of</strong><br />
increased diffusivity <strong>of</strong> the solute in the gas phase. Consequently, faster GC separations can be<br />
achieved with a disproportionately smaller loss <strong>of</strong> separation power [22]. The main attractive<br />
featu res <strong>of</strong> LP- GC –MS invol ve (1) reduced peak tailing and width (F igure 7.7) thus their improved<br />
detection limits, (2) increased sample capacity <strong>of</strong> megabore column allowing injection <strong>of</strong> higher<br />
sample volume resulting in lower detection limits for compounds not limited by matrix interferences,<br />
and (3) reduced thermal degradation <strong>of</strong> thermally labile analytes [23,24].<br />
ß 2008 by Taylor & Francis Group, LLC.
Intensity<br />
(A)<br />
Intensity<br />
(B)<br />
50000<br />
40000<br />
30000<br />
20000<br />
10000<br />
80000<br />
60000<br />
40000<br />
20000<br />
1<br />
0 10 20 30 40 50 min<br />
1<br />
2<br />
2<br />
0.0 0.5<br />
3 4<br />
4<br />
5<br />
6<br />
6<br />
7<br />
7<br />
Hydrogen can be used as a carrier gas because with the highest diffusion coefficient it is<br />
obviously the best carrier gas for fast GC. Its low viscosity also results in lower inlet pressure<br />
requirements. In practice, however, helium is usually preferred as a carrier gas flow for safety and<br />
inertness reasons.<br />
8<br />
8<br />
9<br />
10 11 12 13<br />
14<br />
14<br />
20<br />
27<br />
28<br />
16<br />
15 18 19 22 25 30<br />
2123<br />
26 29<br />
31<br />
20<br />
9<br />
10 11 12 13 24<br />
16 22<br />
15 18 2123<br />
25<br />
19<br />
27<br />
28<br />
30<br />
29 31<br />
1.0 1.5 2.0 min<br />
FIGURE 7.6 GC–FID chromatograms <strong>of</strong> fatty acid methyl esters obtained under conditions <strong>of</strong> (A) conventional<br />
(column: Rtx-WAX, 30 m 0.25 mm 0.25 mm; injection: split 1:100; oven temperature<br />
program: 508C, 38C=min to 2808C; acquisition rate: 12.5 Hz) and (B) fast GC (column: Supelcowax,<br />
10 m 0.10 mm 0.10 mm; injection: split 1:200; oven temperature program: 508C, 808C=min to 1508C,<br />
708C=min to 2508C, 508C=min to 2808C (1 min); acquisition rate: 50 Hz). (Reproduced from Mondello, L.<br />
et al., J. Chromatogr A., 1035, 237, 2004. With permission.)<br />
ß 2008 by Taylor & Francis Group, LLC.
Abundance Abundance<br />
3000<br />
2000<br />
1000<br />
m/z 201 m/z 201<br />
3000<br />
0 0<br />
Time−> 9.50<br />
10.50 min Time−> 3.00 4.00 min<br />
Abundance<br />
Abundance<br />
4000<br />
3000 m/z 283 m/z 283<br />
3000<br />
2000<br />
2000<br />
1000<br />
(A) Conventional GC–MS (B) LP-GC–MS<br />
7.3.3 COMPREHENSIVE TWO-DIMENSIONAL GAS CHROMATOGRAPHY<br />
In the analysis <strong>of</strong> complex mixtures, such as food extracts, by one-dimensional chromatography<br />
(1D-GC), overlap <strong>of</strong> some sample components unavoidably occurs. To achieve a considerable<br />
increase in peak capacity, two independent separation processes with peak capacities n 1 and n 2 can<br />
be employed in the sample analysis. Supposing that separations are based on two different<br />
mechanisms (orthogonality criterion), the maximum peak capacity calculated as n1 n2 is typically<br />
enhanced by at least one order <strong>of</strong> magnitude.<br />
Most <strong>of</strong> the successful applications reported in food analysis since 1960 up to 1990 employed<br />
so-called heart-cut mode, in which only narrow fraction(s) containing analytes <strong>of</strong> interest is (are)<br />
transported for further separation onto the second column.<br />
However, this approach has limitations. Increasing the width <strong>of</strong> the first column fraction or<br />
isolating too many parts <strong>of</strong> 1D-GC analysis to subject them to two-dimensional gas chromatography<br />
(2D-GC) separation becomes troublesome. Also, time-demanding reconstruction <strong>of</strong><br />
generated chromatograms may become a serious problem. The introduction <strong>of</strong> systems that<br />
allow the entire sample from the first column to be analyzed on the second column has enabled<br />
and improved both target and nontarget screening <strong>of</strong> food components in a wide range <strong>of</strong> matrices.<br />
This approach, called comprehensive two-dimensional (GC GC), is introduced in the following<br />
sections in a greater detail.<br />
4000<br />
2000<br />
1000<br />
1000<br />
0<br />
0<br />
Time−> 9.50 10.50 min Time−>3.00<br />
4.00 min<br />
FIGURE 7.7 Comparison <strong>of</strong> peak shapes <strong>of</strong> thiabendazole (m=z 201) and procymidone (m=z 283) obtained by<br />
(A) conventional GC–MS (column: Rtx-5MS, 30 m 0.25 mm 0.25 mm; injection: splitless, 1 mL; oven<br />
temperature program: 908C (0.5 min), 208C=min to 2208C, 58C=min to 2408C, 208C=min to 2908C (6.5 min))<br />
and (B) LP-GC–MS (column: Rtx-5Sil MS, 10 m 0.53 mm 1.0 mm coupled to 3 m 0.15 mm restriction<br />
column; injection: splitless, 1 mL; oven temperature program: 908C (0.5 min), 608C=min to 2908C (3.0 min)).<br />
(Reproduced from Mastovska, K., Lehotay, S.J., Hajslova, J., J. Chromatogr. A, 926, 291, 2001. With<br />
permission.)<br />
ß 2008 by Taylor & Francis Group, LLC.
7.3.3. 1 GC GC Setup<br />
The hea rt <strong>of</strong> the GC GC syst em is a modul ator that connect s the fi rst-dimensi on convent ional-si ze<br />
column with a short microbore column in the second dimensi on (Figure 7.8).<br />
There are three fundamental functions <strong>of</strong> this interface: (1) trapping <strong>of</strong> small adjacent fractions<br />
(typically 2–10 s) <strong>of</strong> the effluent from the first separation column, (2) refocusing these fractions (either in<br />
time or in space), and (3) injection <strong>of</strong> the refocused fractions as narrow pulses into the second-dimension<br />
column. The separation on the latter column is extremely fast and takes only 2–10 s versus 20–120 min<br />
for the first dimension, and is therefore performed under essentially isothermal conditions.<br />
A large seri es <strong>of</strong> high-speed chromatogr ams as the outcome <strong>of</strong> the transfer <strong>of</strong> chromatogr aphic<br />
band from the first to the second dim ension are generated durin g the GC GC run. As shown in<br />
Figure 7.9, these adjace nt pulse s are usual ly stack ed side- by-side by a special s<strong>of</strong>t ware to form a 2D<br />
chromatogram with one dimension representing the retention time on the first column (tR1) and the<br />
other, the retention time on the second column (tR2). The most convenient way to visualize GC GC<br />
data is as contour plots representing the bird’s eye view, where peaks are displayed as spots on a<br />
plane using colors and shading to indicate the signal intensity (Figure 7.9).<br />
7.3.3.2 Optimization <strong>of</strong> Operation Conditions and Instrumental<br />
Requirements in GC GC<br />
Compared to conventional 1D-GC, the optimization <strong>of</strong> GC GC analysis requires a more complex<br />
approach. The changes in operational parameters such as oven temperature or carrier gas flow rate<br />
have different impacts on the performance <strong>of</strong> separation columns since these differ both in their<br />
geometry and separation mechanism. Furthermore, new parameters such as modulation frequency<br />
and modulator temperature have to be optimized [25].<br />
Conventional columns, typically 15–30 m length 0.25–0.32 mm internal diameter 0.1–1 mm<br />
film thickness, are used in the first dimension. This allows application <strong>of</strong> virtually all sample<br />
introduction techniques (split=splitless, on column, LVI-PTV, DMI=DSI, and=or SPME). Stationary<br />
phases commonly used in first-dimension columns are typically 100% dimethylpolysiloxane or (5%<br />
phenylene)-dimethylpolysiloxane. The separation on these nonpolar columns is governed mainly by<br />
analyte volatility. The size <strong>of</strong> columns for second dimension is commonly in a range <strong>of</strong> 0.5–2 m<br />
length 0.1 mm internal diameter 0.1 mm film thickness. More polar stationary phases such<br />
as 35%–50% phenylene–65%–50% dimethylpolysiloxane, polyethylene glycol, carborane, and=or<br />
cyanopropyl–phenyl–dimethylpolysiloxane are employed. Analytes interact with these mediumpolar=polar<br />
phases via various mechanisms such as p–p interactions, hydrogen bonding, etc.,<br />
hence the requirement for different, independent separation principle is met. In most applications,<br />
orthogonality is achieved using nonpolar polar separation mechanisms.<br />
To obtain acceptable separation in both dimensions, a compromise has to be made with regard<br />
to both columns. The linear velocity <strong>of</strong> the carrier gas in the (narrow bore) first-dimension column is<br />
usually rather lower than optimal (about 30 cm=s) while, at the same time, the linear velocity in the<br />
(microbore) second-dimension capillary is relatively high, typically exceeding 100 cm=s. Also when<br />
setting the temperature programming rate, the requirement for obtaining at least four modulations<br />
Injector<br />
Modulator<br />
First column Second column<br />
FIGURE 7.8 GC GC instrument configuration.<br />
ß 2008 by Taylor & Francis Group, LLC.<br />
Detector
Second dimension<br />
First dimension<br />
Modulation<br />
Transformation<br />
Visualization<br />
Second dimension<br />
2D plot 3D plot<br />
First dimension<br />
First dimension<br />
1D chromatogram<br />
(first column outlet)<br />
Raw 2D chromatogram<br />
(second column outlet)<br />
Second dimensional<br />
chromatograms<br />
FIGURE 7.9 Generation and visualization <strong>of</strong> a GC GC chromatogram. (Reproduced from Zrostlikova, J.,<br />
Hajslova, J., and Cajka, T., J. Chromatogr. A, 1019, 173, 2003. With permission.)<br />
over each first-dimension peak (so-called modulation criterion) has to be taken into account. In most<br />
analyses, this is achieved by using programming rates as low as 0.58C–58C=min, which is less than<br />
in conventional 1D-GC [26]. It should be noted, however, that even steeper programming rates (thus<br />
faster GC separation) can be employed (108C–208C=min) in GC GC, which typically results in two<br />
modulations over each first-dimension peak. Under these conditions, the separation accomplished in<br />
the first column might be lost. However, because <strong>of</strong> different activity coefficients on the second<br />
column, the analytes can be completely separated (with higher chromatographic resolution than in<br />
the case <strong>of</strong> 1D-GC) in the second dimension [27,28]. For better tuning <strong>of</strong> the GC GC setup,<br />
systems with a programmable second oven are preferred.<br />
Effective and robust modulation is a key process in the GC GC analysis. Thermal modulation in<br />
a capillary GC can be performed by both heating and cooling. While heated modulators use a thickfilm<br />
modulation capillary to trap subsequent sample fractions eluting from the first column by means<br />
ß 2008 by Taylor & Francis Group, LLC.<br />
Second dimension
<strong>of</strong> stationar y phase focusing (com pounds are released by the temperat ure incre ase), the cryogen ically<br />
cooled modul ators do not use a modulati on capil lary. Inste ad, they trap and focus the sample fractions<br />
eluting from the first column at the front part <strong>of</strong> the seconda ry colum n itself. Initially, moving<br />
heated=cooled modulato rs were used but they exhibi ted relativel y low robustness (frag ile capillary<br />
can be easily broken) . The se shortcomi ngs <strong>of</strong> movi ng modulato rs have bee n overcom e by two-st age<br />
jet modul ators that use a stream <strong>of</strong> nitrogen or carbon dioxide for cooling a short secti on <strong>of</strong> the second<br />
column for trapp ing=focusing <strong>of</strong> the analytes elut ing from the fi rst colum n [29,30] .<br />
In practice, fixed modul ation freque ncy, typically in a range <strong>of</strong> 0.1 –10 Hz is employ ed durin g<br />
the analys is. Under ideal experi ment al condition s, the reten tion time <strong>of</strong> the most retaine d compo und<br />
in the second d imensio n is shorter than a modul ation time. If this is not the case, i.e., analyt es do not<br />
elute in their modul ation cycle, so-called wrap-arou nd, which may cause co-elutio ns, occurs.<br />
Avoidin g this phenom enon can be achiev ed, e.g., by an incre ase <strong>of</strong> the second- dimensi on colum n<br />
temperat ure (if a n indepe ndent ove n is avail able). In any case, optimal funct ion <strong>of</strong> modulato r is<br />
essential for the q uality <strong>of</strong> separa tion and detection proces s.<br />
The fast separa tion on a short and mic robore second- dime nsion column results in very n arrow<br />
peaks with widths <strong>of</strong> 50 –1000 ms at the ba seline. Althoug h fast analogue detectors such as a flame<br />
ionizati on d etector o r electron captur e detect or (E CD) are full y compa tible with fast chromatography<br />
and provi de reliable peak recogni tion, they do not provi de stru ctural informat ion. Coupli ng<br />
GC GC separation with MS detect or resul ts into the three-dim ensional syst em that may contribut e<br />
to the identi fication <strong>of</strong> 2D separa ted peaks and brings a dee per unders tanding <strong>of</strong> stru ctured<br />
chrom atograms [26]. However , convent ional scanning MS detectors are typi cally too slow and do<br />
not provi de reliable spectra an d peak reprod ucti on. At presen t, only time-<strong>of</strong> - flight mass spect rometers<br />
(see Cha pter 10) can acquir e the 50 or more mass spectra per second, whi ch are requi red for<br />
the proper recons truction <strong>of</strong> the chromatogr am and for quanti ficati on in GC GC [35].<br />
7.3.3. 3 Adva ntages <strong>of</strong> GC GC<br />
A nu mber <strong>of</strong> charact eristics <strong>of</strong> GC GC have been reported that documen ts superi ority <strong>of</strong> this<br />
techniqu e over convent ional 1D-GC [26].<br />
High peak capaci ty. The peak c apacity, characteri zed as a maximal numbe r <strong>of</strong> chromatogr aphic<br />
peaks that can be placed side by side into the available separa tion space (chromato gram ), is<br />
signi fica ntly en hanced. Unde r the real-world condition s, the total peak capaci ty in GC GC is rathe r<br />
lower than the calcul ated value due to the imperfect ions in the sample transfer betw een the two<br />
columns; however, it still great ly exc eeds the limits <strong>of</strong> convent ional GC. As an examp le, the meri t in<br />
pesticide residue analys is resultin g from the separa tion powe r is shown in Figure 7.10.<br />
Enh anced sensi tivity . Compar ed to 1D- GC separa tion, pronoun ced imp rovement <strong>of</strong> detection<br />
limits in GC GC syst em is o btained; thanks to compr essing the peak in the modulation capillary<br />
and front part <strong>of</strong> the second colum n (following fast chromatogr aphy avoids band broaden ing <strong>of</strong><br />
focuse d peak s). Furthe rmore, thanks to imp roved separa tion <strong>of</strong> analytes and mat rix interfere nces<br />
(chem ical noise ) in the GC GC system, the signa l to noise ratio is also improved. An e xample is<br />
given in Figure 7 .11 that ill ustrates diff erences in 1D-GC versus GC GC a nalysis <strong>of</strong> limonene.<br />
Struc tured chrom atogra ms. Thanks to compleme ntary separa tion mecha nisms occurr ing in both<br />
columns, the chromatogr ams resultin g from particula r GC GC setup are ordered, i.e., molecules<br />
have thei r de finite locations in the reten tion space based on their stru cture. In the recons tructed 2D<br />
contou r plots, characteri stic patt erns are obtained, in which the members <strong>of</strong> homologi cal seri es<br />
differing in thei r volatility are ordere d along the first-dim ension axis (nonpol ar capillary is typicall y<br />
employe d in first dim ension), whereas the compounds differing by polarity are spread along the<br />
second-dimension axis. The formation <strong>of</strong> clusters <strong>of</strong> the various subgroups <strong>of</strong> compounds in a<br />
GC GC contour plot may be useful for the group type analysis.<br />
Improved identification <strong>of</strong> unknowns. Nontarget screening allows obtaining <strong>of</strong> overview <strong>of</strong> the<br />
sample constituents. This approach consists from: (1) peak finding and deconvolution (algorithm for<br />
ß 2008 by Taylor & Francis Group, LLC.
Time (seconds)<br />
spectrum #<br />
(A)<br />
1st Time (seconds)<br />
2nd Time (seconds)<br />
spectrum #<br />
(B)<br />
250000<br />
200000<br />
150000<br />
100000<br />
50000<br />
30000<br />
25000<br />
20000<br />
15000<br />
10000<br />
5000<br />
640<br />
697<br />
recogni zing <strong>of</strong> partly co-el uting peaks in the GC –MS chrom atogram and obtai ning thei r ‘‘ pure ’’<br />
mass spect ra), (2) library searching, and (3) furt her post- processing. Since a large amoun t <strong>of</strong> data<br />
have to be proces sed, automated data proces sing is employed.<br />
7.4 SAMPLE DETECTION<br />
650 660<br />
747 797<br />
2<br />
2<br />
670<br />
847<br />
79 109 185<br />
20000<br />
18000<br />
16000<br />
14000<br />
12000<br />
10000<br />
8000<br />
6000<br />
4000<br />
2000<br />
Time (seconds)<br />
spectrum #<br />
79<br />
71 87<br />
128<br />
1<br />
47<br />
60<br />
662 662 662 662 662 662<br />
0.6 0.8 1 1.2 1.4 1.6<br />
145<br />
500<br />
185<br />
220<br />
60 80 100 120 140 160 180 200 220 240<br />
1000<br />
Library Hit - similarity 727, “Phosphoric acid,<br />
2,2-dichlorovinyldimethylester”<br />
109<br />
500<br />
60<br />
79<br />
93 145 185<br />
220<br />
80 100 120 140 160 180 200 220 240<br />
662 662<br />
1.8 2<br />
32520 32560 32600 32640 32680 32720 32760 32800<br />
79 109 185<br />
Depe nding upon the type <strong>of</strong> food compo unds being measured severa l different detectors are<br />
avail able for this purpose (T able 7 .5), e ach with its own advantages and drawbacks. The following<br />
sections briefly introduce various GC detectors most commonly in use today [32,33].<br />
1000<br />
680<br />
897<br />
650<br />
747<br />
690<br />
947<br />
660<br />
797<br />
1<br />
670<br />
847<br />
Peak true–sample<br />
109<br />
680<br />
897<br />
79 109 186<br />
FIGURE 7.10 Separation <strong>of</strong> dichlorvos (1) in apple extract at 0.01 mg=kg from matrix co-extract<br />
5-(hydroxymethyl)-5-furancarboxaldehyde (2). Plotted are three most abundant ions in the mass spectrum <strong>of</strong><br />
dichlorvos (79, 109, and 185). Chromatogram <strong>of</strong> (A) 1D-GC analysis <strong>of</strong> zoomed section shows the peak<br />
<strong>of</strong> dichlorvos (m=z 185) and matrix interference (m=z 79 and 109); and (B) GC GC analysis (DB-XLB DB-17<br />
columns); matrix interference resolved on medium polar DB-17 column. Data acquired by TOFMS at<br />
acquisition rates 5 spectra=s and 250 spectra=s, respectively.<br />
ß 2008 by Taylor & Francis Group, LLC.<br />
700<br />
997<br />
690<br />
947
Abundance<br />
(A)<br />
410 4<br />
310 4<br />
210 4<br />
110 4<br />
570 590<br />
Retention time (s)<br />
7.4.1 FLAME IONIZATION DETECTOR<br />
S/N = 639 S/N = 19570<br />
610<br />
Flame ionization detector (FID) represents one <strong>of</strong> the most widely used detectors. The effluent from<br />
an analytical column is mixed with hydrogen and air, and is directed into a flame, which breaks<br />
down organic molecules and produces ions. A voltage potential is applied across the gap between<br />
the burner tip and an electrode located just above the flame. The resulting current is then measured<br />
and is proportional to the concentration <strong>of</strong> the components present.<br />
Abundance<br />
(B)<br />
310 4<br />
210 4<br />
110 4<br />
590.8<br />
0.22<br />
593.8<br />
0.22<br />
596.8 1tR (s)<br />
0.22 2tR (s)<br />
FIGURE 7.11 Improvement <strong>of</strong> detectability <strong>of</strong> limonene (m=z 93) isolated from honey headspace by SPME<br />
under the conditions <strong>of</strong> (A) 1D-GC and (B) GC GC (DB-5 ms Supelcowax-10 columns). Data acquired by<br />
TOFMS at acquisition rates <strong>of</strong> 10 spectra=s and 300 spectra=s, respectively. (Cajka, T. et al., J. Sep. Sci., 30,<br />
534, 2007.)<br />
TABLE 7.5<br />
Overview <strong>of</strong> GC Detectors Applicable for the Determination <strong>of</strong> <strong>Food</strong> Components<br />
Detector Selectivity Detectability Linearity<br />
Flame ionization detector (FID) No 2 pg C=s 10 7<br />
Thermal conductivity detector (TCD) No 300 pg=mL 10 4–6<br />
Electron capture detector (ECD) Halogens fg=s 10 4<br />
Nitrogen–phosphorus detector (NPD) N, P fg–pg N, P=s 10 4–7<br />
Halogen-specific detector (XSD) Halogens pg Cl=s 10 4<br />
Thermionic ionization detector (TID) N, P 100 fg N=s, N: 10 5 ,P:10 4<br />
100 fg P=s<br />
Photoionization detector (PID) Aromatics pg 10 6<br />
Flame photometric detector (FPD) S, P pg a<br />
S: 10 3 ,P:10 5<br />
Pulsed flame photometric detector (PFPD) Tuneable for 28 elements pg S=s, S, P: 10 3<br />
100 pg P=s a<br />
Atomic-emission detector (AED) Tuneable for any element pg=s a<br />
10 3–4<br />
Electrolytic conductivity detector (ELCD)<br />
or Hall electrolytic conductivity detector<br />
S, N, halogens pg 10 6<br />
Mass spectrometric detector (MSD) Yes fg–pg 10 4–7<br />
Fourier transform infrared (FTIR) Yes pg 10 2<br />
a The detectability considerably varies among particular elements.<br />
pg, picogram; fg, femtogram.<br />
ß 2008 by Taylor & Francis Group, LLC.
7.4.2 THERMAL CONDUCTIVITY DETECTOR<br />
Thermal conductivity detector (TCD) consists <strong>of</strong> an electrically heated wire or thermistor. The<br />
temperature <strong>of</strong> the sensing element depends on the thermal conductivity <strong>of</strong> the gas flowing around it.<br />
Changes in thermal conductivity cause a temperature rise in the element, which is sensed as a<br />
change in resistance.<br />
7.4.3 ELECTRON CAPTURE DETECTOR<br />
In ECD, the sample is introduced into the detector through an analytical column and passes over a<br />
63 Ni radioactive source emitting b particles, which causes ionization <strong>of</strong> the carrier gas and the<br />
subsequent release <strong>of</strong> electrons. When organic molecules containing electronegative functional<br />
atoms or groups pass by the detector, they capture some <strong>of</strong> the electrons and reduce the current<br />
measured between the electrodes.<br />
7.4.4 NITROGEN–PHOSPHORUS DETECTOR<br />
In nitrogen–phosphorus detector (NPD), a glass bead containing an alkali metal is electrically<br />
heated until electrons are emitted. These electrons are then captured by stable intermediates to<br />
form a hydrogen plasma, which ionizes compounds from the column effluent. A polarizing field<br />
directs these ions to a collector anode creating a current.<br />
7.4.5 FLAME PHOTOMETRIC DETECTOR AND PULSED FLAME PHOTOMETRIC DETECTOR<br />
In flame photometric detector (FPD), a sample is burned in a hydrogen=air flame to produce molecular<br />
products that emit light by means <strong>of</strong> chemiluminescent chemical reactions. The emitted light is then<br />
isolated from background emissions by narrow bandpass wavelength-selective filters and is detected<br />
by a photomultiplier and then amplified. Unfortunately, the detectability <strong>of</strong> the FPD is limited by light<br />
emissions <strong>of</strong> the continuous flame burning products. This disadvantage is eliminated by pulsed flame<br />
photometric detector (PFPD), where a hydrogen=air mixture flows into the FPD so low that a<br />
continuous flame could not be sustained. By inserting a constant ignition source into the gas flow,<br />
the hydrogen=air mixture would ignite, propagate back through a quartz combustor tube to a<br />
constriction in the flow path, extinguish, then refill the detector, ignite, and repeat the cycle.<br />
7.4.6 PHOTO-IONIZATION DETECTOR<br />
In photo-ionization detector (PID), the column effluent is ionized by ultraviolet light and the current<br />
(proportional to the concentrations <strong>of</strong> the ionized material) produced by the ion flow is measured.<br />
7.4.7 ELECTROLYTIC CONDUCTIVITY DETECTOR<br />
In electrolytic conductivity detector (ELCD), compounds eluting from an analytical column are<br />
swept into a nickel reaction tube at the temperature up to 9008C. The components are stripped <strong>of</strong>f<br />
their halogenated atoms and these atoms are carried into a conductivity cell. As the concentrations <strong>of</strong><br />
the halogens change in this cell, the measured conductivity <strong>of</strong> a solution in the cell changes<br />
proportionally.<br />
7.4.8 ATOMIC-EMISSION DETECTOR<br />
In atomic-emission detector (AED), eluted compounds from an analytical column are transported<br />
into a microwave powered plasma (or discharge) cavity where those compounds are destroyed and<br />
their atoms are excited by the energy <strong>of</strong> the plasma. The emitted light by the excited particles is<br />
separated into individual lines via a photodiode array. The individual emission lines are then sorted<br />
ß 2008 by Taylor & Francis Group, LLC.
and produce chromatogr ams co nsisting <strong>of</strong> peaks from eluant s that co ntain only a speci fic element. In<br />
this way, elem ental compo sition can be estimat ed. It shoul d be noted that the inte nsity <strong>of</strong> signa l<br />
large ly varies among the elements and it is relat ively low for oxygen, nitrogen, chlorine, brom ine<br />
while higher sensi tivity is obtai ned for carbon, phospho rus, and sulph ur.<br />
7.4.9 MASS S PECTROMETRIC DETECTOR<br />
The mass spect rome ter (MS) is by far the most powerful an d fle xible <strong>of</strong> the detectors used in the<br />
analys is <strong>of</strong> GC-am enable food compone nts today. The advantage over all GC detectors descri bed<br />
above is a possibil ity to ob tain, in addit ion to selec tive de tection <strong>of</strong> analyt e elut ed at certa in retention<br />
time, also stru ctural infor mation, enabli ng either con firmation <strong>of</strong> targe t compo und or identi ficati on<br />
<strong>of</strong> unknow n speci es. The charact er <strong>of</strong> data obtained largely depends on the type <strong>of</strong> mass analyz er<br />
employe d. The princ iple s <strong>of</strong> this type <strong>of</strong> detection are thoro ughly discussed in Cha pter 10.<br />
7.5 MATRIX EFFECTS<br />
Unde r the real- world condition s, some residues <strong>of</strong> mat rix co-ext ractives u navoidably remain in the<br />
puri fied samp le prepar ed for examinati on by GC analysis. Inaccur ate quanti fication, decreas ed<br />
method ruggedn ess, low analyte detectabil ity, and ev en report ing <strong>of</strong> false positive o r negati ve<br />
results are the most serious matrix- associated probl ems, whic h c an b e e ncountered [3]. The extent<br />
<strong>of</strong> these phenomena depend on a wide range facto rs incl uding samp le compo sition and injectio n<br />
techniqu e empl oyed.<br />
Matr ix-induced chromato graphi c respon se enhancem ent, first descri bed b y Erney et al., is<br />
presuma bly the most discu ssed matrix effect adversely imp acting quanti ficati on accuracy <strong>of</strong> c ertain,<br />
particula rly more polar analytes [34]. Its principle is as follow s: During inje ction <strong>of</strong> particula r<br />
compo unds in neat solve nt, adsorp tion and=or therm o-degr adation <strong>of</strong> susceptibl e analytes on the<br />
active sites (mainly free sil anol groups ) presen t in the inje ction port and in chromatogr aphic colum n<br />
may occur. On this account, the number <strong>of</strong> analyte molecules reaching GC detector is reduced. This<br />
is, however, not the case when a real-world sample is analyzed. Co-injected matrix components tend<br />
to block the active sites in GC system thus reducing the analyte losses and, consequently, enhancing<br />
their signa ls as co mpared to the injectio n in neat solve nt (Figur es 7.12 and 7.13). If these facts are<br />
ignored and calibration standards in solvent only are used for calculation <strong>of</strong> target analytes concentration,<br />
recoveries as high as even several hundred percent might be obtained [3]. It is worth<br />
noticing that hydrophobic, nonpolar substances, such as persistent organochlorine contaminants<br />
(with some exceptions such as DDT that may thermally degrade in a dirty hot injector), are not<br />
prone to these hot injection-related problems.<br />
Repeated injections <strong>of</strong> nonvolatile matrix components, which are gradually deposited in the GC<br />
inlet and=or front part <strong>of</strong> the GC column, can give rise to successive formation <strong>of</strong> new active sites,<br />
which might be responsible for the effect, sometimes called matrix-induced diminishment [36].<br />
Gradual decrease in analyte responses associated with this phenomenon together with distorted peak<br />
shapes (broadening, tailing) and shifting the retention times towards higher values negatively impact<br />
ruggedness, i.e., long-term repeatability <strong>of</strong> analyte peak intensities, shapes, and retention times,<br />
performance characteristic <strong>of</strong> high importance in routine trace analysis [24].<br />
Three basic approaches and their combination should be considered as way to improved quality<br />
assurance [3]: (1) elimination <strong>of</strong> primary causes, (2) optimization <strong>of</strong> calibration strategy enabling<br />
compensation, and (3) optimization <strong>of</strong> injection and separation parameters.<br />
Unfortunately, the first concept <strong>of</strong> the GC system free <strong>of</strong> active sites is in principle hardly<br />
viable—not only because <strong>of</strong> commercial unavailability <strong>of</strong> virtually inert materials stable even under<br />
long-term exposure to high temperatures that typically occur in a GC inlet port, but also due to<br />
impossibility to control formation <strong>of</strong> new active sites from deposited nonvolatile matrix. In this<br />
content, a more conceivable alternative might be based on avoiding sample matrix to be introduced<br />
ß 2008 by Taylor & Francis Group, LLC.
Standard<br />
Sample<br />
C C<br />
Injection<br />
X Liner Y<br />
Transfer onto<br />
the GC column<br />
C – X C – Y<br />
FIGURE 7.12 Illustration <strong>of</strong> the cause <strong>of</strong> matrix-induced chromatographic enhancement effect; (C) number<br />
<strong>of</strong> injected analyte molecules; (X, Y) number <strong>of</strong> free active sites for their adsorption in injector; (*) molecules<br />
<strong>of</strong> analyte in injected sample; (.) portion <strong>of</strong> analyte molecules adsorbed in GC injector; (~)<br />
molecules <strong>of</strong> matrix components in injected sample; (~) portion <strong>of</strong> matrix compounds adsorbed in GC liner;<br />
(C X) < (C Y). (Reproduced from Hajslova, J. and Zrostlikova, J., J. Chromatogr. A, 1000, 181, 2003.<br />
With permission.)<br />
260<br />
240<br />
220<br />
200<br />
180<br />
160<br />
140<br />
120<br />
100<br />
80<br />
60<br />
Time−> 12.20 12.30<br />
(P)<br />
(S)<br />
12.40 12.50<br />
FIGURE 7.13 Matrix-induced enhancement response effect: 1 pg <strong>of</strong> 2-nitronaphthalene (m=z 173) injected in<br />
pure solvent (S) and in purified sample <strong>of</strong> pumpkin seed oil (P). (Reproduced from Dusek, B., Hajslova, J., and<br />
Kocourek, V., J. Chromatogr. A, 982, 127, 2002. With permission.)<br />
ß 2008 by Taylor & Francis Group, LLC.
into the GC syst em. Unfortu nately, again, none <strong>of</strong> the comm on isolati on and=or cleanu p techni ques<br />
are selec tive eno ugh (mainly in the case <strong>of</strong> broad scope methods) to avoid the presen ce <strong>of</strong> residual<br />
samp le compo nents in the analyt ical sample.<br />
Since an effect ive elimin ation <strong>of</strong> the source s <strong>of</strong> the matrix effects is not like ly to occur in<br />
pract ice, their compen sation by using alte rnative cali bration methods is obviously the most feasible<br />
option. Se veral stra tegies are concei vable for this purpos e: (1) addition <strong>of</strong> isotopic ally labeled<br />
internal standards, (2) the use <strong>of</strong> stand ards addition method, (3) the use <strong>of</strong> mat rix-mat ched<br />
stand ards, an d (4) the use <strong>of</strong> analyt e protectant s (introduce d only recent ly). The main disad vantages=requi<br />
rements <strong>of</strong> these methods are summ arized in Tab le 7.6 [37].<br />
As regards analyt e protec tants , these compound s are capabl e to strongly inte ract wi th acti ve<br />
sites in the GC syst em, thus decreas ing de gradation an d adsorp tion <strong>of</strong> targe t analyt es [37]. The same<br />
amoun t <strong>of</strong> the analyte protectant s is added to both samp le extra cts and mat rix-free standards, which<br />
results in maximi zation and equ alization <strong>of</strong> the matrix- induced respon se enh ancement effect and<br />
avoids overes timati on <strong>of</strong> results, which can occur with stand ards in neat solve nt [38]. A wide range<br />
<strong>of</strong> compo unds containing mul tiple polar=ionizable groups such as vario us po lyols and their deriv atives,<br />
carboxy lic a cids, amino acids , and deriv atives <strong>of</strong> basic nitrogen contai ning h eterocycles have<br />
been exp erimenta lly evalua ted as analyte prote ctant s. In a study con cerned with the analys is<br />
<strong>of</strong> mul tiple pesticide resi dues using hot splitless injection , a mixture <strong>of</strong> 3-ethoxyp ropane-1,2-di ol,<br />
L-gulo nic acid g-lact one, and D-gluc itol (in aceton itrile extra cts) was found to most effect ively cover<br />
a wide volatility range <strong>of</strong> GC-amenable analytes [38]. This analyte protectant mixture worked also<br />
very well in the multi residue GC analysis <strong>of</strong> pesticides using DMI [15], which has more active glass<br />
surfa ces that need effective deacti vation d uring each injectio n. Figure 7.14 show s chrom atograms<br />
TABLE 7.6<br />
Quantification Strategies and Their Critical Assessment<br />
Method Comments<br />
Standard additions Extra labor effort required for preparation<br />
Inaccuracies may occur because the matrix effect is concentration dependent<br />
Isotopically labeled standards Only a limited number <strong>of</strong> certified isotopically labeled standards is currently<br />
commercially available; not available in wide scope methods<br />
Restriction in the use <strong>of</strong> detection techniques other than mass spectrometry<br />
Additional labor=time burden <strong>of</strong> developing analytical conditions for so many<br />
more compounds<br />
Matrix-matched standards Need for enough blank matrix (ideally identical as the samples) and its longterm<br />
storage<br />
Extra time, labor, and expense for preparing the blank extracts for calibration<br />
standards needed<br />
Greater amount <strong>of</strong> matrix material injected onto the column in a sequence,<br />
which leads to greater requirements for GC maintenance<br />
Greater potential for analyte degradation in the matrix solution<br />
Analyte protectants Following criteria have to be met for analyte protectants:<br />
Unreactiveness with analytes in solution and the GC system<br />
Sufficient stability under the GC conditions (no thermodegradation,<br />
re-arrangement, etc.)<br />
No deterioration <strong>of</strong> the GC column or detector performance (e.g., due to<br />
accumulation)<br />
No interference with the detection process <strong>of</strong> analytes (i.e., low intensity, low<br />
mass ions in its MS spectra)<br />
Good availability, low cost, no toxicity<br />
Good solubility in the solvent <strong>of</strong> interest<br />
ß 2008 by Taylor & Francis Group, LLC.
CI<br />
CI<br />
CI<br />
CI<br />
CI<br />
(A) Lindane<br />
(B) Phosalone<br />
OH<br />
(C) o-Phenylphenol<br />
A) Without analyte protectants<br />
CI<br />
CI<br />
O<br />
O O<br />
O<br />
N<br />
S<br />
S P<br />
1.12x<br />
3.98x<br />
10.6x<br />
for three pesticide s lindane, phosal one, and o-phenyl phenol obtained by hot splitl ess inje ction in<br />
solve nt a nd matrix-mat ched stand ards wi thout and with the above mixture <strong>of</strong> analyte prote ctants,<br />
demon strating dram atic improvem ent in peak shapes an d intensit ies wi th the use <strong>of</strong> analyt e<br />
prote ctants [38].<br />
Bes ides the above compe nsation approac hes, also careful optimizati on <strong>of</strong> injectio n and separa tion<br />
param eters (includin g the choice <strong>of</strong> suitable inje ction technique, temperat ure, and volume; liner size<br />
and its desig n; solvent expansi on volum e; column fl ow rate; colum n dimensi ons) can reduce to some<br />
extent the numbe r <strong>of</strong> active sites avail able for interacti on (lower surface area) and its durat ion [37].<br />
7.6 FOOD ANALYSIS APPLICATIONS<br />
Injection in:<br />
Matrix<br />
Solvent<br />
Since a large range <strong>of</strong> food co mpounds are (semi)vo latile co mpounds, the GC is widely used for their<br />
deter minati on. The ch oice <strong>of</strong> an optimal GC setup depends on the requireme nts for the performanc e<br />
charact eristics <strong>of</strong> methods used, cost, speed, and several other factors. In Tab le 7.7, the curren t GC<br />
methods for several groups <strong>of</strong> food constituents are summarized with special attention paid to<br />
applicability <strong>of</strong> recent advances in the field <strong>of</strong> this technique for their analysis [39–43].<br />
2.16x<br />
B) With analyte protectants<br />
FIGURE 7.14 Comparison <strong>of</strong> peak shapes and intensities <strong>of</strong> 100 ng=mL lindane (m=z 219), phosalone (m=z<br />
182), and o-phenylphenol (m=z 170) obtained by injection in matrix (mixed fruit extract) and solvent (MeCN)<br />
solutions (A) without and (B) with the addition <strong>of</strong> analyte protectants (3-ethoxypropane-1,2-diol, L-gulonic acid<br />
g-lactone, and D-glucitol at 10, 1, and 1 mg=mL in the injected sample, respectively). (Reproduced from<br />
Mastovska, K., Lehotay, S.J., and Anastassiades M., Anal. Chem., 77, 8129, 2005. With permission.)<br />
ß 2008 by Taylor & Francis Group, LLC.
TABLE 7.7<br />
Overview <strong>of</strong> Typical Conditions <strong>of</strong> Most Common Applications Employing GC<br />
for Separation<br />
Natural<br />
substances<br />
<strong>Food</strong><br />
contaminants<br />
Lipids (fatty acids,<br />
mostly derivatized)<br />
Aroma and flavor<br />
compounds<br />
ß 2008 by Taylor & Francis Group, LLC.<br />
Injection Typical GC Column Phase Detection<br />
Split Polyethylene glycol<br />
70% Cyanopropyl-phenyl–30%<br />
dimethylpolysiloxane<br />
Split, splitless, SPME 5% Diphenyl–95%<br />
dimethylpolysiloxane<br />
Polyethylene glycol<br />
FID, MS<br />
MS, FID<br />
Modern pesticides Splitless, PTV, 5% Diphenyl–95%<br />
MS, ECD,<br />
DSI=DMI, SPME dimethylpolysiloxane<br />
NPD, FPD,<br />
50% Diphenyl–50%<br />
PFPD, AED,<br />
dimethylpolysiloxane<br />
6% Cyanopropyl-phenyl–94%<br />
dimethylpolysiloxane<br />
35% Diphenyl–65%<br />
dimethylpolysiloxane<br />
PID, ELCD<br />
Polychlorinated Splitless, PTV 5% Diphenyl–95%<br />
ECD, MS<br />
biphenyls<br />
dimethylpolysiloxane<br />
50% Diphenyl–50%<br />
dimethylpolysiloxane<br />
Polychlorinated Splitless, PTV 5% Diphenyl–95%<br />
MS<br />
dibenzo-p-dioxins<br />
dimethylpolysiloxane<br />
and dibenz<strong>of</strong>urans<br />
50% Cyanopropyl-phenyl–50%<br />
dimethylpolysiloxane<br />
other special phases<br />
Brominated flame Splitless, PTV 100% Dimethylpolysiloxane MS, ECD<br />
retardants<br />
5% Diphenyl–95%<br />
dimethylpolysiloxane<br />
14% Cyanopropyl-phenyl–86%<br />
dimethylpolysiloxane<br />
Polycyclic aromatic Splitless, PTV 5% Diphenyl–95%<br />
MS, PID<br />
hydrocarbons<br />
dimethylpolysiloxane<br />
50% Diphenyl–50%<br />
dimethylpolysiloxane<br />
Veterinary drugs Splitless 100% Dimethylpolysiloxane MS<br />
(derivatized)<br />
5% Diphenyl–95%<br />
dimethylpolysiloxane<br />
Mycotoxins Splitless 5% Diphenyl–95%<br />
MS, ECD<br />
(derivatized)<br />
dimethylpolysiloxane<br />
Acrylamide Splitless, PTV, DSI 5% Diphenyl–95%<br />
MS (both<br />
dimethylpolysiloxane<br />
forms), ECD<br />
(derivatized form)<br />
(derivatized<br />
Polyethylene glycol<br />
(nonderivatized form)<br />
form)<br />
Chloropropanols Splitless, PTV 5% Diphenyl–95%<br />
MS<br />
(derivatized)<br />
dimethylpolysiloxane<br />
Heterocyclic amines Splitless 5% Diphenyl–95%<br />
MS<br />
(derivatized)<br />
dimethylpolysiloxane<br />
50% diphenyl–50%<br />
dimethylpolysiloxane<br />
(continued )
TABLE 7.7 (continued)<br />
Overview <strong>of</strong> Typical Conditions <strong>of</strong> Most Common Applications Employing GC<br />
for Separation<br />
<strong>Food</strong><br />
contaminants<br />
7.7 CONCLUSION AND FUTURE TRENDS<br />
After severa l decades <strong>of</strong> GC on the mark et, the techno logy and its appli cations have improved<br />
signi fi cantly. Despit e that they have no t reached an end to the p ossibilities, which are con ceivable.<br />
The re are alwa ys new challenges for further imp rovements <strong>of</strong> performanc e and extend ing the scope<br />
<strong>of</strong> applicati ons. Con sidering future uses o f GC in food analys is, the mai n trend fores een is<br />
succes sive replacemen t <strong>of</strong> conventional detection approac hes by MSD s employin g vario us types<br />
<strong>of</strong> mass analyz ers. Fast GC –MS can be introdu ced in many applicati ons; thanks to the spectral<br />
resol ution <strong>of</strong> co-el uting compo unds that can compe nsate for low er GC resolution obtai ned in h ighspeed<br />
separa tions.<br />
ACKNOWLEDGMENTS<br />
This chapte r was financia lly suppor ted by the Mini stry <strong>of</strong> Edu cation, Youth and Sp orts <strong>of</strong> the Czech<br />
Rep ublic (project MSM 604 6137305) .<br />
REFERENCES<br />
Phthalate and<br />
adipate esters<br />
Epoxy-compounds<br />
(derivatized)<br />
Injection Typical GC Column Phase Detection<br />
Splitless, SPME 5% Diphenyl–95%<br />
dimethylpolysiloxane<br />
Splitless 5% Diphenyl–95%<br />
dimethylpolysiloxane<br />
MS, ECD<br />
Note: AED, atomic-emission detector; DMI, difficult matrix introduction; DSI, Direct sample introduction; ECD, electron<br />
capture detector; ELCD, electrolytic conductivity detector; FID, flame ionization detector; NPD, nitrogen–<br />
phosphorus detector; PFPD, pulsed flame photometric detector; PID, photo-ionization detector; PTV,<br />
programmable temperature vaporization; MS, mass spectrometry; SPME, solid-phase microextraction.<br />
1. Hinshaw, J.V., Setting realistic expectations for GC optimization, LC GC Eur., 20, 138, 2007.<br />
2. Hewlett-Packard FlowCalc 2.0 s<strong>of</strong>tware. Available at http:==www.chem.agilent.com=ca g=servsup=users<strong>of</strong>t=<br />
files=GCFC.htm via the Internet. Accessed July 1, 2007.<br />
3. Hajslova, J. and Zrostlikova, J., Matrix effects in (ultra)trace analysis <strong>of</strong> pesticide residues in food and<br />
biotic matrices, J. Chromatogr. A, 1000, 181, 2003.<br />
4. Godula, M., Hajslova, J., and Alterova, K., Pulsed splitless injection and the extent <strong>of</strong> matrix effects in the<br />
analysis <strong>of</strong> pesticides, J. High Resolut. Chromatogr., 22, 395, 1999.<br />
5. Zrostlikova, J. et al., Performance <strong>of</strong> programmed temperature vaporizer, pulsed splitless and on-column<br />
injection techniques in analysis <strong>of</strong> pesticide residues in plant matrices, J. Chromatogr. A, 937, 73, 2001.<br />
6. Stan, H.J. and Müller, H.M., Evaluation <strong>of</strong> automated and manual hot-splitless, cold-splitless (PTV), and<br />
on-column injection technique using capillary gas chromatography for the analysis <strong>of</strong> organophosphorus<br />
pesticides, J. High Res. Chromatogr., 11, 140, 1988.<br />
7. Grolimund, B. et al., Solvent trapping during large volume injection with an early vapor exit, Part 2:<br />
Chromatographic results and conclusions, J. High Res. Chromatogr., 21, 378, 1998.<br />
8. Bailey, R., Injectors for capillary gas chromatography and their application to environmental analysis,<br />
J. Environ. Monit., 7, 1054, 2005.<br />
9. Grob, K. and Li, Z., PTV splitless injection <strong>of</strong> sample volumes up to 20 mL, J. High Res. Chromatogr., 11,<br />
626, 1988.<br />
ß 2008 by Taylor & Francis Group, LLC.<br />
MS
10. Grob, K. and Läubli, Th., Splitless injection-development and state <strong>of</strong> the art. Including a comparison <strong>of</strong><br />
matrix (‘‘dirt’’) effects in conventional and PTV splitless injection, J. High Res. Chromatogr., 11, 462, 1988.<br />
11. Termonia, M., Lacomblez, B., and Munari, F., Optimization <strong>of</strong> the cold split-splitless injector in the<br />
solvent-split mode, J. High Res. Chromatogr., 11, 890, 1988.<br />
12. Staniewski, J. and Rijks, J.A., Potential and limitations <strong>of</strong> differently designed programmed-temperature<br />
injector liners for large volume sample introduction in capillary GC, J. High Res. Chromatogr.,16,182,1993.<br />
13. Godula, M. et al., Optimization and application <strong>of</strong> the PTV injector for the analysis <strong>of</strong> pesticide residues,<br />
J. Sep. Sci., 24, 355, 2001.<br />
14. Jing, H. and Amirav, A., Pesticide analysis with the pulsed-flame photometer detector and a direct sample<br />
introduction device, Anal. Chem., 69, 1426, 1997.<br />
15. Cajka, T. et al., Use <strong>of</strong> automated direct sample introduction with analyte protectants in the GC–MS<br />
analysis <strong>of</strong> pesticide residues, J. Sep. Sci., 28, 1048, 2005.<br />
16. Patel, K. et al., Evaluation <strong>of</strong> large volume-difficult matrix introduction–gas chromatography–time <strong>of</strong><br />
flight–mass spectrometry (LV-DMI-GC-TOF-MS) for the determination <strong>of</strong> pesticides in fruit-based baby<br />
foods, <strong>Food</strong> Addit. Contam., 21, 658, 2004.<br />
17. Lehotay, S.J., <strong>Analysis</strong> <strong>of</strong> pesticide residues in mixed fruit and vegetable extracts by direct sample<br />
introduction=gas chromatography=tandem mass spectrometry, J. AOAC Int., 83, 680, 2000.<br />
18. Kataoka, H., Lord, H.L., and Pawliszyn, J., Applications <strong>of</strong> solid-phase microextraction in food analysis,<br />
J. Chromatogr. A, 880, 35, 2000.<br />
19. Mastovska, K. and Lehotay, S.J., Practical approaches to fast gas chromatography–mass spectrometry,<br />
J. Chromatogr. A, 1000, 153, 2003.<br />
20. Mastovska, K., Instrumental aspects and application <strong>of</strong> (ultra)fast gas chromatography–mass spectrometry,<br />
in Niessen, W. (Ed.), Encyclopedia <strong>of</strong> Mass Spectrometry, Elsevier, Oxford, 2006, p. 73.<br />
21. Mondello, L. et al., Evaluation <strong>of</strong> fast gas chromatography and gas chromatography–mass spectrometry in<br />
the analysis <strong>of</strong> lipids, J. Chromatogr A., 1035, 237, 2004.<br />
22. de Zeeuw, J. et al., A simple way to speed up separations by GC–MS using short 0.53 mm columns and<br />
vacuum outlet conditions, J. High Resol. Chromatogr., 23, 677, 2000.<br />
23. Mastovska, K., Lehotay, S.J., and Hajslova, J., Optimization and evaluation <strong>of</strong> low-pressure gas chromatography–mass<br />
spectrometry for the fast analysis <strong>of</strong> multiple pesticide residues in a food commodity,<br />
J. Chromatogr. A, 926, 291, 2001.<br />
24. Mastovska, K., Lehotay, S.J., and Hajslova, J., Ruggedness and other performance characteristics <strong>of</strong> lowpressure<br />
gas chromatography–mass spectrometry for the fast analysis <strong>of</strong> multiple pesticide residues in food<br />
crops, J. Chromatogr. A, 1054, 335, 2004.<br />
25. Dallüge, J. et al., Optimization and characterization <strong>of</strong> comprehensive two-dimensional gas chromatography<br />
with time-<strong>of</strong>-flight mass spectrometric detection (GC GC-TOF MS), J. Sep. Sci., 25, 201, 2002.<br />
26. Dallüge, J., Beens, J., and Brinkman, U.A.Th., Comprehensive two-dimensional gas chromatography: A<br />
powerful and versatile analytical tool, J. Chromatogr. A, 1000, 69, 2003.<br />
27. Zrostlikova, J., Hajslova, J., and Cajka, T., Evaluation <strong>of</strong> two-dimensional gas chromatography–time-<strong>of</strong>flight<br />
mass spectrometry for the determination <strong>of</strong> multiple pesticide residues in fruit, J. Chromatogr. A,<br />
1019, 173, 2003.<br />
28. Cajka, T. et al., Solid phase microextraction–comprehensive two-dimensional gas chromatography–time<strong>of</strong>-flight<br />
mass spectrometry for the analysis <strong>of</strong> honey volatiles, J. Sep. Sci., 30, 534, 2007.<br />
29. Adahchour, M. et al., Recent developments in comprehensive two-dimensional gas chromatography<br />
(GC GC): I. Introduction and instrumental set-up, TrAC-Trend Anal. Chem., 25, 438, 2006.<br />
30. Adahchour, M. et al., Recent developments in comprehensive two-dimensional gas chromatography<br />
(GC GC): II. Modulation and detection, TrAC-Trend Anal. Chem., 25, 540, 2006.<br />
31. Cajka, T. and Hajslova, J., Gas chromatography–time-<strong>of</strong>-flight mass spectrometry in food analysis, LC GC<br />
Eur., 20, 25, 2007.<br />
32. Larson, P., Detectors for quantitative gas chromatography, in Handley, A.J. and Adlard, E.R. (Eds.), Gas<br />
Chromatographic Techniques and Applications, Sheffield Academic Press, Sheffield, 2001, p. 122.<br />
33. Powell, M., Detectors for compound identification, in Handley, A.J. and Adlard, E.R. (Eds.), Gas<br />
Chromatographic Techniques and Applications, Sheffield Academic Press, Sheffield, 2001, p. 140.<br />
34. Erney, D.R. et al., Explanation <strong>of</strong> the matrix-induced chromatographic response enhancement <strong>of</strong> organophosphorus<br />
pesticides during open tubular column gas chromatography with splitless or hot on-column<br />
injection and flame photometric detection, J. Chromatogr. A, 638, 57, 1993.<br />
ß 2008 by Taylor & Francis Group, LLC.
35. Dusek, B., Hajslova, J., and Kocourek, V., Determination <strong>of</strong> nitrated polycyclic aromatic hydrocarbons<br />
and their precursors in biotic matrices, J. Chromatogr. A, 982, 127, 2002.<br />
36. Fajgelj, A. and Ambrus A. (Eds.), Principles and Practices <strong>of</strong> Method Validation, Royal Society <strong>of</strong><br />
Chemistry, Cambridge, United Kingdom, 2000.<br />
37. Anastassiades, M., Mastovska, K., and Lehotay, S.J., Evaluation <strong>of</strong> analyte protectants to improve gas<br />
chromatographic analysis <strong>of</strong> pesticides, J. Chromatogr. A, 1015, 163, 2003.<br />
38. Mastovska, K., Lehotay, S.J., and Anastassiades M., Combination <strong>of</strong> analyte protectants to overcome<br />
matrix effects in routine GC analysis <strong>of</strong> pesticide residues in food matrixes, Anal. Chem., 77, 8129, 2005.<br />
39. Hajslova, J. and Cajka, T., Gas chromatography–mass spectrometry (GC–MS), in Pico, Y. (Ed.), <strong>Food</strong><br />
Toxicants <strong>Analysis</strong>, Elsevier, Oxford, 2006, p. 419.<br />
40. Careri, M., Bianchi, F., and Corradini, C., Recent advances in the application <strong>of</strong> mass spectrometry in<br />
food-related analysis, J. Chromatogr. A, 970, 3, 2002.<br />
41. Santos, F.J. and Galceran, M.T., Modern developments in gas chromatography–mass spectrometry-based<br />
environmental analysis, J. Chromatogr. A, 1000, 125, 2003.<br />
42. Mastovska, K., <strong>Food</strong> & nutritional analysis: (q) Pesticide residues, In Worsfold, P., Townshend, A., and<br />
Poole, C. (Eds.), Encyclopedia <strong>of</strong> Analytical Science, Elsevier, Oxford, 2005, p. 251.<br />
43. Covaci, A., Voorspoels, S., and de Boer, J., Determination <strong>of</strong> brominated flame retardants, with emphasis<br />
on polybrominated diphenyl ethers (PBDEs) in environmental and human samples—a review, Environ.<br />
Int., 29, 735, 2003.<br />
ß 2008 by Taylor & Francis Group, LLC.
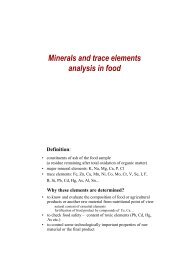

![Legislativa - Označování potravin [režim kompatibility]](https://img.yumpu.com/15533670/1/190x135/legislativa-oznacovani-potravin-rezim-kompatibility.jpg?quality=85)