Åpne i nytt vindu
Åpne i nytt vindu
Åpne i nytt vindu

Create successful ePaper yourself
Turn your PDF publications into a flip-book with our unique Google optimized e-Paper software.
DET NORSKE VERITAS<br />
Report<br />
Environmental Sediment Survey<br />
Frigg 2010<br />
Total E&P Norge AS<br />
Report No./DNV Reg No.: 2010-1479/ 12O31ER-5<br />
Rev 01, 2010-11-30
DET NORSKE VERITAS<br />
Report for Total E&P Norge AS<br />
Environmental Sediment Survey Frigg 2010<br />
Table of Contents<br />
DNV Reg. No.: 12O31ER-5<br />
Revision No.: 01<br />
Date : 2010-11-30 Page ii of iii<br />
MANAGING RISK<br />
CONCLUSIVE SUMMARY / SAMMENDRAG.................................................................. 1<br />
1 INTRODUCTION ............................................................................................................. 3<br />
2 MATERIALS AND METHODS...................................................................................... 4<br />
2.1 Field work .................................................................................................................. 4<br />
2.2 Macrobenthic analyses ............................................................................................... 6<br />
2.2.1 Macrobenthic analyses – an introduction ............................................................ 6<br />
2.2.2 Sorting and species identification........................................................................ 6<br />
2.2.3 Analytical methods .............................................................................................. 7<br />
2.2.4 Comparison of taxonomical data between years ................................................. 7<br />
2.2.5 Quality assurance................................................................................................. 8<br />
2.3 Chemical analysis and physical characterization of the sediments............................ 8<br />
2.3.1 Sediment characterization.................................................................................... 8<br />
2.3.1.1 Grain size distribution................................................................................. 8<br />
2.3.1.2 Total organic matter .................................................................................. 11<br />
2.3.2 Chemical analyses ............................................................................................. 11<br />
2.3.2.1 Hydrocarbons ............................................................................................ 11<br />
2.3.2.2 Metals........................................................................................................ 13<br />
2.3.2.3 Determination and quantification limits.................................................... 14<br />
2.3.3 Quality assurance............................................................................................... 14<br />
2.4 Deviation from Guidelines....................................................................................... 14<br />
3 RESULTS ......................................................................................................................... 15<br />
3.1 Sediment characterization ........................................................................................ 15<br />
3.1.1 Grain size distribution........................................................................................ 15<br />
3.1.2 Total organic matter (TOM) .............................................................................. 15<br />
3.2 Chemical analysis..................................................................................................... 16<br />
3.2.1 Hydrocarbons..................................................................................................... 16<br />
3.2.2 Metals ................................................................................................................ 18<br />
3.3 Biological analysis ................................................................................................... 21<br />
3.4 Conclusions .............................................................................................................. 26<br />
4 REFERENCES ................................................................................................................ 27<br />
Appendix 1 Extract from Survey Report<br />
Appendix 2 Test Report – Sampling and biological analyses<br />
Appendix 3 Analysis Report - Molab
DET NORSKE VERITAS<br />
Report for Total E&P Norge AS<br />
Environmental Sediment Survey Frigg 2010<br />
DNV Reg. No.: 12O31ER-5<br />
Revision No.: 01<br />
Date : 2010-11-30 Page iii of iii<br />
MANAGING RISK<br />
Preface<br />
The environmental sediment survey at Frigg in 2010 has been carried out jointly by Det Norske<br />
Veritas and Molab, on behalf of Total E&P Norge AS. The work has been carried out as a part of<br />
the regional environmental monitoring in Region III (Oseberg/Troll) coordinated through Statoil.<br />
Total’s representative has been Laurence Pinturier<br />
Personnel<br />
Field work: Sam-Arne Nøland survey leader, Thomas Møskeland (shift leader), Øyvind<br />
Fjukmoen (shift leader), Marte Braathen, Christian Volan (all DNV) and Gunn Mari Michaelsen<br />
and Odd Strandvoll (both Molab).<br />
Sediment analyses:<br />
Grain size distribution: Terje Kolberg, Eli Ellingsen<br />
TOM analysis: Terje Kolberg, Eli Ellingsen<br />
Metal analyses: Gunn Mari Michaelsen, Terje Pedersen, Hanne Skog<br />
Lillevik, Wenche Brennbakk<br />
THC analysis: Daniel Perez, Anna Jønsson, Tove Kristin Dokka Torstensen<br />
Selected hydrocarbon analyses: Tove Kristin Dokka Torstensen<br />
The grain size distribution is analyzed at Molab AS, section Glomfjord. The organic chemical<br />
analyses are performed at Molab AS, section Oslo, the preparation of the inorganic samples are<br />
performed at Molab AS, section Mo i Rana, and due to a minor fire the instrumental analyses was<br />
carried out by a co-operator, ALS.<br />
Biological analyses:<br />
Species identification: Thomas Møskeland, DNV (Crustacea)<br />
Amund Ulfsnes, DNV (Echinodermata/mollusca)<br />
Per Bie Wikander, Molltax (Mollusca)<br />
Øystein Stokland, Marine Bunndyr (Polychaeta, varia)<br />
Sorting has taken place at DNV’s Biology Laboratory. Christian Volan and Ludvig Søgnen<br />
Jensen have been in charge of the sorting.<br />
Univariate analyses: Amund Ulfsnes, Thomas Møskeland<br />
Multivariate analyses: Amund Ulfsnes<br />
Report preparation:<br />
Chemistry: Tove Kristin Dokka Torstensen<br />
Biology: Amund Ulfsnes, Sam-Arne Nøland<br />
Main Report: Sam-Arne Nøland<br />
Verification: Øyvind Fjukmoen<br />
Project Manager: Sam-Arne Nøland
DET NORSKE VERITAS<br />
Report for Total E&P Norge AS<br />
Environmental Sediment Survey Frigg 2010<br />
CONCLUSIVE SUMMARY / SAMMENDRAG<br />
SUMMARY<br />
DNV Reg. No.: 12O31ER-5<br />
Revision No.: 01<br />
Date : 2010-11-30 Page 1 of 27<br />
MANAGING RISK<br />
This report presents the results from the environmental survey at Frigg in 2010. Det Norske<br />
Veritas and Molab AS carried out the survey jointly on the behalf of Total E&P Norge AS.<br />
Apart from the concrete substructures left in place, all installations removed and brought to<br />
shore for material recovery. This survey is part of the mandatory environmental surveys<br />
described in the Frigg Field Cessation Plan and to be undertaken before and after<br />
decommissioning work. The first mandatory environmental survey took place in 2003 before<br />
the start of the decommissioning work; the second took place in 2006 during<br />
decommissioning.<br />
The main results from the survey at Frigg in 2010 are presented below.<br />
The major sediment component is sand (94-99 %), and all samples are classified as fine sand.<br />
The content of silt and clay is low, between 0.5 and 2.2 %. The content of gravel is 2.2 % for<br />
station FRI1 and 4.9 % for FRI25. For the remaining stations the content of gravel is LSC, and<br />
these elevated levels are most pronounced at stations FRIX1, -1, -3 and -4 where the fauna is<br />
slightly different from the other field stations. Compared with previous surveys it is some<br />
minor differences, but it is not found any trend, and overall there were no major differences<br />
compared to previous surveys. A summary of the results are shown in the table below.<br />
Summary of the chemical analyses, sediment characterization and biology.<br />
Analytical method Parameter Variation at Frigg 2010<br />
Sediment characterization<br />
• Grain size distribution Silt and clay (%): 0.5 - 2.2<br />
Sand (%): 99.5 - 93.4<br />
Gravel (%): 0 - 4.9<br />
Median particle diameter (φ): 2.35 - 2.54<br />
• Total organic matter (%) TOM: 0.45 - 0.76<br />
Chemical analyses<br />
• Hydrocarbons (mg/kg) THC: 4 - 11<br />
NPD: 0.08 - 0.08<br />
PAH: 0.142 - 0.142<br />
• Metals (mg/kg) Ba: 28 - 189<br />
Cd: < 0.03 - 0.06<br />
Cr: 4.2 - 12.8<br />
Cu: 1.1 - 26.5<br />
Hg: < 0.01 - 0.02<br />
Pb: 3.2 - 53.8<br />
Zn: 6 - 290
DET NORSKE VERITAS<br />
Report for Total E&P Norge AS<br />
Environmental Sediment Survey Frigg 2010<br />
DNV Reg. No.: 12O31ER-5<br />
Revision No.: 01<br />
Date : 2010-11-30 Page 2 of 27<br />
MANAGING RISK<br />
Fauna<br />
Shannon-Wiener H’ 3.5 - 5.3<br />
Rarefaction ES100 25 - 39<br />
Pielou’s evenness J 0.56 - 0.80<br />
SAMMENDRAG<br />
Hovedresultatene fra etterkantundersøkelsen på Frigg i 2010 er presentert nedenfor.<br />
Sedimentene består hovedsakelig av sand (94-99 %), og alle prøvene blir klassifisert som fin<br />
sand. Innholdet av silt og leire er lavt, og varierer mellom 0,5-2,2 %. Innholdet av grus er 2,2<br />
% på stasjon FRI1 og 4,9 % på stasjon FRI25, på de øvrige stasjonene er innholdet av grus <<br />
0,5 %. Innholdet av totalt organisk materiale er lavt (0,45-0,76 %).<br />
Totalt innhold av THC varierer fra 4-11 mg/kg. Det er valgt å sammenligne med LSC-verdien<br />
for subregion nord fra undersøkelsen på Region II i 2006 (LSC north 97-06). Det er ikke<br />
funnet konsentrasjoner av THC som overstiger LSC-verdien ved noen av stasjonene. På<br />
stasjon FRI3 er konsentrasjonen av PAH og NPD i sjiktet 1-3 cm hhv 4,24 og 1,80 mg/kg,<br />
THC-konsentrasjonen i denne prøven er 15 mg/kg.<br />
Konsentrasjonene av Ba i området er 28-189 mg/kg. Tre stasjoner har Ba-konsentrasjoner<br />
over LSC-nivå. Flere av stasjonene har metallkonsentrasjoner over LSC, mest markert på<br />
stasjonene FRIX1, -1, -3 og -4 der faunaen er litt forskjellig fra de andre feltstasjonene.<br />
Sammenlignet med tidligere undersøkelser er det noen mindre forskjeller, men det er ikke<br />
funnet noen trend. Samlet sett er det små variasjoner i resultatene fra 2010 sammenlignet med<br />
de senere års undersøkelser (2003 og 2006). Et sammendrag av resultatene er gitt i tabellen<br />
under.<br />
Sammendrag av resultatene fra den kjemiske analysen og sedimentkarakteriseringen<br />
Analyse Parameter Variasjon på Frigg 2010<br />
Sedimentkarakterisering<br />
• Kornstørrelsesfordeling Silt og leire (%): 0,5 - 2,2<br />
Sand (%): 99,5 - 93,4<br />
Grus (%): 0 - 4,9<br />
Median partikkeldiameter (φ): 2,35 - 2,54<br />
• Totalt organisk materiale (%) TOM: 0,45 - 0,76<br />
Kjemisk analyse<br />
• Hydrokarboner (mg/kg) THC: 4 - 11<br />
NPD: 0,08 - 0,08<br />
PAH: 0,142 - 0,142<br />
• Metaller (mg/kg) Ba: 28 - 189<br />
Cd: < 0,03 - 0,06<br />
Cr: 4,2 - 12,8<br />
Cu: 1,1 - 26,5<br />
Hg: < 0,01 - 0,02<br />
Pb: 3,2 - 53,8<br />
Zn: 6 - 290<br />
Fauna<br />
Shannon-Wiener H’ 3,5 - 5,3<br />
Rarefaction ES100 25 - 39<br />
Pielou’s jevnhet J 0,56 - 0,80
DET NORSKE VERITAS<br />
Report for Total E&P Norge AS<br />
Environmental Sediment Survey Frigg 2010<br />
1 INTRODUCTION<br />
DNV Reg. No.: 12O31ER-5<br />
Revision No.: 01<br />
Date : 2010-11-30 Page 3 of 27<br />
MANAGING RISK<br />
Det Norske Veritas and Molab AS have carried out in 2010 an environmental sediment survey<br />
within the 500m zone of the Frigg Field on behalf of Total E&P Norge AS.<br />
Frigg is located in block 25/1. Production at the field started in September 1977 and stopped<br />
in October 2004. A total of 14 wells were permanently plugged and abandoned between<br />
October and December 2004. The offshore removal works of the facilities on Frigg<br />
commenced in March 2005. Apart from the three concrete substructures left in place, all<br />
installations and pipelines and cables between the Frigg platforms have been removed and<br />
brought to shore for material recovery.<br />
All offshore removal works were completed in 2009. The post-removal work performed<br />
within the Cessation Project has been:<br />
- a survey to identify the sea floor debris (target) to be removed (Jan-Feb 2010)<br />
- removal of the targets identified (April-Mai 2010)<br />
- a gravel dumping survey to fill in holes at DP2/QP/DP1 (July 2010)<br />
- a final bottom trawling test (September 2010)<br />
The first of the mandatory environmental surveys linked to the decommissioning of the Frigg<br />
Field, to be undertaken before and after completion of the decommissioning work, was carried<br />
out in 2003. The last mandatory sediment survey was scheduled for 2009 as part of the<br />
regional environmental monitoring survey in Region II in the Norwegian Sector of the North<br />
Sea. As the decommissioning work offshore was foreseen completed within 2009, Total E&P<br />
Norge applied for and obtained approval from the Norwegian Climate and Pollution Agency<br />
(KLIF) to postpone the last mandatory survey to 2010. An environmental sediment survey<br />
was also carried out during the decommission work in 2006 as part of the Region II<br />
monitoring.<br />
The 2010 sediment survey has been performed after the debris had been removed.<br />
Seabed Seabed sampling sampling<br />
2003 2004 2005 2006 2007 2008 2009 2010<br />
Gas production stopped<br />
Gas production stopped<br />
Offshore Offshore removal removal started started<br />
Seabed Seabed sampling sampling<br />
Offshore Offshore removal removal completed completed<br />
Debris Debris clearance clearance<br />
Seabed Seabed sampling sampling<br />
The 2010 survey program was based on the results obtained from the previous monitoring<br />
surveys and included both biology and chemistry analyses. The sampling stations were<br />
selected based on 2003 and 2006 program.
DET NORSKE VERITAS<br />
Report for Total E&P Norge AS<br />
Environmental Sediment Survey Frigg 2010<br />
DNV Reg. No.: 12O31ER-5<br />
Revision No.: 01<br />
Date : 2010-12-01 Page 4 of 27<br />
MANAGING RISK<br />
Discharges history at Frigg between 2003 and 2009 (all numbers in tons with the exception of<br />
hydraulic oil in litre).<br />
SFT class description SFT* 2003 2004 2005 2006 2007 2008 2009<br />
Number of plugged wells 14 0 0 0 0 0 0<br />
Water green 5.74 5.67 - 0 0.164 0 0<br />
PLONOR Chemicals green 8.74 10.0 - 0 0 0 0<br />
BioDeg
DET NORSKE VERITAS<br />
Report for Total E&P Norge AS<br />
Environmental Sediment Survey Frigg 2010<br />
The main equipment used was:<br />
• van Veen grabs<br />
• Reception table for grab in stainless steel<br />
• Washing table for biological samples<br />
• two sets of sieves for washing of biological samples<br />
DNV Reg. No.: 12O31ER-5<br />
Revision No.: 01<br />
Date : 2010-11-30 Page 5 of 27<br />
MANAGING RISK<br />
Sampling was carried out in accordance with accredited procedures described in Handbook<br />
for the Biology laboratory quality system; sampling of marine sediment and soft bottom<br />
analyses. It was emphasized that the sediment surface in the samples should be undisturbed<br />
and that the washing/sieving of the fauna samples was carried out gently. Animals were fixed<br />
in formaldehyd (4 % neutralized with hexamine), added pink Bengal and stored in plastic<br />
buckets. All samples were double labelled and packed in solid boxes to avoid damage to the<br />
samples.<br />
The field work was carried out in accordance to the survey program.<br />
The vessel was provided with dynamic positioning equipment. This means very precise<br />
positioning, and that the vessel can be kept in the exact same position over time. The variance<br />
in positioning was better than ± 5 m.<br />
Figure 2-1 Frigg sampling stations 2010. The Reference station FRI10R is not included.
DET NORSKE VERITAS<br />
Report for Total E&P Norge AS<br />
Environmental Sediment Survey Frigg 2010<br />
2.2 Macrobenthic analyses<br />
2.2.1 Macrobenthic analyses – an introduction<br />
DNV Reg. No.: 12O31ER-5<br />
Revision No.: 01<br />
Date : 2010-11-30 Page 6 of 27<br />
MANAGING RISK<br />
The macrobenthic fauna considered in this survey is found living either in, or on sand, silt or<br />
clay sediments. This fauna comprises the following main taxonomic groups: Polychaeta,<br />
Crustacea, Mollusca, Echinodermata and Varia (remaining groups). Only animals more than 1<br />
mm (macrobenthos) are included in the analysis.<br />
Macrobenthic fauna are traditionally included in offshore environmental monitoring. The<br />
reason for this is that the study of benthic communities can give an indication of the effects of<br />
pollution from offshore activities, while chemical monitoring of sediments is aimed at<br />
assessing the dispersion and concentration levels of pollutants in the vicinity of offshore<br />
installations. The benthic fauna is a suitable biological parameter for monitoring the effects of<br />
pollution since most of the species have limited mobility and changes in species composition<br />
and densities of individuals can therefore easily be identified. The distribution of the fauna<br />
can be related to natural variations in environmental parameters such as depth and type of<br />
sediment, but also anthropogenic factors such as discharges of drilling fluids, cuttings and<br />
others, including accidental releases of oil and physical disturbances.<br />
2.2.2 Sorting and species identification<br />
In the laboratory the samples were washed on 1 mm sieves with (circular holes) to remove<br />
formaldehyde and remaining fine sediment, and then sorted by hand under a magnifying<br />
glass. The animals were split into the major taxonomic groups; Echinodermata, Polychaeta,<br />
Crustacean, Mollusca and Varia and transferred to 70% ethanol before further identification<br />
was undertaken.<br />
Apart from the exceptions detailed below, all animals were identified to the lowest possible<br />
taxonomic level (i.e. generally to species level) and the number of individuals per taxon in<br />
each sample was recorded.<br />
In accordance with the Activities Regulations, Nematoda, Foraminifera and colonial<br />
organisms (i.e. Porifera and Bryozoa), were excluded from any data analyses. Some taxa (i.e.<br />
Platyhelminthes, Nemertini, Tunicata and Tanaidacea) were quantified but were not identified<br />
further. A number of representative specimens of each of the species/taxa identified were<br />
included in our reference collection.
DET NORSKE VERITAS<br />
Report for Total E&P Norge AS<br />
Environmental Sediment Survey Frigg 2010<br />
2.2.3 Analytical methods<br />
DNV Reg. No.: 12O31ER-5<br />
Revision No.: 01<br />
Date : 2010-11-30 Page 7 of 27<br />
MANAGING RISK<br />
The statistical and mathematical methods utilised to aid interpretation of the benthic fauna<br />
data are summarised below.<br />
• Abundance ratio<br />
• Shannon-Wiener's diversity index, H' (Shannon & Weaver 1963)<br />
• Evenness calculated by Pielou's "evenness" J' (Pielou 1969)<br />
• Expected number of species in a sample of 100 individuals (ES100)<br />
• Fauna similarity between stations by Bray-Curtis dissimilarity index d (Bray & Curtis<br />
1957). The resulting similarity matrix was utilised in multivariate analyses in order to group<br />
stations and assess gradients in the benthic communities. These methods were: hierarchical<br />
agglomerative classification with group-average sorting (Lance & Williams 1966), ordination<br />
with non-metric Multi-Dimensional Scaling (MDS), (Shepard 1962, Kruskal 1964).<br />
Classification and MDS ordination were carried out using the programme-package PRIMER<br />
(Plymouth Routines In Multivariate Ecological Research).<br />
The raw data is stored in MOD; MiljøOvervåkingsDatabasen (Environmental Monitoring<br />
Database).<br />
2.2.4 Comparison of taxonomical data between years<br />
Comparison of data at species level between years (trend analyses) involves taxonomic<br />
sources of errors which have to be minimized in order to get consistent data when using e.g.<br />
multivariate analyses. Comparison of univariate data, such as biodiversity indices between<br />
years does not raise the same problem and gives minimal or small fluctuations. Main sources<br />
of errors when using multiple data sets at species level are sampling methodology and<br />
variations between taxonomists.<br />
Species-level identification of all specimens is practically not possible. A number of obstacles<br />
are always present, e.g. the state of knowledge of the taxonomy of infaunal species. Some<br />
groups are comparatively well known, while others are relatively unknown. A substantial<br />
number of unrecognized species may be assumed to be present in the samples. These factors,<br />
along with various levels of experience and areas of expertise among taxonomists, are present<br />
in any survey of this kind, and will directly impact the survey results (Montagne & Bergen,<br />
1996).
DET NORSKE VERITAS<br />
Report for Total E&P Norge AS<br />
Environmental Sediment Survey Frigg 2010<br />
2.2.5 Quality assurance<br />
DNV Reg. No.: 12O31ER-5<br />
Revision No.: 01<br />
Date : 2010-11-30 Page 8 of 27<br />
MANAGING RISK<br />
Procedures including routines for quality assurance related to sorting, species identification<br />
and recording of macrobenthos samples are given in DNV’s Biolaboratoriets Kvalitetssystem,<br />
Prøvetaking av marint sediment og bløtbunnsanalyser. A brief summary is given here:<br />
All samples are recorded and double-labelled during fieldwork, and transported in wooden<br />
boxes in a steel container. During sorting in the laboratory all relevant information about each<br />
sample is recorded (who sorted what and when, time spent, number of bottles etc.). After<br />
sorting, each sediment sample is examined for remaining organisms by approved personnel.<br />
Each identifier establishes a separate reference collection of species for comparison purpose.<br />
To maintain traceability each identifier signs a log to keep track over which grab samples and<br />
animal group(s) he or she has been working on. The project reference collection is kept at<br />
DNV, Høvik.<br />
2.3 Chemical analysis and physical characterization of the sediments<br />
Analytical parameters<br />
Analysis Parameter<br />
Sediment characterization<br />
• Grain size distribution - Distribution of pelite (< 63 µm) and sand (> 63 µm)<br />
- Cumulative weight% distribution from 63-2000 µm<br />
- Median particle diameter (Mdφ), standard deviation (SDφ),<br />
skewness (Skφ) and kurtosis (Kφ)<br />
• Total organic matter (TOM) - % TOM in the sediment<br />
Chemical analyses<br />
• Hydrocarbons - THC, sum C12-C35<br />
- NPD, naphthalenes, phenanthrenes and dibenzothiophenes<br />
sum and single compounds<br />
- PAH, 16 EPA compounds<br />
sum and single compounds<br />
• Metals - Ba, Cd, Cr, Cu, Hg, Pb and Zn<br />
2.3.1 Sediment characterization<br />
2.3.1.1 Grain size distribution<br />
The method for grain size distribution analysis is described in Buchanan (1984). The analysis<br />
includes a fast mechanical separation of the sand fraction (> 63 µm) from the silt and clay<br />
fraction. The sand fraction is then dried and sieved over a series of graded sieves.<br />
From each station three subsamples (0-5 cm) from separate grab samples were mixed and<br />
homogenized, and one homogenized sample from each station was analyzed. Approximately<br />
10 g of the sample was weighed to the nearest 0.01 g before wet sieving on a 63 µm sieve.
DET NORSKE VERITAS<br />
Report for Total E&P Norge AS<br />
Environmental Sediment Survey Frigg 2010<br />
DNV Reg. No.: 12O31ER-5<br />
Revision No.: 01<br />
Date : 2010-11-30 Page 9 of 27<br />
MANAGING RISK<br />
The fraction passing this sieve was transferred to a plastic bottle. A separate sample was<br />
weighed and dried for dry weight determination. The percentage of silt and clay (< 63 µm) of<br />
total dry weight in the sample was then calculated.<br />
The fraction > 63 µm was dried at 100 °C for 12 hours and sieved over a series of<br />
Wenthworth graded sieves (Endecott Test Sieves, London) with mesh sizes ranging from<br />
2000 to 63 µm. The sample was shaken on a Retsch KG testing sieve shaker for ten minutes.<br />
The weight retained upon each sieve was determined to the nearest 0.01 g. The weight of all<br />
size fractions was used to prepare cumulative weight% distribution tables for each sampling<br />
site. This table was then used in calculating the median particle diameter and deviation,<br />
skewness and kurtosis of the particle size distribution. As the grain size distribution was not<br />
determined for the fraction < 63 µm, the φ-value for this fraction was given the value 8. The<br />
values for Mdφ, SDφ, Skφ, and Kφ should therefore be considered as extrapolated results.<br />
The mathematical expressions are given below.<br />
Mdφ (median particle diameter):<br />
Mdφ = the φ-value of the midpoint (i.e. 50 %) of the cumulative % weight curve. This<br />
measures the central tendency of the size frequency distribution.<br />
SDφ (standard deviation):<br />
SDφ estimated as:<br />
φ84<br />
- φ16<br />
SDφ<br />
=<br />
4<br />
φ95<br />
− φ5<br />
+<br />
6.<br />
6<br />
SDφ gives a measure of the spread in particle size around the Mdφ, and thus is a<br />
measure of the degree of sorting of the particles.<br />
Skφ (skewness):<br />
Kurtosis, Kφ:<br />
Skφ estimated as:<br />
φ16<br />
+ φ84<br />
− 2Mdφ<br />
φ5<br />
+ φ95<br />
− 2Mdφ<br />
Skφ<br />
=<br />
+<br />
2<br />
( φ84<br />
− φ16)<br />
2(<br />
φ95<br />
− φ5)<br />
Skφ describes the symmetry of the spread in distribution around the Mdφ. A<br />
completely symmetrical distribution will have Skφ = 0, negative values indicate<br />
displacement of the distribution curve towards coarser sediment, and positive Skφ<br />
indicates displacement towards finer sediment.<br />
Kφ estimated as:<br />
φ95<br />
- φ5<br />
Kφ<br />
=<br />
2.<br />
44<br />
( φ75<br />
− φ25)<br />
Kφ describes the toppedness of the distribution, i.e. how heavy the tails are (expressed<br />
by the φ5 and φ95 fractions) compared to the central portion of the distribution. For a<br />
normal distribution the expression above will give a Kφ value of 1.00.
DET NORSKE VERITAS<br />
Report for Total E&P Norge AS<br />
Environmental Sediment Survey Frigg 2010<br />
DNV Reg. No.: 12O31ER-5<br />
Revision No.: 01<br />
Date : 2010-11-30 Page 10 of 27<br />
MANAGING RISK<br />
Interpretation tables are enclosed in Table 2-1 and Table 2-2.<br />
Table 2-1 Grain size distribution. Interpretation of descriptive indiced (Buchanan, 1984).<br />
Parameter Index value Verbal classification<br />
Standard deviation (SDφ) < 0.35 Very well sorted<br />
0.25-0.50 Well sorted<br />
0.50-0.70 Moderately well sorted<br />
0.70-1.00 Moderately sorted<br />
1.00-2.00 Poorly sorted<br />
2.00-4.00 Very poorly sorted<br />
> 4.00 Extremely poorly sorted<br />
Skewness (Skφ) +1.00 to +0.30 Strongly fine skewed<br />
+0.30 to +0.10 Fine skewed<br />
+0.10 to -0.10 Symmetrical<br />
-0.10 to -0.30 Coarse skewed<br />
-0.30 to -1.00 Strongly coarse skewed<br />
Kurtosis (Kφ) +4.5 Silt and clay (pelite)
DET NORSKE VERITAS<br />
Report for Total E&P Norge AS<br />
Environmental Sediment Survey Frigg 2010<br />
2.3.1.2 Total organic matter<br />
DNV Reg. No.: 12O31ER-5<br />
Revision No.: 01<br />
Date : 2010-11-30 Page 11 of 27<br />
MANAGING RISK<br />
30-40 g of wet sediment was weighed into a porcelain dish. The sample was heated at 105 °C<br />
for minimum 20 hours, cooled and weighed, and then heated to 480 °C for minimum 16<br />
hours. The percent weight loss after the combustion was then calculated, and this value<br />
represents the total organic matter content (TOM) in the sediment. Two sediment standards<br />
with known TOM and calcium carbonate were heated together with the sediment samples.<br />
The calcium carbonate was used as a cross check on potential weight loss due to the<br />
conversion of carbonate to oxide.<br />
2.3.2 Chemical analyses<br />
2.3.2.1 Hydrocarbons<br />
The chemical analysis comprises determination of the total hydrocarbon content from n-C12 to<br />
n-C35 (THC) and selected hydrocarbons (NPD and PAH). The analytical steps are shown in<br />
Figure 2-2. The sediment samples were worked up by saponification, followed by extraction<br />
with dichloromethane. The extract was then separated in a non-polar and a polar fraction<br />
using a silica column. The non-polar fractions were analyzed for hydrocarbons by use of gas<br />
chromatography (GC).<br />
Sample preparation procedure:<br />
The sediment samples were collected in Rilsan bags. Homogenization was performed by<br />
stirring in the Rilsan bag, and small portions of the wet sample were taken randomly giving a<br />
total weight of about 50 g. Internal standards were added. The sample was refluxed with KOH<br />
in methanol for 2 hours. The mixture was then extracted by dichloromethane. The extract was<br />
evaporated to approximately 1 mL, re-dissolved in hexane and fractionated (cleaned up) on<br />
Bond-Elut silica columns (Isolute, International Sorbent Technology). The hexane fraction<br />
was concentrated and analyzed for hydrocarbons.<br />
An aliquot of the wet and homogenized sediment was weighed and dried for 48 hours at 105<br />
°C, for determination of the dry weight.<br />
Quantification:<br />
THC (total hydrocarbon content) was determined by gas chromatography with flame<br />
ionization detector, in the boiling range of n-C12 alkane to n-C35 alkane. The quantification<br />
was carried out according to an external standard of the reference oil, HDF 200, a drilling<br />
mud base oil. The reported values were corrected for background levels from procedural<br />
blanks.<br />
NPD and PAH were determined by gas chromatography/mass spectrometry operated in the<br />
selected ion recording mode (SIR). The quantification was carried out according to the added<br />
internal standards and integration of the molecular ions. The following compounds were<br />
determined: Naphthalene, phenanthrene/anthracene, dibenzothiophene and their C1-, C2- and<br />
C3-alkylated derivatives, acenaphtene, acenaphthylene, fluorene, pyrene/fluoranthene,
DET NORSKE VERITAS<br />
Report for Total E&P Norge AS<br />
Environmental Sediment Survey Frigg 2010<br />
DNV Reg. No.: 12O31ER-5<br />
Revision No.: 01<br />
Date : 2010-11-30 Page 12 of 27<br />
MANAGING RISK<br />
chrysene/ triphenylene, benzo(a)anthracene, benzo(a)pyrene, benzo(b)fluoranthene/<br />
benzo(j)fluoranthene/ benzo(k)fluoranthene, benzo(g,h,i)perylene, indeno(1,2,3-cd)pyrene<br />
and dibenzo(a,h)anthracene.<br />
Reference compounds were available for all the aromatic compounds. For each of the C1 - C3<br />
alkyl homologue groups one of the isomers was used as reference in the quantification. The<br />
reported values were corrected for background levels from procedural blanks.<br />
GC-FID conditions:<br />
Gas chromatograph : Perkin Elmer Autosystem XL<br />
Column : 12 m x 0.20 mm i.d., fused silica, crosslinked with dimethyl<br />
silicone<br />
Temperatures: Column : 50 °C (2 min) - 20 °C/min - 350 °C (8 min)<br />
Injector : 320 °C<br />
Detector : 350 °C<br />
Carrier gas : Helium<br />
Injection volume : 1 µL<br />
Data system : TotalChrom 6.2<br />
HDF 200 : 0.1 – 10 mg/mL hexane<br />
GC/MS conditions:<br />
Mass spectrometer : Clarus 500 Mass Spectrometer, Perkin Elmer<br />
Data system : TurboMass<br />
Gas chromatograph : Clarus 500 Gas Chromatograph, Perkin Elmer<br />
Column: : 30 m fused silica, 0.25 µm DB-5ms<br />
Temperatures: Column : 40 °C (2 min) - 20 °C/min - 120 °C -<br />
Injector : 300 °C<br />
Ion source : 180 °C<br />
Carrier gas : Helium<br />
10 °C/min - 300 °C (15 min)<br />
Ionization : Electron impact, 70 eV<br />
Masses (m/z)<br />
C0-C3 naphthalene : 128, 141, 156, 170<br />
C0-C3 phenanthrene : 178, 192, 206, 220<br />
C0-C3 dibenzothiophene : 184, 198, 212, 226<br />
PAH : 152, 153, 166, 202, 228, 252, 276, 278<br />
Deuterated standards : 136, 164, 188, 212, 240, 264<br />
Injection volume : 1 µL
DET NORSKE VERITAS<br />
Report for Total E&P Norge AS<br />
Environmental Sediment Survey Frigg 2010<br />
DNV Reg. No.: 12O31ER-5<br />
Revision No.: 01<br />
Date : 2010-11-30 Page 13 of 27<br />
MANAGING RISK<br />
Figure 2-2 Flow scheme of essential steps in the hydrocarbon analyses of sediments.<br />
2.3.2.2 Metals<br />
The metal analyses include determination of Ba, Cd, Cr, Cu, Hg, Pb and Zn after digestion<br />
with nitric acid (NS 4770).<br />
The wet sediment sample was dried at 40 °C for two days, homogenized and sieved through a<br />
500 µm nylon sieve. The fractions larger and smaller than 0.5 mm were weighed. 1 g of the<br />
fraction smaller than 0.5 mm was extracted with 20 mL 7 M nitric acid in a Pyrex<br />
decomposition bottle in an autoclave at 120 °C for 30 min. After cooling, 80 mL of distilled<br />
water was added to the Pyrex bottle. The clear solution was decanted into a polyethylene<br />
bottle until analysis.<br />
Ba, Cr, Cu, Pb and Zn were determined by inductively coupled plasma atomic emission<br />
spectrometry (ICP-AES). Cd was determined by atomic absorption, graphite furnace
DET NORSKE VERITAS<br />
Report for Total E&P Norge AS<br />
Environmental Sediment Survey Frigg 2010<br />
DNV Reg. No.: 12O31ER-5<br />
Revision No.: 01<br />
Date : 2010-11-30 Page 14 of 27<br />
MANAGING RISK<br />
technique (GF-AAS). Hg was determined by atomic adsorption cold vapor technique (CV-<br />
AAS) based on NS 4768.<br />
2.3.2.3 Determination and quantification limits<br />
The limit of detection (LOD) and limit of quantification (LOQ) are given in Table 2-3 and<br />
Table 2-4.<br />
Table 2-3. Limit of detection (LOD) and limit of quantification (LOQ), hydrocarbons.<br />
Analytical parameter LOD LOQ Blank samples<br />
mg/kg mg/kg Number<br />
THC 1 2 11<br />
Sum NPD 0.01 0.03 -<br />
Sum PAH 0.005 0.02 -<br />
Table 2-4. Limit of detection (LOD) and limit of quantification (LOQ), metals.<br />
Ba Cd Cr Cu Hg Pb Zn<br />
ICP GFAAS ICP ICP CVAAS ICP ICP<br />
LOD mg/kg 0.5 0.03 0.3 0.1 0.01 0.5 1<br />
LOQ mg/kg 1.5 0.1 1 0.3 0.03 1.5 3<br />
2.3.3 Quality assurance<br />
All the analyses are accredited. Molab AS is accredited by Norsk Akkreditering to perform<br />
chemical analyses, accreditation number Test 032. The accreditation is according to NS-EN<br />
ISO/IEC 17025. Due to a minor fire at our inorganic laboratory, ALS was uses as a cooperator<br />
for the instrumental analyses. The corresponding accreditation number for ALS is<br />
Swedac Ackreditering 2030, and the analyses were performed by ALS Scandinavia AB Luleå.<br />
2.4 Deviation from Guidelines<br />
The survey is performed according to the guidelines.
DET NORSKE VERITAS<br />
Report for Total E&P Norge AS<br />
Environmental Sediment Survey Frigg 2010<br />
3 RESULTS<br />
3.1 Sediment characterization<br />
3.1.1 Grain size distribution<br />
DNV Reg. No.: 12O31ER-5<br />
Revision No.: 01<br />
Date : 2010-11-30 Page 15 of 27<br />
MANAGING RISK<br />
The main results are shown in Table 3-1 Comparison of the grain size distribution in 2010<br />
with previous surveys is presented in Figure 3-1. Detailed results are given in Appendix 3.<br />
All samples from the stations consist mainly of sand (94-99 %). All sediments are classified<br />
as fine sand. There were no major differences compared to previous results.<br />
3.1.2 Total organic matter (TOM)<br />
The content of total organic matter is shown in Table 3-1. A comparison with results from<br />
previous surveys is given in Figure 3-1.<br />
The content of TOM is low, and range between 0.45 and 0.76 %. The content is similar, or<br />
lower than previous years.<br />
Table 3-1 Frigg 2010, grain size distribution and total organic matter (TOM) of dry sediment.<br />
FRI10R is reference station and not included in Figure 2-1.<br />
Station Direction Distance Depth TOM Classification Silt & clay Sand Gravel Median<br />
(°) (m) (m) (%) % % % (Φ)<br />
FRI1 350 200 106 0.63 Fine sand 1.3 96.5 2.2 2.49<br />
FRI2 758 196 105 0.47 Fine sand 1.0 99.0 0.0 2.54<br />
FRI3 188 300 102 0.55 Fine sand 0.9 98.7 0.4 2.43<br />
FRIX2 ** 249 1000 111 0.76 Fine sand 2.0 98.0 0.0 2.35<br />
FRI4 249 200 105 0.67 Fine sand 0.9 98.3 0.9 2.49<br />
FRIX1 ** 249 100 105 0.65 Fine sand 2.2 97.8 0.0 2.44<br />
FRI11 350 500 107 0.69 Fine sand 0.5 99.5 0.0 2.42<br />
FRI24 170 250 103 0.45 Fine sand 1.4 98.4 0.1 2.43<br />
FRI25 355 242 105 0.54 Fine sand 1.7 93.4 4.9 2.36<br />
FRI27 70 250 106 0.52 Fine sand 1.4 98.6 0.0 2.49<br />
FRI10R 135.4 14686 118 0.93 Fine sand 6.0 94.0 0.0 2.84<br />
Min.* 0.45 0.5 93.4 0.0 2.35<br />
Max.* 0.76 2.2 99.5 4.9 2.54<br />
*: The reference station is not included<br />
** : Additional stations in 2006 and 2010 because accidental spill of Hg in 2004.
DET NORSKE VERITAS<br />
Report for Total E&P Norge AS<br />
Environmental Sediment Survey Frigg 2010<br />
TOM (%)<br />
1,4<br />
1,2<br />
1,0<br />
0,8<br />
0,6<br />
0,4<br />
0,2<br />
0,0<br />
FRI1<br />
1992 1997 2000 2003 2010<br />
FRI2<br />
FRI3<br />
FRIX2<br />
FRI4<br />
FRIX1<br />
DNV Reg. No.: 12O31ER-5<br />
Revision No.: 01<br />
Date : 2010-11-30 Page 16 of 27<br />
FRI11<br />
FRI24<br />
FRI25<br />
FRI27<br />
FRI10R<br />
silt & clay (%)<br />
7<br />
6<br />
5<br />
4<br />
3<br />
2<br />
1<br />
0<br />
FRI1<br />
FRI2<br />
MANAGING RISK<br />
1992 1997 2000 2003 2010<br />
Figure 3-1 Frigg 2010, sediment characterization (TOM and silt & clay) compared with previous<br />
surveys.<br />
3.2 Chemical analysis<br />
3.2.1 Hydrocarbons<br />
Summarized results of hydrocarbon analyses are given in Table 3-2. Comparison of the THC<br />
content in 2010 with previous surveys is presented in Figure 3-2. The distribution of THC in<br />
all layers (0-1, 1-3 and 3-6 cm) and the distribution related to the field centre are also shown<br />
in Figure 3-2.<br />
FRI3<br />
FRIX2<br />
FRI4<br />
FRIX1<br />
FRI11<br />
FRI24<br />
FRI25<br />
FRI27<br />
FRI10R
DET NORSKE VERITAS<br />
Report for Total E&P Norge AS<br />
Environmental Sediment Survey Frigg 2010<br />
DNV Reg. No.: 12O31ER-5<br />
Revision No.: 01<br />
Date : 2010-11-30 Page 17 of 27<br />
MANAGING RISK<br />
Table 3-2 Frigg 2010, the content of hydrocarbons in sediments. All values in mg/kg dry sediment.<br />
The results from vertical sections of sediments are dark shaded. For comparison LSC-value from the<br />
north sub-region in Region II is included (north 97-06), Botnen 2006. Values above LSC are marked<br />
with bold text.<br />
Station Direction Distance THC PAH NPD<br />
(°) (m) average SD average SD average SD<br />
FRI1 350 200 8 2<br />
FRI2 758 196 4 4<br />
FRI3 188 300 10 3 0.142 0.067 0.08 0.02<br />
FRI3, 0-1 cm 188 300 8 0.074 0.06<br />
FRI3, 1-3 cm 188 300 15 4.24 1.80<br />
FRI3, 3-6 cm 188 300 11 0.182 0.09<br />
FRIX2 249 1000 6 2<br />
FRI4 249 200 6 0<br />
FRIX1 249 100 11 2<br />
FRI11 350 500 9 3<br />
FRI24 170 250 4 1<br />
FRI25 355 242 11 5<br />
FRI27 70 250 4 3<br />
FRI10R 135.4 14686 4 0 0.045 0.003 0.01 0.00<br />
FRI10R, 0-1 cm 135.4 14686 4 0.046 0.01<br />
FRI10R, 1-3 cm 135.4 14686 4 0.048 0.01<br />
FRI10R, 3-6 cm 135.4 14686 4 0.064 0.02<br />
Min.* 4 0.142 0.08<br />
Max.* 11 0.142 0.08<br />
LSC (north 97-06) 11<br />
*: The reference station is not included<br />
THC (mg/kg)<br />
18<br />
16<br />
14<br />
12<br />
10<br />
8<br />
6<br />
4<br />
2<br />
0<br />
FRI1<br />
1992 1997 2000 2003 2006 2010 LSC (north 97-06)<br />
FRI2<br />
FRI3<br />
FRIX2<br />
FRI4<br />
Figure 3-2 Frigg 2010, average content of THC compared with previous surveys (upper), THCcontent<br />
in the layers (FRI3 and FRI10R, lower left). The figure at lower right shows the distribution of<br />
THC in sediments at the sampling sites, the size of the circle indicate the amount of THC. The field<br />
centre is marked with an X. Cont.<br />
FRIX1<br />
FRI11<br />
FRI24<br />
FRI25<br />
FRI27<br />
FRI10R
DET NORSKE VERITAS<br />
Report for Total E&P Norge AS<br />
Environmental Sediment Survey Frigg 2010<br />
FRI3<br />
FRI10R<br />
0 5 10 15 20<br />
Figure 3-2 cont.<br />
0-1 cm 1-3 cm 3-6 cm<br />
THC (mg/kg)<br />
DNV Reg. No.: 12O31ER-5<br />
Revision No.: 01<br />
Date : 2010-11-30 Page 18 of 27<br />
MANAGING RISK<br />
The content of THC is low (4-11 mg/kg). None of the measured THC-concentrations are<br />
above LSC-level. The THC-concentration in 2010 is similar or lower than previous surveys.<br />
At station FRI3, in layer 1-3 cm, the content of THC is 15 mg/kg, and PAH and NPD<br />
concentrations are 4.24 and 1.80, respectively.<br />
3.2.2 Metals<br />
Summarized results of metals analyses are given in Table 3-3. Comparison of the metals<br />
content in 2010 with previous surveys is presented in Figure 3-3. Metal analyses (except Hg)<br />
were not included in the 2006 survey. The distribution of Ba in all layers (0-1, 1-3 and 3-6<br />
cm) and the distribution related to the field centre are also shown in Figure 3-4.<br />
The content of Ba varies from 28 to 189 mg/kg. The Ba-concentrations are above LSC for<br />
FRI1, FRI24 and FRI25. Overall the concentrations of metals are quite similar with previous<br />
surveys, and several values are > LSC (north 97-06). The new station FRIX1, located 100m<br />
SW of the center, has the highest levels of all the metals except barium. In 2006 this was the<br />
only station with Hg concentration above LSC. Also in 2010 FRIX1 contains more Hg than<br />
the other stations (there is no LSC for 2010), and thus the overall picture is similar to 2006.
DET NORSKE VERITAS<br />
Report for Total E&P Norge AS<br />
Environmental Sediment Survey Frigg 2010<br />
DNV Reg. No.: 12O31ER-5<br />
Revision No.: 01<br />
Date : 2010-11-30 Page 19 of 27<br />
MANAGING RISK<br />
Table 3-3 Frigg 2010, metals in sediments. All values in mg/kg dry sediment. The results from vertical<br />
sections of sediments are dark shaded. For comparison LSC-value from the north sub-region in<br />
Region II is included (north 97-06). Values above LSC are marked with bold text.<br />
Station Ba Cd Cr Cu Hg Pb Zn<br />
(°/m) avg SD avg SD avg SD avg SD avg SD avg SD avg SD<br />
FRI1 350/200 81 22 0.04 0.01 10.9 1.7 17.8 1.5 0.01 0.002 45.0 5.7 192 23<br />
FRI2 758/196 31 2
DET NORSKE VERITAS<br />
Report for Total E&P Norge AS<br />
Environmental Sediment Survey Frigg 2010<br />
Cd (mg/kg)<br />
Cu (mg/kg)<br />
Zn (mg/kg)<br />
0,07<br />
0,06<br />
0,05<br />
0,04<br />
0,03<br />
0,02<br />
0,01<br />
0,00<br />
30<br />
25<br />
20<br />
15<br />
10<br />
5<br />
0<br />
350<br />
300<br />
250<br />
200<br />
150<br />
100<br />
50<br />
0<br />
FRI1<br />
FRI1<br />
FRI1<br />
1992 1997 2000 2003 2010 LSC (north 97-06)<br />
FRI2<br />
FRI3<br />
FRIX<br />
2<br />
FRI4<br />
FRIX<br />
1<br />
DNV Reg. No.: 12O31ER-5<br />
Revision No.: 01<br />
Date : 2010-11-30 Page 20 of 27<br />
FRI11<br />
FRI24<br />
FRI25<br />
FRI27<br />
FRI10<br />
R<br />
1992 1997 2000 2003 2010 LSC (north 97-06)<br />
FRI2<br />
FRI2<br />
FRI3<br />
FRI3<br />
Figure 3-3 Cont.<br />
FRIX<br />
2<br />
FRI4<br />
FRIX<br />
1<br />
FRI11<br />
FRI24<br />
FRI25<br />
FRI27<br />
FRI10<br />
R<br />
1992 1997 2000 2003 2010 LSC (north 97-06)<br />
FRIX<br />
2<br />
FRI4<br />
FRIX<br />
1<br />
FRI11<br />
FRI24<br />
FRI25<br />
FRI27<br />
FRI10<br />
R<br />
Cr (mg/kg)<br />
Pb (mg/kg)<br />
14<br />
12<br />
10<br />
8<br />
6<br />
4<br />
2<br />
0<br />
60<br />
50<br />
40<br />
30<br />
20<br />
10<br />
0<br />
FRI1<br />
FRI1<br />
FRI2<br />
FRI3<br />
MANAGING RISK<br />
2000 2003 2010 LSC (north 97-06)<br />
FRI2<br />
FRI3<br />
FRIX<br />
2<br />
FRIX<br />
2<br />
FRI4<br />
FRI4<br />
FRIX<br />
1<br />
FRIX<br />
1<br />
FRI11<br />
FRI11<br />
FRI24<br />
FRI24<br />
FRI25<br />
FRI25<br />
FRI27<br />
FRI27<br />
FRI10<br />
R<br />
1992 1997 2000 2003 2010 LSC (north 97-06)<br />
FRI10<br />
R
DET NORSKE VERITAS<br />
Report for Total E&P Norge AS<br />
Environmental Sediment Survey Frigg 2010<br />
FRI10R<br />
0-1 cm 1-3 cm 3-6 cm<br />
0 10 20 30 40 50 60 70<br />
Ba (mg/kg)<br />
DNV Reg. No.: 12O31ER-5<br />
Revision No.: 01<br />
Date : 2010-11-30 Page 21 of 27<br />
MANAGING RISK<br />
Figure 3-4 Frigg 2010, Ba-content in the layers (FRI10R, left). The figure at right shows the<br />
distribution of Ba in sediments at the sampling sites, the size of the circle indicate the amount of Ba.<br />
The field centre is marked with an X. Sites with Ba > LSC are marked with filled circles.<br />
The Frigg survey 2010 has not been a part of a regional survey, hence there is no LSC2010<br />
value, and the size of contaminated area has not been estimated. There are, however, no major<br />
changes compared to the previous survey in 2006, and the size of the contaminated area<br />
should be considered to be in the same order of magnitude as in 2006.<br />
3.3 Biological analysis<br />
Abundance<br />
A total of 201 taxa and 11454 individuals were sampled at 11 stations. Greatest abundance<br />
(59.5 %) was found among the polychaetes, of which the species Myriochele oculata<br />
constitutes 40.4 % and Owenia fusiformis constitutes 18.6 %, see Table 3-4.<br />
The abundance of juvenile echinoids (and partly ophiuroids) was also high (992 individuals).<br />
The echinoids were present in the top-10 list from each station, and juveniles are thus<br />
removed from the data set prior to calculation of indices and statistics.
DET NORSKE VERITAS<br />
Report for Total E&P Norge AS<br />
Environmental Sediment Survey Frigg 2010<br />
DNV Reg. No.: 12O31ER-5<br />
Revision No.: 01<br />
Date : 2010-11-30 Page 22 of 27<br />
MANAGING RISK<br />
Table 3-4 Number of species and individuals distributed between the main groups, Frigg 2010.<br />
Main animal groups<br />
Individuals Species<br />
Number % Number %<br />
All Ex.juv. All Ex.juv. All Ex.juv. All Ex.juv.<br />
Varia 733 733 6.4 7.2 17 17 8.5 8,7<br />
Polychaeta 6822 6714 59.5 65.9 74 71 36.8 36,4<br />
Myriochele oculata 2756 40.4<br />
Owenia fusiformis 1269 18,6<br />
Crustacea 1070 1070 9.3 10,5 49 49 24.4 25,1<br />
Mollusca 762 762 6.6 7.5 45 45 22.4 23.1<br />
Echinodermata 2067 907 18.0 8.9 16 13 8.0 6.7<br />
Total 11454 10186 100.0 100.0 201 195 100.0 100.0<br />
Diversity and dominant species<br />
The dominant species varied from 14.4 % at FRI1 (350°/200m) to 45.2 % at FRI11<br />
(350°/500m). The 10 most abundant species made up from 57.2 % at FRI4 (249°/200m) to<br />
82.8 % at FRI2 (758/196m), see Table 3-5. The bristle worm Myriochele oculata occurs in<br />
very high numbers. Other dominant species are the bristle worms Owenia fusiformis and<br />
Spiophanes bombyx.<br />
Table 3-5 10 most dominant species, Frigg 2010.<br />
10 most common species<br />
FRI 1 (350/200m) Number % Cum % FRI 2 (758/196m) Number % Cum %<br />
Spiophanes bombyx 123 14,44 14,44 Myriochele oculata 507 44,16 44,16<br />
Myriochele oculata 122 14,32 28,76 Owenia fusiformis 190 16,55 60,71<br />
Owenia fusiformis 92 10,80 39,55 Amphiura filiformis 47 4,09 64,81<br />
Cerianthus lloydi 45 5,28 44,84 Unciola planipes 31 2,70 67,51<br />
Amphipholis squamata 45 5,28 50,12 Parvicardium minimum 29 2,53 70,03<br />
Parvicardium minimum 45 5,28 55,40 Goniada maculata 25 2,18 72,21<br />
Siphonoecetes kroeyeranus 38 4,46 59,86 Cerianthus lloydi 23 2,00 74,22<br />
Prionospio cirrifera 23 2,70 62,56 Scoloplos (Scoloplos) armiger 23 2,00 76,22<br />
Nemertina indet. 18 2,11 64,67 Spiophanes bombyx 22 1,92 78,14<br />
Edwardsia sp. 16 1,88 66,55 Edwardsia sp. 20 1,74 79,88<br />
Spiophanes wigleyi 16 1,88 68,43 Paramphinome jeffreysii 17 1,48 81,36<br />
Ophiocten affinis 16 1,88 70,31 Aonides paucibranchiata 17 1,48 82,84<br />
FRI 3 (188/300m) Number % Cum % FRI 4 (249/200m) Number % Cum %<br />
Spiophanes bombyx 115 22,50 22,50 Myriochele oculata 120 14,55 14,55<br />
Cerianthus lloydi 29 5,68 28,18 Spiophanes bombyx 74 8,97 23,52<br />
Siphonoecetes kroeyeranus 25 4,89 33,07 Cerianthus lloydi 47 5,70 29,21<br />
Parvicardium minimum 24 4,70 37,77 Edwardsia sp. 35 4,24 33,45<br />
Owenia fusiformis 23 4,50 42,27 Parvicardium minimum 34 4,12 37,58<br />
Chaetozone setosa complex 20 3,91 46,18 Amphiura filiformis 33 4,00 41,58<br />
Goniada maculata 16 3,13 49,32 Siphonoecetes kroeyeranus 32 3,88 45,45<br />
Amphiura filiformis 14 2,74 52,05 Spiophanes wigleyi 27 3,27 48,73<br />
Spiophanes wigleyi 13 2,54 54,60 Chaetozone setosa complex 26 3,15 51,88<br />
Hippomedon denticulatus 13 2,54 57,14 Ophiocten affinis 22 2,67 54,55<br />
Myriochele oculata 12 2,35 59,49 Prionospio cirrifera 22 2,67 57,21
DET NORSKE VERITAS<br />
Report for Total E&P Norge AS<br />
Environmental Sediment Survey Frigg 2010<br />
Table 3-5 cont.<br />
DNV Reg. No.: 12O31ER-5<br />
Revision No.: 01<br />
Date : 2010-11-30 Page 23 of 27<br />
MANAGING RISK<br />
FRI 10R (135/14686) Number % Cum % FRI 11 (350/500m) Number % Cum %<br />
Owenia fusiformis 389 34,12 34,12 Myriochele oculata 533 45,21 45,21<br />
Myriochele oculata 218 19,12 53,25 Owenia fusiformis 151 12,81 58,02<br />
Amphiura filiformis 54 4,74 57,98 Amphiura filiformis 55 4,66 62,68<br />
Phoronis muelleri 36 3,16 61,14 Parvicardium minimum 40 3,39 66,07<br />
Thyasira flexuosa 29 2,54 63,68 Spiophanes bombyx 32 2,71 68,79<br />
Caudofoveata spp. 22 1,93 65,61 Scoloplos (Scoloplos) armiger 26 2,21 70,99<br />
Urothoe elegans 21 1,84 67,46 Paramphinome jeffreysii 24 2,04 73,03<br />
Goniada maculata 19 1,67 69,12 Unciola planipes 20 1,70 74,72<br />
Harpinia antennaria 18 1,58 70,70 Aonides paucibranchiata 20 1,70 76,42<br />
Ophiocten affinis 17 1,49 72,19 Edwardsia sp. 15 1,27 77,69<br />
Aonides paucibranchiata 16 1,40 73,60 Nemertina indet. 14 1,19 78,88<br />
Fri 24 (170/250m) Number % Cum % Fri 25 (355/242m) Number % Cum %<br />
Myriochele oculata 380 35,12 35,12 Myriochele oculata 151 16,50 16,50<br />
Owenia fusiformis 101 9,33 44,45 Owenia fusiformis 83 9,07 25,57<br />
Unciola planipes 70 6,47 50,92 Unciola planipes 66 7,21 32,79<br />
Amphiura filiformis 53 4,90 55,82 Spiophanes bombyx 64 6,99 39,78<br />
Aonides paucibranchiata 46 4,25 60,07 Amphiura filiformis 63 6,89 46,67<br />
Ophiocten affinis 41 3,79 63,86 Aonides paucibranchiata 52 5,68 52,35<br />
Scoloplos (Scoloplos) armiger 25 2,31 66,17 Ophiocten affinis 30 3,28 55,63<br />
Spiophanes bombyx 25 2,31 68,48 Paramphinome jeffreysii 27 2,95 58,58<br />
Cerianthus lloydi 22 2,03 70,52 Scoloplos (Scoloplos) armiger 27 2,95 61,53<br />
Parvicardium minimum 20 1,85 72,37 Aricidea catherinae 27 2,95 64,48<br />
Aricidea catherinae 20 1,85 74,21 Nemertina indet. 19 2,08 66,56<br />
Fri 27 (70/250m) Number % Cum % Fri X1 (249/100m) Number % Cum %<br />
Myriochele oculata 392 39,40 39,40 Spiophanes bombyx 108 14,71 14,71<br />
Owenia fusiformis 82 8,24 47,64 Cerianthus lloydi 53 7,22 21,93<br />
Amphiura filiformis 70 7,04 54,67 Amphiura filiformis 48 6,54 28,47<br />
Aonides paucibranchiata 45 4,52 59,20 Parvicardium minimum 48 6,54 35,01<br />
Antalis entalis 43 4,32 63,52 Spiophanes wigleyi 45 6,13 41,14<br />
Ophiocten affinis 29 2,91 66,43 Edwardsia sp. 34 4,63 45,78<br />
Unciola planipes 25 2,51 68,94 Cirriformia tentaculata 34 4,63 50,41<br />
Aricidea catherinae 24 2,41 71,36 Hippomedon denticulatus 30 4,09 54,50<br />
Echinocyamus pusillus 19 1,91 73,27 Chaetozone setosa complex 28 3,81 58,31<br />
Parvicardium minimum 15 1,51 74,77 Owenia fusiformis 26 3,54 61,85<br />
Scoloplos (Scoloplos) armiger 15 1,51 76,28 Ophiocten affinis 25 3,41 65,26<br />
Fri X2 (249/1000m) Number % Cum %<br />
Myriochele oculata 310 38,70 38,70<br />
Owenia fusiformis 111 13,86 52,56<br />
Amphiura filiformis 49 6,12 58,68<br />
Aricidea catherinae 30 3,75 62,42<br />
Paramphinome jeffreysii 24 3,00 65,42<br />
Ophiocten affinis 19 2,37 67,79<br />
Scaphopoda spp. 16 2,00 69,79<br />
Parvicardium minimum 15 1,87 71,66<br />
Aonides paucibranchiata 14 1,75 73,41<br />
Goniada maculate 13 1,62 75,03
DET NORSKE VERITAS<br />
Report for Total E&P Norge AS<br />
Environmental Sediment Survey Frigg 2010<br />
DNV Reg. No.: 12O31ER-5<br />
Revision No.: 01<br />
Date : 2010-11-30 Page 24 of 27<br />
MANAGING RISK<br />
The Shannon Wiener diversity index (Table 3-6) varied from 3.5 at the FRI2 (758°/196m) to<br />
5.3 at FRI11 (350/500m) and the Hurlberts index (ES100) varied from 25 to 39, exclusive<br />
juveniles.<br />
Indices above 4 indicate a relatively undisturbed fauna. Indices between 3 and 4 indicate a<br />
slight disturbance, while indices between 2 and 3 indicate a disturbance in the fauna. In<br />
general ES100 indices above 20 characterize a relatively normal fauna community. The fauna<br />
at FRI2 seems to differ somewhat from the other stations with slightly lower indices.<br />
Table 3-6 Numbers of individuals (N) and species (S), depth, Shannon-Wiener diversity index (H’),<br />
Pielou’s evenness index (J), and expected number of species per 100 individuals (ES100) for each<br />
station at Frigg 2010 (ex. juv.).<br />
Station º / m Depth (m) S N H' J ES100<br />
FRI 1 350/200 106 79 852 4.8 0.75 33<br />
FRI 2 758/196 105 77 1148 3.5 0.56 25<br />
FRI 3 188/300 102 78 511 5.0 0.80 39<br />
FRI 4 249/200 111 100 825 5.3 0.79 39<br />
FRI 10R 135/ 14686 105 95 1140 4.1 0.63 31<br />
FRI 11 350/500 105 80 1179 3.7 0.58 27<br />
FRI 24 170/250 107 80 1082 4.2 0.66 30<br />
FRI 25 355/242 103 87 915 4.9 0.76 34<br />
FRI 27 70/250 105 86 995 4.0 0.63 29<br />
FRI X1 249/100 106 71 734 4.9 0.79 32<br />
FRI X2 249/1000 118 88 801 4.0 0.62 30<br />
Classification and ordination<br />
The dendrogram from the cluster analysis and the<br />
MDS plot from the ordination analysis based on<br />
station level are presented in Figure 3-5. The<br />
reference station (254°/15000m) separates from<br />
the Frigg stations which forms two separate<br />
groups. The cluster analysis is well supported by<br />
the ordination analysis.<br />
The similarity analysis reveals that the<br />
differences are caused mainly by significantly<br />
higher number of M. oculata and Owenia<br />
fusiformis in group 2 whilst group 1 has higher<br />
abundance of Spiophanes bombyx.<br />
The stations are similar, but not exactly the same<br />
as in the previous faunal survey in 2003. The<br />
results from 2003 indicated that FRI1 and FRI3<br />
were disturbed. The group pattern in 2010 is not<br />
very different from the 2003 groups. The 2010<br />
The polychaete Myriochele oculata (= Galathowenia<br />
oculata) have been the most abundant benthic organism in<br />
the Ekofisk region (Region I) through recent regional<br />
surveys (DNV 2003, DNV 2006, Akvaplan-niva 2009). It<br />
is a small, thin worm, usually less than 1 mm wide but up<br />
to several inches long. It lives in a firm but flexible tube<br />
made of fine-grained sand cemented with mucus, and this<br />
tube can be several times as long as the worm inside the<br />
tube. The tubes are vertically buried in the sediment, with<br />
at least 1 cm of the top end above the sediment. At high<br />
densities M. oculata may give the sediment a "hairy"<br />
appearance. The worm is most abundant in sediments<br />
consisting of fine sand. The vertical distribution varies<br />
from very shallow water down to several hundred meters.<br />
M. oculata feeds on the sediment (probably by bending<br />
the tube so that the mouth can reach deposited particles),<br />
but can also switch to a passive suspension feeding by<br />
placing the head in the flow (Fauchald & Jumars 1979).<br />
This flexibility in food selection strategy means that it can<br />
effectively utilize particulate organic carbon in the<br />
sediment-water interface (Taghon & Greene 1992;<br />
Thomsen et al. 1995). It is probably this flexibility in food<br />
selection strategy that allows it to flourish in huge<br />
amounts when the environmental and biological<br />
conditions are favourable.
DET NORSKE VERITAS<br />
Report for Total E&P Norge AS<br />
Environmental Sediment Survey Frigg 2010<br />
DNV Reg. No.: 12O31ER-5<br />
Revision No.: 01<br />
Date : 2010-11-30 Page 25 of 27<br />
MANAGING RISK<br />
data are, however, disturbed by the high abundances of the bristle worm Myriochele oculata<br />
(see text box). Thus the same analysis, but omitting M. oculata from the data, was performed.<br />
The results are shown in Figure 3-6, and do not change the picture. The differences between<br />
group 1 and 2 are caused mainly by higher numbers of S. bombyx in group 1 and more O.<br />
fusiformis in group 2. This result is very similar to the picture in 2003.<br />
Similarity<br />
50<br />
60<br />
70<br />
80<br />
90<br />
100<br />
Fri X1<br />
Fri 03<br />
G roup 1<br />
Fri 10R<br />
Fri 01<br />
Fri 01<br />
Fri 03<br />
Fri 04<br />
Fri 04<br />
Fri X1<br />
Fri x2<br />
Fri 25<br />
Fri 11<br />
Fri 02 Fri 24<br />
Fri 02<br />
Transf orm: Square root<br />
Resemblance: S17 Bray Curtis similarity<br />
Fri 27<br />
Fri 11<br />
Group 1 Group 2<br />
Fri 10R<br />
Fri x2<br />
G roup 2<br />
Fri 27<br />
2D Stress: 0,04<br />
Trans f orm : Square root<br />
Res em blanc e: S17 Bray Curtis s imilarity<br />
Fri 24<br />
Fri 25<br />
Station<br />
Figure 3-5 Dendrogram and MDS plot of Frigg stations 2010 (ex. juv.).<br />
Direction/<br />
distance<br />
Depth (m)<br />
FRI1 350/200 106<br />
FRI2 758/196 105<br />
FRI3 188/300 102<br />
FRIX2 249/1000 111<br />
FRI4 249/200 105<br />
FRIX1 249/100 105<br />
FRI11 350/500 107<br />
FRI24 170/250 103<br />
FRI25 355/242 105<br />
FRI27 70/250 106<br />
FRI10R 135.4/ 14686 118
DET NORSKE VERITAS<br />
Report for Total E&P Norge AS<br />
Similarity<br />
Environmental Sediment Survey Frigg 2010<br />
40<br />
60<br />
80<br />
100<br />
Fri 10R<br />
Fri 01<br />
Fri 03<br />
Fri 04<br />
Fri X1<br />
Fri x2<br />
DNV Reg. No.: 12O31ER-5<br />
Revision No.: 01<br />
Date : 2010-11-30 Page 26 of 27<br />
Fri 27<br />
Transform: Square root<br />
Resemblance: S17 Bray Curtis similarity<br />
Fri 24<br />
Fri 25<br />
Fri 02<br />
Fri 11<br />
MANAGING RISK<br />
Figure 3-6 Dendrogram and MDS plot of Frigg stations 2010 (ex. juv. and ex. M. oculata).<br />
The sediment characteristics are uniform across all stations except the reference station data,<br />
but data from the chemical analyses suggests that the metal concentrations except barium are<br />
higher at stations FRI1, -3, -4 and –X1 (group 1). Using the BioEnv analysis shows that Cu is<br />
the single environmental parameter that correlates the most with the fauna distribution<br />
(coefficient=0.71), number two is Pb (0.61). If FRI10R is omitted from the analysis, the<br />
correlation coefficient for Cu increases to 0.79. The over all best combination (coefficient<br />
0.91) to explain the faunal variations at Frigg is the environmental parameters depth and Cu.<br />
In 2003 the combination of Cr, TOM and silt/clay gave the best correlation. Thus it seems like<br />
the levels of metals, especially Cu, Pb and Cr, may contribute to the faunal variations at Frigg.<br />
The concentrations are highest at FRIX1, FRI1, FR3 and FRI4.<br />
3.4 Conclusions<br />
All stations consists mainly of sand (94-99 %) and the content of total organic matter is low<br />
(0.45-0.76 %). The concentrations of THC are low (4-11 mg/kg), and none of the measured<br />
THC-concentrations are above LSC-level. The concentrations of Ba are in the range from 28<br />
to 189 mg/kg. Three stations have Ba-concentrations above LSC-level. Several of the stations<br />
have metal concentration >LSC (north97-06), and these elevated levels are most pronounced<br />
at stations FRX1, -1, -3 and -4 where the fauna is slightly different from the other field<br />
stations. Compared with previous surveys it is some minor differences, but it is not found any<br />
trend, and overall there were no major differences compared to previous surveys.
DET NORSKE VERITAS<br />
Report for Total E&P Norge AS<br />
Environmental Sediment Survey Frigg 2010<br />
4 REFERENCES<br />
DNV Reg. No.: 12O31ER-5<br />
Revision No.: 01<br />
Date : 2010-11-30 Page 27 of 27<br />
MANAGING RISK<br />
Akvaplan-niva 2009. Offshore sediment survey of Region I 2008. Akvplan.niva AS Rapport:<br />
4315-02.<br />
Bray, J.R., & Curtis, J.T. (1957), An ordination of the upland forest communities of southern<br />
Wisconsin. Ecol. Monogr. 27: 325-349.<br />
Buchanan, J.B. (1984), Sediment analysis. In "Methods for the study of marine benthos".<br />
Editors: Holme, N.A., and A.D. McIntyre. Blackwell Scientific Publications, Oxford, UK, pp.<br />
41-65.<br />
DNV 2003. Environmental Monitoring Region I – Ekofisk 2002. DNV report-2006-0187.<br />
DNV 2006. Environmental Monitoring Region I – Ekofisk 2005. DNV report-2003-0338.<br />
DNV 2010. Miljøovervåking Region III 2010 og grunnlagsundersøkelser i omkringliggende<br />
regioner. DNV-rapport 2010-0908.<br />
Fauchald, K., Jumars, P. A. 1979. The diet of worms: a study of polychaete feeding guilds.<br />
Oceanogr. Mar. Biol. Annu. Rev. 17:193-284.Holland, G.J., Greenstreet, S.P.R., Gibb, I.M.<br />
2005.<br />
Lance, G. N., & Williams, W.T. (1967). A general theory of classificatory sorting strategies.<br />
II. Clustering systems. -Computer Jour. 10: 271-277.<br />
Pielou, E.C. (1969). An introduction to mathematical ecology. Wiley-Interscience, New York.<br />
Shannon, C.E., & Weaver, W.W. (1963). The mathematical theory of communities.<br />
University of Illinois Press. Urbana, Illinois. 117 s.<br />
Taghon, G. & Greene, R. R. 1992. Utilization of deposited and suspended particulate matter<br />
by benthic interface feeders. Limnology and Oceanography. 37: 1370-1391.<br />
Thomsen, L., Graf, G., Juterzenka, K., Witte, U., 1995. An in situ experiment to investigate<br />
the depletion of seston above an interface feeder field on the continental margin of the<br />
western Barents Sea. Mar. Ecol. Prog. Ser., 123: 295-300.<br />
Unifob 2004. Environmental Monitoring Survey of Region II, 2003. TL 2003/011.<br />
Unifob 2007. Miljøovervåking av olje- og gassfelt i Region II i 2006.
DET NORSKE VERITAS<br />
Report for Total E&P Norge AS<br />
Environmental Sediment Survey Frigg 2010<br />
DNV Reg. No.: 12O31ER-5<br />
Revision No.: 01<br />
Date : 2010-11-30<br />
APPENDIX<br />
1<br />
EXTRACT FROM SURVEY REPORT<br />
MANAGING RISK
DET NORSKE VERITAS<br />
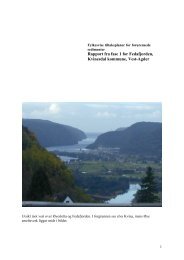
Toktrapport<br />
Miljøovervåking Region III 2010 og<br />
grunnlagsundersøkelser i omkringliggende<br />
regioner<br />
Rapportnr./DNV Referansenr.: DNV 2010-0908 / 12O31ER-3<br />
Rev. 00, 2010-05-14
DET NORSKE VERITAS<br />
Rapport for Statoil Petroleum AS<br />
Miljøovervåking Region III 2010 og grunnlagsundersøkelser i<br />
omkringliggende regioner<br />
Miljøovervåking Region III 2010 og<br />
grunnlagsundersøkelser i omkringliggende regioner<br />
Oppdragsgiver:<br />
Statoil Petroleum AS<br />
Postboks 7200<br />
5020 BERGEN<br />
Norway<br />
Oppdragsgivers referanse:<br />
Endre Aas<br />
Dato for første<br />
utgivelse:<br />
2010-05-14 Prosjektnr.: EP022920<br />
DNV Referansenr.: 12O31ER-3<br />
Revisjon nr.: 00<br />
Dato: 2010-06-28 Side i av iii<br />
MANAGING RISK<br />
DET NORSKE VERITAS AS<br />
P.O.Box 300<br />
1322 Høvik, Norway<br />
Tlf: +47 67 57 99 00<br />
Faks: +47 67 57 99 11<br />
http://www.dnv.com<br />
Org. nr.:<br />
Rapportnr.: DNV-rapp. 2010-0908 Organisasjonsenhet: Environmental Risk Management<br />
Revisjon nr.: 00 Emnegruppe: Marin Overvåking<br />
Sammendrag:<br />
Rapporten presenterer gjennomføringen av feltarbeid i Region III 2010, grunnlagsundersøkelser på Yme Beta<br />
og Gamma, Bream, Pi Nord og Sør, Pan Pandora og Jordbær Sentral og Vest samt etterkantundersøkelse på<br />
Frigg.<br />
Utarbeidet av:<br />
Verifisert av:<br />
Godkjent av:<br />
Navn og tittel<br />
Sam Arne Nøland<br />
Principal Consultant<br />
Navn og tittel<br />
Amund Ulfsnes<br />
Senior Consultant<br />
Navn og tittel<br />
Tor Jensen<br />
Customer Service Manager<br />
Signatur<br />
Signatur<br />
Signatur<br />
Ingen distribusjon uten tillatelse fra oppdragsgiver eller ansvarlig<br />
organisasjonsenhet, men fri distribusjon innen DNV etter 3 år<br />
Ingen distribusjon uten tillatelse fra oppdragsgiver eller ansvarlig<br />
organisasjonsenhet<br />
Strengt konfidensiell<br />
Fri distribusjon<br />
Indekseringstermer<br />
Nøkkelord<br />
Serviceområde <br />
Markedssegment<br />
Sedimenter, bunnfauna, prøvetaking,<br />
vann<br />
SHE Management<br />
Oil and Gas<br />
Revisjon nr. / Dato: Årsak for utgivelse: Utarbeidet av: Godkjent av: Verifisert av:
DET NORSKE VERITAS<br />
Rapport for Statoil Petroleum AS<br />
Miljøovervåking Region III 2010 og grunnlagsundersøkelser i<br />
omkringliggende regioner<br />
Innholdsfortegnelse<br />
DNV Referansenr.: 12O31ER-3<br />
Revisjon nr.: 00<br />
Dato: 2010-06-28 Side ii av iii<br />
MANAGING RISK<br />
1 INNLEDNING ................................................................................................................... 1<br />
2 FARTØY OG FELTUTSTYR.......................................................................................... 3<br />
3 TOKTPERSONELL.......................................................................................................... 6<br />
4 GJENNOMFØRING AV TOKTET ................................................................................ 6<br />
5 FELT FOR FELT .............................................................................................................. 7<br />
5.1 Yme Beta og Gamma ................................................................................................. 7<br />
5.2 Bream ......................................................................................................................... 8<br />
5.3 Pi Sør og Nord............................................................................................................ 9<br />
5.4 Frigg ......................................................................................................................... 11<br />
5.5 Oseberg J .................................................................................................................. 11<br />
5.6 Oseberg Sør .............................................................................................................. 12<br />
5.7 Tune Sør ................................................................................................................... 14<br />
5.8 Oseberg Delta........................................................................................................... 15<br />
5.9 Oseberg Feltsenter.................................................................................................... 16<br />
5.10 Brage ........................................................................................................................ 17<br />
5.11 Troll A...................................................................................................................... 18<br />
5.12 Troll B og C.............................................................................................................. 18<br />
5.13 Fram Øst................................................................................................................... 20<br />
5.14 Fram Vest ................................................................................................................. 21<br />
5.15 Pan Pandora.............................................................................................................. 21<br />
5.16 Jordbær Sentral og Vest ........................................................................................... 22<br />
5.17 Huldra....................................................................................................................... 24<br />
5.18 Veslefrikk ................................................................................................................. 24<br />
5.19 Oseberg Øst .............................................................................................................. 26<br />
5.20 Oseberg C................................................................................................................. 27<br />
5.21 Oseberg G................................................................................................................. 28<br />
6 ERFARINGER FRA TOKTET ..................................................................................... 29<br />
Vedlegg 1 Detaljer fra prøvetakingen
DET NORSKE VERITAS<br />
Rapport for Statoil Petroleum AS<br />
Miljøovervåking Region III 2010 og grunnlagsundersøkelser i<br />
omkringliggende regioner<br />
Vedlegg 2 Informasjon om fartøyet<br />
Vedlegg 3 Surveyrapport, Fugro<br />
DNV Referansenr.: 12O31ER-3<br />
Revisjon nr.: 00<br />
Dato: 2010-06-28 Side iii av iii<br />
MANAGING RISK
DET NORSKE VERITAS<br />
Rapport for Statoil Petroleum AS<br />
Miljøovervåking Region III 2010 og grunnlagsundersøkelser i<br />
omkringliggende regioner<br />
1 INNLEDNING<br />
DNV Referansenr.: 12O31ER-3<br />
Revisjon nr.: 00<br />
Dato: 2010-06-28 Side 1 av 29<br />
MANAGING RISK<br />
På vegne av Statoil har DNV og Molab gjennomført innsamling av sedimenter og vannprøver i<br />
Region III i forbindelse med regional miljøundersøkelse. Innsamlingen inkluderte også enkelte<br />
grunnlagsundersøkelse utenfor region III samt etterkantundersøkelse på Frigg. Rapporten<br />
presenterer feltarbeidet basert på et program forelagt SFT/ekspertgruppen før arbeidet startet.<br />
Feltarbeidet er gjennomført iht. Aktivitetsforskriften og DNVs akkrediterte metoder for denne<br />
type arbeid (Test 083). Undersøkelsen omfatter innsamling av sedimenter for kjemiske og<br />
biologiske analyser, samt karakterisering av sedimentene. I tillegg ble det samlet inn vannprøver<br />
for analyser av enkelte radioaktive elementer. På vegne av Uni Research ble det også tatt<br />
sedimentprøver for DNA-analyser.<br />
Innsamlingen foregikk med fartøyet fiskefartøyet Libas”. Toktet som helhet foregikk i perioden<br />
18. mai til 2. juni.<br />
Tabell 1-1 og Figur 1-1b) gir en oversikt over undersøkelsesprogrammet for Region III. Andre<br />
felt inkludert i undersøkelsen er listet opp i Tabell 1-2 og vist i Figur 1-1 a).<br />
Tabell 1-1 Oversikt over felt som inngår i overvåkingen i Region III 2010. Statoil er operatør på alle<br />
feltene i regionen.<br />
Planlagt Faktisk antall<br />
antall<br />
stasjoner<br />
Region/ underregion Felt Type<br />
stasjoner<br />
Region III/Oseberg Oseberg Feltsenter Overvåking 8 8<br />
Oseberg C Overvåking 10 10<br />
Oseberg Øst Overvåking 12 12<br />
Oseberg Sør Overvåking 17 17<br />
Oseberg G Overvåking 8 8<br />
Oseberg J Overvåking 8 8<br />
Oseberg Delta Overvåking 5 5<br />
Brage Overvåking 8 8<br />
Tune Sør* Overvåking 5 5<br />
Veslefrikk Overvåking 13 16<br />
Huldra Overvåking 5 5<br />
Region III/Troll Troll B +C Overvåking 17 17<br />
Fram Vest Overvåking 12 12<br />
Fram Øst* Overvåking 20 19<br />
Troll A Overvåking 8 8<br />
Regionale Overvåking 12 12<br />
Sum<br />
*= første gangs oppfølging<br />
168 170
DET NORSKE VERITAS<br />
Rapport for Statoil Petroleum AS<br />
Miljøovervåking Region III 2010 og grunnlagsundersøkelser i<br />
omkringliggende regioner<br />
DNV Referansenr.: 12O31ER-3<br />
Revisjon nr.: 00<br />
Dato: 2010-06-28 Side 2 av 29<br />
MANAGING RISK<br />
Tabell 1-2 Felt utenfor Region III som er inkludert i undersøkelsen.<br />
Region/ underregion Selskap Felt Type Antall stasjoner<br />
Region I Talisman Yme Beta Grunnlag 14*<br />
Yme Gamma Grunnlag 13<br />
BG Pi Sør Grunnlag 13<br />
Region II BG Bream Grunnlag 14*<br />
BG Pi Nord Grunnlag 14*<br />
Total Frigg Etterkant 11<br />
Region IV Statoil Pan Pandora Grunnlag 14*<br />
BG Jordbær Sentral Grunnlag<br />
13<br />
Jordbær Vest Grunnlag<br />
14*<br />
Totalt antall stasjoner 120<br />
*: Inklusive regional stasjon<br />
6770000<br />
6760000<br />
6750000<br />
6740000<br />
6730000<br />
6720000<br />
6710000<br />
6700000<br />
b)<br />
a)<br />
Figur 1-1 a) Hele undersøkelsesområdet, b), Region III. Regionale stasjoner er merket som røde sirkler.<br />
REG3-7<br />
Huldra<br />
REG3-16<br />
REG3-15<br />
REG3-13<br />
Veslefrikk<br />
REG3-14<br />
Oseberg C<br />
Oseberg G<br />
REG3-17 Tune<br />
Oseberg<br />
sør<br />
Delta<br />
REG3-19<br />
Oseberg Øst<br />
Brage<br />
REG3-18<br />
Oseberg Feltsenter<br />
Oseberg Sør<br />
Oseberg J<br />
REG3-11<br />
Fram Vest<br />
Fram Øst<br />
REG3-12<br />
TROLL B<br />
TROLL C<br />
REG3-8-04<br />
TROLL A<br />
REG3-6<br />
470000 480000 490000 500000 510000 520000 530000 540000
DET NORSKE VERITAS<br />
Rapport for Statoil Petroleum AS<br />
Miljøovervåking Region III 2010 og grunnlagsundersøkelser i<br />
omkringliggende regioner<br />
2 FARTØY OG FELTUTSTYR<br />
DNV Referansenr.: 12O31ER-3<br />
Revisjon nr.: 00<br />
Dato: 2010-06-28 Side 3 av 29<br />
MANAGING RISK<br />
Undersøkelsen ble gjennomført fra fiskefartøyet Libas. Detaljer om fartøyet finnes i Appendiks<br />
B.<br />
I henhold til Aktivitetsforskriften skal prøvetakingen skje innenfor en radius av 50m rundt en<br />
stasjon. I de tilfellene det var nødvendig å gå utenfor denne avstanden ble stasjonen regnet som<br />
en ny stasjon (dette er anmerket i de tilfellene dette var nødvendig).<br />
Region III domineres av to typer bunnsedimenter. Den relativt grunne vestre delen av regionen<br />
(underregion Oseberg) består av fin til grov sand og krever en relativt tung grabb, mens de dypere<br />
deler av regionen (Fram/Trollområdet) består av myk leire, og det er vanskelig å få prøver av<br />
uforstyrret sedimentoverflate fordi grabben synker for dypt ned i sedimentet. Det ble tatt med 6<br />
van Veen grabber med ulik vekt og utforming.<br />
Appendiks A inneholder opplysninger om evt. forflytninger der dette var hensiktsmessig.<br />
Prøvetakingen som ble utført er standard for denne type undersøkelser og følgende utstyr ble<br />
be<strong>nytt</strong>et:<br />
o Langarmet van Veen grabb, offshore type (Delprodukter merket B15)<br />
o Ekstra langarmet van Veen grabb, offshore type (Delprodukter merket B1)<br />
o Langarmet van Veen grabb, lett offshore type (Delprodukter merket B22)<br />
o Kortarmet van Veen grabb (B17)<br />
o 2 x Kombigrabb – modifisert van Veen (0, 15m 2 overflateareal, tar kjemi- og<br />
biologiprøver i samme hugg) (merket B23)<br />
o Mottaksbord i rustfritt stål<br />
o Målesylinder<br />
o Vaskebord<br />
o Sikter (5 mm og 1,0 mm runde hull)<br />
o Vinsj/aggregat pakke (KC)<br />
o Niskin vannhenter (5 liter)<br />
De biologiske prøvene ble tilsatt formalinløsning (bufret med hexamin) med fargestoff<br />
(bengalrosa). Prøvene ble oppbevart på plastspann, og lagret i finérkasser. Sedimentprøver til<br />
kjemiske analyser ble oppbevart i rilsanposer eller i plastbegere. Seks dypfrysere ble be<strong>nytt</strong>et for<br />
lagring av kjemiske prøver. Prøve for DNA-analyse ble tatt fra de øvre 5cm av sedimentet og<br />
konservert med 96% EtOH. Vannprøver for radioaktivitet (10 liter/prøve) ble konservert med<br />
salpetersyre.<br />
Det var også planlagt å prøve ut enkelte substitutter for formalin som fikseringsmiddel. Det lyktes<br />
imidlertid ikke å skaffe de aktuelle substitusjonsstoffene tidsnok til toktet.
DET NORSKE VERITAS<br />
Rapport for Statoil Petroleum AS<br />
Miljøovervåking Region III 2010 og grunnlagsundersøkelser i<br />
omkringliggende regioner<br />
DNV Referansenr.: 12O31ER-3<br />
Revisjon nr.: 00<br />
Dato: 2010-06-28 Side 4 av 29<br />
MANAGING RISK<br />
Det ble også tatt med en kommunikasjonsenhet for trådløs forbindelse mellom grabb og båtdekk.<br />
Hensikten var å prøve ut om signalene fra enheten ble mottatt på fartøyet på de aktuelle<br />
vanndypene. Avhengig av resultatet vil enheten senere kunne be<strong>nytt</strong>es til å gi informasjon til<br />
dekke om grabben har løst ut eller ikke.<br />
I tillegg til innleid navigasjonssystem fra Fugro (se Appendiks C) var det montert opp et separat<br />
navigasjonssystem (GPS fra Garmin og kartplotterprogram fra Nobeltec). Systemet gjør det greit<br />
å sjekke ut hvor fartøyet til enhver tid befinner seg, samt at alle posisjoner blir lagret hvert 10<br />
min. I Figur 2-1 er det vist et eksempel på et skjermbilde som viser seilingsruten og fartøyets<br />
plassering på en stasjon. Den ytterste sirkelen har en radius på 50m som avgrenser området hvor<br />
prøvene skal tas.<br />
Figur 2-1. Eksempel på skjermbilde som viser seilingsrute og fartøyets plassering på en stasjon.<br />
Ytterste sirkel har radius på 50 m som avgrenser området hvor prøvene skal tas.<br />
Alle felt i region III har vært undersøkt tidligere, senest i 2007. I noen få tilfeller var det<br />
nødvendig å justere plasseringen av stasjoner på enkelte felt på grunn av konflikt med<br />
undervannsinstallasjoner, rørledninger eller ankerkjettinger. I Appendiks A – Detaljer fra<br />
prøvetakingen er faktiske posisjoner som ble prøvetatt oppgitt.<br />
• I tilfeller der stasjoner er flyttet utenfor 50m-sonen er stasjonsnavnet endret (fått endelsen -<br />
10) og ny retning/avstand og posisjon er oppgitt.<br />
• Der stasjoner er flyttet, men fremdeles ligger innenfor 50m-sonen, er den nye posisjonen<br />
oppgitt som faktisk mens retning/avstand er som før.<br />
Tabell 2-1 gir en oversikt over antall planlagte stasjoner og analyser for hvert felt. I tillegg ble tatt<br />
ut en sedimentprøve (0-5 cm) fra hver stasjon for DNA-analyser på de felt der Statoil er operatør.
DET NORSKE VERITAS<br />
Rapport for Statoil Petroleum AS<br />
Miljøovervåking Region III 2010 og grunnlagsundersøkelser i<br />
omkringliggende regioner<br />
DNV Referansenr.: 12O31ER-3<br />
Revisjon nr.: 00<br />
Dato: 2010-06-28 Side 5 av 29<br />
MANAGING RISK<br />
Tabell 2-1. Totalt antall planlagte stasjoner og analyser inkludert i prøvetakingsprogrammet i Region III<br />
2010. De regionale stasjonene i region III er oppgitt separat, mens regionale stasjoner som er tatt i<br />
forbindelse med enkelte av grunnlagsundersøkelsene er inkludert i disse.<br />
Felt Stasjoner Bio Korn/<br />
TOM<br />
REGION III<br />
THC Metaller NPD/<br />
PAH<br />
Radioakt.<br />
Radioakt.<br />
i vann<br />
Regionale 12 60 12 36 36 36 6 2<br />
Oseberg feltsenter 8 25 5 24 24 6<br />
Oseberg C 10 50 10 30 30 6<br />
Oseberg Øst 12 30 6 36 36 6<br />
Oseberg Sør 17 40 8 51 39 18<br />
Oseberg G 8 30 6 24 24 9<br />
Oseberg J 8 35 7 24 24 12<br />
Oseberg D 5 20 4 15 15 6<br />
Brage 8 30 6 24 24 15 24 6<br />
Veslefrikk 13 35 7 39 39 15<br />
Huldra 5 20 4 15 15 15<br />
Troll A 8 0 0 24 24 6<br />
Troll B og C 17 15 3 51 51 9 24 24<br />
Fram Vest 12 20 4 36 36 6<br />
Fram Øst 20 80 16 60 60 12<br />
Tune Sør 5 25 5 19 19 19<br />
Sum Region III 168 515 103 516 504 204 54 32<br />
Grunnlagsundersøkelser<br />
Pan Pandora 14 70 14 46 46 46<br />
Yme Gamma 13 65 13 43 43 43<br />
Yme Beta 14 70 14 46 46 46<br />
Pi 27 135 27 89 89 89<br />
Bream 14 70 14 46 46 46<br />
Etterkantundersøkelse<br />
Frigg 11 55 11 37 33 10<br />
Totalt 2010 261 980 196 823 807 484 54 32
DET NORSKE VERITAS<br />
Rapport for Statoil Petroleum AS<br />
Miljøovervåking Region III 2010 og grunnlagsundersøkelser i<br />
omkringliggende regioner<br />
3 TOKTPERSONELL<br />
Toktet ble gjennomført med 6-timers skiftordning med følgende personell:<br />
Sam-Arne Nøland (DNV), toktleder<br />
Thomas Møskeland (DNV), skiftleder<br />
Øyvind Fjukmoen (DNV, skiftleder)<br />
Christian Volan (DNV)<br />
Marte Braathen (DNV)<br />
Gunn Mari Michaelsen (MOLAB)<br />
Odd Strandvoll (MOLAB)<br />
DNV Referansenr.: 12O31ER-3<br />
Revisjon nr.: 00<br />
Dato: 2010-06-28 Side 6 av 29<br />
MANAGING RISK<br />
Rannveig Elise Otterlei (første uken) og Endre Aas (resten av toktet) var Statoils representanter<br />
under toktet.<br />
4 GJENNOMFØRING AV TOKTET<br />
Været var meget bra og stabilt i hele perioden. Tabell 4-1 viser en kronologisk oversikt over<br />
prøvetakingen.<br />
Tabell 4-1 Detaljoversikt, forbruk av tid på de enkelte felt.<br />
Felt Start Slutt Totalt tid<br />
Snitt<br />
prøvetak.<br />
Snitt<br />
gangtid<br />
Tilrigging 18.05, 09:15 Avreise ca. kl.16.30. 7<br />
Yme Beta og Gamma (inkl. Reg1-10) 19.05, 06:15 20,05, 11:10 28:55 0:45 0:19<br />
Bream (inkl. Reg2-11) 20.05, 14:45 21.05, 07:25 16:40 1.03 0:07<br />
Pi Nord og Sør (inkl. Reg2-6) 21.05, 13:30 22.05, 12:40 23:10 0:42 0:09<br />
Frigg 22.05, 21:00 23.05, 05:40 8:40 0:34 0:12<br />
Oseberg J 23.05, 08:40 15:05 6:25 0:40 0:08<br />
Oseberg Sør 23.05, 15:40 24.05, 02:30 10:50 0:27 0:10<br />
Tune Sør 24.05, 05:55 10:20 4:25 0:42 0:10<br />
Oseberg Delta 24.05, 11:05 14:45 3:40 0:35 0:09<br />
Oseberg Feltsenter 24.05, 15:25 21:25 6:00 0:33 0:11<br />
Brage 24.05, 23:55 25.05, 08:10 8:15 0:51 0:11<br />
Troll A 25.05, 21:20 26.05, 04:25 7:05 0:41 0:11<br />
Troll B og C 26.05, 05:05 27.05, 05:30 24:25 0:51 0:34<br />
Fram Øst 27.05, 08:05 28.05, 05:15 21:10 0:50 0:13<br />
Fram Vest 28.05, 05:35 16:25 10:50 0:42 0:13<br />
Pan Pandora (inkl. Reg4-3) 28.05, 20:50 29.05, 10:00 13:10 0:44 0:11<br />
Jordbær (inkl. Reg4-12) 29.05, 12:35 30.05, 20:10 32:35 0:56 0:16<br />
Huldra 31.05, 01:35 05:10 4:35 0:36 0:19<br />
Veslefrikk 31.05, 07:35 20:25 12:50 0:31 0:16<br />
Oseberg Øst 31.05, 22:50 01.06, 04:20 05:30 0:20 0:06<br />
Oseberg C 01.06, 06:10 12:10 06:00 0:24 0:11<br />
Oseberg G 01.06, 13:35 18:35 04:55 0:25 0:11<br />
Bergen 02.06, 01:00<br />
Demobilisering 02.06, 10:30
DET NORSKE VERITAS<br />
Rapport for Statoil Petroleum AS<br />
Miljøovervåking Region III 2010 og grunnlagsundersøkelser i<br />
omkringliggende regioner<br />
Figur 5-6 Typisk sediment fra Pi-området.<br />
5.4 Frigg<br />
DNV Referansenr.: 12O31ER-3<br />
Revisjon nr.: 00<br />
Dato: 2010-06-28 Side 11 av 29<br />
MANAGING RISK<br />
Stasjonsdypet på Frigg varierte fra 102 til 118m. Sedimentet består hovedsakelig av olivenbrun<br />
fin sand. Prøvetaking ble utført i henhold til programmet uten nevneverdige problemer.<br />
Stasjonsplassering og rekkefølge er vist i Figur 5-7. Det ble registrert sorte flekker i to av<br />
grabbprøvene fra FRI03.<br />
Stnr Senter Retning Avstand<br />
FRI01 TCP2 350 200<br />
FRI02 TCP2 58 196<br />
FRI03 TCP2 188 300<br />
FRIX2 TP1 249 1000<br />
FRI04 TP1 249 200<br />
FRIX1 TP1 249 100<br />
FRI11 TCP2 350 500<br />
FRI24 DP2 170 250<br />
FRI25 DP2 355 242<br />
FRI27 DP2 70 250<br />
FRI10R TCP2 135.4 14686<br />
Figur 5-7 Prøvetaking på Frigg, stasjonsplassering (ED50-UTM, sone 31) og rekkefølge. Det ble tatt<br />
biologi- og kjemiprøver fra alle stasjoner.<br />
5.5 Oseberg J<br />
Stasjonsdypet på Oseberg J varierte fra 103 til 106m. Sedimentet består hovedsakelig av<br />
olivenbrun fin sand. Prøvetaking ble utført i henhold til programmet uten nevneverdige
DET NORSKE VERITAS<br />
Rapport for Statoil Petroleum AS<br />
Miljøovervåking Region III 2010 og grunnlagsundersøkelser i<br />
omkringliggende regioner<br />
DNV Referansenr.: 12O31ER-3<br />
Revisjon nr.: 00<br />
Dato: 2010-06-28<br />
VEDLEGG<br />
B<br />
INFORMASJON OM FARTØYET<br />
MANAGING RISK
DET NORSKE VERITAS<br />
Rapport for Statoil Petroleum AS<br />
Miljøovervåking Region III 2010 og grunnlagsundersøkelser i<br />
omkringliggende regioner<br />
DNV Referansenr.: 12O31ER-3<br />
Revisjon nr.: 00<br />
Dato: 2010-06-28<br />
VEDLEGG<br />
C<br />
SURVEYRAPPORT, FUGRO<br />
MANAGING RISK
FUGRO SURVEY AS<br />
Prepared for: Statoil ASA / Multiclient<br />
TNE GET GOP STAV<br />
Forushagen<br />
4035 Stavanger<br />
Norway<br />
Contract Number:<br />
Nygårdsviken 1, 5164 Laksevåg, Norway<br />
Phone: +47 55 34 94 00, Fax: +47 55 34 94 50, http://www.fugro.no<br />
M/V LIBAS<br />
ENVIRONMENTAL SURVEY 2010<br />
REGION III<br />
Survey Period: 18 May to 2 June 2010<br />
Report Number: P9087-50<br />
1 Report Revision Morten Nielsen Thor-Inge Meltveit John A. Vint 21 June 2010<br />
0 Report Revision Morten Nielsen Thor-Inge Meltveit John A. Vint 9 June 2010<br />
Rev Description Prepared Checked Approved Date
STATOIL ASA / MULTICLIENT<br />
M/V LIBAS ENVIRONMENTAL SURVEY 2010 REGION III<br />
TABLE OF CONTENTS<br />
1. SUMMARY 1<br />
2. AREA MAP 2<br />
3. PROJECT SUMMARY 6<br />
4. NAVIGATION AND POSITIONING, SAMPLING SITES 7<br />
A. FIELD LOG<br />
APPENDIX<br />
FSAS Ref. P9087-50, Revision 1, 21 June 2010 Page i<br />
page
STATOIL ASA / MULTICLIENT<br />
M/V LIBAS ENVIRONMENTAL SURVEY 2010 REGION III<br />
1. SUMMARY<br />
The scope of work was to provide accurate and reliable positioning of the “Libas” during environmental<br />
testing, Region III in the Norwegian sector of the North Sea. Sampling was to be carried out at several<br />
locations on each field. Positions were provided by Statoil ASA.<br />
Fugro Survey AS supplied one surveyor and DGPS System for this survey.<br />
The job was carried out in the period 18 May to 2 June 2010.<br />
FSAS Ref. P9087-50, Revision 1, 21 June 2010 Page 1
STATOIL ASA / MULTICLIENT<br />
M/V LIBAS ENVIRONMENTAL SURVEY 2010 REGION III<br />
2. AREA MAP<br />
FSAS Ref. P9087-50, Revision 1, 21 June 2010 Page 2
STATOIL ASA / MULTICLIENT<br />
M/V LIBAS ENVIRONMENTAL SURVEY 2010 REGION III<br />
3. PROJECT SUMMARY<br />
Move<br />
Vessel: M/V Libas<br />
Location area: Region III, North Sea<br />
Personnel<br />
Fugro Survey: Eivind Jacobsen (Field Surveyor)<br />
Client representative: Rannveig Elise Otterlei / Endre Aas<br />
Navigation Systems<br />
Rig Positioning Software: Starfix Suite 8.1 SP3 with Seis RC 11<br />
Primary System: Trimble DGPS<br />
Secondary System: Trimble DGPS<br />
Gyro: From HPR System<br />
Key Events Time Weekday Date<br />
Personnel arrived onboard : 09:00 Tuesday 18 May 2010<br />
Equipment mobilised: 15:30 Tuesday 18 May 2010<br />
Started operations at region III: 06:30 Wednesday 19 May 2010<br />
Completed operations at region III: 20:00 Tuesday 1 June 2010<br />
Equipment demobilized: 09:00 Wednesday 2 June 2010<br />
Personnel departed from the vessel: 10:00 Wednesday 2 June 2010<br />
FSAS Ref. P9087-50, Revision 1, 21 June 2010 Page 6
STATOIL ASA / MULTICLIENT<br />
M/V LIBAS ENVIRONMENTAL SURVEY 2010 REGION III<br />
Position ID Easting Northing<br />
Alternative<br />
East<br />
Alternative<br />
North Comments<br />
PI NORD<br />
Pi Nord 436 538 6 431 101 Center sampling area<br />
Pi-14 436 715 6 431 278<br />
Pi-15 436 892 6 431 455<br />
Pi-16 437 245 6 431 808<br />
Pi-17 436 715 6 430 924<br />
Pi-18 436 892 6 430 747<br />
Pi-19 437 245 6 430 394<br />
Pi-20 437 952 6 429 687<br />
Pi-21 436 361 6 430 924<br />
Pi-22 436 184 6 430 747<br />
Pi-23 435 831 6 430 394<br />
Pi-24 436 361 6 431 278<br />
Pi-25 436 184 6 431 455<br />
Pi-26 435 831 6 431 808<br />
REG2-6 460 590 6 429 051 Area Reference station<br />
FRIGG<br />
FRI01 447 719 6 638 770<br />
FRI02 447 942 6 638 675<br />
FRI03 447 674 6 638 246<br />
FRIX2 446 694 6 638 180<br />
FRI04 447 440 6 638 466<br />
FRIX1 447 534 6 638 503<br />
FRI11 447 668 6 639 031<br />
FRI24 448 135 6 638 942<br />
FRI25 448 070 6 639 480<br />
FRI27 448 327 6 639 324<br />
FRI10R 458 362 6 627 966 Area reference station<br />
OSEBERG J<br />
Oseberg J 494 486 6 691 052 Center sampling area<br />
OSJ01 494 663 6 691 229<br />
OSJ02 494 840 6 691 406<br />
OSJ05 494 663 6 690 875<br />
OSJ06 494 840 6 690 698<br />
OSJ09 494 309 6 690 875<br />
OSJ10 494 132 6 690 698<br />
OSJ13 494 269 6 691 177 Center sampling area<br />
OSJ14 494 053 6 691 302<br />
FSAS Ref. P9087-50, Revision 1, 21 June 2010 Page 9
STATOIL ASA / MULTICLIENT<br />
M/V LIBAS ENVIRONMENTAL SURVEY 2010 REGION III<br />
APPENDICES<br />
FSAS Ref. P9087-50, Revision 1, 21 June 2010 Page 17
STATOIL ASA / MULTICLIENT<br />
M/V LIBAS ENVIRONMENTAL SURVEY 2010 REGION III<br />
A. FIELD LOG<br />
FSAS Ref. P9087-50, Revision 1, 21 June 2010 Appendix A
STATOIL ASA / MULTICLIENT<br />
M/V LIBAS ENVIRONMENTAL SURVEY 2010 REGION III<br />
All times refers to Norwegian Local Time (UTC +2 hours)<br />
Time Event<br />
Tuesday 18 May 2010<br />
08:30 FSAS personnel Eivind Jacobsen left home, Gylfi Runarsson left Fugro workshop.<br />
09:00 E. Jacobsen & Gylfi Runarsson arrived Libas at Lie,Sotra.<br />
09:30 Started mobilization.<br />
15:30 Mobilization completed, ant offsets entered from CPR:<br />
Port GPS : x= -5m, y = 10.5m.<br />
Starbord GPS: x= 6.4m, y = 6.2m.<br />
Grabb : x= 10m, y = 20m.<br />
15:35 G. Runarsson departed Libas for Fugro workshop.<br />
15:45 Departed Lie for testing equipment.<br />
16:15 MOB drill<br />
16:30 On DP, testing equipment.<br />
17:30 Departed for sample-area, Yme.<br />
23:59 Enroute to Yme.<br />
Wednesday 19 May 2010<br />
06:15 Logging started.<br />
06:25 In position YMEB2-13, prepare to launch grab.<br />
06:30 Start sample-taking at YMEB2-13, fix # 2.<br />
09:30 On clients request, station YMEB2-4 is moved to new location dt underwater structure. New coordinates:<br />
581 692E, 6 402 406N. Position is 26m in 127° from original location.<br />
20:02 Completed station Yme Beta, heading for Yme Gamma<br />
23:59 Continue sampling at Yme Gamma.<br />
Thursday 20 May 2010<br />
00:00 Continue sampling at Yme Gamma.<br />
09:16 Completed Yme field, heading for station REF/REG, should be renamed to REG1-10.<br />
10:35 Start sampling at station REG1-10.<br />
11:13 Sampling completed on REG1-10, heading for Bream field.<br />
13:00 Start sampling at Bream field.<br />
19:03 Station BRE11 moved 42m in 220° dt rocks. New position 553 891E, 6 449 136N.<br />
21:12 Station BRE12 moved 40m in 298° dt rocks. New position 553 713E, 6 449 314N.<br />
23:59 Continue sampling at Bream field.<br />
Friday 21 May 2010<br />
00:00 Continue sampling at Bream field.<br />
04:55 Station BRE2 moved 31m in 348° dt rocks. New position 554 274E, 6 449 148N.<br />
05:30 Completed Bream field, heading for REG2-11.<br />
06:21 Start sampling at REG2-11.<br />
07:28 Completed REG2-11, heading for REG2-6.<br />
11:30 Start sampling at REG2-6.<br />
12:15 Completed REG2-6, heading for area Pi-sør.<br />
13:30 Start sampling at Pi sør field.<br />
19:45 Station Pi10 moved 40m in 29° dt rocks. New position 436 166E, 6 424 456N<br />
23:59 Continue sampling at Pi-sør field.<br />
Saturday 22 May 2010<br />
00:00 Continue sampling at Pi-sør field.<br />
01:10 Pi-sør area completed, heading for Pi-nord<br />
01:40 Start sampling at Pi-nord area.<br />
FSAS Ref. P9087-50, Revision 1, 21 June 2010 Appendix A
STATOIL ASA / MULTICLIENT<br />
M/V LIBAS ENVIRONMENTAL SURVEY 2010 REGION III<br />
Saturday 22 May 2010 cont.<br />
12:45 Completed Pi-nord area, heading for FRI10R<br />
21:10 Start sampling FRI10R<br />
21:50 Completed FRI10R, heading for Frigg field.<br />
22:43 Start sampling on Frigg-field, FRIX2.<br />
23:59 Continue sampling at Frigg-field.<br />
Sunday 23 May 2010<br />
00:00 Continue sampling at Frigg-field.<br />
05:40 Completed Frigg area, heading for Oseberg J field.<br />
08:40 Start sampling at Oseberg J area, OSJ 11.<br />
09:10 Finish at OSJ11, but this station is not in the new program., Moving to OSJ10.<br />
15:08 Completed Oseberg J area, heading for Oseberg Sør.<br />
15:40 Start sampling at Oseberg Sør area, OSS07.<br />
19:39 Extra station OSS11X, position 488 598E, 6 695 135N.<br />
19:49 Extra station OSS11X2, position 488 520E, 6 695 306N.<br />
23:59 Continue sampling at Oseberg Sør field.<br />
Monday 24 May 2010<br />
00:00 Continue sampling at Oseberg Sør field.<br />
02:30 Completed Oseberg Sør area, heading for REG3-19.<br />
02:58 Start sampling at REG3-19.<br />
03:46 Completed REG3-19, heading for REG3-17.<br />
04:43 Start sampling at REG3-17.<br />
05:22 Completed REG3-17, heading for Tune Sør area.<br />
05:54 Start sampling at Tune Sør area.<br />
10:20 Completed Tune Sør area, heading for Oseberg Delta area.<br />
10:55 Start sampling at Oseberg Delta area.<br />
14:46 Completed Oseberg Delta area, heading for Oseberg Feltsenter.<br />
15:20 Start sampling at Oseberg Feltsenter area.<br />
21:30 Completed Oseberg Feltsenter area, heading for REG3-18.<br />
22:15 Start sampling at REG3-18.<br />
23:22 Completed REG3-18, heading for Brage.<br />
23:55 Start sampling Brage area.<br />
23:59 Continue sampling in Brage area.<br />
Tuesday 25 May 2010<br />
00:00 Continue sampling in Brage area.<br />
08:10 Brage area completed, heading for Bergen for Clientrep-change.<br />
12:45 Alongside Skarholmen, Askøy.<br />
14:00 Departed Skarholmen, heading for REG3-6.<br />
19:07 Start sampling at REG3-6.<br />
20:25 Completed REG3-6, heading for Troll A.<br />
21:20 Start sampling Troll A area.<br />
23:59 Continue sampling in Troll A area.<br />
Wednesday 26 May 2010<br />
00:00 Continue sampling in Troll A area.<br />
04:30 Completed Troll A area, heading for Troll B & C area.<br />
05:05 Start sampling at Troll B & C area.<br />
23:59 Continue sampling in Troll B & C area.<br />
FSAS Ref. P9087-50, Revision 1, 21 June 2010 Appendix A
STATOIL ASA / MULTICLIENT<br />
M/V LIBAS ENVIRONMENTAL SURVEY 2010 REGION III<br />
Thursday 27 May 2010<br />
00:00 Continue sampling in Troll B & C area.<br />
05:29 Completed Troll B & C area, heading for REG3-12.<br />
06:19 start sampling at REG3-12.<br />
07:18 Completed REG3-12, heading for Fram area.<br />
08:04 Start sampling in Fram Øst area.<br />
23:59 Continue sampling in Fram Øst area.<br />
Friday 28 May 2010<br />
00:00 Continue sampling in Fram Øst area.<br />
16:28 Completed Fram Øst area, heading for REG3-11.<br />
17:08 Start sampling at REG3-11.<br />
17:51 Completed REG3-11, heading for Pan Pandora area.<br />
20:40 Start sampling in Pan Pandora area.<br />
23:59 Continue sampling in Pan Pandora area.<br />
Saturday 29 May 2010<br />
00:00 Continue sampling in Pan Pandora area.<br />
08:50 Completed Pan Pandora area, heading for REG4-3.<br />
09:19 Start sampling REG4-3.<br />
10:03 Completed REG4-3, heading for Jordbær field.<br />
12:34 Start sampling at Jordbær field.<br />
23:59 Continue sampling at Jordbær field.<br />
Sunday 30 May 2010<br />
00:00 Continue sampling at Jordbær field.<br />
18:10 Fire drill.<br />
18.38 Completed Jordbær-field, heading for REG4-12.<br />
19:13 Start sampling at REG4-12.<br />
20:15 Completed REG4-12, heading for REG3-7.<br />
23:59 En route to REG4-12.<br />
Monday 31 May 2010<br />
00:05 Start sampling on REG4-12.<br />
00:45 Completed sampling on REG4-12, heading for Huldra field.<br />
01:32 Start sampling at Huldra field.<br />
05:20 Huldra field completed, heading for REG3-13.<br />
06:05 Start sampling at station REG3-13.<br />
07:02 Completed REG3-13, heading for Veslefrikk field.<br />
07:40 Start sampling at Veslefrikk area.<br />
20:26 Completed Veslefrikk area, heading for REG3-14.<br />
20:58 Start sampling at station REG3-14.<br />
21:23 Completed REG3-14, heading for Oseberg Øst field.<br />
22:04 Start sampling at Oseberg Øst field.<br />
23:59 Continue sampling at Oseberg Øst field.<br />
FSAS Ref. P9087-50, Revision 1, 21 June 2010 Appendix A
STATOIL ASA / MULTICLIENT<br />
M/V LIBAS ENVIRONMENTAL SURVEY 2010 REGION III<br />
Tuesday 1 June 2010<br />
00:00 Continue sampling at Oseberg Øst field<br />
04:20 Completed Oseberg Øst field, heading for REG3-15.<br />
05:10 start sampling at REG3-15.<br />
05:28 Completed REG3-15, heading for Oseberg C field.<br />
12:09 Completed Oseberg C field, heading for REG3-16.<br />
12:50 Start sampling at REG3-16.<br />
13.14 Completed REG3-16, heading for Oseberg G field.<br />
13:15 Station OSG05 moved 40m in 37° due to embillical on seabed. New position 482 948E, 6 711 345N.<br />
13:40 Start sampling at Oseberg G field.<br />
18:30 Oseberg G completed, heading for CCB, Sotra. ETA 2nd of June 0900 hrs.<br />
18:39 Logging stopped, start demobilization.<br />
21:45 De-mobilization completed.<br />
23:59 En route to CCB, Sotra.<br />
Wednesday 2 June 2010<br />
09:00 Demobilization completed.<br />
10:00 FSAS personnel departed “Libas”.<br />
FSAS Ref. P9087-50, Revision 1, 21 June 2010 Appendix A
DET NORSKE VERITAS<br />
Det Norske Veritas:<br />
Det Norske Veritas (DNV) er en ledende, uavhengig leverandør av tjenester for risikostyring, med<br />
global virksomhet gjennom et nettverk av 300 kontorer i 100 ulike land. DNVs formål er å arbeide for<br />
sikring av liv, verdier og miljø.<br />
DNV bistår sine kunder med risikostyring gjennom tre typer tjenester: klassifisering, sertifisering og<br />
konsulentvirksomhet. Siden etableringen som en uavhengig stiftelse i 1864 har DNV blitt en<br />
internasjonalt anerkjent leverandør av ledelsestjenester og tekniske konsulent- og<br />
rådgivningstjenester, og er et av verdens ledende klassifiseringsselskaper. Dette innebærer<br />
kontinuerlig utvikling av ny tilnærming til helse-, miljø- og sikkerhetsledelse, slik at bedrifter kan<br />
fungere effektivt under alle forhold.<br />
Global impact for a safe and sustainable future:<br />
Besøk vår internettside for mer informasjon: www.dnv.no
DET NORSKE VERITAS<br />
Report for Total E&P Norge AS<br />
Environmental Sediment Survey Frigg 2010<br />
DNV Reg. No.: 12O31ER-5<br />
Revision No.: 01<br />
Date : 2010-11-30<br />
MANAGING RISK<br />
APPENDIX<br />
2<br />
TEST REPORT – SAMPLING AND BIOLOGICAL ANALYSES
DET NORSKE VERITAS<br />
Report<br />
Environmental Sediment Survey Frigg<br />
2010<br />
Test Report<br />
The project 2010/00119-Environmental Sediment Survey<br />
2010 - Region III<br />
TEST 083<br />
Report No./DNV Reg No.: 2010 - 1478/ 12O31ER-6<br />
Rev 01, 2010-10-04
DET NORSKE VERITAS<br />
Report for The project 2010/00119-Environmental Sediment Survey 2010 -<br />
Region III<br />
Environmental Sediment Survey Frigg 2010<br />
Table of Contents<br />
DNV Reg. No.: 12O31ER-6<br />
Revision No.: 01<br />
Date : 2010-10-08 Page ii of ii<br />
MANAGING RISK<br />
1 INTRODUCTION ............................................................................................................. 1<br />
2 SAMPLING........................................................................................................................ 1<br />
3 SORTING........................................................................................................................... 2<br />
4 SPECIES IDENTIFICATION ......................................................................................... 2<br />
5 TOP 10 ................................................................................................................................ 3<br />
6 INDICES............................................................................................................................. 5<br />
Appendix 1 Check list<br />
Appendix 2 Details from sampling<br />
Appendix 3 Species list
DET NORSKE VERITAS<br />
Report for The project 2010/00119-Environmental Sediment Survey 2010 -<br />
Region III<br />
Environmental Sediment Survey Frigg 2010<br />
1 INTRODUCTION<br />
DNV Reg. No.: 12O31ER-6<br />
Revision No.: 01<br />
Date : 2010-10-08 Page 1 of 5<br />
MANAGING RISK<br />
On behalf of the project 2010/00119-Environmental Sediment Survey 2010-Region III DNV’s<br />
Biology Laboratory has conducted macro fauna sampling and analyses from the Frigg field 2010.<br />
The work was conducted based on program prepared by Total E&P Norge AS and carried out as<br />
on the same survey as the regional environmental monitoring in Region III.<br />
DNV’s Biology laboratory (DNV Energy) is accredited by the Norwegian Accreditation<br />
(accreditation number TEST 083) for performing sampling and analyses of macro benthic fauna.<br />
Accreditation is according to NS-EN ISO/IEC 17025.<br />
The report is prepared according to the DNV procedure OP-ENENO752-5-3-14.<br />
Sampling, sorting and taxonomic analyses are carried out according to relevant procedures<br />
described in DNV’s Quality System.<br />
2 SAMPLING<br />
The sampling was carried out from the vessel M/V Libas the 22. and 23. of May 2010. Altogether<br />
11 stations were sampled for biological and chemical parameters.<br />
The fieldwork was performed according to Aktivitetsforskriften (Kap. X-1 - § 51 og 52, Vedlegg<br />
1; Teknisk vedlegg 2 – Sedimentovervåkning (Ptil, SFT, Shdir 2001) and DNV’s accredited<br />
procedures for this kind of work (Test 083).<br />
Location: Frigg, Nordsjøen<br />
Date: 22.05.10 - 23.05.10<br />
Survey Leader: Sam-Arne Nøland (DNV)<br />
Survey peronnnel: The feildwork was carried out with a 6-hours shift work:<br />
Sam-Arne Nøland (DNV), survey Leader<br />
Thomas Møskeland (DNV), shift Leader<br />
Øyvind Fjukmoen (DNV), shift Leader<br />
Marte Braathen (DNV)<br />
Christian Volan (DNV)<br />
Gunn Mari Michaelsen (MoLab)<br />
Odd Strandvold (MoLab)<br />
The work was coordinated by Endre Aas, Statoil.<br />
Appendix 2 shows the details from the sampling.
DET NORSKE VERITAS<br />
Report for The project 2010/00119-Environmental Sediment Survey 2010 -<br />
Region III<br />
Environmental Sediment Survey Frigg 2010<br />
3 SORTING<br />
DNV Reg. No.: 12O31ER-6<br />
Revision No.: 01<br />
Date : 2010-10-08 Page 2 of 5<br />
MANAGING RISK<br />
The sorting was carried out by Christian Volan, Ludvig Søgnen Jensen, Jacob Søgnen Jensen,<br />
Marthe Røgeberg, Theis Alexander Aspholm, Vegard Bjørnestad Skar, Peter Nikolai Knudsen,<br />
Tuva Kristine Østby, Kasper Nøland, Lisa Aurora Hauff, Jostein Olafsen, Aksel Gravir, Anders<br />
Glette Johnsen, Anders Westin, Charlotte Krossholm, Einar Ingebrigtsen and Tore Martinsen<br />
Olsvold in the Biology Laboratory at Høvik in June and July 2010.<br />
Procedures: OP-ENENO752-5-3-7, OP-ENENO752-5-3-9.<br />
4 SPECIES IDENTIFICATION<br />
Identification of species was carried out in July-September 2010.<br />
Mollusca was identified by Per Bie Wikander (Molltax) and Amund Ulfsnes<br />
Echinodermata was identified by Amund Ulfsnes<br />
Crustacea was identified by Thomas Møskeland<br />
Varia and Polychaeta was identified by Øystein Stokland (Marine Bunndyr AS).<br />
Procedures: OP-ENENO752-5-3-10, OP-ENENO752-5-3-12.
DET NORSKE VERITAS<br />
Report for The project 2010/00119-Environmental Sediment Survey 2010 -<br />
Region III<br />
Environmental Sediment Survey Frigg 2010<br />
5 TOP 10<br />
10 most dominant species, Frigg 2010.<br />
DNV Reg. No.: 12O31ER-6<br />
Revision No.: 01<br />
Date : 2010-10-08 Page 3 of 5<br />
MANAGING RISK<br />
FRI 1 (350/200m) Number % Cum % FRI 2 (758/196m) Number % Cum %<br />
Spiophanes bombyx 123 14,44 14,44 Myriochele oculata 507 44,16 44,16<br />
Myriochele oculata 122 14,32 28,76 Owenia fusiformis 190 16,55 60,71<br />
Owenia fusiformis 92 10,80 39,55 Amphiura filiformis 47 4,09 64,81<br />
Cerianthus lloydi 45 5,28 44,84 Unciola planipes 31 2,70 67,51<br />
Amphipholis squamata 45 5,28 50,12 Parvicardium minimum 29 2,53 70,03<br />
Parvicardium minimum 45 5,28 55,40 Goniada maculata 25 2,18 72,21<br />
Siphonoecetes kroeyeranus 38 4,46 59,86 Cerianthus lloydi 23 2,00 74,22<br />
Prionospio cirrifera 23 2,70 62,56 Scoloplos (Scoloplos) armiger 23 2,00 76,22<br />
Nemertina indet. 18 2,11 64,67 Spiophanes bombyx 22 1,92 78,14<br />
Edwardsia sp. 16 1,88 66,55 Edwardsia sp. 20 1,74 79,88<br />
Spiophanes wigleyi 16 1,88 68,43 Paramphinome jeffreysii 17 1,48 81,36<br />
Ophiocten affinis 16 1,88 70,31 Aonides paucibranchiata 17 1,48 82,84<br />
FRI 3 (188/300m) Number % Cum % FRI 4 (249/200m) Number % Cum %<br />
Spiophanes bombyx 115 22,50 22,50 Myriochele oculata 120 14,55 14,55<br />
Cerianthus lloydi 29 5,68 28,18 Spiophanes bombyx 74 8,97 23,52<br />
Siphonoecetes kroeyeranus 25 4,89 33,07 Cerianthus lloydi 47 5,70 29,21<br />
Parvicardium minimum 24 4,70 37,77 Edwardsia sp. 35 4,24 33,45<br />
Owenia fusiformis 23 4,50 42,27 Parvicardium minimum 34 4,12 37,58<br />
Chaetozone setosa complex 20 3,91 46,18 Amphiura filiformis 33 4,00 41,58<br />
Goniada maculata 16 3,13 49,32 Siphonoecetes kroeyeranus 32 3,88 45,45<br />
Amphiura filiformis 14 2,74 52,05 Spiophanes wigleyi 27 3,27 48,73<br />
Spiophanes wigleyi 13 2,54 54,60 Chaetozone setosa complex 26 3,15 51,88<br />
Hippomedon denticulatus 13 2,54 57,14 Ophiocten affinis 22 2,67 54,55<br />
Myriochele oculata 12 2,35 59,49 Prionospio cirrifera 22 2,67 57,21<br />
Fri 10R (135/14686) Number % Cum % Fri 11 (350/500m) Number % Cum %<br />
Owenia fusiformis 389 34,12 34,12 Myriochele oculata 533 45,21 45,21<br />
Myriochele oculata 218 19,12 53,25 Owenia fusiformis 151 12,81 58,02<br />
Amphiura filiformis 54 4,74 57,98 Amphiura filiformis 55 4,66 62,68<br />
Phoronis muelleri 36 3,16 61,14 Parvicardium minimum 40 3,39 66,07<br />
Thyasira flexuosa 29 2,54 63,68 Spiophanes bombyx 32 2,71 68,79<br />
Caudofoveata spp. 22 1,93 65,61 Scoloplos (Scoloplos) armiger 26 2,21 70,99<br />
Urothoe elegans 21 1,84 67,46 Paramphinome jeffreysii 24 2,04 73,03<br />
Goniada maculata 19 1,67 69,12 Unciola planipes 20 1,70 74,72<br />
Harpinia antennaria 18 1,58 70,70 Aonides paucibranchiata 20 1,70 76,42<br />
Ophiocten affinis 17 1,49 72,19 Edwardsia sp. 15 1,27 77,69<br />
Aonides paucibranchiata 16 1,40 73,60 Nemertina indet. 14 1,19 78,88<br />
Cont.
DET NORSKE VERITAS<br />
Report for The project 2010/00119-Environmental Sediment Survey 2010 -<br />
Region III<br />
Environmental Sediment Survey Frigg 2010<br />
DNV Reg. No.: 12O31ER-6<br />
Revision No.: 01<br />
Date : 2010-10-08 Page 4 of 5<br />
MANAGING RISK<br />
Fri 24 (170/250m) Number % Cum % Fri 25 (355/242m) Number % Cum %<br />
Myriochele oculata 380 35,12 35,12 Myriochele oculata 151 16,50 16,50<br />
Owenia fusiformis 101 9,33 44,45 Owenia fusiformis 83 9,07 25,57<br />
Unciola planipes 70 6,47 50,92 Unciola planipes 66 7,21 32,79<br />
Amphiura filiformis 53 4,90 55,82 Spiophanes bombyx 64 6,99 39,78<br />
Aonides paucibranchiata 46 4,25 60,07 Amphiura filiformis 63 6,89 46,67<br />
Ophiocten affinis 41 3,79 63,86 Aonides paucibranchiata 52 5,68 52,35<br />
Scoloplos (Scoloplos) armiger 25 2,31 66,17 Ophiocten affinis 30 3,28 55,63<br />
Spiophanes bombyx 25 2,31 68,48 Paramphinome jeffreysii 27 2,95 58,58<br />
Cerianthus lloydi 22 2,03 70,52 Scoloplos (Scoloplos) armiger 27 2,95 61,53<br />
Parvicardium minimum 20 1,85 72,37 Aricidea catherinae 27 2,95 64,48<br />
Aricidea catherinae 20 1,85 74,21 Nemertina indet. 19 2,08 66,56<br />
Fri 27 (70/250m) Number % Cum % Fri X1 (249/100m) Number % Cum %<br />
Myriochele oculata 392 39,40 39,40 Spiophanes bombyx 108 14,71 14,71<br />
Owenia fusiformis 82 8,24 47,64 Cerianthus lloydi 53 7,22 21,93<br />
Amphiura filiformis 70 7,04 54,67 Amphiura filiformis 48 6,54 28,47<br />
Aonides paucibranchiata 45 4,52 59,20 Parvicardium minimum 48 6,54 35,01<br />
Antalis entalis 43 4,32 63,52 Spiophanes wigleyi 45 6,13 41,14<br />
Ophiocten affinis 29 2,91 66,43 Edwardsia sp. 34 4,63 45,78<br />
Unciola planipes 25 2,51 68,94 Cirriformia tentaculata 34 4,63 50,41<br />
Aricidea catherinae 24 2,41 71,36 Hippomedon denticulatus 30 4,09 54,50<br />
Echinocyamus pusillus 19 1,91 73,27 Chaetozone setosa complex 28 3,81 58,31<br />
Parvicardium minimum 15 1,51 74,77 Owenia fusiformis 26 3,54 61,85<br />
Scoloplos (Scoloplos) armiger 15 1,51 76,28 Ophiocten affinis 25 3,41 65,26<br />
Fri X2 (249/1000m) Number % Cum %<br />
Myriochele oculata 310 38,70 38,70<br />
Owenia fusiformis 111 13,86 52,56<br />
Amphiura filiformis 49 6,12 58,68<br />
Aricidea catherinae 30 3,75 62,42<br />
Paramphinome jeffreysii 24 3,00 65,42<br />
Ophiocten affinis 19 2,37 67,79<br />
Scaphopoda spp. 16 2,00 69,79<br />
Parvicardium minimum 15 1,87 71,66<br />
Aonides paucibranchiata 14 1,75 73,41<br />
Goniada maculate 13 1,62 75,03
DET NORSKE VERITAS<br />
Report for The project 2010/00119-Environmental Sediment Survey 2010 -<br />
Region III<br />
Environmental Sediment Survey Frigg 2010<br />
6 INDICES<br />
DNV Reg. No.: 12O31ER-6<br />
Revision No.: 01<br />
Date : 2010-10-08 Page 5 of 5<br />
MANAGING RISK<br />
Numbers of individuals (N) and species (S), depth, Shannon-Wiener diversity index (H’), Pielou’s<br />
evenness index (J), and expected number of species per 100 individuals (ES100) for each station at Frigg<br />
2010 (ex. juv.).<br />
Station º / m Depth (m) S N H' J ES100<br />
FRI 1 350/200 106 79 852 4.8 0.75 33<br />
FRI 2 758/196 105 77 1148 3.5 0.56 25<br />
FRI 3 188/300 102 78 511 5.0 0.80 39<br />
FRI 4 249/200 111 100 825 5.3 0.79 39<br />
FRI 10R 135/ 14686 105 95 1140 4.1 0.63 31<br />
FRI 11 350/500 105 80 1179 3.7 0.58 27<br />
FRI 24 170/250 107 80 1082 4.2 0.66 30<br />
FRI 25 355/242 103 87 915 4.9 0.76 34<br />
FRI 27 70/250 105 86 995 4.0 0.63 29<br />
FRI X1 249/100 106 71 734 4.9 0.79 32<br />
FRI X2 249/1000 118 88 801 4.0 0.62 30
DET NORSKE VERITAS<br />
Report for The project 2010/00119-Environmental Sediment Survey 2010 -<br />
Region III<br />
Environmental Sediment Survey Frigg 2010<br />
APPENDIX<br />
1<br />
CHECK LIST<br />
- o0o -<br />
DNV Reg. No.: 12O31ER-6<br />
Revision No.: 01<br />
Date : 2010-10-08 Page 1-6<br />
MANAGING RISK
DET NORSKE VERITAS<br />
Report for The project 2010/00119-Environmental Sediment Survey 2010 -<br />
Region III<br />
Environmental Sediment Survey Frigg 2010<br />
APPENDIX<br />
2<br />
DETAILS FROM SAMPLING<br />
DNV Reg. No.: 12O31ER-6<br />
Revision No.: 01<br />
Date : 2010-10-08 Page 1-7<br />
MANAGING RISK
Frigg 2010<br />
DET NORSKE VERITAS<br />
Report for The project 2010/00119-Environmental Sediment Survey 2010 -<br />
Region III<br />
Environmental Sediment Survey Frigg 2010<br />
DNV Reg. No.: 12O31ER-6<br />
Revision No.: 01<br />
Date : 2010-10-08 Page 1-8<br />
MANAGING RISK<br />
UTM Org./ NPD/ Kjemi Bio<br />
St. nr. º / m N E Bio Korn THC Metall PAH Dyp Dato Start Slutt Tid #1 #2 #3 #1 #2 #3 #4 #5 Grabb Bom Beskrivelse Kommentarer<br />
FRI01 350 200 6638770 447719 5 1 3 3 106 23.mai 02:40 03:10 00:30 8 8 8 8 8 8 8 8 B25/B17 0 Brungrønn fin sand<br />
FRI02 58 196 6638675 447942 5 1 3 3 105 23.mai 03:20 03:45 00:25 8 8 8 6 8 8 8 8 B25/B17 0 Brungrønn fin sand<br />
FRI03 188 300 6638246 447674 5 1 5 3 5 102 22.mai 23:40 00:25 00:45 6 7 8 6 7 8 7 8 B25 0 Brungrønn fin sand Svarte flekker i gr.4 og 5<br />
FRIX2 249 1000 6638180 446694 5 1 3 3 111 22.mai 22:40 23:20 00:40 7 7 6 7 7 6 7 8 B25 1 Brungrønn fin sand<br />
FRI04 249 200 6638466 447440 5 1 3 3 105 23.mai 00:35 01:10 00:35 8 7 8 8 7 8 8 8 B25/B17 0 Brungrønn fin sand<br />
FRIX1 249 100 6638503 447534 5 1 3 3 105 23.mai 01:15 01:50 00:35 8 8 9 9 8 7 9 9 B25/B17 0 Brungrønn fin sand<br />
FRI11 350 500 6639031 447668 5 1 3 3 107 23.mai 02:00 02:25 00:25 9 9 7 8 9 8 7 8 B25/B17 0 Brungrønn fin sand<br />
FRI24 170 250 6638942 448135 5 1 3 3 103 23.mai 03:55 04:25 00:30 8 8 8 7 8 8 8 7 B25/B17 0 Brungrønn fin sand<br />
FRI25 355 242 6639480 448070 5 1 3 3 105 23.mai 05:05 05:40 00:35 7 7 7 7 7 7 7 6 B25/B17 0 Brungrønn fin sand m/noe grus<br />
FRI27 70 250 6639324 448327 5 1 3 3 106 23.mai 04:30 05:00 00:30 9 8 8 9 9 8 8 9 B25/B17 0 Brungrønn fin sand Noe svart i gr. 3?<br />
FRI10R 135.4 14686 6627966 458362 5 1 5 3 5 118 22.mai 21:00 21:50 00:50 9 8 8 10 10 9 8 8 B15 m/ lodd 1 Brungrønn fin sand Sjikt
DET NORSKE VERITAS<br />
Report for The project 2010/00119-Environmental Sediment Survey 2010 -<br />
Region III<br />
Environmental Sediment Survey Frigg 2010<br />
APPENDIX<br />
3<br />
SPECIES LIST<br />
DNV Reg. No.: 12O31ER-6<br />
Revision No.: 01<br />
Date : 2010-10-08 Page 1-8<br />
MANAGING RISK
DET NORSKE VERITAS<br />
Report for The project 2010/00119-Environmental Sediment Survey 2010 -<br />
Region III<br />
Environmental Sediment Survey Frigg 2010<br />
VARIA<br />
Hydrozoa<br />
DNV Reg. No.: 12O31ER-6<br />
Revision No.: 01<br />
Date : 2010-10-08 Page 1-9<br />
MANAGING RISK<br />
Fri 01 Fri 02 Fri 03 Fri x2 Fri 04 Fri X1 Fri 11 Fri 24 Fri 25 Fri 27 Fri 10R<br />
Acaulis primarius 0 8 2 0 4 7 6 9 13 2 0<br />
Molgulidae spp. 0 0 0 0 0 0 0 3 1 1 0<br />
Pennatula phosphorea 0 0 0 0 0 0 0 0 0 0 1<br />
ANTHOZOA<br />
Cerianthus lloydi 45 23 29 4 47 53 10 22 19 11 2<br />
Edwardsia sp. 16 20 9 1 35 34 15 14 16 7 1<br />
Hydroida indet. 1 0 0 0 0 0 0 0 0 0 0<br />
Virgularia mirabilis 0 0 0 0 1 0 0 1 0 0 0<br />
Caryophyllia smithii 0 0 0 0 0 1 0 0 0 0 0<br />
Anthozoa indet. 1 0 7 0 2 0 0 0 0 0 0<br />
Onchnesoma steenstrupii steenstrupii 0 1 0 0 0 0 0 0 0 0 0<br />
OTHERS<br />
Phoronis muelleri 0 5 1 5 1 0 2 10 5 3 36<br />
Nemertina indet. 18 9 5 5 12 16 14 11 19 10 11<br />
Platyhelminthes spp. 0 1 0 1 0 0 1 0 2 0 0<br />
Nematoda spp. 0 1 0 0 0 0 1 5 3 5 0<br />
Bryozoa indet. 0 0 0 0 2 3 0 0 0 0 0<br />
Siboglinidae indet. 0 0 0 0 0 0 0 0 0 0 2<br />
Oligochaeta indet. 0 0 0 0 0 0 0 0 2 1 0<br />
POLYCHAETA<br />
POLYNOIDAE<br />
APHRODITIDAE<br />
Aphrodita aculeata 0 0 0 1 0 0 1 1 0 0 0<br />
SIGALIONIDAE<br />
Pholoe baltica 2 0 2 3 5 5 5 3 2 0 4<br />
Sthenelais limicola 0 7 5 6 4 4 1 4 1 3 5<br />
PHYLLODOCIDAE<br />
Chaetoparia nilssoni 1 0 2 0 1 1 2 0 0 0 1<br />
Eteone longa 2 0 1 0 0 0 0 0 0 0 0<br />
Eteone c.f flava 0 0 0 0 1 0 2 0 0 0 0<br />
Eteone foliosa 0 0 0 0 0 0 0 0 1 0 0<br />
Phyllodoce rosea 0 1 0 0 0 0 0 1 0 0 0<br />
Phyllodoce mucosa 0 0 0 0 1 0 0 0 0 0 1<br />
Phyllodocidae indet. juv 0 0 0 0 1 0 0 0 0 0 0<br />
GLYCERIDAE<br />
Glycera alba 2 0 1 0 0 1 1 0 1 1 1<br />
Glycera lapidum 5 1 7 2 14 11 3 4 13 3 2<br />
Goniada maculata 4 25 16 13 16 8 13 14 10 7 19<br />
Glycinde nordmanni 0 1 2 2 0 0 1 0 1 1 0<br />
SPHAERODORIDAE<br />
Sphaerodorum gracilis 0 1 0 1 0 0 0 0 0 0 0<br />
NEREIDAE
DET NORSKE VERITAS<br />
Report for The project 2010/00119-Environmental Sediment Survey 2010 -<br />
Region III<br />
Environmental Sediment Survey Frigg 2010<br />
DNV Reg. No.: 12O31ER-6<br />
Revision No.: 01<br />
Date : 2010-10-08 Page 1-10<br />
MANAGING RISK<br />
Fri 01 Fri 02 Fri 03 Fri x2 Fri 04 Fri X1 Fri 11 Fri 24 Fri 25 Fri 27 Fri 10R<br />
Nereididae indet. 0 0 0 0 0 0 0 0 0 1 1<br />
NEPTHYIDAE<br />
Nephtys longosetosa 0 0 0 0 0 0 0 0 1 0 0<br />
Nephtys caeca 9 1 2 1 5 0 2 2 3 6 10<br />
Nephtys hombergii 0 1 1 3 1 1 3 0 1 0 1<br />
Nephtys paradoxa 0 0 0 0 1 0 0 0 0 0 0<br />
Nephtys sp. juv 4 5 3 4 2 3 2 6 2 3 10<br />
AMPHINOMIDAE<br />
Paramphinome jeffreysii 11 17 8 24 21 16 24 14 27 10 9<br />
Onuphidae 0 0 0 0 0 0 0 0 0 0 0<br />
Hyalinoecia tubicola 6 3 1 2 3 1 5 2 2 3 0<br />
Onuphis conchylega 0 0 0 0 0 0 3 5 4 0 0<br />
ORBINIIDAE<br />
Scoloplos (Scoloplos) armiger 15 23 6 7 12 10 26 25 27 15 12<br />
PARAONIDAE<br />
Aricidea catherinae 5 9 5 30 12 0 7 20 27 24 14<br />
Aricidea (Acmira) cerrutii 0 0 0 2 0 1 0 0 1 1 7<br />
Aricidea laubieri 0 0 0 1 1 0 0 1 0 1 0<br />
Aricidea wassi 0 1 0 0 0 0 0 1 0 0 0<br />
Levinsenia gracilis 0 0 1 0 0 0 0 0 0 0 6<br />
Paradoneis lyra 2 0 1 0 0 1 0 0 0 0 0<br />
SPIONIDAE<br />
Aonides paucibranchiata 7 17 2 14 7 2 20 46 52 45 16<br />
Spio filicornis 9 7 7 2 1 3 1 9 9 3 1<br />
Dipolydora coeca 0 0 0 1 0 0 0 0 0 0 0<br />
Pseudopolydora antennata 4 1 2 4 1 1 0 0 1 0 3<br />
Pseudopolydora pulchra 1 0 0 1 0 1 0 0 1 0 0<br />
Prionospio cirrifera 23 6 8 9 22 22 11 16 15 11 10<br />
Prionospio fallax 1 0 0 1 0 1 0 0 1 0 6<br />
Scolelepis (Scolelepis) foliosa 0 0 0 1 3 0 1 0 1 1 1<br />
Spiophanes kroyeri 0 0 0 3 1 1 2 2 2 8 4<br />
Spiophanes bombyx 123 22 115 11 74 108 32 25 64 11 7<br />
Spiophanes wigleyi 16 5 13 2 27 45 11 1 9 1 3<br />
POECILOCHAETIDAE<br />
Poecilochaetus serpens 0 0 0 0 0 1 0 0 0 0 0<br />
CIRRATULIDAE<br />
Aphelochaeta sp. 0 1 0 0 4 7 0 1 0 1 0<br />
Chaetozone setosa complex 15 5 20 7 26 28 14 1 8 5 5<br />
Cirriformia tentaculata 9 0 0 0 19 34 0 0 0 0 0<br />
Caulleriella sp. 0 1 4 2 1 3 0 3 4 1 0<br />
FLABELLIGERIDAE<br />
Diplocirrus glaucus 1 0 0 5 1 0 1 0 0 1 5<br />
OPHELIIDAE<br />
Ophelina cylindricaudata 0 0 0 0 0 0 0 0 0 0 1<br />
Ophelina abranchiata 0 0 0 2 0 0 0 0 1 2 4<br />
SCALIBREGMATIDAE
DET NORSKE VERITAS<br />
Report for The project 2010/00119-Environmental Sediment Survey 2010 -<br />
Region III<br />
Environmental Sediment Survey Frigg 2010<br />
DNV Reg. No.: 12O31ER-6<br />
Revision No.: 01<br />
Date : 2010-10-08 Page 1-11<br />
MANAGING RISK<br />
Fri 01 Fri 02 Fri 03 Fri x2 Fri 04 Fri X1 Fri 11 Fri 24 Fri 25 Fri 27 Fri 10R<br />
Scalibregma inflatum 0 0 0 1 0 0 0 0 0 0 0<br />
OWENIDAE<br />
Myriochele oculata 122 507 12 310 120 11 533 380 151 392 218<br />
Myriochele danielsseni 0 0 0 0 0 0 0 1 5 11 1<br />
Owenia fusiformis 92 190 23 111 21 26 151 101 83 82 389<br />
Owenia fusiformis juv 6 16 1 9 4 2 5 7 5 5 3<br />
PECTINARIIDAE<br />
Pectinaria (Lagis) koreni 0 0 0 1 0 1 0 0 0 1 5<br />
Pectinaria (Amphictene) auricoma 0 0 4 3 6 5 6 1 6 2 7<br />
Pectinaria sp. 4 2 2 0 2 6 2 0 1 1 7<br />
AMPHARETIDAE<br />
Ampharete lindstroemi 0 1 0 1 0 0 2 1 0 1 1<br />
Anobothrus gracilis 2 2 4 2 3 2 7 5 4 0 2<br />
Sabellides octocirrata 0 0 0 1 0 0 0 1 0 2 5<br />
Samytha sexcirrata 0 0 0 0 0 0 1 0 0 0 0<br />
Mugga wahrbergi 0 0 0 0 0 0 0 0 0 0 2<br />
Pterolysippe vanelli 0 0 0 0 0 0 0 0 0 0 1<br />
Amphicteis gunneri 1 0 0 0 1 0 0 0 1 2 0<br />
TEREBELLIDAE<br />
Lanice conchilega 0 0 0 2 2 0 0 0 0 0 1<br />
Hauchiella tribullata 0 2 2 0 1 0 2 1 2 2 0<br />
TRICOBRANCHIDAE<br />
Terebellides stroemii 0 0 0 0 0 0 0 0 0 0 2<br />
SABELLIDAE<br />
Jasmineira caudata 0 1 0 2 2 0 0 2 1 0 2<br />
Jasmineira sp. 0 0 1 1 1 1 2 0 3 0 10<br />
Euchone sp. 0 0 0 0 0 0 0 0 0 0 1<br />
Chone sp. 0 2 0 0 0 0 0 0 0 0 5<br />
SERPULIDAE<br />
Ditrupa arietina 10 0 7 0 8 13 0 0 0 0 0<br />
Hydroides norvegicus 1 0 5 0 1 2 0 0 0 0 0<br />
CRUSTACEA<br />
OTHERS<br />
Paguridae spp. 3 2 3 5 2 2 0 9 6 4 2<br />
Sarsinebalia typhlops 1 0 0 0 0 0 0 0 0 0 0<br />
Astacilla dilatata 1 10 1 1 3 2 4 0 4 7 0<br />
Amphilochoides sp. 1 3 1 0 1 0 0 1 0 0 0<br />
Lepidepecreum longicornis 2 4 1 2 2 1 3 0 5 2 0<br />
Liocarcinus sp. 0 0 0 0 1 0 0 0 0 0 0<br />
Hyas coarctatus 0 0 0 0 0 1 0 0 0 0 0<br />
GAMMARIDEA<br />
Tmetonyx cicada 0 0 0 0 0 0 0 0 1 1 0<br />
Hippomedon denticulatus 9 8 13 1 19 30 8 5 11 8 3<br />
Gitanopsis sp. 1 0 1 0 3 0 0 2 0 0 0<br />
Leucothoe lilljeborgi 0 0 0 1 0 0 0 6 0 0 0<br />
Harpinia antennaria 0 0 1 8 0 0 0 0 0 0 18
DET NORSKE VERITAS<br />
Report for The project 2010/00119-Environmental Sediment Survey 2010 -<br />
Region III<br />
Environmental Sediment Survey Frigg 2010<br />
DNV Reg. No.: 12O31ER-6<br />
Revision No.: 01<br />
Date : 2010-10-08 Page 1-12<br />
MANAGING RISK<br />
Fri 01 Fri 02 Fri 03 Fri x2 Fri 04 Fri X1 Fri 11 Fri 24 Fri 25 Fri 27 Fri 10R<br />
Argissa hamatipes 0 1 0 1 1 1 2 1 0 2 1<br />
Ampelisca brevicornis 2 0 1 0 7 2 0 2 0 2 0<br />
Ampelisca diadema/tenuicornis 9 3 4 4 10 11 8 7 9 5 6<br />
Ampelisca macrocephala 2 1 0 1 1 2 0 0 0 1 2<br />
Ischyroceridae sp. 0 0 0 0 0 0 0 0 0 0 1<br />
Autonoe longipes 12 3 8 1 6 12 3 5 8 1 1<br />
Siphonoecetes (Centraloecetes) kroeyeranus 38 7 25 0 32 21 3 4 3 9 0<br />
Pontocrates spp. 4 2 1 0 2 1 3 2 3 4 1<br />
Synchelidium spp. 1 2 1 1 3 0 0 0 0 2 0<br />
Westwoodilla caecula 2 0 1 2 4 2 1 0 0 0 1<br />
Ampelisca sp. 0 0 0 0 0 0 1 0 0 0 0<br />
Ampelisca c.f. typica 2 0 0 0 0 0 0 0 0 0 0<br />
Lysianassidae indet. 0 0 0 0 0 0 0 0 1 0 0<br />
Caprellidae spp. 1 5 1 1 2 0 11 3 5 2 0<br />
Bathyporeia c.f. elegans 1 2 1 1 1 2 0 4 2 3 0<br />
Megamphopus cornutus 1 1 4 0 2 0 1 1 0 0 1<br />
Tryphosites longipes 6 0 1 0 1 2 1 0 2 3 0<br />
Unciola planipes 5 31 1 1 2 5 20 70 66 25 0<br />
C.f. Pardaliscidae sp. 1 0 0 0 0 0 0 0 0 0 0<br />
Scopelocheirus hopei 1 0 0 0 0 0 0 0 0 0 0<br />
Photis longicaudata 5 0 5 0 10 0 0 4 2 0 0<br />
Monoculodes sp. 0 1 1 0 1 0 0 0 0 1 0<br />
Acidostoma obesum 0 1 0 1 1 1 4 4 1 2 0<br />
Urothoe elegans 0 1 0 5 1 0 0 1 1 3 21<br />
Leptognathia sp. 0 2 0 0 0 0 0 0 0 0 0<br />
Hippomedon sp. 0 0 1 0 0 0 0 0 0 0 0<br />
Anonyx c.f. lilljeborgii 0 0 0 0 1 0 0 0 0 0 0<br />
Tryphosella c.f. nanoides 1 0 0 0 0 2 0 0 0 0 0<br />
Iphimediidae sp. 0 0 0 0 0 0 0 0 0 0 1<br />
Natatolana borealis 0 0 0 0 0 0 0 0 0 0 1<br />
CUMACEA<br />
Eudorellopsis deformis 3 2 4 1 6 2 0 6 2 2 1<br />
Pseudocuma sp. 0 0 0 1 0 0 0 1 1 0 0<br />
Hemilamprops roseus 0 0 0 1 2 0 0 0 0 0 0<br />
Diastylis spp. 1 0 3 0 3 0 2 0 0 3 3<br />
Leucon sp. 0 0 0 0 0 0 0 0 0 0 1<br />
Eudorella truncatula/hirsutha 0 0 0 0 0 0 0 0 0 0 3<br />
MOLLUSCA<br />
APLACOPHORA<br />
Caudofoveata spp. 0 0 0 0 0 0 1 0 0 0 22<br />
Neomenia carinata 1 1 1 0 6 1 0 1 2 2 0<br />
GASTROPODA<br />
Euspira pulchella 0 0 1 0 0 0 0 1 0 0 0<br />
Euspira montagui 0 0 1 0 1 0 0 1 0 1 0<br />
Aporrhais c.f serresianus 0 0 0 4 0 0 1 0 1 1 1<br />
Melanella sp. 0 0 0 1 0 0 0 0 0 0 0
DET NORSKE VERITAS<br />
Report for The project 2010/00119-Environmental Sediment Survey 2010 -<br />
Region III<br />
Environmental Sediment Survey Frigg 2010<br />
DNV Reg. No.: 12O31ER-6<br />
Revision No.: 01<br />
Date : 2010-10-08 Page 1-13<br />
MANAGING RISK<br />
Fri 01 Fri 02 Fri 03 Fri x2 Fri 04 Fri X1 Fri 11 Fri 24 Fri 25 Fri 27 Fri 10R<br />
Epitonium trevelyanum 0 0 0 0 0 0 1 0 0 0 0<br />
OPISTOBRANCHIA<br />
Acteon tornatilis 1 1 0 1 0 0 2 5 1 2 0<br />
Cylichna cylindracea 2 2 0 4 1 0 1 1 0 0 7<br />
Philine scabra 0 1 0 1 0 0 2 0 0 0 0<br />
Cylichnina umbilicata 0 3 0 5 1 0 5 2 1 1 1<br />
Nudibranchia spp. 1 1 0 0 0 0 1 1 3 3 0<br />
Volvulella acuminata 0 1 0 0 0 0 0 0 0 0 0<br />
Scaphander punctostriatus 0 0 0 0 0 0 0 1 0 0 1<br />
Turbonilla c.f. crenata 0 0 0 0 0 0 0 0 1 0 0<br />
BIVALVIA<br />
Abra prismatica 0 0 0 0 0 0 3 0 2 0 6<br />
Abra nitida 0 0 1 0 2 0 0 0 0 0 0<br />
Acanthocardia echinata 0 0 0 0 0 0 0 0 0 0 3<br />
Arctica islandica 0 0 0 1 2 1 1 0 0 0 0<br />
Axinulus croulinensis 0 0 0 0 0 0 0 0 0 0 14<br />
Cuspidaria cuspidata 0 0 0 0 0 0 1 0 0 0 0<br />
Hiatella arctica 0 0 0 0 3 0 0 0 0 0 1<br />
Kurtiella bidentata 0 1 0 0 0 0 0 1 0 0 0<br />
Lucinoma borealis 4 5 0 1 0 0 3 4 12 1 2<br />
Montacuta substriata 0 0 0 2 0 0 0 0 0 1 0<br />
Phaxas pellucidus 0 0 0 1 0 0 0 0 0 0 0<br />
Tellimya ferruginosa 1 1 4 1 1 0 0 1 1 1 0<br />
Tellimya tenella 0 0 0 3 1 1 0 0 0 0 5<br />
Thracia papyracea 0 0 0 0 0 0 0 1 0 1 1<br />
Thyasira flexuosa 7 0 1 7 1 0 1 1 2 1 29<br />
Timoclea ovata 12 3 6 1 9 4 3 10 4 1 9<br />
Parvicardium minimum 45 29 24 15 34 48 40 20 17 15 7<br />
Bivalvia indet 2 0 0 0 0 0 0 0 0 0 0<br />
Thyasira equalis 0 0 1 0 0 0 0 0 0 0 0<br />
Astarte sulcata 0 0 1 0 2 0 0 0 1 0 0<br />
Thracia villosiuscula 0 0 0 1 0 0 0 0 0 0 1<br />
Limatula gwyni 0 0 0 1 0 0 0 0 0 0 0<br />
Thyasira biplicata 0 0 0 0 1 0 0 0 0 0 1<br />
Dosinia lupinus 0 0 0 0 0 0 1 0 0 0 0<br />
Thyasira succisa 0 0 0 0 0 0 0 0 0 3 0<br />
Thyasira obsoleta 0 0 0 0 0 0 0 0 0 0 3<br />
Adontorhina similis 0 0 0 0 0 0 0 0 0 0 2<br />
Scaphopoda spp. 0 0 0 16 0 0 0 0 0 0 0<br />
Antalis entalis 0 12 0 0 3 0 11 16 2 43 4<br />
Antalis spp. 0 0 0 0 0 0 0 0 0 2 1<br />
ECHINODERMATA<br />
ASTEROIDA<br />
Asteroidea spp.juv. 8 7 10 6 8 8 10 8 7 6 1<br />
OPHIUROIDEA<br />
Amphiura filiformis 4 47 14 49 33 48 55 53 63 70 54
DET NORSKE VERITAS<br />
Report for The project 2010/00119-Environmental Sediment Survey 2010 -<br />
Region III<br />
Environmental Sediment Survey Frigg 2010<br />
DNV Reg. No.: 12O31ER-6<br />
Revision No.: 01<br />
Date : 2010-10-08 Page 1-14<br />
MANAGING RISK<br />
Fri 01 Fri 02 Fri 03 Fri x2 Fri 04 Fri X1 Fri 11 Fri 24 Fri 25 Fri 27 Fri 10R<br />
Amphiura chiajei 1 0 0 0 1 0 1 0 0 0 0<br />
Ophiocten affinis 16 5 12 19 22 25 7 41 30 29 17<br />
Ophiuroidea spp.juv. 5 12 23 9 15 4 6 6 3 2 4<br />
Amphipholis squamata 45 0 7 0 1 0 0 0 0 0 0<br />
Ophiactis balli 1 0 0 0 0 1 0 0 0 0 0<br />
Ophiura albida 0 0 2 0 0 1 0 0 0 0 0<br />
ECHINOIDEA<br />
Echinocardium flavescens 2 2 6 6 2 3 5 1 2 1 4<br />
Echinoidea spp.juv. 86 200 46 132 93 27 83 100 20 60 145<br />
Echinocyamus pusillus 5 4 0 7 7 1 7 10 3 19 0<br />
Echinus sp. 0 0 0 0 0 0 0 0 0 0 2<br />
Holothuroidea sp. 0 6 0 0 0 0 0 0 0 0 0<br />
Labidoplax buskii 0 0 0 1 3 0 4 4 5 3 3<br />
Psolus sp. juv 0 0 1 0 0 0 0 0 0 0 0<br />
Pseudothyone raphanus 0 0 0 0 1 0 1 0 2 0 0
Det Norske Veritas:<br />
Det Norske Veritas (DNV) is a leading, independent provider of services for managing risk with a global<br />
presence and a network of 300 offices in 100 different countries. DNV’s objective is to safeguard life,<br />
property and the environment.<br />
DNV assists its customers in managing risk by providing three categories of service: classification,<br />
certification and consultancy. Since establishment as an independent foundation in 1864, DNV has<br />
become an internationally recognised provider of technical and managerial consultancy services and<br />
one of the world’s leading classification societies. This means continuously developing new<br />
approaches to health, safety, quality and environmental management, so businesses can run smoothly<br />
in a world full of surprises.<br />
Global impact for a safe and sustainable future:<br />
Learn more on www.dnv.com
DET NORSKE VERITAS<br />
Report for Total E&P Norge AS<br />
Environmental Sediment Survey Frigg 2010<br />
DNV Reg. No.: 12O31ER-5<br />
Revision No.: 01<br />
Date : 2010-11-30<br />
APPENDIX<br />
3<br />
ANALYSIS REPORT - MOLAB<br />
MANAGING RISK
Molab as, 8607 Mo i Rana<br />
Telefon: 75 13 63 50<br />
Besøksadr. Mo i Rana: Mo Industripark<br />
Besøksadr. Oslo: Kjelsåsveien 174<br />
Besøksadr. Glomfjord: Ørnesvn. 3<br />
Besøksadr. Porsgrunn: Hydroveien 67<br />
Organisasjonsnr.: NO 953 018 144 MVA<br />
Appendix<br />
Chemical analysis<br />
Frigg 2010 Appendix<br />
Side 1
Frigg 2010 Appendix<br />
Side 2<br />
1.0 Quality assurance ....................................................................................... 4<br />
1.1 Grain size distribution.................................................................................... 4<br />
1.2 Total organic matter ...................................................................................... 4<br />
1.3 Chemical analysis ......................................................................................... 5<br />
2.0 Analytical results ........................................................................................ 6<br />
2.1 Sediment characterization............................................................................. 6<br />
2.2 Chemical analysis ......................................................................................... 9
Molab AS is accredited by Norwegian Accreditation to perform chemical analyses,<br />
accreditation number Test 032. The accreditation is according to NS-EN ISO/IEC 17025.<br />
Personnel<br />
Field work: Gunn Mari Michaelsen,<br />
Odd Strandvoll<br />
Grain size distribution: Terje Kolberg,<br />
Eli Ellingsen<br />
TOM analyses: Terje Kolberg,<br />
Eli Ellingsen<br />
Metal analyses: Gunn Mari Michaelsen,<br />
Terje Pedersen,<br />
Hanne Skog Lillevik,<br />
Wenche Brennbakk<br />
THC analyses: Daniel Perez,<br />
Anna Jønsson,<br />
Tove Kristin Dokka Torstensen<br />
Selected hydrocarbon analyses: Tove Kristin Dokka Torstensen<br />
Report preparation: Tove Kristin Dokka Torstensen<br />
Accuracy and precision are controlled by analysis of certified reference material.<br />
Details concerning measurement uncertainty will be given by request. Restsamples will be<br />
stored deepfreezed in 1 year after Molab have received the samples.<br />
Frigg 2010 Appendix<br />
Side 3
1.0 Quality assurance<br />
1.1 Grain size distribution<br />
Frigg 2010 Appendix<br />
Side 4<br />
An in house standard (Glomfjord) has been analyzed after the same procedure and together<br />
with the samples.<br />
The results of the analyses of the in house standard are given in Table 1.1-1. The results of the<br />
present analysis are in good accordance with the results from 2009.<br />
Table 1.1-1 Grain size distribution, in house standard Glomfjord results for 2009 and 2010 (% dried<br />
sediment)<br />
Sample Median diameter Classification St. deviation Skewness Kurtosis<br />
MdΦ<br />
SDΦ SkΦ KΦ<br />
Average 2009 2,84 Fine sand 1,16 0,28 2,13<br />
St. dev 2009 0,04 0,09 0,05 0,06<br />
Average 2010 2,85 Fine sand 1,11 0,28 2,14<br />
St. dev 2010 0,02 0,05 0,03 0,08<br />
Molab has participated in an interlaboratory comparison called WEPAL ISE. The results are<br />
given in Table 1.1-2.<br />
Table 1.1-2 Grain size distribution, results from an interlaboratory comparison WEPAL ISE<br />
(International Soil-Analytical Exchange) October - December 2009<br />
Sample 986 919 884 881<br />
Fraction < 63 µm % 9.85 20.2 55.1 93.6 Molab<br />
NDA mean 9.29 20.35 53.63 93.8<br />
Fraction > 63 µm % 90.2 79.8 44.9 6.45 Molab<br />
NDA mean 89.76 78.1 46.05 6.825<br />
1.2 Total organic matter<br />
Calsium carbonate and in house standards was heated to 480 °C together with the samples.<br />
The results are given in Table 1.2-1.<br />
Table1.2-1 Quality assurance analyses for total organic matter<br />
CaCO3 In house standard Glomfjord<br />
Average 2009 0.10 1.46<br />
SD 2009 0.04 0.09<br />
Average 2010 0.14 1.48<br />
SD 2010 0.03 0.09
Molab has participated in a interlaboratory comparison called WEPAL ISE. The results are<br />
given in Table 1.2-2<br />
Table 1.2-2 Total organic matter, results from an interlaboratory comparison WEPAL ISE<br />
(International Soil-Analytical Exchange) October - December 2009<br />
Sample 986 919 884 881<br />
Org.matter (L.O.I)% 3.55 4.75 6.49 3.4 Molab<br />
NDA mean 3.577 4.834 6.719 3.892<br />
1.3 Chemical analysis<br />
Quality assurance analyses for THC and PAH<br />
Table1.3-1 Quality assurance analyses for THC<br />
THC mg/kg Comments<br />
In house standards<br />
THC Oseberg 86 ± 20 n = 10, within the action limits in the control chart<br />
THC Oseberg Mini 5 ± 2 n = 7, within the action limits in the control chart<br />
Certified ref. material<br />
THC CRM CC-017 5600 ±1200 Certified value: 6600 ± 500 mg/kg<br />
Frigg 2010 Appendix<br />
Side 5<br />
Interlaboratory comparison<br />
SLP-SETOC SETOC median mg/kg Z-score<br />
SETOC 2010-2 #1 659 613 0.23<br />
#2 936 871 0.12<br />
#3 644 514 0.68<br />
#4 517 285 1.50<br />
Table1.3-2 Quality assurance analyses for PAH<br />
Interlaboratory comparison<br />
SLP-SETOC SETOC median mg/kg Z-score<br />
SETOC 2010-2 #1 11.68 10.30 0.39<br />
#2 79.29 84.29 -0.21<br />
#3 37.66 35.41 0.20<br />
#4 69.21 68.10 0.05<br />
Metals:<br />
In house standards (N1 and B1), certified reference material (LGC) and blank samples are<br />
included in the analyses. The results for the in house standards and the reference material are<br />
given in Table 1.3-3. The indicated intervals are given by two standard deviations of the<br />
measured means. The results are in good agreement with the reference value.
Table 1.3-3 Quality assurance analyses for metals (mg/kg dried sample)<br />
Element Ba Cd Cr Cu Hg Pb Zn<br />
Technic ICP GF-AAS ICP ICP CV-AAS ICP ICP<br />
N1 1)<br />
76 4 0.02 9.3 2.8 0.009 7.0 13<br />
Mean N1 761 ± 29 0.05 ± 0.06 9.1 ± 0.5 3.1 ± 0,4 0.008 ± 0.002 6.8 ± 0.5 13 ± 1<br />
81 0.05 22.9 8.3 0.018 9.4 29<br />
Mean B1 80±2 0.07±0.03 20.7±0.8 7.8±1 0.020±0.004 9.5±0.6 30±3<br />
B1 1)<br />
LGC 1)<br />
237 2.72 79.5 80.4 1.3 77.1 433<br />
Cert. LGC -<br />
2.7±0.3 84.0±9.4<br />
1: The analyses are performed by ALS Laboratory Group<br />
2.0 Analytical results<br />
2.1 Sediment characterization<br />
Table2.1-1. Grain size distribution, Frigg 2010<br />
83.6±4.1<br />
1.4±0.1<br />
Frigg 2010 Appendix<br />
77.2±4.5<br />
439±26<br />
Station MDΦ Classification Silt & clay Sand Gravel SDΦ SkΦ KΦ<br />
FRI1 2.49 Fine sand 1.3 96.5 2.2 0.52 -0.16 1.38<br />
FRI2 2.54 Fine sand 1.0 99.0 0.0 0.48 -0.03 1.11<br />
FRI3 2.43 Fine sand 0.9 98.7 0.4 0.44 -0.04 1.08<br />
FRIX2 2.35 Fine sand 2.0 98.0 0.0 0.44 0.09 1.10<br />
FRI4 2.49 Fine sand 0.9 98.3 0.9 0.42 -0.09 1.04<br />
FRIX1 2.44 Fine sand 2.2 97.8 0.0 0.42 -0.09 1.01<br />
FRI11 2.42 Fine sand 0.5 99.5 0.0 0.46 -0.05 1.14<br />
FRI24 2.43 Fine sand 1.4 98.4 0.1 0.47 -0.03 1.12<br />
FRI25 2.36 Fine sand 1.7 93.4 4.9 0.95 -0.41 2.42<br />
FRI27 2.49 Fine sand 1.4 98.6 0.0 0.42 0.01 1.01<br />
FRI10R 2.84 Fine sand 6.0 94.0 0.0 0.88 0.05 1.33<br />
MDΦ: Median diameter, SDΦ; Standarddeviation, SkΦ: Skewness, KΦ: Kurtosis<br />
Side 6
Frigg 2010 Appendix<br />
Side 7<br />
Table 2.1-2. Weightfaction and kumulative weight (KV), Frigg 2010<br />
FRI1 FRI11<br />
Diameter Ф Weight Weight KV Diameter Ф Weight Weight KV<br />
(µm) (g) (%) (%) (µm) (g) (%) (%)<br />
2000 -1 0.37 2.2 2.2 2000 -1 0.00 0.0 0.0<br />
1000 0 0.06 0.4 2.6 1000 0 0.08 0.6 0.6<br />
500 1 0.30 1.8 4.4 500 1 0.28 2.1 2.7<br />
355 1.5 0.30 1.8 6.2 355 1.5 0.35 2.6 5.4<br />
250 2 0.88 5.3 11.5 250 2 1.04 7.8 13.2<br />
180 2.5 6.54 39.3 50.8 180 2.5 5.84 44.0 57.2<br />
125 3 7.03 42.2 93.0 125 3 4.90 36.9 94.1<br />
90 3.5 0.70 4.2 97.2 90 3.5 0.50 3.8 97.9<br />
63 4 0.25 1.5 98.7 63 4 0.21 1.6 99.5<br />
Frigg 2010 Appendix<br />
Side 8<br />
FRIX2 FRI27<br />
Diameter Ф Weight Weight KV Diameter Ф Weight Weight KV<br />
(µm) (g) (%) (%) (µm) (g) (%) (%)<br />
2000 -1 0.00 0.0 0.0 2000 -1 0.00 0.0 0.0<br />
1000 0 0.00 0.0 0.0 1000 0 0.02 0.2 0.2<br />
500 1 0.05 0.5 0.5 500 1 0.07 0.6 0.7<br />
355 1.5 0.19 2.0 2.6 355 1.5 0.12 1.0 1.7<br />
250 2 1.22 13.0 15.6 250 2 0.72 6.0 7.7<br />
180 2.5 4.58 48.9 64.5 180 2.5 5.26 43.6 51.3<br />
125 3 2.78 29.7 94.2 125 3 5.07 42.0 93.3<br />
90 3.5 0.24 2.6 96.8 90 3.5 0.50 4.1 97.4<br />
63 4 0.12 1.3 98.0 63 4 0.14 1.2 98.6<br />
Table2.1-3. Total organic matter (TOM), Frigg 2010.<br />
Station ° / m TOM (%)<br />
FRI1 0.63<br />
FRI2 0.47<br />
FRI3 0.55<br />
FRIX2 0.76<br />
FRI4 0.67<br />
FRIX1 0.65<br />
FRI11 0.69<br />
FRI24 0.45<br />
FRI25 0.54<br />
FRI27 0.52<br />
FRI10R 0.93<br />
2.2 Chemical analysis<br />
Table2.2-1. Total hydrocarbons in sediments (THC),(mg/kg dry sediment), Frigg 2010<br />
Station ° / m Layer Grab#1 Grab#2 Grab#3 Average Stdev<br />
FRI1 0-1 cm 10.0 7.5 6.6 8.0 1.7<br />
FRI2 0-1 cm 2.5 2.2 8.4 4.3 3.5<br />
FRI3 0-1 cm 8.1 7.7 12.8 9.5 2.8<br />
FRI3 1-3 cm 14.6<br />
FRI3 3-6 cm 10.7<br />
FRIX2 0-1 cm 7.6 6.7 3.5 5.9 2.2<br />
FRI4 0-1 cm 5.9 6.2 5.6 5.9 0.3<br />
FRIX1 0-1 cm 11.1 9.4 13.3 11.3 1.9<br />
FRI11 0-1 cm 8.3 12.1 5.5 8.6 3.3<br />
FRI24 0-1 cm 4.4 5.0 3.6 4.3 0.7<br />
FRI25 0-1 cm 8.7 7.0 16.4 10.7 5.0<br />
FRI27 0-1 cm 2.6 8.0 2.7 4.4 3.1<br />
FRI10R 0-1 cm 4.2 3.7 3.9 4.0 0.3<br />
FRI10R 1-3 cm 4.4<br />
FRI10R 3-6 cm 3.8<br />
Frigg 2010 Appendix<br />
Side 9
Frigg 2010 Appendix<br />
Side 10<br />
Table 2.2-2. Sum PAH and NPD (mg/kg dry sediment), Frigg 2010<br />
Station ° / m Layer Grab#1 Grab#2 Grab#3 Average Stdev<br />
PAH<br />
FRI3 0-1 cm 0.208 0.074 0.144 0.142 0.067<br />
FRI3 1-3 cm 4.238<br />
FRI3 3-6 cm 0.182<br />
FRI10R 0-1 cm 0.046 0.041 0.048 0.045 0.003<br />
FRI10R 1-3 cm 0.048<br />
FRI10R 3-6 cm 0.064<br />
NPD<br />
FRI3 0-1 cm 0.10 0.06 0.07 0.08 0.02<br />
FRI3 1-3 cm 1.80<br />
FRI3 3-6 cm 0.09<br />
FRI10R 0-1 cm 0.01 0.01 0.02 0.01 0.00<br />
FRI10R 1-3 cm 0.01<br />
FRI10R 3-6 cm 0.02
Table 2.2-3. Individual distribution of PAH and NPD (µg/kg dry sediment) Frigg 2010<br />
Station FRI3<br />
Grab #1 #2 #3 #2 #2<br />
Layer (cm) 0-1 0-1 0-1 1-3 3-6<br />
PAH (µg/kg)<br />
Naftalene 1 1 2 8 < 1<br />
Acenaftylen < 1 < 1 < 1 1 < 1<br />
Acenaften 4 3 7 56 1<br />
Fluoren 7 3 7 110 1<br />
Fenantren 29 13 13 621 7<br />
Antracen 14 2 3 479 3<br />
Fluoranten 43 13 26 886 29<br />
Pyren 27 9 18 669 24<br />
Benzantracen 14 3 11 366 21<br />
Krysen/trifenylen 14 5 10 284 18<br />
Benzo(b/j/k)fluoranten 23 10 20 383 34<br />
Benzo(a)pyren 12 4 11 216 19<br />
Dibenzantracen 1 < 1 1 20 2<br />
Indeno(1,2,3)pyren 9 4 8 69 11<br />
Benzo(ghi)perylen 9 4 8 72 12<br />
Sum PAH 208 74 144 4238 182<br />
NPD (µg/kg)<br />
Naftalene 1 1 2 8 < 1<br />
C1-Naphtalene 2 2 3 8 1<br />
C2-Naphtalene 4 4 6 20 4<br />
C3-Naphtalene 10 19 23 47 28<br />
Fenantren 29 13 13 621 7<br />
Antracen 14 2 3 479 3<br />
C1-Fenantrene 12 7 6 247 11<br />
C2-Fenantrene 15 10 9 175 19<br />
C3-Fenantrene 6 3 3 60 9<br />
Dibenzoethiofen 2 1 1 52 1<br />
C1-Dibenzoethiofen 1 < 1 1 25 1<br />
C2-Dibenzoethiofen 4 1 2 30 4<br />
C3-Dibenzoethiofen 4 1 1 28 5<br />
Sum NPD 105 63 72 1798 92<br />
Frigg 2010 Appendix<br />
Side 11
Station FRI10R<br />
Grab #1 #2 #3 #1 #1<br />
Layer (cm) 0-1 0-1 0-1 1-3 3-6<br />
PAH (µg/kg)<br />
Naftalene < 1 < 1 < 1 < 1 < 1<br />
Acenaftylen < 1 < 1 < 1 < 1 < 1<br />
Acenaften < 1 < 1 < 1 < 1 < 1<br />
Fluoren < 1 < 1 < 1 < 1 < 1<br />
Fenantren 1 1 1 1 2<br />
Antracen < 1 < 1 < 1 < 1 < 1<br />
Fluoranten 2 2 2 2 3<br />
Pyren 2 1 1 1 2<br />
Benzantracen 1 1 1 1 1<br />
Krysen/trifenylen 2 2 2 2 3<br />
Benzo(b/j/k)fluoranten 13 12 13 13 17<br />
Benzo(a)pyren 2 2 2 2 3<br />
Dibenzantracen 1 1 1 1 2<br />
Indeno(1,2,3)pyren 9 8 10 10 14<br />
Benzo(ghi)perylen 11 10 12 12 16<br />
Sum PAH 46 41 48 48 64<br />
NPD (µg/kg)<br />
Naftalene < 1 < 1 < 1 < 1 < 1<br />
C1-Naphtalene 1 1 1 1 1<br />
C2-Naphtalene 2 2 3 2 4<br />
C3-Naphtalene 3 3 4 3 6<br />
Fenantren 1 1 1 1 2<br />
Antracen < 1 < 1 < 1 < 1 < 1<br />
C1-Fenantrene 1 1 1 1 2<br />
C2-Fenantrene 4 3 3 4 4<br />
C3-Fenantrene 1 1 1 1 2<br />
Dibenzoethiofen < 1 < 1 < 1 < 1 < 1<br />
C1-Dibenzoethiofen < 1 < 1 < 1 < 1 < 1<br />
C2-Dibenzoethiofen < 1 < 1 < 1 < 1 1<br />
C3-Dibenzoethiofen < 1 < 1 < 1 < 1 1<br />
Sum NPD 14 11 16 15 22<br />
Frigg 2010 Appendix<br />
Side 12
Table 2.2-4. Metals (mg/kg dry sediment), Frigg 2010.<br />
Stasjon °/m Prøve Ba Cd Cr Cu Hg Pb Zn<br />
FRI1 1 62 0,05 9.2 16.1 0.01 388 166<br />
2 105
3 54
Det Norske Veritas:<br />
Det Norske Veritas (DNV) is a leading, independent provider of services for managing risk with a global<br />
presence and a network of 300 offices in 100 different countries. DNV’s objective is to safeguard life,<br />
property and the environment.<br />
DNV assists its customers in managing risk by providing three categories of service: classification,<br />
certification and consultancy. Since establishment as an independent foundation in 1864, DNV has<br />
become an internationally recognised provider of technical and managerial consultancy services and<br />
one of the world’s leading classification societies. This means continuously developing new<br />
approaches to health, safety, quality and environmental management, so businesses can run smoothly<br />
in a world full of surprises.<br />
Global impact for a safe and sustainable future:<br />
Learn more on www.dnv.com