Incidence, Distribution and Characteristics of Major Tomato Leaf ...
Incidence, Distribution and Characteristics of Major Tomato Leaf ... Incidence, Distribution and Characteristics of Major Tomato Leaf ...
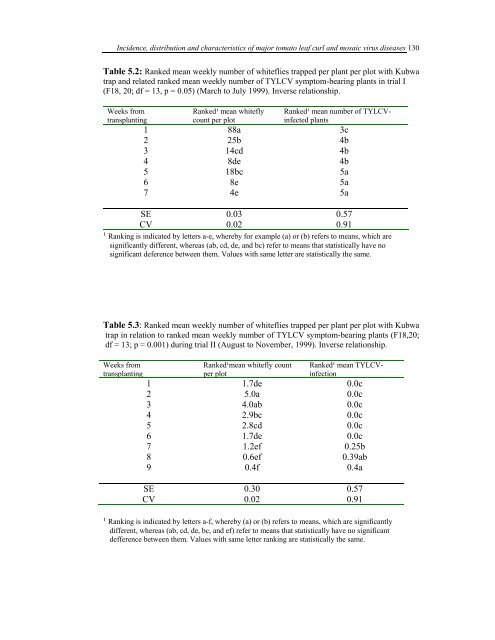
Incidence, distribution and characteristics of major tomato leaf curl and mosaic virus diseases 130 Table 5.2: Ranked mean weekly number of whiteflies trapped per plant per plot with Kubwa trap and related ranked mean weekly number of TYLCV symptom-bearing plants in trial I (F18, 20; df = 13, p = 0.05) (March to July 1999). Inverse relationship. Weeks from Ranked¹ mean whitefly Ranked¹ mean number of TYLCV- transplanting count per plot infected plants 1 88a 3c 2 25b 4b 3 14cd 4b 4 8de 4b 5 18bc 5a 6 8e 5a 7 4e 5a SE 0.03 0.57 CV 0.02 0.91 ¹ Ranking is indicated by letters a-e, whereby for example (a) or (b) refers to means, which are significantly different, whereas (ab, cd, de, and bc) refer to means that statistically have no significant deference between them. Values with same letter are statistically the same. Table 5.3: Ranked mean weekly number of whiteflies trapped per plant per plot with Kubwa trap in relation to ranked mean weekly number of TYLCV symptom-bearing plants (F18,20; df = 13; p = 0.001) during trial II (August to November, 1999). Inverse relationship. Weeks from transplanting Ranked¹mean whitefly count Ranked¹ mean TYLCV- per plot infection 1 1.7de 0.0c 2 5.0a 0.0c 3 4.0ab 0.0c 4 2.9bc 0.0c 5 2.8cd 0.0c 6 1.7de 0.0c 7 1.2ef 0.25b 8 0.6ef 0.39ab 9 0.4f 0.4a SE 0.30 0.57 CV 0.02 0.91 ¹ Ranking is indicated by letters a-f, whereby (a) or (b) refers to means, which are significantly different, whereas (ab, cd, de, bc, and ef) refer to means that statistically have no significant defference between them. Values with same letter ranking are statistically the same.
Incidence, distribution and characteristics of major tomato leaf curl and mosaic virus diseases 131 Table 5.4: Ranked mean weekly number of whiteflies trapped per plant per plot with Kubwa trap (f 1.25, p 0.0001) in relation to ranked mean weekly number of TYLCV symptom bearing plants (F 18,20; df = 13; p = 0.001) in trial III, (November 1999 to February 2000) Weeks from Ranked¹ mean whitefly Ranked¹ mean number TYLCV infected transplanting count per plot plants 1 3.7bc 0c 2 7.4a 0c 3 1.5bc 0c 4 5.3ab 0c 5 4.3ab 0c 6 3.3bc 0.1a 7 0.4c 0.3b 8 1.8bc 0.3b 9 1.6bc 0.3b SE 0.03 0.57 CV 0.02 0.91 ¹ Ranking is indicated by letters a-c, whereby (a), (b) or (c) refers to means, which are significantly different, whereas (ab and bc) refer to means that statistically have no significant difference between them. Values with same letter ranking are statistically not different. 5.3.2 Treatment-specific Whitefly Infestation and TYLCV Incidence With regard to the different treatment effects on whitefly infestation of tomato plants monitored using the Kubwa trap, there was no significant treatment effect on whitefly population in trial I, though plots with tomato-bean intercrop without insecticide application and those with tomato-bean intercrop combined with dimethoate had fewer whiteflies than tomato monocrop, tomato monocrop combined with uprooting, tomato monocrop combined with dimethoate, and tomato monocrop combined with uprooting and dimethoate. It was not clear whether Phaseolus beans in intercrop treatments could have acted as a whitefly trap crop in Trial I, II and III (Table 5.5), in which case beans would be preferred to tomato. Furthermore, during the first week after treatment application, whitefly populations in all treatments fell to a lower level than the one recorded at the start, except in plots where tomato was intercropped with beans and bean rows were sprayed with dimethoate, in which case whitefly populations rose but later dropped like in other plots. All treatments maintained whitefly populations below three whiteflies per
- Page 104 and 105: Incidence, distribution and charact
- Page 106 and 107: Isolate IG1 Incidence, distribution
- Page 108 and 109: Incidence, distribution and charact
- Page 110 and 111: Incidence, distribution and charact
- Page 112 and 113: 1600 500 700 200 Incidence, distrib
- Page 114 and 115: Incidence, distribution and charact
- Page 116 and 117: Incidence, distribution and charact
- Page 118 and 119: Incidence, distribution and charact
- Page 120 and 121: Incidence, distribution and charact
- Page 122 and 123: Incidence, distribution and charact
- Page 124 and 125: Incidence, distribution and charact
- Page 126 and 127: 1200 1200 (A) IG1 (ToLCV-UG) PAL1v
- Page 128 and 129: Incidence, distribution and charact
- Page 130 and 131: Incidence, distribution and charact
- Page 132 and 133: 78 Incidence, distribution and char
- Page 134 and 135: 87 87 Incidence, distribution and c
- Page 136 and 137: Incidence, distribution and charact
- Page 138 and 139: Incidence, distribution and charact
- Page 140 and 141: Incidence, distribution and charact
- Page 142 and 143: Incidence, distribution and charact
- Page 144 and 145: A A C D Incidence, distribution and
- Page 146 and 147: Opaque and not smeared Translucent
- Page 148 and 149: Incidence, distribution and charact
- Page 150 and 151: Incidence, distribution and charact
- Page 152 and 153: Rainfall (cm) Temp. Cº Mean Whitef
- Page 156 and 157: Incidence, distribution and charact
- Page 158 and 159: Incidence, distribution and charact
- Page 160 and 161: Incidence, distribution and charact
- Page 162 and 163: Incidence, distribution and charact
- Page 164 and 165: Incidence, distribution and charact
- Page 166 and 167: Incidence, distribution and charact
- Page 168 and 169: Incidence, distribution and charact
- Page 170 and 171: Incidence, distribution and charact
- Page 172 and 173: Incidence, distribution and charact
- Page 174 and 175: Incidence, distribution and charact
- Page 176 and 177: Incidence, distribution and charact
- Page 178 and 179: Incidence, distribution and charact
- Page 180 and 181: Incidence, distribution and charact
- Page 182 and 183: Incidence, distribution and charact
- Page 184 and 185: Incidence, distribution and charact
- Page 186 and 187: Incidence, distribution and charact
- Page 188 and 189: Incidence, distribution and charact
- Page 190 and 191: Incidence, distribution and charact
- Page 192 and 193: Incidence, distribution and charact
- Page 194 and 195: Incidence, distribution and charact
- Page 196 and 197: Incidence, distribution and charact
- Page 198 and 199: 8 ANNEXES Incidence, distribution a
- Page 200 and 201: Incidence, distribution and charact
- Page 202 and 203: Table A.1.1 continued Incidence, di
<strong>Incidence</strong>, distribution <strong>and</strong> characteristics <strong>of</strong> major tomato leaf curl <strong>and</strong> mosaic virus diseases 130<br />
Table 5.2: Ranked mean weekly number <strong>of</strong> whiteflies trapped per plant per plot with Kubwa<br />
trap <strong>and</strong> related ranked mean weekly number <strong>of</strong> TYLCV symptom-bearing plants in trial I<br />
(F18, 20; df = 13, p = 0.05) (March to July 1999). Inverse relationship.<br />
Weeks from<br />
Ranked¹ mean whitefly Ranked¹ mean number <strong>of</strong> TYLCV-<br />
transplanting<br />
count per plot<br />
infected plants<br />
1 88a 3c<br />
2 25b 4b<br />
3 14cd 4b<br />
4 8de 4b<br />
5 18bc 5a<br />
6 8e 5a<br />
7 4e 5a<br />
SE 0.03 0.57<br />
CV 0.02 0.91<br />
¹ Ranking is indicated by letters a-e, whereby for example (a) or (b) refers to means, which are<br />
significantly different, whereas (ab, cd, de, <strong>and</strong> bc) refer to means that statistically have no<br />
significant deference between them. Values with same letter are statistically the same.<br />
Table 5.3: Ranked mean weekly number <strong>of</strong> whiteflies trapped per plant per plot with Kubwa<br />
trap in relation to ranked mean weekly number <strong>of</strong> TYLCV symptom-bearing plants (F18,20;<br />
df = 13; p = 0.001) during trial II (August to November, 1999). Inverse relationship.<br />
Weeks from<br />
transplanting<br />
Ranked¹mean whitefly count Ranked¹ mean TYLCV-<br />
per plot<br />
infection<br />
1 1.7de 0.0c<br />
2 5.0a 0.0c<br />
3 4.0ab 0.0c<br />
4 2.9bc 0.0c<br />
5 2.8cd 0.0c<br />
6 1.7de 0.0c<br />
7 1.2ef 0.25b<br />
8 0.6ef 0.39ab<br />
9 0.4f 0.4a<br />
SE 0.30 0.57<br />
CV 0.02 0.91<br />
¹ Ranking is indicated by letters a-f, whereby (a) or (b) refers to means, which are significantly<br />
different, whereas (ab, cd, de, bc, <strong>and</strong> ef) refer to means that statistically have no significant<br />
defference between them. Values with same letter ranking are statistically the same.


