Tellurite And Fluorotellurite Glasses For Active And Passive
Tellurite And Fluorotellurite Glasses For Active And Passive Tellurite And Fluorotellurite Glasses For Active And Passive
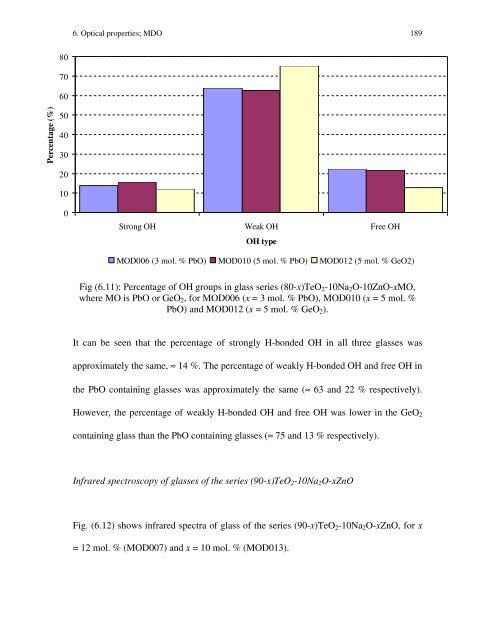
Percentage (%) 80 70 60 50 40 30 20 10 0 6. Optical properties; MDO 189 Strong OH Weak OH Free OH OH type MOD006 (3 mol. % PbO) MOD010 (5 mol. % PbO) MOD012 (5 mol. % GeO2) Fig (6.11): Percentage of OH groups in glass series (80-x)TeO2-10Na2O-10ZnO-xMO, where MO is PbO or GeO2, for MOD006 (x = 3 mol. % PbO), MOD010 (x = 5 mol. % PbO) and MOD012 (x = 5 mol. % GeO2). It can be seen that the percentage of strongly H-bonded OH in all three glasses was approximately the same, ≈ 14 %. The percentage of weakly H-bonded OH and free OH in the PbO containing glasses was approximately the same (≈ 63 and 22 % respectively). However, the percentage of weakly H-bonded OH and free OH was lower in the GeO2 containing glass than the PbO containing glasses (≈ 75 and 13 % respectively). Infrared spectroscopy of glasses of the series (90-x)TeO2-10Na2O-xZnO Fig. (6.12) shows infrared spectra of glass of the series (90-x)TeO2-10Na2O-xZnO, for x = 12 mol. % (MOD007) and x = 10 mol. % (MOD013).
6. Optical properties; MDO 190 Absorption coefficient / cm -1 2.00 1.75 1.50 1.25 1.00 0.75 0.50 0.25 0.00 Wavelength / µm 6 5 4 3 2 2000 3000 4000 5000 6000 Wavenumber / cm -1 (90-x)TeO 2 -xZnO-10Na 2 O MOD007 (12 mol. % ZnO) MOD013 (10 mol. % ZnO) Fig. (6.12): Infrared spectra of glass of the series (90-x)TeO2-10Na2O-xZnO, for x = 12 mol. % (MOD007) and x = 10 mol. % (MOD013). Again, the multiphonon edge for these glasses occurred at around 1667 cm -1 (6 µm) and hydroxide (OH) bands occurred at around 3000 cm -1 (3.33 µm) and 2270 cm -1 (4.41 µm). Fig. (6.13) shows the infrared spectra in the mid- and far-infrared regions for glasses of composition 80TeO2-10Na2O-10ZnO mol. %, performed on samples of varying thickness viz. 2.98, 0.50 and 0.20 mm. Due to the high extinction coefficients of fundamental absorption bands, thin samples were used to make these more distinguishable. 2000 1750 1500 1250 1000 750 500 250 0 Loss / dB.m -1
- Page 151 and 152: 5. Crystallisation studies; MDO 138
- Page 153 and 154: 5. Crystallisation studies; MDO 140
- Page 155 and 156: 5. Crystallisation studies; MDO 142
- Page 157 and 158: 5. Crystallisation studies; MDO 144
- Page 159 and 160: 5. Crystallisation studies; MDO 146
- Page 161 and 162: 5. Crystallisation studies; MDO 148
- Page 163 and 164: 5. Crystallisation studies; MDO 150
- Page 165 and 166: 5. Crystallisation studies; MDO 152
- Page 167 and 168: 5. Crystallisation studies; MDO 154
- Page 169 and 170: 5. Crystallisation studies; MDO 156
- Page 171 and 172: 5. Crystallisation studies; MDO 158
- Page 173 and 174: 5. Crystallisation studies; MDO 160
- Page 175 and 176: 5. Crystallisation studies; MDO 162
- Page 177 and 178: 5. Crystallisation studies; MDO 164
- Page 179 and 180: 6. Optical properties; MDO 166 75-5
- Page 181 and 182: 6. Optical properties; MDO 168 Fig.
- Page 183 and 184: 6. Optical properties; MDO 170 In r
- Page 185 and 186: 6. Optical properties; MDO 172 wher
- Page 187 and 188: 6. Optical properties; MDO 174 Fig.
- Page 189 and 190: 6. Optical properties; MDO 176 Abso
- Page 191 and 192: 6. Optical properties; MDO 178 ener
- Page 193 and 194: 6. Optical properties; MDO 180 6.1.
- Page 195 and 196: 6. Optical properties; MDO 182 ( n
- Page 197 and 198: 6. Optical properties; MDO 184 Abso
- Page 199 and 200: 6. Optical properties; MDO 186 %),
- Page 201: 6. Optical properties; MDO 188 Tabl
- Page 205 and 206: 6. Optical properties; MDO 192 Abso
- Page 207 and 208: 6. Optical properties; MDO 194 Abso
- Page 209 and 210: Percentage (%) 80 70 60 50 40 30 20
- Page 211 and 212: 6. Optical properties; MDO 198 Fig.
- Page 213 and 214: 6. Optical properties; MDO 200 Abso
- Page 215 and 216: 6. Optical properties; MDO 202 6.2.
- Page 217 and 218: 6. Optical properties; MDO 204 Loss
- Page 219 and 220: 6. Optical properties; MDO 206 Abso
- Page 221 and 222: 6. Optical properties; MDO 208 Tabl
- Page 223 and 224: 6. Optical properties; MDO 210 Abso
- Page 225 and 226: 6. Optical properties; MDO 212 Abso
- Page 227 and 228: 6. Optical properties; MDO 214 Loss
- Page 229 and 230: 6. Optical properties; MDO 216 6.2.
- Page 231 and 232: 6. Optical properties; MDO 218 Abso
- Page 233 and 234: 6. Optical properties; MDO 220 6.2.
- Page 235 and 236: Refractive index, n , at 632.8 nm 6
- Page 237 and 238: 6. Optical properties; MDO 224 6.3.
- Page 239 and 240: 6. Optical properties; MDO 226 Abso
- Page 241 and 242: 6. Optical properties; MDO 228 tell
- Page 243 and 244: 6. Optical properties; MDO 230 mole
- Page 245 and 246: 6. Optical properties; MDO 232 occu
- Page 247 and 248: 6. Optical properties; MDO 234 The
- Page 249 and 250: 6. Optical properties; MDO 236 addi
- Page 251 and 252: 6. Optical properties; MDO 238 an o
Percentage (%)<br />
80<br />
70<br />
60<br />
50<br />
40<br />
30<br />
20<br />
10<br />
0<br />
6. Optical properties; MDO 189<br />
Strong OH Weak OH Free OH<br />
OH type<br />
MOD006 (3 mol. % PbO) MOD010 (5 mol. % PbO) MOD012 (5 mol. % GeO2)<br />
Fig (6.11): Percentage of OH groups in glass series (80-x)TeO2-10Na2O-10ZnO-xMO,<br />
where MO is PbO or GeO2, for MOD006 (x = 3 mol. % PbO), MOD010 (x = 5 mol. %<br />
PbO) and MOD012 (x = 5 mol. % GeO2).<br />
It can be seen that the percentage of strongly H-bonded OH in all three glasses was<br />
approximately the same, ≈ 14 %. The percentage of weakly H-bonded OH and free OH in<br />
the PbO containing glasses was approximately the same (≈ 63 and 22 % respectively).<br />
However, the percentage of weakly H-bonded OH and free OH was lower in the GeO2<br />
containing glass than the PbO containing glasses (≈ 75 and 13 % respectively).<br />
Infrared spectroscopy of glasses of the series (90-x)TeO2-10Na2O-xZnO<br />
Fig. (6.12) shows infrared spectra of glass of the series (90-x)TeO2-10Na2O-xZnO, for x<br />
= 12 mol. % (MOD007) and x = 10 mol. % (MOD013).


