Analysis and modelling of the seismic behaviour of high ... - Ingegneria
Analysis and modelling of the seismic behaviour of high ... - Ingegneria
Analysis and modelling of the seismic behaviour of high ... - Ingegneria

Create successful ePaper yourself
Turn your PDF publications into a flip-book with our unique Google optimized e-Paper software.
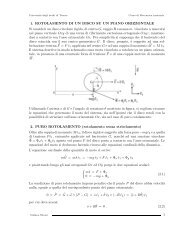
3. SEISMIC BEHAVIOUR OF BOLTED END PLATE BEAM-TO-COLUMN STEEL JOINTS<br />
56<br />
M col,t<br />
Vcol,t<br />
f<br />
f<br />
c<br />
N<br />
N<br />
col,b<br />
V<br />
col,t<br />
col,b<br />
M col,b<br />
b<br />
V beam<br />
M beam<br />
N beam<br />
Figure 3.8. Definition <strong>of</strong> rotations for a Complete<br />
Joint<br />
3.4.4 Testing procedure<br />
Predefined representative displacement histories are usually applied in order to<br />
characterize <strong>the</strong> <strong>behaviour</strong> <strong>of</strong> specimens under hysteretic loading. The problem <strong>of</strong><br />
<strong>the</strong> displacement pattern arises especially under <strong>seismic</strong> loading, as unique fatigue<br />
relationships are strictly valid only for constant-amplitude displacement reversals.<br />
Real structures, however, seldom conform to this ideal as <strong>the</strong>y can be subjected to<br />
multitude <strong>of</strong> displacement patterns <strong>of</strong> varying degrees <strong>of</strong> complexity. In <strong>the</strong>se<br />
instances, probability-density curves able to characterize r<strong>and</strong>om-amplitude<br />
displacements should be employed. In order to reduce <strong>the</strong> problem complexity, a<br />
heuristic approach is adopted in this study, applying to <strong>the</strong> specimens several<br />
displacement histories lying between <strong>the</strong> extremes <strong>of</strong> constant-amplitude <strong>and</strong><br />
r<strong>and</strong>om-amplitude displacement reversals.<br />
In order to define conveniently displacement patterns, a conventional elastic limit<br />
+ +<br />
state characterized by <strong>the</strong> displacement ey <strong>and</strong> <strong>the</strong> corresponding force Fy can be<br />
defined on <strong>the</strong> first part <strong>of</strong> each non-linear response envelope obtained from<br />
monotonic tests as depicted in Figure 3.9, schematically. The tri-linear<br />
approximation <strong>of</strong> each curve, is determined on <strong>the</strong> basis <strong>of</strong> best-fitting <strong>and</strong> <strong>of</strong> <strong>the</strong><br />
equivalence <strong>of</strong> <strong>the</strong> dissipated energy between <strong>the</strong> actual non-linear response <strong>and</strong><br />
+ +<br />
<strong>the</strong> idealized tri-linear approximation up to (emax , Fmax ). Then, <strong>the</strong> linear elastic<br />
+ +<br />
response with slope Ke <strong>and</strong> <strong>the</strong> linear strain-hardening response with slope Kh