Analysis and modelling of the seismic behaviour of high ... - Ingegneria
Analysis and modelling of the seismic behaviour of high ... - Ingegneria
Analysis and modelling of the seismic behaviour of high ... - Ingegneria

Create successful ePaper yourself
Turn your PDF publications into a flip-book with our unique Google optimized e-Paper software.
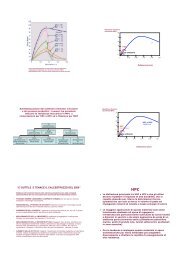
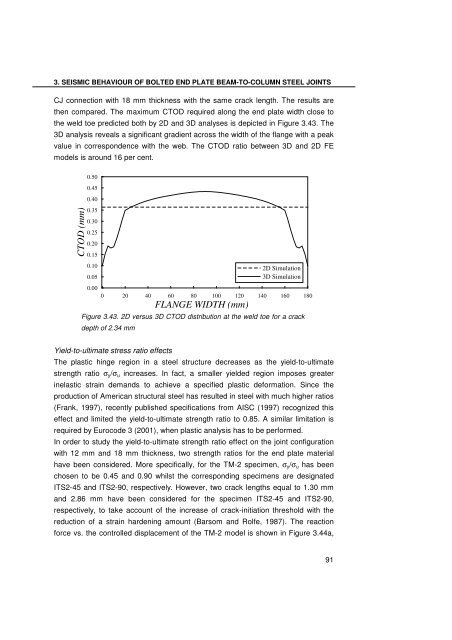
3. SEISMIC BEHAVIOUR OF BOLTED END PLATE BEAM-TO-COLUMN STEEL JOINTS<br />
CJ connection with 18 mm thickness with <strong>the</strong> same crack length. The results are<br />
<strong>the</strong>n compared. The maximum CTOD required along <strong>the</strong> end plate width close to<br />
<strong>the</strong> weld toe predicted both by 2D <strong>and</strong> 3D analyses is depicted in Figure 3.43. The<br />
3D analysis reveals a significant gradient across <strong>the</strong> width <strong>of</strong> <strong>the</strong> flange with a peak<br />
value in correspondence with <strong>the</strong> web. The CTOD ratio between 3D <strong>and</strong> 2D FE<br />
models is around 16 per cent.<br />
CTOD (mm)<br />
0.50<br />
0.45<br />
0.40<br />
0.35<br />
0.30<br />
0.25<br />
0.20<br />
0.15<br />
0.10<br />
0.05<br />
0.00<br />
2D Simulation<br />
3D Simulation<br />
0 20 40 60 80 100 120 140 160 180<br />
FLANGE WIDTH (mm)<br />
Figure 3.43. 2D versus 3D CTOD distribution at <strong>the</strong> weld toe for a crack<br />
depth <strong>of</strong> 2.34 mm<br />
Yield-to-ultimate stress ratio effects<br />
The plastic hinge region in a steel structure decreases as <strong>the</strong> yield-to-ultimate<br />
strength ratio σy/σu increases. In fact, a smaller yielded region imposes greater<br />
inelastic strain dem<strong>and</strong>s to achieve a specified plastic deformation. Since <strong>the</strong><br />
production <strong>of</strong> American structural steel has resulted in steel with much <strong>high</strong>er ratios<br />
(Frank, 1997), recently published specifications from AISC (1997) recognized this<br />
effect <strong>and</strong> limited <strong>the</strong> yield-to-ultimate strength ratio to 0.85. A similar limitation is<br />
required by Eurocode 3 (2001), when plastic analysis has to be performed.<br />
In order to study <strong>the</strong> yield-to-ultimate strength ratio effect on <strong>the</strong> joint configuration<br />
with 12 mm <strong>and</strong> 18 mm thickness, two strength ratios for <strong>the</strong> end plate material<br />
have been considered. More specifically, for <strong>the</strong> TM-2 specimen, σy/σu has been<br />
chosen to be 0.45 <strong>and</strong> 0.90 whilst <strong>the</strong> corresponding specimens are designated<br />
ITS2-45 <strong>and</strong> ITS2-90, respectively. However, two crack lengths equal to 1.30 mm<br />
<strong>and</strong> 2.86 mm have been considered for <strong>the</strong> specimen ITS2-45 <strong>and</strong> ITS2-90,<br />
respectively, to take account <strong>of</strong> <strong>the</strong> increase <strong>of</strong> crack-initiation threshold with <strong>the</strong><br />
reduction <strong>of</strong> a strain hardening amount (Barsom <strong>and</strong> Rolfe, 1987). The reaction<br />
force vs. <strong>the</strong> controlled displacement <strong>of</strong> <strong>the</strong> TM-2 model is shown in Figure 3.44a,<br />
91