Analysis and modelling of the seismic behaviour of high ... - Ingegneria
Analysis and modelling of the seismic behaviour of high ... - Ingegneria
Analysis and modelling of the seismic behaviour of high ... - Ingegneria

You also want an ePaper? Increase the reach of your titles
YUMPU automatically turns print PDFs into web optimized ePapers that Google loves.
3. SEISMIC BEHAVIOUR OF BOLTED END PLATE BEAM-TO-COLUMN STEEL JOINTS<br />
2 p p<br />
εij εij<br />
3<br />
PEEQ Index = ( 3.17 )<br />
ε<br />
where ij are <strong>the</strong> plastic strain components.<br />
y<br />
The triaxiality ratio <strong>and</strong> PEEQ index are also computed at different locations <strong>of</strong> <strong>the</strong><br />
connection to provide additional means <strong>of</strong> comparing <strong>the</strong> analyzed connection<br />
configurations. The locations determined to have <strong>the</strong> <strong>high</strong>est fracture potential in<br />
<strong>the</strong> different analyzed configurations are in <strong>the</strong> weld toe region, near <strong>the</strong> interface<br />
<strong>of</strong> <strong>the</strong> weld metal <strong>and</strong> base metal.<br />
Weld matching effects<br />
Analyses with different weld matching conditions were carried out to investigate <strong>the</strong><br />
joint response in terms <strong>of</strong> toughness dem<strong>and</strong>. In detail, two models have been<br />
analysed: <strong>the</strong> first with overmatching welds characterized by mechanical properties<br />
very close to those <strong>of</strong> <strong>the</strong> experimental specimens; <strong>the</strong> second with matching<br />
welds in which <strong>the</strong> mechanical properties <strong>of</strong> welds are equal to those <strong>of</strong> <strong>the</strong> end<br />
plate material. Analyses with this different weld-matching conditions were carried<br />
out for:<br />
• <strong>the</strong> TM-2 specimens. The Tee stub models are designated ITS2-1 <strong>and</strong> ITS2-2,<br />
respectively, <strong>and</strong> <strong>the</strong> corresponding mechanical properties are collected in<br />
Table 3.8. A crack length equal to 1.30 mm has been considered in order to<br />
maximize <strong>the</strong> effect <strong>of</strong> residual stresses when included.<br />
• <strong>the</strong> TM-3 specimens. The Tee stub models are designated ITS3-1 <strong>and</strong> ITS3-2,<br />
respectively, <strong>and</strong> <strong>the</strong> corresponding mechanical properties are collected in<br />
Table 3.8. A crack length equal to 2.34 mm has been considered in order to<br />
maximize <strong>the</strong> effect <strong>of</strong> residual stresses when included.<br />
• <strong>the</strong> JB1-3 specimen. The CJ models are designated CJ3-1 <strong>and</strong> CJ3-2,<br />
respectively, <strong>and</strong> <strong>the</strong> corresponding mechanical properties are collected in<br />
Table 3.8. The same crack length <strong>of</strong> <strong>the</strong> TM3 specimen, equal to 2.34 mm, has<br />
been considered.<br />
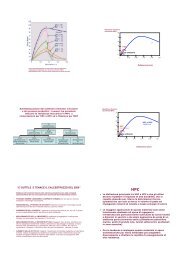
For brevity, only <strong>the</strong> results <strong>of</strong> one specimen will be illustrated. The reaction force<br />
vs. <strong>the</strong> applied displacement for <strong>the</strong> TM-3 specimen is reported in Figure 3.39a.<br />
However differently from <strong>the</strong> overall <strong>behaviour</strong>, <strong>the</strong> corresponding CTOD dem<strong>and</strong>s<br />
are similar until a total displacement <strong>of</strong> 0.35 mm (see Figure 3.39b), from which <strong>the</strong><br />
CTOD dem<strong>and</strong> increases rapidly for <strong>the</strong> ITS3-1.<br />
87