Geological Survey of Finland, Special Paper 46 - arkisto.gsf.fi
Geological Survey of Finland, Special Paper 46 - arkisto.gsf.fi
Geological Survey of Finland, Special Paper 46 - arkisto.gsf.fi

You also want an ePaper? Increase the reach of your titles
YUMPU automatically turns print PDFs into web optimized ePapers that Google loves.
GEOLOGICAL SURVEY OF FINLAND<br />
<strong>Special</strong> <strong>Paper</strong> <strong>46</strong><br />
2007<br />
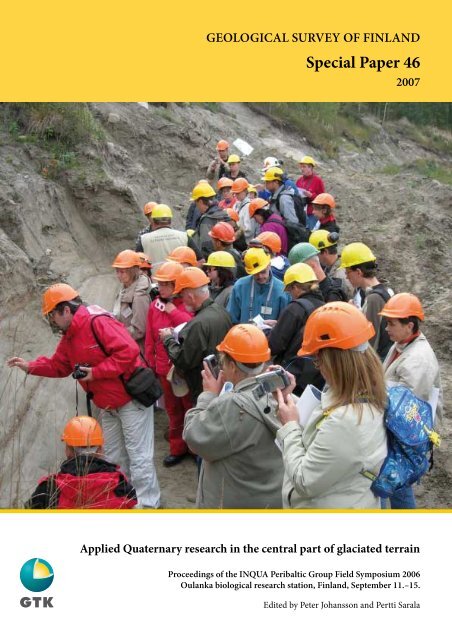
Applied Quaternary research in the central part <strong>of</strong> glaciated terrain<br />
Proceedings <strong>of</strong> the INQUA Peribaltic Group Field Symposium 2006<br />
Oulanka biological research station, <strong>Finland</strong>, September 11.–15.<br />
Edited by Peter Johansson and Pertti Sarala
<strong>Geological</strong> <strong>Survey</strong> <strong>of</strong> <strong>Finland</strong>, <strong>Special</strong> <strong>Paper</strong> <strong>46</strong><br />
Applied Quaternary research in the central part <strong>of</strong><br />
glaciated terrain<br />
Proceedings <strong>of</strong> the INQUA Peribaltic Group Field Symposium 2006<br />
Oulanka biological research station, <strong>Finland</strong>, September 11.–15.<br />
Edited by<br />
Peter Johansson and Pertti Sarala<br />
<strong>Geological</strong> <strong>Survey</strong> <strong>of</strong> <strong>Finland</strong><br />
Espoo 2007
Johansson, P. & Sarala, P. (eds.) 2007. Applied Quaternary research<br />
in the central part <strong>of</strong> glaciated terrain. <strong>Geological</strong> <strong>Survey</strong><br />
<strong>of</strong> <strong>Finland</strong>, <strong>Special</strong> <strong>Paper</strong> <strong>46</strong>, 161 pages, 100 <strong>fi</strong> gures, 7 tables.<br />
The INQUA Peribaltic Group Field Symposium was held in September<br />
11.–15.2006 in the central and northern part <strong>of</strong> <strong>Finland</strong>.<br />
Topics related to Late Pleistocene glaciogenic deposits in the<br />
central part <strong>of</strong> the Scandinavian ice sheet were discussed during<br />
the excursions and meeting. This publication contains 21 peer-reviewed<br />
papers that are based on the oral and poster presentations<br />
given at the symposium. The papers represent a wide range <strong>of</strong><br />
recent Quaternary research achievements in the glaciated areas<br />
<strong>of</strong> northern Europe, America and Antarctica.<br />
The <strong>fi</strong> rst paper by Sarala gives a general presentation <strong>of</strong> the<br />
glacial stratigraphy and characteristics <strong>of</strong> southern Lapland and<br />
Koillismaa in <strong>Finland</strong>. In the next papers Yevzerov et al. and Korsakova<br />
& Kolka present results relating to deglaciation history in<br />
the Kola Peninsula. Depositional conditions and deposits <strong>of</strong> the<br />
last deglaciation are also discussed in the papers by Karmaziene .<br />
et al. and Baltr0nas et al. for the northern and southern parts <strong>of</strong><br />
Lithuania respectively.<br />
In the next papers the subglacial hydrography and drainage <strong>of</strong><br />
the melting phase are discussed. The paper by Johansson deals<br />
with meltwater action and deposits in northern <strong>Finland</strong>. In the<br />
papers by Sutinen et al. and Rattas the development <strong>of</strong> subglacial<br />
drainage systems and the related deposits are presented. Subglacial<br />
tunnel valleys and their sedimentation are introduced by<br />
Kehew & Kozlowski.<br />
In the paper by Hang et al. varved clay studies in proglacial<br />
sedimentary environment in western Estonia are presented. Studies<br />
<strong>of</strong> buried organic sediments in the glaciolacustrine/-marine<br />
environment in Estonia are discussed by Saarse et al. In the second<br />
paper by Sutinen et al. macr<strong>of</strong>ossils relating to the birch-pinespruce<br />
succession in western Finnish Lapland have been studied.<br />
Sharapova & Semenova and Bolikhovskaya & Molodkov have<br />
done pollen investigations for palaeoenvironmental reconstruction<br />
in Kola Peninsula and Estonia. In the paper by Gyllencreutz<br />
et al. a new GIS-based reconstruction and dating database are<br />
presented.<br />
Seismotectonic events in Lapland are discussed in the third<br />
paper <strong>of</strong> Sutinen et al. and in Kola region in the paper <strong>of</strong> Yevzerov<br />
& Nikolaeva. An example <strong>of</strong> the applied use <strong>of</strong> geophysical<br />
methods in the study <strong>of</strong> lithology and hydraulic properties <strong>of</strong> tills<br />
is given in the fourth paper <strong>of</strong> Sutinen et al. In the last papers, the<br />
urban geology <strong>of</strong> Tartu in Estonia is discussed by Kalm, and in<br />
southern <strong>Finland</strong> by Ojala and Palmu and morphotectonic investigations<br />
<strong>of</strong> the Antarctic by Lastochkin & Krotova-Putintseva.
Key words (GeoRef Thesaurus, AGI): glacial geology, deglaciation,<br />
meltwater channel, glacial features, sediments, paleobotany,<br />
Quaternary, symposia.<br />
Peter Johansson and Pertti Sarala<br />
<strong>Geological</strong> <strong>Survey</strong> <strong>of</strong> <strong>Finland</strong><br />
P.O. Box 77, FI-96101 Rovaniemi, FINLAND<br />
E-mail: peter.johansson@gtk.<strong>fi</strong> , pertti.sarala@gtk.<strong>fi</strong><br />
ISBN 978-952-217-006-4 (paperback)<br />
ISBN 978-952-217-021-7 (PDF)<br />
ISSN 0782-8535<br />
3
4<br />
CONTENTS<br />
Preface, Peter Johansson & Pertti Sarala .................................................................................................... 6<br />
Glacial morphology and ice lobation in southern Finnish Lapland, Pertti Sarala ....................................... 9<br />
Deglaciation <strong>of</strong> the Rybachi and Sredni Peninsulas in the Late Pleistocene, northwest<br />
Russia, Vladimir Yevzerov, Jakob Møller, Vasili Kolka & Ge<strong>of</strong>frey Corner ............................................... 19<br />
Landscape and geological features <strong>of</strong> tectonic zones in the Khibiny Mountains, Kola Peninsula,<br />
NW Russia, Olga Korsakova & Vasili Kolka ............................................................................................. 25<br />
Structural characteristics <strong>of</strong> Pleistocene deposits in North Lithuania, Danguole . Karmaziene . ,<br />
Bronislavas Karmaza & Valentinas Baltr0nas ........................................................................................... 31<br />
Periglacial conditions and deglaciation in Southern Lithuania during the Last Ice Age,<br />
Valentinas Baltr0nas, K´stutis Švedas & Violeta Pukelyte . ........................................................................ 39<br />
Late Weichselian deglaciation in Finnish Lapland, Peter Johansson ......................................................... 47<br />
Late Weichselian sheetfl ow drainage <strong>of</strong> subglacial Lokka ice lake, Raimo Sutinen, Mari Jakonen,<br />
Pauliina Liwata & Eija Hyvönen ................................................................................................................ 55<br />
Spatial distribution and morphological aspects <strong>of</strong> eskers and bedrock valleys in north Estonia:<br />
implications for the reconstruction <strong>of</strong> a subglacial drainage system under the Late Weichselian<br />
Baltic Ice Stream, Maris Rattas .................................................................................................................. 63<br />
Tunnel Channels <strong>of</strong> the Saginaw Lobe, Michigan, USA, Alan E. Kehew & Andrew L. Kozlowski ........... 69<br />
Proglacial sedimentary environment in Pärnu area, western Estonia as derived from the varved<br />
clay studies, Tiit Hang, Peeter Talviste, Raul Reinson & Marko Kohv ...................................................... 79<br />
Buried organic sediments in Estonia related to the Ancylus Lake and Litorina Sea, Leili Saarse,<br />
Jüri Vassiljev, Avo Miidel & Eve Niinemets ............................................................................................... 87<br />
Macr<strong>of</strong>ossil evidence dispute ubiquitous birch-pine-spruce succession in western Finnish Lapland,<br />
Raimo Sutinen, Ilkka Aro, Hannu Herva, Tapio Muurinen, Matti Piekkari & Mauri Timonen .................. 93<br />
Pollen diagram <strong>of</strong> the Late Pleistocene interstadial deposits from the Kola Peninsula, Russia,<br />
Alla Sharapova & Ljudmila Semenova ....................................................................................................... 99<br />
Pollen and IR-OSL evidence for palaeoenvironmental changes between ca 39 kyr to ca 33 kyr<br />
BP recorded in the Voka key section, NE Estonia, Natalia S. Bolikhovskaya & Anatoly N. Molodkov ... 103<br />
DATED – A GIS-based Reconstruction and dating Database <strong>of</strong> the Eurasian Deglaciation,<br />
Richard Gyllencreutz, Jan Mangerud, John-Inge Svendsen & Øystein Lohne ..........................................113
Time-transgressive evolution <strong>of</strong> landslides possibly induced by seismotectonic events<br />
in Lapland, Raimo Sutinen, Matti Piekkari & Pauliina Liwata ................................................................ 121<br />
<strong>Geological</strong> evidence <strong>of</strong> the seismicity in the Kola region during the Late Pleistocene and Holocene,<br />
Vladimir Yevzerov & Svetlana Nikolaeva ................................................................................................. 129<br />
Lithological contribution to hydraulic properties <strong>of</strong> tills: inter-seasonal dielectric assessment,<br />
Raimo Sutinen, Matti Piekkari, Aki Tepsa, Markku Virtanen & Pekka Hänninen .................................... 135<br />
The urban geology <strong>of</strong> Tartu, Estonia, Volli Kalm ...................................................................................... 141<br />
Sedimentological characteristics <strong>of</strong> the Late Weichselian – Holocene deposits <strong>of</strong> the Suurpelto<br />
area in Espoo, southern <strong>Finland</strong>, Antti E. K. Ojala & Jukka-Pekka Palmu .............................................. 147<br />
Morphotectonic investigations <strong>of</strong> the Antarctic, Alexander N. Lastochkin & Alexandra<br />
Y. Krotova-Putintseva ............................................................................................................................... 157<br />
Front cover: The excursion participants at the Hitura open pit.<br />
5
<strong>Geological</strong> <strong>Survey</strong> <strong>of</strong> <strong>Finland</strong>, <strong>Special</strong> <strong>Paper</strong> <strong>46</strong><br />
Peter Johansson and Pertti Sarala<br />
The Peribaltic Group is an INQUA (International<br />
Union for Quaternary Research) research group,<br />
bringing together ice age researchers from countries<br />
around the Baltic Sea. It is one <strong>of</strong> the most active<br />
working groups <strong>of</strong> INQUA’s commission meeting<br />
regularly once a year for over ten years now. The<br />
aim <strong>of</strong> the working group is to enhance the research<br />
co-operation between the countries around the Baltic<br />
Sea and to create contacts between researchers<br />
in different countries. Its most crucial concrete tasks<br />
are to compile a comprehensive <strong>fi</strong> le on glacial fl ow<br />
patterns and a GIS-based map database <strong>of</strong> late-glacial<br />
ice-dammed lakes and marginal meltwater fl ow<br />
systems.<br />
The 2006 meeting <strong>of</strong> the working group took<br />
place from 11 th to 15 th September in <strong>Finland</strong>, having<br />
a lecture-day in 13 th September at the Oulanka<br />
research station in Kuusamo, which belongs to Oulu<br />
University. All in all, 43 researchers (Fig. 1) from<br />
eight different countries came together to give lectures,<br />
discuss and share the latest research results<br />
about climate changes during the Weichselian Ice<br />
Age, the movement <strong>of</strong> glaciers, the morphological<br />
features they created and the development <strong>of</strong> the<br />
vegetation. Many lectures proposed the theory that<br />
the Weichselian Ice Age was characterised by very<br />
short glacial phases and that the phases without ice<br />
6<br />
PREFACE<br />
were much longer than previously thought. The<br />
new information is based on new, more accurate<br />
age determination methods and a tighter sample<br />
network. The results <strong>of</strong> recent new applications in<br />
geophysical working methods applied in Quaternary<br />
research were also introduced. The occurrence and<br />
fl ow patterns <strong>of</strong> glaciers <strong>of</strong> the Early and Middle<br />
Weichselian glaciation stages, however, remained<br />
open questions.<br />
The meeting included a four-day-excursion to<br />
northern and central Ostrobothnia and southern<br />
Lapland, with the theme <strong>of</strong> ‘glacial morphology in<br />
the central part <strong>of</strong> the Scandinavian ice sheet – stratigraphic<br />
and postglacial development’. Besides the<br />
key stratigraphical points in Ostrobothnia and southwest<br />
Lapland, the participants also visited Koillismaa<br />
and southern Lapland, where the glacial dynamics<br />
and the circumstances <strong>of</strong> the glacigenic deposits in<br />
the last deglaciation stage are visible. The <strong>Geological</strong><br />
<strong>Survey</strong> <strong>of</strong> <strong>Finland</strong> and the University <strong>of</strong> Oulu’s<br />
Institute <strong>of</strong> Geosciences had organised the meeting<br />
and excursion. The Finnish National Committee for<br />
Quaternary Research, the University <strong>of</strong> Helsinki’s<br />
Department <strong>of</strong> Geology, the Peribaltic Group and the<br />
University <strong>of</strong> Oulu’s Thule Institute also participated<br />
in organising the event.<br />
At the meeting, 48 lectures were given, 17 <strong>of</strong><br />
Fig. 1. A group shot <strong>of</strong> the participants at the 2006 INQUA Peribaltic Group Meeting at the Hirvas pothole in Rovaniemi.
which were speeches and 31 poster presentations.<br />
This publication contains the written and revised<br />
abstracts <strong>of</strong> 21 lectures. The abstracts were reviewed<br />
by Pr<strong>of</strong>essors Matti Eronen, Juha-Pekka Lunkka,<br />
Matti Räsänen and Veli-Pekka Salonen, and Doctors<br />
Heikki Hirvas and Antti Ojala. Their contribution is<br />
gratefully acknowledged. Doctors Peter Johansson<br />
and Pertti Sarala served as the reviewers and editors<br />
<strong>of</strong> this publication. Mrs Carrie Turunen kindly revised<br />
the language <strong>of</strong> many articles in this publica-<br />
<strong>Geological</strong> <strong>Survey</strong> <strong>of</strong> <strong>Finland</strong>, <strong>Special</strong> <strong>Paper</strong> <strong>46</strong><br />
Applied Quaternary research in the central part <strong>of</strong> glaciated terrain<br />
tion. Finally, the editors express their special gratitude<br />
to the <strong>Geological</strong> <strong>Survey</strong> <strong>of</strong> <strong>Finland</strong> (GTK) for<br />
supporting the publication <strong>of</strong> the workshop papers<br />
in this GTK <strong>Special</strong> <strong>Paper</strong>, volume <strong>46</strong>. Abstracts<br />
<strong>of</strong> the lectures and excursion guide have also been<br />
published on GTK’s website: http://info.<strong>gsf</strong>.<strong>fi</strong> /info/<br />
julkaisuluettelo.html under: Erikoisjulkaisut – Miscellaneous<br />
publications, numbers 55 and 56.<br />
Peter Johansson and Pertti Sarala,<br />
Rovaniemi 10.8.2007<br />
7
Applied Quaternary research in the central part <strong>of</strong> glaciated terrain,<br />
edited by Peter Johansson and Pertti Sarala.<br />
<strong>Geological</strong> <strong>Survey</strong> <strong>of</strong> <strong>Finland</strong>, <strong>Special</strong> <strong>Paper</strong> <strong>46</strong>, 9–18, 2007.<br />
GLACIAL MORPHOLOGY AND ICE LOBATION IN<br />
SOUTHERN FINNISH LAPLAND<br />
by<br />
Pertti Sarala 1<br />
Sarala, P. 2007. Glacial morphology and ice lobation in southern<br />
Finnish Lapland. Applied Quaternary research in the central part<br />
<strong>of</strong> glaciated terrain. <strong>Geological</strong> <strong>Survey</strong> <strong>of</strong> <strong>Finland</strong>, <strong>Special</strong> <strong>Paper</strong><br />
<strong>46</strong>, 9–18, 7 <strong>fi</strong> gures.<br />
The development <strong>of</strong> active-ice landforms from drumlins and<br />
fl utings to ribbed moraines in the Kuusamo area ice-lobe indicates<br />
changing basal conditions <strong>of</strong> the glacier during the Late<br />
Weichselian deglaciation in southern Finnish Lapland. The large<br />
Kuusamo drumlin <strong>fi</strong> eld in the eastern part <strong>of</strong> the Kuusamo icelobe<br />
refl ects warm-based glacial conditions at the marginal part<br />
<strong>of</strong> the glacier while at the same time the central part <strong>of</strong> the lobe<br />
remained cold-based. Ribbed moraine morphology is common in<br />
the central and western parts <strong>of</strong> the Kuusamo ice-lobe.<br />
The formation <strong>of</strong> ribbed moraines is closely related to the<br />
retreating boundary <strong>of</strong> cold- and warm-based glacier, in an internal<br />
part <strong>of</strong> the glacier margin during deglaciation.<br />
The development <strong>of</strong> glacial landforms indicates fast fl owing<br />
or even a surging type ice stream during deglaciation. A rapid<br />
climate warming at the end <strong>of</strong> the Younger Dryas has increased<br />
marginal and surface melting in the marginal parts <strong>of</strong> the icesheet.<br />
Simultaneously, the increase <strong>of</strong> snow accumulation in the<br />
central part <strong>of</strong> the ice lobe has caused an imbalance between the<br />
mass <strong>of</strong> the glacier’s centre and the margin, which led to a fast<br />
movement <strong>of</strong> ice towards the margin.<br />
Key words (GeoRef Thesaurus, AGI): glacial geology, glacial<br />
features, drumlins, ribbed moraines, deglaciation, glacial lobes,<br />
subglacial environment, Weichselian, Kuusamo, Ranua, <strong>Finland</strong>.<br />
1 <strong>Geological</strong> <strong>Survey</strong> <strong>of</strong> <strong>Finland</strong>, P.O. Box 77, FI-96101<br />
Rovaniemi, <strong>Finland</strong><br />
E-mail: pertti.sarala@gtk.<strong>fi</strong><br />
9
<strong>Geological</strong> <strong>Survey</strong> <strong>of</strong> <strong>Finland</strong>, <strong>Special</strong> <strong>Paper</strong> <strong>46</strong><br />
Pertti Sarala<br />
Glacial landforms have been successfully used to<br />
reconstruct glacier dynamics and lobe formation<br />
during the last decades. An interpretation <strong>of</strong> glacial<br />
morphology based on aerial photos and satellite<br />
images, <strong>of</strong> which the latter have been in use since<br />
the 1980’s, from the entire glaciated terrain <strong>of</strong> the<br />
Northern Hemisphere. Active-ice landforms like<br />
drumlins and fl utings are mainly associated with<br />
the warm-based subglacial conditions and indicate<br />
deposition in the marginal parts <strong>of</strong> actively moving<br />
ice-lobes (e.g. Aario 1990). The reconstruction<br />
<strong>of</strong> glacial processes and glacial dynamics has also<br />
been done in the central part <strong>of</strong> continental glaciers<br />
in Scandinavia and North America (e.g. Clark 1997,<br />
Punkari 1997, Kleman et al. 1997, Hättestrand 1997,<br />
Kleman & Hättestrand 1999, Sarala 2005a). The<br />
studies were mainly based on the use <strong>of</strong> subglacial<br />
transversal moraine formations like ribbed moraines<br />
and Veiki moraines with streamlined features (e.g.<br />
Hättestrand 1997).<br />
Southern Finnish Lapland has been repeatedly<br />
situated in the central region <strong>of</strong> the last Scandinavian<br />
glaciation. Investigations for Quaternary geomor-<br />
10<br />
INTRODUCTION<br />
phology, sedimentology and stratigraphy have been<br />
done in many phases from the 1960’s to present day<br />
in the area (e.g. Korpela 1969, Aario 1977, Kurimo<br />
1977, Aario & Forsström 1979, Sutinen 1984, 1992,<br />
Aario 1990, Aario et al. 1997, Sarala et al. 1998,<br />
Sarala 2005a, b and c, Sarala 2006, Sarala et al.<br />
2006). Studies were based on aerial photo interpretation,<br />
digital elevation models and test pit surveys<br />
together with analysis <strong>of</strong> spatial indicators <strong>of</strong> ice<br />
movement directions, including striae, till fabrics<br />
and the orientation <strong>of</strong> morainic landforms.<br />
The glacial morphology in southern Finnish<br />
Lapland is dominantly composed <strong>of</strong> an assemblage<br />
<strong>of</strong> active-ice morainic landforms including streamlined<br />
features like drumlins and fl utings and transverse<br />
ribbed moraines (Fig. 1) (Sarala 2005a). Large<br />
areas are also covered with relatively thick basal till<br />
deposits or thin, gently undulating till cover with a<br />
clear indication <strong>of</strong> bedrock topography (for example<br />
in the area from Ranua to the west). Based on<br />
the till stratigraphy, only two glaciation phases have<br />
existed during the Weichselian age (Sarala 2005b).<br />
Fig. 1. The occurrence <strong>of</strong> streamlined drumlins and fl utings with transverse ribbed moraines and old marginal zones MZI-MZIV<br />
(red) in southern Finnish Lapland. Digital elevation model © National Land <strong>Survey</strong> <strong>of</strong> <strong>Finland</strong>, permit No. 26/LA/07
DRUMLINS IN KUUSAMO AND RANUA<br />
In Koillismaa area, around Kuusamo, thousands <strong>of</strong><br />
drumlins and fl utings occur forming the Kuusamo<br />
drumlin <strong>fi</strong> eld (Glückert 1973). This drumlin <strong>fi</strong> eld is<br />
one <strong>of</strong> the largest <strong>fi</strong> elds in <strong>Finland</strong> with an extent<br />
over 10,000 km 2 . Ice fl ow has been from the northwest<br />
to the southeast during the formation <strong>of</strong> the<br />
main <strong>fi</strong> eld. There also exists an older drumlin <strong>fi</strong> eld<br />
below the younger one with a west-east orientation<br />
indicating an early ice fl ow phase (Tuoppajärvi) <strong>of</strong><br />
the last deglaciation (Aario & Forsström, 1979).<br />
The north-northwest to the southeast-oriented<br />
large hills and topographic depressions, presently<br />
seen as lakes and hills, are in places (for example<br />
on northern side <strong>of</strong> Taivalkoski), an indication <strong>of</strong><br />
glacial advance before the Late Weichselian glaciation<br />
in the Kuusamo area. In the area <strong>of</strong> Ranua and<br />
towards the west, the same ice-fl ow phase is seen<br />
as a drumlin <strong>fi</strong> eld. Drumlins are large with a clear<br />
indication <strong>of</strong> ice-fl ow from the north/northwest.<br />
<strong>Geological</strong> <strong>Survey</strong> <strong>of</strong> <strong>Finland</strong>, <strong>Special</strong> <strong>Paper</strong> <strong>46</strong><br />
Glacial morphology and ice lobation in southern Finnish Lapland<br />
There are only minor indications (western fabrics<br />
in the uppermost till and reshaped surface <strong>of</strong> some<br />
drumlins) <strong>of</strong> a later glacial advance, which overrode<br />
an older glacial morphology (Sarala 2005a, Sarala<br />
& Rossi 2006).<br />
Glacial morphology at Oivanki (Fig. 2), northwest<br />
from the centre <strong>of</strong> Kuusamo, is composed <strong>of</strong><br />
large, well-developed drumlins deposited during<br />
the WNW oriented (ca. 290°) ice-fl ow (Sarala et al.<br />
2006). Drumlins in this area are usually long (1–2<br />
km) and narrow (200–500 m), and both the proximal<br />
and distal ends are tapered from the ground.<br />
The distal tail is usually somewhat narrower than<br />
the proximal end. Sometimes complex drumlins,<br />
which have grown together in the middle or at the<br />
proximal end, are also seen.<br />
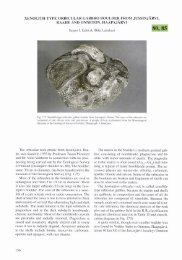
A drumlin in Korkea-aho is composed <strong>of</strong> two<br />
till units (Fig. 3). The upper one is brownish-grey<br />
till with a sand matrix having a compact and mas-<br />
Fig. 2. Topographic map <strong>of</strong> the drumlins in Korkea-aho, Oivanki, Kuusamo. GPR (80 MHz) sounding lines 1 and 2 are marked as<br />
red lines. Till fabric <strong>of</strong> the upper till unit in different test pits (M50-M53) are presented in the lower left corner. Digital elevation<br />
model, topographic features and roads © National Land <strong>Survey</strong> <strong>of</strong> <strong>Finland</strong>, permission number 26/LA/07.<br />
11
<strong>Geological</strong> <strong>Survey</strong> <strong>of</strong> <strong>Finland</strong>, <strong>Special</strong> <strong>Paper</strong> <strong>46</strong><br />
Pertti Sarala<br />
sive structure. Some <strong>fi</strong> ssility and thin sandy or silty<br />
stripes can be seen as a mark <strong>of</strong> subglacial deposition.<br />
The boulder and pebble content is moderate<br />
and the roundness is good. The petrographic composition<br />
<strong>of</strong> pebbles indicates long glacial transportation.<br />
Clast fabric measurements were only from this<br />
till unit in the topmost part <strong>of</strong> the ridge, showing the<br />
same orientation with a drumlin long axe (Fig. 2).<br />
Clast fabric measurements carried out in southern<br />
and northern marginal parts <strong>of</strong> the ridge showed that<br />
the stones have turned gently away from the drumlin’s<br />
centre line. This is either the result <strong>of</strong> primary<br />
deposition or could also refl ect secondary fl ow or<br />
mass-movement in the marginal parts <strong>of</strong> the ridge.<br />
The lower till unit is composed <strong>of</strong> grey, silty or<br />
sandy till having a mostly massive structure and in<br />
places, slightly laminated parts are also seen. In a<br />
GPR (80 MHz) pr<strong>of</strong>i le, it was possible to see that the<br />
lower till unit (Fig. 4) occurs on the southern part <strong>of</strong><br />
the drumlin body. The older ice-fl ow direction has<br />
been from the northwest and till has probably been<br />
deposited during that fl ow phase on the stoss side<br />
<strong>of</strong> the bedrock top in the middle <strong>of</strong> the ridge. In between<br />
the tills, there is a unit <strong>of</strong> sandy/silty layers.<br />
12<br />
Fig. 3. Two till units in test pit M53 on the proximal part <strong>of</strong><br />
the drumlin at Korkea-aho, Kuusamo. The upper till unit is<br />
composed <strong>of</strong> homogenous sandy till with <strong>fi</strong> ssility, typical <strong>of</strong><br />
subglacial lodgement till. Lower till includes sorted sandy<br />
lenses and bands indicating deposition as subglacial melt-out<br />
till. Photo P. Sarala.<br />
Fig. 4. GPR (80 MHz) sounding line 2 (see Fig. 2). Brownish red area above the bedrock surface (BS), on the southern side <strong>of</strong> the<br />
bedrock top is depicting lower till unit. The upper till is seen as a light grey color on the upper part <strong>of</strong> the ridge body. Between the<br />
tills occurs a unit <strong>of</strong> sandy and <strong>fi</strong> nes layers, sometimes also a boulder pavement.
RIBBED MORAINES IN SOUTHERN FINNISH LAPLAND<br />
Ribbed moraines exist as uniform <strong>fi</strong> elds on lowland<br />
areas at the western parts <strong>of</strong> Kusamo ice-lobe<br />
and are mainly composed <strong>of</strong> Rogen moraine or<br />
hummocky ribbed moraine types (cf. Hättestrand<br />
1997, Sarala 2003). Furthermore, a small area <strong>of</strong><br />
minor ribbed moraines occurs in the Sihtuuna area<br />
(cf. Aario et al. 1997).<br />
The Ranua ribbed moraine <strong>fi</strong> eld is one <strong>of</strong> the<br />
three ribbed moraine areas in southern Finnish Lapland<br />
(cf. Sarala 2006). It was initially described by<br />
Aario (1977) and is based on his large <strong>fi</strong> eld study<br />
data from the area. The <strong>fi</strong> eld is composed <strong>of</strong> transverse<br />
moraine ridges, which are usually 5–15 m<br />
high, 100-150 m wide and up to one kilometre long<br />
(Fig. 5). The form <strong>of</strong> ridges is <strong>of</strong>ten crescentic where<br />
the edges are pointing the down-ice direction. These<br />
forms represent Rogen moraine types described by<br />
Lundqvist (1969). The hummocky ribbed moraine<br />
type (cf. Hättestrand 1997, Sarala 2003, 2006) is<br />
also common, although not with a clear indication <strong>of</strong><br />
the ice-fl ow direction. Characteristically, mires and<br />
little lakes occupy depressions between the ridges<br />
(Fig. 5) and the ridge surface is mostly covered with<br />
boulders.<br />
The ridges are composed more or less regularly<br />
<strong>of</strong> two till facies. A more densely packed lodgement<br />
and melt-out till with a <strong>fi</strong> ne-grained matrix occurs at<br />
the base (Fig. 6) while homogeneous melt-out and<br />
fl ow till occurs at the sur<strong>fi</strong> cial parts. Pebble content<br />
increases while the roundness <strong>of</strong> pebbles decreases<br />
towards the top. The transport distance <strong>of</strong> stones<br />
is also longest at the bottom. On the surface and<br />
in the uppermost till, boulders indicate local variation<br />
<strong>of</strong> the underlying bedrock composition with<br />
very short, usually only some hundreds <strong>of</strong> meters<br />
long, transport distance. This feature has been used<br />
to trace mineralized boulders in the area (Aario et<br />
al. 1985, Aario 1990, Aario & Peuraniemi 1992).<br />
Sandy layers or stone pavements sometimes exist at<br />
the boundary between two units, although usually<br />
the contact is dif<strong>fi</strong> cult to distinguish.<br />
The third, bluish grey till unit (Fig. 6) is also<br />
found in places on topographic depressions, like<br />
in-between the bedrock tops. The till is clay-rich,<br />
matrix supported, compact and homogenous, indicating<br />
basal deposition, mainly by a lodgement<br />
process. Since the surface <strong>of</strong> this till is usually 6-8<br />
m from the surface, it is hard to reach by tractor<br />
excavations but can be recognised from the ground<br />
penetrating sounding pr<strong>of</strong>i les (cf. Aario 1990).<br />
<strong>Geological</strong> <strong>Survey</strong> <strong>of</strong> <strong>Finland</strong>, <strong>Special</strong> <strong>Paper</strong> <strong>46</strong><br />
Glacial morphology and ice lobation in southern Finnish Lapland<br />
Fig. 5. Part <strong>of</strong> the ribbed moraine <strong>fi</strong> eld near the Portimojärvi<br />
village in Ranua. Test pits dug during 2005 are marked as<br />
M54-M58. Digital elevation model, topographic features and<br />
roads © National Land <strong>Survey</strong> <strong>of</strong> <strong>Finland</strong>, permission number<br />
26/LA/07.<br />
Fig. 6. The two lowest till units in test pit M55 at Portimojärvi,<br />
Ranua. A sharp contact between the bluish grey (bottommost)<br />
and grey tills are seen at the base <strong>of</strong> the section at a depth <strong>of</strong><br />
about seven meters. Iron-stained, brown bands indicate the<br />
groundwater level variation. Photo P. Sarala.<br />
13
<strong>Geological</strong> <strong>Survey</strong> <strong>of</strong> <strong>Finland</strong>, <strong>Special</strong> <strong>Paper</strong> <strong>46</strong><br />
Pertti Sarala<br />
14<br />
GLACIAL DYNAMICS DURING THE FORMATION OF GLACIAL<br />
MORPHOLOGY<br />
Drumlins appear to be partly erosional features but<br />
also depositional forms. The stratigraphy presented<br />
by Aario and Forsström (1979) from the Soivio<br />
area, southern Kuusamo, proved that till(s) in deeper<br />
parts <strong>of</strong> the drumlin body was deposited during<br />
the earlier Tuoppajärvi ice-fl ow phase, which was<br />
a single comprehensive fl ow unit in the Koillismaa<br />
area during the early deglaciation. The radar data<br />
from the Oivanki area (Fig. 4) shows indications<br />
<strong>of</strong> tills deposited most likely during the older glacial<br />
advance from the north-northwest. The upper<br />
parts <strong>of</strong> drumlin bodies, instead, are clearly formed<br />
by growth beneath the ice that fl owed in the same<br />
direction as the lineation <strong>of</strong> drumlins. The deposition<br />
as basal lodgement and/or melt-out tills with<br />
strati<strong>fi</strong> ed inter-till layers suggests that the subglacial<br />
conditions were mainly warm-based. The bedrock<br />
core in the case <strong>of</strong> Korkea-aho has been a shelter<br />
against the glacial erosion, thus explaining why the<br />
older deposits on the southern side <strong>of</strong> bedrock tops<br />
have been preserved.<br />
Sarala (2006) indicated that ribbed moraine<br />
formation was a result <strong>of</strong> subglacial fracturing,<br />
mass movement and subsequent quarrying. The<br />
formation <strong>of</strong> ribbed formations initially occurred<br />
at the boundary between the frozen core and thawed<br />
or partially thawed, subglacial conditions (Fig. 7).<br />
This boundary existed about 100–150 km from<br />
the ice margin and the boundary retreated against<br />
the glacier core simultaneously with the marginal<br />
melting. Subsequently, after the fracturing<br />
and movement <strong>of</strong> subglacial ice-sediment blocks<br />
variable pressure conditions under the moving icesheet<br />
initiated the freeze-thaw process that caused<br />
the subglacial quarrying and deposition <strong>of</strong> local<br />
bedrock material on the ridge tops.<br />
The glacial morphology in southern Finnish<br />
Lapland is indicative <strong>of</strong> ice-lobe development<br />
during the latest melting phase <strong>of</strong> the Scandinavian<br />
Ice-Sheet. As deglaciation continued and the<br />
ice margin reached the area <strong>of</strong> the modern border<br />
in eastern <strong>Finland</strong>, rearrangement occurred and the<br />
ice-lobes <strong>of</strong> Kuusamo and Oulu were formed. The<br />
Oulu lobe in the southern parts <strong>of</strong> the area contin-<br />
Fig. 7. A rapid marginal melting and precipitation with a subsequent increase <strong>of</strong> accumulation in the central parts <strong>of</strong> the glacier<br />
has sped up the fl ow rate <strong>of</strong> the Kuusamo ice-lobe. The ribbed moraine formation seems to be closely related to the retreating<br />
boundary <strong>of</strong> the cold- and warm-based glacier.
ued fl owing from west to east but in the north, the<br />
fl ow direction <strong>of</strong> the Kuusamo lobe was turned<br />
from the northwest towards the Oulu lobe. A large<br />
Pudasjärvi-Taivalkoski-Hossa Interlobate Complex<br />
was initially formed into the contact between the<br />
Kuusamo and Oulu lobes (Aario 1977, 1990, Aario<br />
& Forsström 1979) but later on, at the second phase,<br />
at the contact between the Oulu lobe and the southern<br />
margin <strong>of</strong> Ranua Interlobate area (Sarala 2005a).<br />
A large Kuusamo drumlin <strong>fi</strong> eld in the east indicates<br />
warm-based glacial conditions at the outer<br />
margin <strong>of</strong> Kuusamo ice-lobe. In the central and<br />
western parts <strong>of</strong> the ice lobe area, the ribbed moraine<br />
Based on the latest dating results, the build-up <strong>of</strong><br />
glacial morphology in southern Finnish Lapland<br />
can, in most cases, be dated back to the Middle and<br />
Late Weichselian (Mäkinen 1999, 2005 and Sarala<br />
2005a and b). The Middle Weichselian glacial<br />
advance was the <strong>fi</strong> rst to cover the southern Finnish<br />
Lapland area after the Eemian interglacial. The<br />
Early Weichselian glacial advance(s) was probably<br />
so weak that it affected only the area <strong>of</strong> central and/<br />
or northernmost Finnish Lapland (cf. Svendsen et<br />
al. 1999, 2004, Siegert et al. 2001, Arnold & Sharp<br />
2002).<br />
The rapid warming <strong>of</strong> the climate at the end <strong>of</strong><br />
the Younger Dryas (12.8-11.6 ka ago) (cf. Boulton<br />
et al. 2001, Bard 2002) increased mean temperature<br />
from 8–10°C during a few hundreds <strong>of</strong> years,<br />
causing a strong melting <strong>of</strong> the glacier margin and<br />
This study was based on the interpretation <strong>of</strong> glacial<br />
landforms with stratigraphical studies in the<br />
test areas in Kuusamo and Ranua, southern Finnish<br />
Lapland. As several earlier studies prove, the active<br />
ice landforms are useful in reconstructing glacial dynamics<br />
during deposition. Landforms like drumlins,<br />
fl utings and ribbed moraines indicate the presence <strong>of</strong><br />
active ice-lobes after the separation <strong>of</strong> the ice-sheet<br />
margin during deglaciation. In many cases, the interpretation<br />
<strong>of</strong> glacial morphology is dif<strong>fi</strong> cult due to<br />
the existence <strong>of</strong> interlobate areas between the active<br />
lobes. As a relict <strong>of</strong> the cold-based glacier core and<br />
<strong>Geological</strong> <strong>Survey</strong> <strong>of</strong> <strong>Finland</strong>, <strong>Special</strong> <strong>Paper</strong> <strong>46</strong><br />
Glacial morphology and ice lobation in southern Finnish Lapland<br />
AGE OF DEPOSITION<br />
DISCUSSION AND CONCLUSIONS<br />
<strong>fi</strong> elds <strong>of</strong> Ranua, Tervola and Kemijärvi were formed.<br />
The ribbed moraine formation was interpreted to be<br />
closely related to the retreating boundary <strong>of</strong> cold-<br />
and warm-based glacier, in an internal part <strong>of</strong> the<br />
glacier margin during deglaciation (Kleman &<br />
Hättestrand 1999, Sarala 2005a). A rapid marginal<br />
melting, increased precipitation and accumulation<br />
in the central parts <strong>of</strong> the glacier increased the fl ow<br />
rate <strong>of</strong> the Kuusamo ice-lobe (Fig. 7). Thus, the development<br />
<strong>of</strong> active-ice landforms from the eastern<br />
part <strong>of</strong> the Kuusamo ice-lobe to the west is indicative<br />
<strong>of</strong> fast fl owing, even a surging-type ice stream<br />
during deglaciation (cf. Hart 1999).<br />
surface (Fig. 7). An imbalance between the warm<br />
surface and cold-based part <strong>of</strong> the moving ice sheet<br />
followed and might be the reason for the initiation<br />
<strong>of</strong> ribbed moraine formations in the core areas <strong>of</strong><br />
the latest glaciers in the northern hemisphere (Sarala<br />
2005a). Similar rapid climate change has not happened<br />
since, so it could be an explanation why the<br />
ribbed moraines are not present in modern glaciated<br />
areas.<br />
The Ranua interlobate area in between the Kuusamo<br />
and Oulu lobes with the north-northwest to<br />
south-southeast oriented drumlin <strong>fi</strong> eld is a relict<br />
from the older, probably the Middle Weichselian<br />
glacial phase (Sarala 2005a, Mäkinen 2006) and has<br />
been preserved under the cold-based, central area <strong>of</strong><br />
the Late Weichselian glaciation.<br />
having only minor marks <strong>of</strong> basal movement, older<br />
glacial morphology has been preserved under passive<br />
interlobate areas (cf. Sarala 2005a). Thus, the<br />
glaciogenic landforms <strong>of</strong> different ages can be found<br />
in the same area or even overlapping each other.<br />
The glacial morphology in southern Finnish Lapland<br />
is dominantly composed <strong>of</strong> assemblages <strong>of</strong> active-ice<br />
morainic landforms including streamlined<br />
drumlins, fl utings and transverse ribbed moraines.<br />
These forms are the dominant landform types in the<br />
area <strong>of</strong> the Kuusamo ice-lobe and indicate the Late<br />
Weichselian glacial morphology. Instead, the Ranua<br />
15
<strong>Geological</strong> <strong>Survey</strong> <strong>of</strong> <strong>Finland</strong>, <strong>Special</strong> <strong>Paper</strong> <strong>46</strong><br />
Pertti Sarala<br />
interlobate area with the north-northwest to southsoutheast<br />
oriented drumlin <strong>fi</strong> eld is a relict from the<br />
older, probably Middle Weichselian glacial phase<br />
and was preserved under the cold-based, central area<br />
<strong>of</strong> the Late Weichselian glaciation. According the<br />
Fieldwork was done during the 2006 and it was <strong>fi</strong> -<br />
nanced by the GTK. I would like to thank Juha Majaniemi<br />
and Pekka Huhta for GPR measurements,<br />
Jorma Valkama for assistance in the <strong>fi</strong> eld and Anne<br />
Aario, R. 1977. Classi<strong>fi</strong> cation and terminology <strong>of</strong> morainic<br />
landforms in <strong>Finland</strong>. Boreas 6, 87–100.<br />
Aario, R. (ed.) 1990. Glacial heritage <strong>of</strong> Northern <strong>Finland</strong>; an<br />
excursion guide. Nordia tiedonantoja, Sarja A: 1. 96 p.<br />
Aario, R. & Forsström, L. 1979. Glacial stratigraphy <strong>of</strong> Koillismaa<br />
and North Kainuu, <strong>Finland</strong>. Fennia 157: 2, 1–49.<br />
Aario, R. & Peuraniemi, V. 1992. Glacial dispersal <strong>of</strong> till constituents<br />
in morainic landforms <strong>of</strong> different types. In: Aario,<br />
R. & Heikkinen, O. (eds.) Proceedings <strong>of</strong> Third International<br />
Drumlin Symposium. Geomorphology 6, 9–25.<br />
Aario, R., Peuraniemi, V. & Sarala, P. 1997. The Sihtuuna<br />
moraine at Tervola, southern Lapland. Sedimentary Geology<br />
111, 313–327.<br />
Arnold, N. & Sharp, M. 2002. Flow variability in the Scandinavian<br />
ice sheet: modelling the coupling between ice<br />
sheet fl ow and hydrology. Quaternary Science Reviews 21,<br />
485–502.<br />
Bard, E. 2002. Abrupt climate changes over millennial time<br />
scales: climate shock. Physics Today 55, 32–38.<br />
Boulton, G. S., Dongelmans, P., Punkari, M. & Broadgate,<br />
M. 2001. Palaeoglaciology <strong>of</strong> an ice sheet through a glacial<br />
cycle: the European ice sheet through the Weichselian.<br />
Quaternary Science Reviews 20, 591–625.<br />
Clark, C. 1997. Reconstructing the evolutionary dynamics <strong>of</strong><br />
former ice sheets using multi-temporal evidence, remote<br />
sensing and GIS. Quaternary Science Reviews 16, 1067–<br />
1092.<br />
Glückert, G. 1973. Two large drumlin <strong>fi</strong> elds in Central <strong>Finland</strong>.<br />
Fennia 120, 1–37.<br />
Hättestrand, C. 1997. Ribbed moraines in Sweden – distribution<br />
pattern and paleoglaciological implications. Sedimentary<br />
geology 111, 41–56.<br />
Hart, J. 1999. Identifying fast ice fl ow from landform assemblages<br />
in the geological record: a discussion. Annals <strong>of</strong> Glaciology<br />
28, 59–66.<br />
Hättestrand, C. & Kleman, J. 1999. Ribbed moraine formation.<br />
Quaternary Science Reviews 18, 43–61.<br />
Kleman, J. & Hättestrand, C. 1999. Frozen-bed Fennoscandian<br />
and Laurentide ice sheets during the Last Glacial<br />
Maximum. Nature 402, 63–66.<br />
16<br />
ACKNOWLEDGEMENTS<br />
REFERENCES<br />
latest dating results (Mäkinen 2005, Sarala 2005a<br />
and b), the Middle Weichselian glacial phase was<br />
the <strong>fi</strong> rst one to cover the southern Finnish Lapland<br />
area after the Eemian interglacial.<br />
Peltoniemi for laboratory analysis. Constructive<br />
comments given by Juha-Pekka Lunkka and one<br />
anonymous reviewer improved the manuscript.<br />
Kleman, J., Hättestrand, C., Borgström, I. & Stroeven, A.<br />
1997. Fennoscandian palaeoglaciology reconstructed using<br />
a glacial geological inversion model. Journal <strong>of</strong> Glaciology<br />
43, 283–289.<br />
Korpela, K. 1969. Die Weichsel-Eiszeit und ihr Interstadial in<br />
Peräpohjola (nördliches Nord<strong>fi</strong> nnland) im Licht von submoränen<br />
Sedimenten. Annales Academiae Scientiarum<br />
Fennicae A III: 99, 1–108.<br />
Kurimo, H. 1977. Pattern <strong>of</strong> dead-ice deglaciation forms in<br />
western Kemijärvi, Northern <strong>Finland</strong>. Fennia 153, 43–56.<br />
Lundqvist, J. 1969. Problems <strong>of</strong> the so-called Rogen moraine.<br />
Sveriges Geologiska Undersökning C 648, 1–32.<br />
Mäkinen, K. 1999. Ice wedge casts in Finnish Lapland. In:<br />
Seppälä, M. & Eerola, M. (comps.) Nordic symposium on<br />
changes in permafrost and periglacial environment: scienti<strong>fi</strong><br />
c and technical approach, Kevo, <strong>Finland</strong>, 2–24 August<br />
1999: programme, participants, abstracts, excursion guide.<br />
National Committee for Permafrost Research and Technics.<br />
1 p.<br />
Mäkinen, K. 2005. Dating the Weichselian deposits <strong>of</strong> southwestern<br />
Finnish Lapland. In: Ojala, A. E. K. (ed.) Quaternary<br />
studies in the northern and Arctic regions <strong>of</strong> <strong>Finland</strong>:<br />
proceedings <strong>of</strong> the workshop organized within the Finnish<br />
National Committee for Quaternary Research (INQUA),<br />
Kilpisjärvi Biological Station, <strong>Finland</strong>, January 13–14th<br />
2005. <strong>Geological</strong> <strong>Survey</strong> <strong>of</strong> <strong>Finland</strong>, <strong>Special</strong> <strong>Paper</strong> 40,<br />
67–78.<br />
Mäkinen, K. 2006. The Kemi drumlin <strong>fi</strong> eld and its age. In:<br />
Johansson, P., Lunkka, J.-P. & Sarala, P. (eds.) Late Pleistocene<br />
glacigenic deposits in the central part <strong>of</strong> the Scandinavian<br />
ice sheet. The Peribaltic Group Field Symposium<br />
in <strong>Finland</strong>, September 11.–15. 2006. Abstracts. Rovaniemi:<br />
<strong>Geological</strong> <strong>Survey</strong> <strong>of</strong> <strong>Finland</strong>, 25.<br />
Punkari, M. 1997. Glacial and glaci<strong>of</strong>l uvial deposits in the interlobate<br />
areas <strong>of</strong> the Scandinavian ice sheet. Quaternary<br />
Science Reviews 16, 741–753.<br />
Sarala, P. 2003. Ribbed-moreenit – jäätikön liikesuunnan<br />
poikittaiset indikaattorit. Summary: Ribbed moraines<br />
– transverse indicators <strong>of</strong> the ice fl ow direction. Geologi<br />
55, 250–253.
Sarala, P. 2005a. Glacial morphology and dynamics with till<br />
geochemical exploration in the ribbed moraine area <strong>of</strong><br />
Peräpohjola, Finnish Lapland. Espoo: <strong>Geological</strong> <strong>Survey</strong><br />
<strong>of</strong> <strong>Finland</strong>. 17 p. (PhD Thesis)<br />
Sarala, P. 2005b. Weichselian stratigraphy, geomorphology<br />
and glacial dynamics in southern Finnish Lapland. Bulletin<br />
<strong>of</strong> the <strong>Geological</strong> Society <strong>of</strong> <strong>Finland</strong> 77:2, 71–104.<br />
Sarala, P. 2005c. Landform development during the Weichselian<br />
glaciation in Peräpohjola, <strong>Finland</strong>. In: Ojala, A. E. K.<br />
(ed.) Quaternary studies in the northern and Arctic regions<br />
<strong>of</strong> <strong>Finland</strong>: proceedings <strong>of</strong> the workshop organized within<br />
the Finnish National Committee for Quaternary Research<br />
(INQUA), Kilpisjärvi Biological Station, <strong>Finland</strong>, January<br />
13–14th 2005. <strong>Geological</strong> <strong>Survey</strong> <strong>of</strong> <strong>Finland</strong>, <strong>Special</strong> <strong>Paper</strong><br />
40, 59–65.<br />
Sarala, P. 2006. Ribbed moraine stratigraphy and formation in<br />
southern Finnish Lapland. Journal <strong>of</strong> Quaternary Science<br />
21: 4, 387–398.<br />
Sarala, P., Johansson, P. & Lunkka, J.-P. (eds.) 2006. Late<br />
Pleistocene glacigenic deposits in the central part <strong>of</strong> the<br />
Scandinavian ice sheet: Excursion guide. The INQUA<br />
Peribaltic Group Field Symposium in <strong>Finland</strong>, September<br />
11.–15. 2006. Rovaniemi: <strong>Geological</strong> <strong>Survey</strong> <strong>of</strong> <strong>Finland</strong>.<br />
62 p.<br />
Sarala, P., Peuraniemi, V. & Aario, R. 1998. Glacial geology<br />
and till geochemistry in ore exploration in the Tervola area,<br />
southern Finnish Lapland. Bulletin <strong>of</strong> <strong>Geological</strong> Society<br />
<strong>of</strong> <strong>Finland</strong> 70, 19–41.<br />
Sarala, P. & Rossi, S. 2006. Rovaniemen–Tervolan alueen<br />
glasiaalimorfologiset ja -stratigra<strong>fi</strong> set tutkimukset ja niiden<br />
soveltaminen geokemialliseen malminetsintään. Summary:<br />
<strong>Geological</strong> <strong>Survey</strong> <strong>of</strong> <strong>Finland</strong>, <strong>Special</strong> <strong>Paper</strong> <strong>46</strong><br />
Glacial morphology and ice lobation in southern Finnish Lapland<br />
Glacial geological and stratigraphical studies with applied<br />
geochemical exploration in the area <strong>of</strong> Rovaniemi and Tervola,<br />
southern Finnish Lapland. <strong>Geological</strong> <strong>Survey</strong> <strong>of</strong> <strong>Finland</strong>,<br />
Report <strong>of</strong> Investigation 161. 115 p.<br />
Siegert, M., Dowdeswell, J., Hald, M. & Svendsen, J.-<br />
I. 2001. Modelling the Eurasian Ice Sheet through a full<br />
(Weichselian) glacial cycle. Global and Planetary Change<br />
31, 367–385.<br />
Sutinen, R. 1984. On the glacial stratigraphy in Pudasjärvi<br />
area, Peräpohja. Striae 20, 91–98.<br />
Sutinen, R. 1992. Glacial deposits, their electrical properties<br />
and surveying by image interpretation and ground<br />
penetrating radar. <strong>Geological</strong> <strong>Survey</strong> <strong>of</strong> <strong>Finland</strong>, Bulletin<br />
359. 123 p.<br />
Svendsen, J. I., Astakhov, V. I., Bolshiyanov, D. Yu., Demidov,<br />
I., Dowdeswell, J. A., Gataullin, V., Hjort, C., Hubberten,<br />
H. W., Larsen, E., Mangerud, J., Melles, M.,<br />
Möller, P., Saarnisto, M. & Siegert, M. J. 1999. Maximum<br />
extent <strong>of</strong> the Eurasian ice sheets in the Barents and Kara<br />
Sea region during the Weichselian. Boreas 28, 234–242.<br />
Svendsen, J., Alexanderson, H., Astakhov, V., Demidov, I.,<br />
Dowdeswell, J., Funder, S., Gataullin, V., Henriksen, M.,<br />
Hjort, C., Houmark-Nielsen, M., Hubberten, H., Ingolfsson,<br />
O., Jakobsson, M., Kjær, K., Larsen, E., Lokrantz,<br />
H., Lunkka, J.-P., Lyså, A., Mangerud, J., Matiouchkov,<br />
A., Murray, A., Möller, P., Niessen, F., Nikolskaya, O.,<br />
Polyak, L., Saarnisto, M., Siegert, C., Siegert, M., Spielhagen,<br />
R. & Stein, R. 2004. Late Quaternary ice sheet history<br />
<strong>of</strong> northern Eurasia. Quaternary Science Reviews 23,<br />
1229–1271.<br />
17
Applied Quaternary research in the central part <strong>of</strong> glaciated terrain,<br />
edited by Peter Johansson and Pertti Sarala.<br />
<strong>Geological</strong> <strong>Survey</strong> <strong>of</strong> <strong>Finland</strong>, <strong>Special</strong> <strong>Paper</strong> <strong>46</strong>, 19–24, 2007.<br />
DEGLACIATION OF THE RYBACHI AND SREDNI PENINSULAS IN<br />
THE LATE PLEISTOCENE, NORTHWEST RUSSIA<br />
by<br />
Vladimir Yevzerov 1 , Jakob Møller 2 , Vasili Kolka 1 and Ge<strong>of</strong>frey Corner 3<br />
Yevzerov, V., Møller, J., Kolka, V. & Corner, G. 2007. Deglaciation<br />
<strong>of</strong> the Rybachi and Sredni Peninsulas in the Late Pleistocene,<br />
northwest Russia. Applied Quaternary research in the<br />
central part <strong>of</strong> glaciated terrain. <strong>Geological</strong> <strong>Survey</strong> <strong>of</strong> <strong>Finland</strong>,<br />
<strong>Special</strong> <strong>Paper</strong> <strong>46</strong>, 19–24, 3 <strong>fi</strong> gures, 1 table.<br />
The position <strong>of</strong> the high marine limit was determined on the<br />
basis <strong>of</strong> the highest altitude <strong>of</strong> marine deposits and relief forms<br />
related to the sea activity. In most locations, these were adjacent<br />
beach ridges and outwash plains located on the distal side. In<br />
addition to the authors’ original measurements, data from Tanner<br />
(1930) were also used. A detailed study <strong>of</strong> the position <strong>of</strong> locations<br />
<strong>of</strong> the marine limit and marginal moraine ridges has made<br />
it possible not only to reconstruct the history <strong>of</strong> gradual glacial<br />
shrinking and the retreat <strong>of</strong> the ice margin, but also to identify the<br />
periods <strong>of</strong> invert motion <strong>of</strong> the glacier, which occurred during the<br />
Late Pleistocene due to coolings.<br />
Key words (GeoRef Thesaurus, AGI): glacial geology, deglaciation,<br />
sea-level changes, highest shoreline, shore features, end<br />
moraines, Pleistocene, Kola Peninsula, Russian Federation.<br />
1 <strong>Geological</strong> Institute <strong>of</strong> Kola Science Centre <strong>of</strong> Russian<br />
Academy <strong>of</strong> Science, Russia<br />
2 Department <strong>of</strong> Geology, Tromsø Museum, Norway<br />
3 Department <strong>of</strong> Geology University <strong>of</strong> Tromsø, Norway<br />
E-mail: yevzerov@geoksc.apatity.ru<br />
19
<strong>Geological</strong> <strong>Survey</strong> <strong>of</strong> <strong>Finland</strong>, <strong>Special</strong> <strong>Paper</strong> <strong>46</strong><br />
Vladimir Yevzerov, Jakob Møller, Vasili Kolka and Ge<strong>of</strong>frey Corner<br />
The Kola region includes the Kola peninsula and<br />
adjacent shelves <strong>of</strong> the Barents and White seas. Two<br />
deglaciation stages have been distinguished in this<br />
area (Yevzerov 1998). In the <strong>fi</strong> rst stage, which lasted<br />
approximately 5,000 years (Yevzerov & Nikolaeva<br />
2000), aerial deglaciation took place. Three marginal<br />
belts were formed during the period between<br />
the Last Glacial Maximum in the Kola region (near<br />
16,000 years BP) and the Preboreal. During interstadial<br />
warming (before the Oldest Dryas, Bølling<br />
and Allerød), extensive peripheral covers were cut<br />
<strong>of</strong>f from the main ice mass and thick glaci<strong>of</strong>l uvial<br />
deposits accumulated only in the periglacial basins<br />
near the edge <strong>of</strong> the active ice. The glacier that advanced<br />
during the phases <strong>of</strong> stadial coolings (Oldest<br />
Dryas, Older Dryas and Younger Dryas) deformed<br />
interstadial deposits and built mainly push moraine<br />
ridges. In the second stage <strong>of</strong> deglaciation, the rest<br />
<strong>of</strong> the ice sheet was dissected by extended marine<br />
gulfs during the warming in the beginning <strong>of</strong> the<br />
Holocene. In these gulfs, glaciomarine sediments<br />
were superseded by marine deposits, probably in<br />
connection with the <strong>fi</strong> nal melting <strong>of</strong> the ice about<br />
9,000 years BP.<br />
Two bands <strong>of</strong> the push moraine ridges are found<br />
in the northwest portion <strong>of</strong> the Kola region. The<br />
southern band is a continuation <strong>of</strong> the Tromsø -Lyngen<br />
regional formations <strong>of</strong> Norway (Marthinussen<br />
Our research is a continuation <strong>of</strong> studies <strong>of</strong> coastal<br />
and glacial deposits <strong>of</strong> Rybachi and Sredni Peninsulas<br />
that was started by Tanner (Tanner 1930). These<br />
peninsulas are situated in northwest Russia, near the<br />
boundary between Russia and Norway (Fig. 1) and<br />
are a low-relief undulating plateau dissected by numerous<br />
creek and river valleys. Most <strong>of</strong> the area is<br />
located at an altitude <strong>of</strong> about 200 m above sea level<br />
(a.s.l.). The eastern part <strong>of</strong> Sredni, however, is more<br />
elevated, with the highest altitudes exceeding 300<br />
m a.s.l. The surface <strong>of</strong> the peninsulas is covered by<br />
a thin, discontinuous layer <strong>of</strong> diamicton consisting<br />
<strong>of</strong> decomposition products <strong>of</strong> Riphean rocks: sandstone,<br />
siltstone, clay shale, dolomite and conglomerate.<br />
Outcrops <strong>of</strong> these rocks are common. The<br />
moraine is scarce, occurring largely in the southern<br />
20<br />
INTRODUCTION<br />
STUDY AREA<br />
1974). In the west, the formation crosses the Pechenga<br />
River about 5 km from the mouth and approaches<br />
the Murman coast near the Zapadnaya Litsa Bay in<br />
the east. Ridges <strong>of</strong> this band were generated during<br />
the Younger Dryas and are part <strong>of</strong> an inner band <strong>of</strong><br />
marginal belt II. This band was generated in the Kola<br />
region during the Bølling (Yevzerov & Nikolaeva<br />
2000). The second band is an advanced fragment<br />
on the Sredni Peninsula and includes push moraine<br />
ridges in Ejno Bay and in the northern branch <strong>of</strong><br />
Motovsky Bay (Bolshaya Motka Bay). These ridges<br />
were generated in connection with a cooling during<br />
the Older Dryas. Between these bands, a fragment<br />
<strong>of</strong> the dump moraine ridges band is found about 2.5<br />
kms from the mouth <strong>of</strong> the Pechenga River. It could<br />
be formed only during the Bølling. Absence <strong>of</strong> an<br />
extended band <strong>of</strong> dump moraine ridges indicates<br />
adverse conditions for the occurrence <strong>of</strong> periglacial<br />
basins in the studied area. The surface <strong>of</strong> the ice<br />
sheet bed was inclined in the direction <strong>of</strong> the ice<br />
movement and was cut by rivers valleys fl owing<br />
into Barents Sea. The shelf <strong>of</strong> the southeastern part<br />
<strong>of</strong> the Barents Sea was exempted from glacial ice<br />
during the Bølling (Polyak & Mikhailov 1996). The<br />
shelf near the Rybachi and Sredni Peninsulas was<br />
certainly free from glacial ice during the Bølling<br />
and a dead ice cover bordered the main ice mass <strong>of</strong><br />
active ice on the peninsulas at the same time.<br />
part <strong>of</strong> the study area. Erratic boulders <strong>of</strong> gneiss,<br />
granite and basic rocks <strong>of</strong> different ages (Archaean<br />
and probable Proterozoic), however, are abundant.<br />
The boulders were moved more than 30 km from the<br />
southwest to the northeast based on the orientation<br />
<strong>of</strong> glacial strias. Marginal ridges <strong>of</strong> push moraines<br />
have been found in the northern branch <strong>of</strong> Motovsky<br />
Bay (Bolshaya Motka Bay) and in the Eina<br />
Bay, on the southern coast <strong>of</strong> Rybachi. The valleys<br />
<strong>of</strong> many rivers and creeks, facing east and north, are<br />
partially covered by glaci<strong>of</strong>l uvial delta deposits. On<br />
both peninsulas, Pleistocene and Holocene coastal<br />
sediments are abundant, locally reaching an altitude<br />
<strong>of</strong> about 100 m a.s.l. Some idea as to their distribution<br />
can be gained from Figure 1.
<strong>Geological</strong> <strong>Survey</strong> <strong>of</strong> <strong>Finland</strong>, <strong>Special</strong> <strong>Paper</strong> <strong>46</strong><br />
Deglaciation <strong>of</strong> the Rybachi and Sredni Peninsulas in the Late Pleistocene, northwest Russia<br />
Fig. 1. Sketch-map <strong>of</strong> the study area showing the location bands <strong>of</strong> dump and push moraine ridges, the location <strong>of</strong> the levelled<br />
marine limit localities, projection plane A-A1 for the equidistant shoreline diagram perpendicular to isobases <strong>of</strong> uplift and<br />
presented in Fig. 2. Hereinafter the numbers <strong>of</strong> locality points from Tanner (1930) are underlined.<br />
THE POSITION OF THE HIGH MARINE LIMIT<br />
The position <strong>of</strong> the high marine limit (HML) was<br />
determined on the basis <strong>of</strong> the highest altitude <strong>of</strong><br />
marine deposits and relief forms related to the activity<br />
<strong>of</strong> the sea. In most locations, these were adjacent<br />
beach ridges and outwash plains located on the<br />
distal side. In this chapter, we shall discuss the results<br />
from the study <strong>of</strong> the extent and altitude <strong>of</strong> the<br />
marine deposits and relief forms that are con<strong>fi</strong> ned<br />
to the marine limit <strong>of</strong> the Late Pleistocene. The altitudes<br />
were measured with the use <strong>of</strong> a theodolite<br />
from triangulation points or from the sea level with<br />
subsequent recalculation to the average sea level. In<br />
addition to the authors’ original measurements, data<br />
from Tanner (Tanner 1930) was also used. The locations<br />
studied are shown in Fig.1, and the altitudes <strong>of</strong><br />
the marine limit are given in the Table1.<br />
The corrections <strong>of</strong> measured beach feature altitudes<br />
approximately refl ecting the energy <strong>of</strong> waves<br />
in each point were included in the measurements<br />
results. The magnitude <strong>of</strong> the corrections was de<strong>fi</strong><br />
ned by measuring the altitudes <strong>of</strong> crests <strong>of</strong> modern<br />
beach-ridges on the Rybachi and Sredni Peninsulas.<br />
All beach ridges in the bays occur at an altitude<br />
<strong>of</strong> more than 2 m above the average sea level, and<br />
those on the open sea coast are commonly located<br />
no higher than 6-7 m above this level. Therefore, the<br />
correction range was 2-6 m. Differentiation <strong>of</strong> the<br />
corrections within this range was performed with<br />
consideration for the coast morphology, although<br />
the precision is unlikely to exceed one meter. Consequently,<br />
the resulting altitudes <strong>of</strong> the marine limit<br />
given in Table 1 have a precision <strong>of</strong> no more than<br />
± 1 m. The resulting altitudes <strong>of</strong> the marine limit<br />
were used to construct an equidistant shoreline<br />
diagram shown in Fig. 2. The line S0, plotted with<br />
the use <strong>of</strong> the authors’ data, corresponds to the Late<br />
Dryas. As to other lines on the diagram, the greater<br />
inclination to the abscissa, the earlier geologic<br />
events they indicate. This trend, in conjunction with<br />
the spatial position <strong>of</strong> the locations that were used<br />
to construct the diagram, and the data on marginal<br />
moraine ridges, make it possible to reconstruct the<br />
succession <strong>of</strong> deglaciation in the study area.<br />
21
<strong>Geological</strong> <strong>Survey</strong> <strong>of</strong> <strong>Finland</strong>, <strong>Special</strong> <strong>Paper</strong> <strong>46</strong><br />
Vladimir Yevzerov, Jakob Møller, Vasili Kolka and Ge<strong>of</strong>frey Corner<br />
Table 1. The altitude <strong>of</strong> the marine limit on the Rybachi and Sredni Peninsulas<br />
Loc. No Locality Type <strong>of</strong> feature Height abo¬ve mid Correction Adjusted<br />
sea level in m in m height in m<br />
2 Tsypnavolok Ridge 99.9 4 95.9<br />
4 Chorhy Cape - ,, - 99.8 4 95.8<br />
6 Skarbeevskaya Bay - ,, - 92.5 5 87.5<br />
8 Korovy Cape - ,, - 87.2 2 85.2<br />
41 ) Klupuniementunturi Abrasion. terrace 88.7 2 86.2<br />
5 Niittymukka Ridge (?) 101.5-102.9 5 96.5-97.9<br />
6 Syväjoki Abrasion. terrace 86.4 2 84.4<br />
11 Klubb Mauntin Ridge 94.6 5 89.6<br />
9a Kohmelo-kuru Abrasion. terrace 94.49 2 92.5<br />
12 Ozerko Ridge 90.0 2 88.0<br />
9 Perähamina Ridge (?) 95.21 3 92.2<br />
10 Ittelin Ridge 93.9 5 88.9<br />
10 Kuivatunturi - ,, - 94.99 5 90.0<br />
9 Zemlyanoe - ,, - 92.6 4 88.6<br />
13 Monument - ,, - 95.7 5 90.7<br />
14 Eina Bay - ,, - 89.4 2 87.4<br />
15 Vähä-Outa Abrasion. terrace 95.93 6 89.9<br />
17 Pummankitunturi - ,, - 96.0 5 91<br />
18 Poropellot Ridge (?) 104.3-107.7 6 98.3-101.7<br />
19 Isomukka Abrasion. terrace (?) 99.1 6 93.1<br />
15 Matalaniemi Bay Ridge 97.7 5 92.7<br />
20 Govcce`rotto (?) 99.79 6 93.8<br />
21 Porttu`njard Ridge 96.5 4 92.5<br />
22 Palve`tuo-ddar (?) 95.9 3 92.9<br />
16 Sputnik Ridge 90.7 3 87.7<br />
23 Madde`muetke - ,, - 91.0 3 88.0<br />
1 ) The numbers <strong>of</strong> the localities from Tanner (1930) are underlined.<br />
22<br />
THE SUCCESSION OF DEGLACIATION IN THE AREA<br />
The history <strong>of</strong> deglaciation <strong>of</strong> Rybachi and Sredni<br />
Peninsulas includes some stages. All the stages<br />
are indicated in Fig. 3. During the <strong>fi</strong> rst two stages,<br />
the ice sheet margin gradually retreated towards<br />
the southwest and possibly southeast, leaving the<br />
northeastern and northwestern part <strong>of</strong> Rybachi and<br />
probable Motovski Bay ice-free. The position <strong>of</strong> the<br />
locations by which the marine limit was de<strong>fi</strong> ned and<br />
the two stages were determined can be fairly well<br />
correlated in situ and on the diagram (Figs. 1, 2 and<br />
3). During the third stage, the glacier advanced and<br />
joined as a part <strong>of</strong> the ice sheet <strong>of</strong> the previous stage<br />
(Fig. 3:3). The occurrence <strong>of</strong> a new expansion <strong>of</strong><br />
the glacier is supported, directly or indirectly, by<br />
the presence <strong>of</strong> push moraine ridges in the northern<br />
branch <strong>of</strong> Motovsky Bay and in Eina Bay (north <strong>of</strong><br />
locality 14), and the above mentioned information<br />
on the history <strong>of</strong> deglaciation <strong>of</strong> the Kola Peninsula<br />
during the Late Pleistocene. This advance <strong>of</strong> the glacier<br />
probably was caused by the cooling during the<br />
Older Dryas. In the following stage (Fig. 3:4), all<br />
territory <strong>of</strong> the Rybachi Peninsula and a northwest<br />
part <strong>of</strong> the Sredni Peninsula were released from ice.<br />
A small time interval probably existed in the formation<br />
<strong>of</strong> the HML marked with points on lines 3-4 <strong>of</strong><br />
diagram (Fig. 3). Deglaciation by position <strong>of</strong> point<br />
14 from this community (Fig. 2) took place de<strong>fi</strong> nitely<br />
after the formation <strong>of</strong> push moraine ridges during<br />
the Older Dryas and hence, it is connected to the<br />
subsequent warming <strong>of</strong> the Allerød. In this period,<br />
there was a strait between the Rybachi and Sredni<br />
Peninsulas during the HML on Mount Klubb (No 11
in the table). It exceeds the altitudes <strong>of</strong> the low sites<br />
<strong>of</strong> an isthmus to the east and a southeast from the<br />
mentioned mountain. Thus, the peninsula Rybachi<br />
has turned into an island. Ice was probably kept active<br />
for some time in the southwest part <strong>of</strong> Sredni<br />
Peninsula at the end <strong>of</strong> the fourth stage. However,<br />
evidence <strong>of</strong> it are absent and in relation to Fig. 3,<br />
IV dead ice is only shown. All territory <strong>of</strong> Sredni<br />
Fig. 2. Equidistant shoreline diagram for Rybachi<br />
and Sredni peninsulas constructed on the<br />
basis <strong>of</strong> the HML in different points. Heights <strong>of</strong><br />
the marine limit shown in the Table 1. The line<br />
S0 corresponds to the Younger Dryas. It put<br />
according to authors. Other lines correspond<br />
to the surfaces that were formed by the sea<br />
before the Younger Dryas. They are inclined<br />
to a line S0 under the same corners as on the<br />
diagram <strong>of</strong> M. Marthinussen [1] for the stripe<br />
from Varangerfjord and the east <strong>of</strong> the Varanger<br />
peninsula till area <strong>of</strong> Inari lake.<br />
Fig. 3. The succession <strong>of</strong> the Rybachi and Sredni<br />
peninsulas deglaciation. 1- border <strong>of</strong> ice distribution<br />
established (a) and assumed (b); 2 – dead ice; 3<br />
– active ice <strong>of</strong> ice sheet.<br />
<strong>Geological</strong> <strong>Survey</strong> <strong>of</strong> <strong>Finland</strong>, <strong>Special</strong> <strong>Paper</strong> <strong>46</strong><br />
Deglaciation <strong>of</strong> the Rybachi and Sredni Peninsulas in the Late Pleistocene, northwest Russia<br />
Peninsula was released from ice during the Allerød<br />
in the three following stages. Positions <strong>of</strong> dead ice<br />
massif at the end <strong>of</strong> each <strong>of</strong> these stages are shown<br />
accordingly on Fig. 3, 5, 6 and 7. A new approach <strong>of</strong><br />
the ice sheets in the Younger Dryas has not reached<br />
the Rybachi and Sredni Peninsulas. The border <strong>of</strong><br />
the maximum distribution <strong>of</strong> active ice in this period<br />
is seen much further to the south (Fig. 1).<br />
23
<strong>Geological</strong> <strong>Survey</strong> <strong>of</strong> <strong>Finland</strong>, <strong>Special</strong> <strong>Paper</strong> <strong>46</strong><br />
Vladimir Yevzerov, Jakob Møller, Vasili Kolka and Ge<strong>of</strong>frey Corner<br />
Deglaciation <strong>of</strong> the area <strong>of</strong> the Rybachi and Sredni<br />
Peninsulas started in the northeast and <strong>fi</strong> nished in<br />
the southwest. During deglaciation, there was an inverted<br />
motion (advance) <strong>of</strong> the glacier due to cooling.<br />
The deglaciation <strong>of</strong> the study area started during<br />
the Bølling and ended during the Allerød. The<br />
detailed study <strong>of</strong> the position <strong>of</strong> the marine limit and<br />
This work was supported by the Research Program<br />
<strong>of</strong> the Presidium <strong>of</strong> the Russian Academy <strong>of</strong><br />
Sciences “Evolution <strong>of</strong> the relief and deposits <strong>of</strong><br />
Marthinussen, M. 1974. Contributions to the Quarternary geology<br />
<strong>of</strong> north-easternmost Norway and closely adjoining<br />
foreign territories. Norges Geologiske Undersøkelse 315.<br />
157 p.<br />
Polyak, L. & Mikhailov, V. 1996. Post-glacial environments<br />
<strong>of</strong> the southeastern Barents Sea: foraminiferal evidence. In:<br />
Andrews, J. T. et al. (eds.) Late Quaternary Palaeoceanography<br />
<strong>of</strong> the North Atlantic Margins. <strong>Geological</strong> Society<br />
<strong>Special</strong> Publication 111, 323–337.<br />
24<br />
CONCLUSIONS<br />
ACKNOWLEDGEMENTS<br />
REFERENCES<br />
marginal moraine ridges has made it possible not<br />
only to reconstruct the history <strong>of</strong> gradual shrinking<br />
<strong>of</strong> the glacier and the retreat <strong>of</strong> the ice margin, but<br />
also to identify the periods <strong>of</strong> inverted motion <strong>of</strong> the<br />
glacier, which occurred during the Late Pleistocene<br />
due to cooling.<br />
the Kola Region in Holocene” (program 16, part 2,<br />
project 5.5).<br />
Tanner, V. 1930. Studier över Kvartärsystemet i Fennoskandias<br />
nordliga delars. Fennia 53: 1. 589 p.<br />
Yevzerov, V. Y. 1998. Deglaciation <strong>of</strong> the Kola peninsula and<br />
the Belomorian depression. 2nd Queen workshop, St. Petersburg,<br />
Feb. 6–9. Abstract, 55.<br />
Yevzerov, V. Ya & Nikolaeva, S. B. 2000. Marginal belts <strong>of</strong> the<br />
Scandinavian ice sheets in the Kola region. Geomorphology<br />
1, 61–73. (in Russian)
Applied Quaternary research in the central part <strong>of</strong> glaciated terrain,<br />
edited by Peter Johansson and Pertti Sarala.<br />
<strong>Geological</strong> <strong>Survey</strong> <strong>of</strong> <strong>Finland</strong>, <strong>Special</strong> <strong>Paper</strong> <strong>46</strong>, 25–30, 2007.<br />
LANDSCAPE AND GEOLOGICAL FEATURES OF TECTONIC ZONES IN<br />
THE KHIBINY MOUNTAINS, KOLA PENINSULA, NW RUSSIA<br />
by<br />
Olga Korsakova and Vasili Kolka 1<br />
Korsakova, O. & Kolka, V. 2007. Landscape and geological<br />
features <strong>of</strong> tectonic zones in the Khibiny Mountains, Kola Peninsula,<br />
NW Russia. Applied Quaternary research in the central part<br />
<strong>of</strong> glaciated terrain. <strong>Geological</strong> <strong>Survey</strong> <strong>of</strong> <strong>Finland</strong>, <strong>Special</strong> <strong>Paper</strong><br />
<strong>46</strong>, 25–30, 4 <strong>fi</strong> gures.<br />
Tectonic zones impose the borders (lineaments) <strong>of</strong> the Khibiny<br />
block structures. Under uplifting conditions the tectonic zones<br />
are de<strong>fi</strong> ned as weakened zones, where the rocks have undergone<br />
intensive exogenic processes. The geological features <strong>of</strong> the tectonic<br />
zones are the linear weathering crust and reworked preglacial<br />
deposits. The direct relationship among the spatial location<br />
<strong>of</strong> the valleys and tectonic zones illustrates that the multiordered<br />
river valleys are the main landscape feature <strong>of</strong> tectonic zones. In<br />
the interstream areas, indicators <strong>of</strong> the tectonic zones are seen as<br />
gorges, fractures, and low-amplitude ledges. Other indicators are<br />
zones <strong>of</strong> disintegrated rocks; glacial cirques and corries developed<br />
along tectonic zones; permafrost landforms; ground water<br />
discharges at the bottom <strong>of</strong> the graben-like gorges and along the<br />
ridges’ slopes; the <strong>fi</strong> rns in cirques and fractures; and linearly located<br />
soil and vegetation on the plateau-like divides.<br />
Key words (GeoRef Thesaurus, AGI): tectonics, block structures,<br />
lineaments, landforms, valleys, gorges, weathering, Khibiny<br />
Mountains, Kola Peninsula, Russian Federation.<br />
1 <strong>Geological</strong> Institute, Kola Science Centre, RAS, 14 Fersman<br />
St., 184200 Apatity, Russia<br />
E-mail: korsak@geoksc.apatity.ru,<br />
kolka@geoksc.apatity.ru<br />
25
<strong>Geological</strong> <strong>Survey</strong> <strong>of</strong> <strong>Finland</strong>, <strong>Special</strong> <strong>Paper</strong> <strong>46</strong><br />
Olga Korsakova and Vasili Kolka<br />
From numerous investigations (Onokhin 1975,<br />
Mel’nikov 2002), the block structure <strong>of</strong> the Khibiny<br />
massif and its high tectonic activity have been<br />
established. Seismic data derived from earthquake<br />
investigations (Mel’nikov 2002) and instrumental<br />
measurements indicate that the present-day tectonic<br />
uplifting reaches 2-4 mm/year in this area (Mesh-<br />
The Khibiny Mountains (highest point at 1200 m<br />
a.s.l) are situated in the central part <strong>of</strong> the Kola region<br />
(Fig. 1). It is a concentrically zoned multiphase<br />
intrusion composed <strong>of</strong> nepheline syenites and to a<br />
lesser amount, <strong>of</strong> ultrabasic alkaline rocks. The main<br />
orographic feature <strong>of</strong> the Khibiny Mountains is their<br />
Fig. 1. Location <strong>of</strong> the study<br />
area and scheme <strong>of</strong> the<br />
lineaments <strong>of</strong> the Khibiny<br />
Mountain massif (lineaments<br />
<strong>of</strong> 5th order are not included).<br />
1 – lineaments <strong>of</strong> the 1st order,<br />
2 – <strong>of</strong> the 2nd, 3 -<strong>of</strong> the 3rd, 4<br />
– <strong>of</strong> the 4th; 5 – the locations<br />
<strong>of</strong> observed weathering rocks,<br />
deposits (above-mentioned<br />
in the text are marked by<br />
numbers – saddle between<br />
Bolshoy Yuksporr and Maly<br />
Yuksporr plateaus (1); Apatity<br />
(2) and Pod’emny (3) cirques,<br />
valley <strong>of</strong> Poachvumjok (4) and<br />
Saami (5) Rivers, Juksporlak<br />
mountain pass (6), Bolshoy<br />
Vud’javr Lake (7)).<br />
26<br />
INTRODUCTION<br />
STUDY AREA<br />
cheryakov 1973). Tectonic zones impose the borders<br />
(lineaments) <strong>of</strong> the Khibiny block structures<br />
and they inherit numerous features <strong>of</strong> different<br />
forms. Near-surface parts <strong>of</strong> the Earth’s crust and<br />
land surface tectonic zones have landscape-geological<br />
indicators, manifested in weathered rocks and/or<br />
speci<strong>fi</strong> c landscape forms.<br />
table-like shape. Deep canyons, U-shaped and wide<br />
river valleys cut through the massif. Some <strong>of</strong> the<br />
mountains are capped with extensive plateaus, and<br />
encircled with cirques and steep slopes. The depth<br />
<strong>of</strong> the large cirques reaches 400 m. Cutting valleys<br />
can reach a depth <strong>of</strong> 800 m.
To establish the landscape and geological features<br />
<strong>of</strong> the tectonic zones in the Khibiny Mountains,<br />
morphometric, remote sensing and <strong>fi</strong> eldwork methods<br />
were applied to study the relief and composition<br />
<strong>of</strong> the rocks. Based on decoding <strong>of</strong> the aero- and<br />
satellite images, and <strong>of</strong> the morphometric analysis,<br />
a sketch map <strong>of</strong> the multi-ordered lineaments<br />
(tectonic zones) was compiled. Spatial position and<br />
order <strong>of</strong> lineaments was de<strong>fi</strong> ned in accordance with<br />
the order <strong>of</strong> the river valleys developing along the<br />
tectonic zones. During the <strong>fi</strong> eld work, a veri<strong>fi</strong> cation<br />
<strong>of</strong> distinguished lineaments was done and landscape<br />
features <strong>of</strong> tectonic zones beyond river valleys were<br />
de<strong>fi</strong> ned. Published data were also used.<br />
The Khibiny massif represents the ordered hierarchic<br />
system <strong>of</strong> structural elements, named as tectonic<br />
blocks. The block structure is conditioned by<br />
the development <strong>of</strong> the multirange discontinuities<br />
(from micr<strong>of</strong>racturing and contacts between the<br />
crystals to faults, extending hundreds kilometers).<br />
These discontinuities are caused by the interaction<br />
<strong>of</strong> the main geodynamic processes: continental<br />
drift, tectonic activity, and elastic resistance <strong>of</strong><br />
the Khibiny massif rock. These factors de<strong>fi</strong> ne the<br />
hierarchic <strong>fi</strong> eld <strong>of</strong> natural tensions and cause the<br />
destruction <strong>of</strong> the massif due to disconnection and<br />
displacement along the structural discontinuities <strong>of</strong><br />
different orders that segregate the Khibiny massif<br />
and form tectonic blocks <strong>of</strong> different ranges. The<br />
natural tensions and strength characteristics <strong>of</strong> the<br />
structural forms are determined by the dimension<br />
<strong>of</strong> the related volumes (i.e. by the dimension <strong>of</strong> the<br />
block structures <strong>of</strong> different orders).<br />
The rocks <strong>of</strong> northeast Fennoscandian Shield are<br />
under horizontal crustal compression because <strong>of</strong> adjacent<br />
ocean-fl oor spreading and continental drift.<br />
During the Mesozoic and Cenozoic, the tectonic<br />
uplift <strong>of</strong> the Khibiny massif resulted in the partial<br />
loss <strong>of</strong> horizontal compression existing deep in the<br />
Earth’s crust, leading to the extension <strong>of</strong> the rising<br />
rock masses. Due to these processes, non-uniformly<br />
scaled vertical cracks are revealed and the sheeting<br />
<strong>of</strong> thin rocks occurs in near-surface parts <strong>of</strong> the<br />
Earth’s crust. In other words, the tectonic zones<br />
form. Within these tectonic zones the rocks are<br />
loosened and shattered. The higher erosion intensity<br />
<strong>Geological</strong> <strong>Survey</strong> <strong>of</strong> <strong>Finland</strong>, <strong>Special</strong> <strong>Paper</strong> <strong>46</strong><br />
Landscape and geological features <strong>of</strong> tectonic zones in the Khibiny Mountains,<br />
Kola Peninsula, NW Russia<br />
METHODS<br />
RESULTS AND DISCUSSION<br />
The main theoretical prerequisite for distinguishing<br />
the tectonic zones is based on the assumption<br />
that the lineaments are surface expressions <strong>of</strong><br />
tectonics breaking the earth crust. In this case, the<br />
position <strong>of</strong> the lineaments is outlined mainly by the<br />
river valleys and other negative topographic forms.<br />
The river valleys are developed along the tectonic<br />
zones by selective erosion, for example, the order <strong>of</strong><br />
the river valley depends on the intensity and depth<br />
<strong>of</strong> the tectonic zone responsible for its formation. In<br />
the water divides, the lineaments are traced by the<br />
alternate negative topographic forms and are manifested<br />
in the rock composition. The <strong>fi</strong> ve orders <strong>of</strong><br />
the lineaments were established within the Khibiny<br />
Mountains (Korsakova et al. 2005; Fig. 1).<br />
occurs in the tectonic zones because disintegrated<br />
rock masses are subjected to denudation-accumulation<br />
processes.<br />
<strong>Geological</strong> features <strong>of</strong> tectonic zones are presented<br />
by the linear weathering crust, preglacial sediments<br />
(breccia, conglomerate, gravelite, clay), weathered<br />
and disintegrated hard rock that were observed in<br />
exposures and revealed by drilling under the glacial<br />
sediments during the prospecting and exploration<br />
within the Khibiny Mountains (Armand 1964,<br />
Mel’nikov 2002). Disintegrated hard rock contains<br />
schpreustein and epigenetic minerals – hydromica,<br />
nontronite, hydrohematite, limonite, chalcedony,<br />
anatase.<br />
Distribution <strong>of</strong> the disintegrated rocks, linear<br />
weathering crust and preglacial sediments is con<strong>fi</strong><br />
ned to the river valleys, gorges, hollows and saddles<br />
in interstream areas. For example, the linear zones<br />
<strong>of</strong> shattered rocks were found in the saddle between<br />
Bolshoy Yuksporr and Maly Yuksporr plateaus, in<br />
Apatity and Pod’emny cirques and in adjacent interstream<br />
areas along the deep saddles in the valley<br />
<strong>of</strong> Poachvumjok River. All these zones are traced<br />
by the lineaments <strong>of</strong> the 4th and 3rd orders (Fig. 1,<br />
points 1, 2, 3, 4, correspondingly). The 2nd order<br />
lineaments are seen in the intensively fractured and<br />
altered rock with limonitized apatite, underlying<br />
the glacial sediments and ancient thick diluvium in<br />
the valley <strong>of</strong> Saami river (Fig 1, point 5; Fig. 2),<br />
the fractured altered ryschorites revealed by drilling<br />
and trenching in Juksporlak mountain pass (Fig.<br />
1, point 6). The melteygite fragments with gouges<br />
27
<strong>Geological</strong> <strong>Survey</strong> <strong>of</strong> <strong>Finland</strong>, <strong>Special</strong> <strong>Paper</strong> <strong>46</strong><br />
Olga Korsakova and Vasili Kolka<br />
Fig. 2. <strong>Geological</strong> section on the valley <strong>of</strong> the Saami River (after Armand, 1964; location is shown on Fig. 1 as point 5). 1 - till, 2<br />
- glaci<strong>of</strong>l uvial sand (<strong>fi</strong> ne and middle size grains) with pebbles and boulders, 3 - slide eluvium rock, 4 - intensively fractured and<br />
altered rock with limonitized apatite, 5 - bedrock.<br />
Fig. 3. Landscape features <strong>of</strong> tectonic zones on the interstream areas expressed in the relief and ground: a - graben-like gorges,<br />
fractures; b - low-amplitude ledges <strong>of</strong> topographic surface, c - linear zones <strong>of</strong> highly disintegrated rocks, d - permafrost landforms<br />
(solifl uction bands).<br />
28
<strong>of</strong> clayey rocks were found in the drill core at the<br />
bottom <strong>of</strong> the Bolshoy Vud’javr Lake, situated along<br />
the lineament <strong>of</strong> the 1st order (Fig. 1, point 7).<br />
The available geological data indicate that tectonic<br />
zones are expressed as linear segments <strong>of</strong> disintegrated<br />
rocks. They coincide with negative land<br />
forms, which represent lineaments (block divides or<br />
tectonic zone) <strong>of</strong> different orders.<br />
The landscape features <strong>of</strong> tectonic zones are<br />
variably expressed on the surface. The link between<br />
the negative topographic forms and the fracture<br />
system <strong>of</strong> the alkaline rocks through the intermediate<br />
disintegrated zones and the linear weathering<br />
crust explains the radial-concentric stream pattern<br />
within the Khibiny Mountains The direct relationship<br />
between the spatial location <strong>of</strong> the valleys and<br />
tectonic zones is con<strong>fi</strong> rmed by model constructions<br />
(Mel’nikov 2002, Korsakova et al. 2005) allows<br />
multiordered stream valleys to be considered as<br />
their main landform feature.<br />
The interstream areas in Khibiny Mountains are<br />
seen mainly in the plateau-lake surfaces. The plain<br />
usage <strong>of</strong> morphometric method is able to only ap-<br />
<strong>Geological</strong> <strong>Survey</strong> <strong>of</strong> <strong>Finland</strong>, <strong>Special</strong> <strong>Paper</strong> <strong>46</strong><br />
Landscape and geological features <strong>of</strong> tectonic zones in the Khibiny Mountains,<br />
Kola Peninsula, NW Russia<br />
proximately determine the lineaments position here.<br />
In this case, the indicators <strong>of</strong> tectonic zones are precisely<br />
identi<strong>fi</strong> ed during <strong>fi</strong> eld investigations.<br />
The most evident indicators <strong>of</strong> tectonic zones<br />
within the interstream areas are the negative structural<br />
forms and relief elements (graben-like gorges,<br />
fractures (Fig. 3a) and low-amplitude ledges <strong>of</strong><br />
topographic surface (Fig. 3b)). As a rule, these indicators<br />
are characteristics <strong>of</strong> the block divides <strong>of</strong> the<br />
lowest (the 5th) order. The structural forms <strong>of</strong> higher<br />
order tectonic zones have a larger set <strong>of</strong> landscape<br />
features. During the <strong>fi</strong> eld investigation, the different<br />
landscape features <strong>of</strong> tectonic zones were also<br />
established: the linear zones <strong>of</strong> highly disintegrated<br />
rocks in the plateau-like interstream areas (Fig. 3c);<br />
permafrost landforms (stone polygons, solifl uction<br />
bands (Fig. 3d)) spatially con<strong>fi</strong> ned to linear zones <strong>of</strong><br />
highly disintegrated rocks; ground water discharges<br />
at the bottom <strong>of</strong> the graben-like gorges and along<br />
the slopes <strong>of</strong> ridges (Fig. 4a); the linearly localized<br />
soil and speci<strong>fi</strong> c vegetation (Fig. 4b); the <strong>fi</strong> rns forming<br />
in ancient cirques and in the younger grabens<br />
and fractures (Fig. 4c).<br />
Fig. 4. Landscape features <strong>of</strong> tectonics zones on the interstream areas expressed in the peculiarities <strong>of</strong> waters, soil, vegetation: a<br />
- ground water discharges at the bottom <strong>of</strong> the graben-like gorge, b - linear localization <strong>of</strong> the soil and vegetation, c - <strong>fi</strong> rns in the<br />
younger graben.<br />
29
<strong>Geological</strong> <strong>Survey</strong> <strong>of</strong> <strong>Finland</strong>, <strong>Special</strong> <strong>Paper</strong> <strong>46</strong><br />
Olga Korsakova and Vasili Kolka<br />
Subjected to the prevailing uplifting conditions, the<br />
tectonic zones are de<strong>fi</strong> ned as weakened zones where<br />
the rocks are intensively affected by exogenic processes.<br />
Location <strong>of</strong> the zones de<strong>fi</strong> nes the development<br />
<strong>of</strong> the majority <strong>of</strong> negative landforms in the<br />
Khibiny Mountains. The main geological features<br />
<strong>of</strong> the tectonic zones are the linear weathering crust,<br />
altered preglacial sediments con<strong>fi</strong> ned to negative<br />
landforms. The manner and localization <strong>of</strong> exogenic<br />
This work was supported by the Russian Foundation<br />
for Basic Research (project 05-05-97501), the<br />
Research Program <strong>of</strong> the Presidium <strong>of</strong> the Russian<br />
Armand, A. D. 1964. Evolution <strong>of</strong> the relief <strong>of</strong> Khibiny and<br />
Prikhibin’e plain. <strong>Geological</strong> Institute <strong>of</strong> Kola Science<br />
Centre. 244 p. (in Russian)<br />
Korsakova, O., Savchenko, S. & Kolka, V. 2005. Morphotectonic<br />
structure and tension distribution in the Khibiny<br />
Mountain massif, Kola Peninsula, NW Russia. In: Kolka,<br />
V. & Korsakova, O. (eds.) Quaternary geology and landforming<br />
processes. Proceedings <strong>of</strong> the International Field<br />
Symposium, Kola Peninsula, NW Russia, September 4–9.<br />
Kola Science Centre RAS, 30–32.<br />
30<br />
CONCLUSIONS<br />
ACKNOWLEDGEMENTS<br />
REFERENCES<br />
processes (erosion, nivation, slope outwash, permafrost<br />
solifl uction and others) are also de<strong>fi</strong> ned by the<br />
location <strong>of</strong> tectonic zones. The tectonic zones have<br />
geological, geomorphological, hydrogeological,<br />
edaphic and geobotanic indicators due to universal<br />
interrelations between natural components such as<br />
hard rocks, sediments, topography, waters, soils,<br />
and vegetation.<br />
Academy <strong>of</strong> Sciences ”Evolution <strong>of</strong> the relief and<br />
deposits <strong>of</strong> the Kola Region in Holocene”.<br />
Mel’nikov, N. (ed.) 2002. Seismicity in mining. Kola Science<br />
Centre RAS. 325 p. (in Russian)<br />
Meshcheryakov, Yu. A. (ed.) 1973. The Map <strong>of</strong> the present-day<br />
vertical movements <strong>of</strong> East Europe crust, scale 1:2500000.<br />
Moscow.<br />
Onokhin, F. M. 1975. Peculiarities <strong>of</strong> the structure <strong>of</strong> the Khibiny<br />
massif and <strong>of</strong> the apatite-nepheline deposits. Leningrad.<br />
106 p. (in Russian)
Applied Quaternary research in the central part <strong>of</strong> glaciated terrain,<br />
edited by Peter Johansson and Pertti Sarala.<br />
<strong>Geological</strong> <strong>Survey</strong> <strong>of</strong> <strong>Finland</strong>, <strong>Special</strong> <strong>Paper</strong> <strong>46</strong>, 31–38, 2007.<br />
STRUCTURAL CHARACTERISTICS OF PLEISTOCENE<br />
DEPOSITS IN NORTH LITHUANIA<br />
by<br />
Danguole . Karmaziene . 1 , Bronislavas Karmaza 2 and Valentinas Baltr0nas 2<br />
Karmaziene . , D., Karmaza, B. & Baltr0nas, V. 2007. Structural<br />
characteristics <strong>of</strong> Pleistocene deposits in North Lithuania.<br />
Applied Quaternary research in the central part <strong>of</strong> glaciated terrain.<br />
<strong>Geological</strong> <strong>Survey</strong> <strong>of</strong> <strong>Finland</strong>, <strong>Special</strong> <strong>Paper</strong> <strong>46</strong>, 31–38,<br />
6 <strong>fi</strong> gures, 1 table.<br />
Pleistocene till and intertill deposits were studied in the Upper<br />
Devonian dolomite <strong>of</strong> Petraši0nai and Klovainiai (Pakruojis district)<br />
quarries in northern Lithuania. The sections were described<br />
in detail, the orientation and inclination <strong>of</strong> the long axes <strong>of</strong> gravel<br />
and pebbles were measured, and the samples for petrographic<br />
and grain size analysis were taken. The grain size <strong>of</strong> intertill silt<br />
as well as spore and pollen composition was determined. The<br />
dating was done using the OSL method. The thickness <strong>of</strong> the<br />
deposits studied in the Petraši0nai area is up to 16 m and this<br />
sediment sequence was subdivided into three complexes. The<br />
Middle Pleistocene subglacial complex was formed by a glacier,<br />
which accumulated non-uniformly mixed local (Upper Devonian)<br />
clastic material and material originally from more remote<br />
northwestern areas. Basin sediments aged 86–81 thousand years<br />
(by OSL) are <strong>of</strong> special interest. They are underlying a glacial<br />
complex <strong>of</strong> the Baltija stage <strong>of</strong> the Nemunas (Weichselian) Ice<br />
Age. The complex is composed <strong>of</strong> tills accumulated in two phases<br />
by a glacier that was advancing from the north. The complex <strong>of</strong><br />
tills differ from older tills because they have a lower content <strong>of</strong><br />
imported clastic material and a higher content <strong>of</strong> local material.<br />
Key words (GeoRef Thesaurus, AGI): glacial features, sediments,<br />
till, stratigraphy, grain size, Pleistocene, Lithuania.<br />
1 <strong>Geological</strong> <strong>Survey</strong> <strong>of</strong> Lithuania, S. Konarskio 35, 03123<br />
Vilnius, Lithuania<br />
2 Institute <strong>of</strong> Geology and Geography, T. Ševc v<br />
enkos 13, 03223<br />
Vilnius, Lithuania<br />
E-mail: danguole.karmaziene@lgt.lt, karmaza@geo.lt,<br />
baltrunas@geo.lt<br />
31
<strong>Geological</strong> <strong>Survey</strong> <strong>of</strong> <strong>Finland</strong>, <strong>Special</strong> <strong>Paper</strong> <strong>46</strong><br />
Danguol Karmazien, Bronislavas Karmaza and Valentinas Baltrünas<br />
The North Lithuanian region has been known as a<br />
zone <strong>of</strong> dominant glacial erosion where the Quaternary<br />
sediment cover is relatively thin (up to 40<br />
m in palaeoincisions) and has a speci<strong>fi</strong> c structure<br />
(Bucevic v<br />
i0te . et al. 1992, and others). Previous research<br />
has shown that the character <strong>of</strong> glacial erosion<br />
and glacial material transportation are refl ected<br />
in the structure <strong>of</strong> Pleistocene deposits, particularly<br />
in tills. The aim <strong>of</strong> the present paper is to report<br />
new information on structural peculiarities <strong>of</strong> North<br />
Lithuanian Pleistocene strata. The new data were<br />
obtained using different methods <strong>of</strong> studying Pleistocene<br />
deposits in the adjacent dolomite quarries<br />
near the Petraši0nai and the Klovainiai boroughs<br />
in the Pakruojis District (Fig. 1). These quarries<br />
are 7–8 km away from each other. About 5–6 km<br />
north <strong>of</strong> the Petraši0nai quarry, is the boundary <strong>of</strong><br />
the North Lithuanian Phase <strong>of</strong> the Baltic Stage and<br />
is marked by a distinct morainic Linkuva ridge.<br />
Macroscopic description, graphic <strong>fi</strong> xation and photography<br />
<strong>of</strong> the quarry walls were used to examine<br />
the Pleistocene succession the study site. Granulometric<br />
analysis <strong>of</strong> intertill silt served as a basis for<br />
stratigraphic classi<strong>fi</strong> cation <strong>of</strong> the Pleistocene strata.<br />
The following fractions were determined: 5–2; 2–1;<br />
1–0.5; 0.5–0.25; 0.25–0.1; 0.1–0.05; 0.05–0.01;<br />
0.01–0.005; 0.005–0.002; 0.002–0.001 and
THE STRUCTURE OF THE PLEISTOCENE DEPOSITS OF THE REGION<br />
The Pleistocene sediments in the central part <strong>of</strong><br />
northern Lithuania are overlying the Upper Devonian<br />
dolomite, marl, limestone, clay, and gypsum<br />
layers. The varying resistance <strong>of</strong> these deposits to<br />
mechanical and chemical impacts as well as the different<br />
bedding and tectonic conditions were responsible<br />
for the different scale <strong>of</strong> erosion in various<br />
areas <strong>of</strong> the region. According to the available data,<br />
the palaeorelief is characterized by uplifts, solitary<br />
closed dips and troughs, and long and narrow palaeoincisions<br />
(Šliaupa 1997, 2004). A trough-shaped<br />
meridional declension whose axis extends across<br />
Vaškai towards Panev≥ys stands out as a prominent<br />
feature. The minutely investigated sections <strong>of</strong><br />
the Petraši0nai and Klovainiai quarries are on the<br />
western slope <strong>of</strong> the declension. The sub-latitudinal<br />
Palaeom0ša incision is situated north <strong>of</strong> the<br />
Petraši0nai and Klovainiai sections.<br />
According to the available borehole data,<br />
the Pleistocene deposits are composed <strong>of</strong> three<br />
complexes <strong>of</strong> glaciogenic sediments (Fig. 2). In<br />
Fig. 2. Cross-section <strong>of</strong> the<br />
Petraši0nai area Pleistocene<br />
deposits.<br />
<strong>Geological</strong> <strong>Survey</strong> <strong>of</strong> <strong>Finland</strong>, <strong>Special</strong> <strong>Paper</strong> <strong>46</strong><br />
Structural characteristics <strong>of</strong> Pleistocene deposits in North Lithuania<br />
the stratigraphic scheme used by the Lithuanian<br />
<strong>Geological</strong> <strong>Survey</strong>, these glacial deposits are attributed<br />
to the Middle Pleistocene Medininkai and the<br />
Upper Pleistocene Upper Nemunas ice ages (subformations)<br />
(Lietuvos … 1994). The Pleistocene<br />
strata are rich in intertill deposits. The glacial deposits<br />
<strong>of</strong> the Medininkai sub-formation are spread<br />
locally in the region, overlie Upper Devonian rocks<br />
and are represented mainly by brown sandy loam.<br />
The till under consideration is very compact. Its<br />
greatest thickness (38 m) was measured in a palaeoincision<br />
24 km NW <strong>of</strong> Pakruojis, with the prevailing<br />
thickness being 10–15 m. In some places it<br />
is only 3–5 m. The till left by the Medininkai glacier<br />
includes some blocks <strong>of</strong> Devonian rocks. The thickest<br />
block (21 m) was found in a borehole 28 km<br />
north <strong>of</strong> Pakruojis.<br />
Glacial deposits <strong>of</strong> the Upper Nemunas Formation<br />
cover the whole territory. These deposits overlie<br />
the Medininkai Formation or, in rarer cases, Upper<br />
Devonian rocks. At some places, the glacial depos-<br />
33
<strong>Geological</strong> <strong>Survey</strong> <strong>of</strong> <strong>Finland</strong>, <strong>Special</strong> <strong>Paper</strong> <strong>46</strong><br />
Danguol Karmazien, Bronislavas Karmaza and Valentinas Baltrünas<br />
its <strong>of</strong> the Upper Nemunas underlie glaci<strong>of</strong>l uvial,<br />
lacustrine or other types <strong>of</strong> sediments. The greatest<br />
thickness <strong>of</strong> this formation (34 m) was measured in<br />
Fig. 3. Cross-section <strong>of</strong><br />
Petraši0nai-2 Pleistocene deposits<br />
in the southwestern part <strong>of</strong> the<br />
dolomite quarry (24-08-2002).<br />
34<br />
an incision near the ˘eimelis borough. The deposits<br />
are mostly represented by greyish brown or brown<br />
sandy loam.<br />
THE STRUCTURE OF PLEISTOCENE SEDIMENTS IN THE<br />
PETRAŠI¥NAI AREA<br />
The pre-Quaternary surface in this area is composed<br />
<strong>of</strong> the dolomite <strong>of</strong> the Upper Devonian Stipinai Formation<br />
with interlayers <strong>of</strong> marl and clay. Its absolute<br />
altitude ranges between 39 and 58 m a.s.l. The<br />
maximum thickness <strong>of</strong> the Pleistocene deposits (14<br />
m) was measured in the western part <strong>of</strong> the area, and<br />
the minimum thickness (1-2 m) was found in the<br />
eastern part. The thickness <strong>of</strong> Pleistocene deposits<br />
is inversely proportional to the altitude <strong>of</strong> pre-Quaternary<br />
rocks (the correlation coef<strong>fi</strong> cient -0.81). The<br />
greatest thickness <strong>of</strong> these deposits is usually measured<br />
in the surface depressions <strong>of</strong> Devonian rocks.<br />
The lower (older) till complex has a triple structure.<br />
In the lower part, it is composed <strong>of</strong> brown<br />
clayey solid till with a poorly expressed orientation<br />
<strong>of</strong> the long axes <strong>of</strong> gravel and pebbles. In the middle<br />
part <strong>of</strong> the complex (up to 1.5 m thick), brown<br />
clayey till passes into grey less clayey till with a<br />
greater mixture <strong>of</strong> gravel (Fig. 3). In the upper part<br />
<strong>of</strong> the complex, grey till (characterized by its mostly<br />
NW–SE orientation <strong>of</strong> the long axes <strong>of</strong> gravel and<br />
pebbles) merges into similar brown till. According<br />
to research data on intertill deposits, this till complex<br />
is preliminarily attributed to the Middle Pleistocene<br />
Medininkai sub-formation.<br />
The intertill complex in the surroundings <strong>of</strong> the<br />
Petraši0nai quarry is widespread, lithologically diverse<br />
but thin (up to 2 m) (Fig. 4). Yellowish grey<br />
and greyish yellow silt, sandy silt and <strong>fi</strong> ne-grained<br />
silt sand in places underlie a layer <strong>of</strong> varves up to<br />
1 m in thickness (Fig. 5). Occasionally, the varves<br />
are disordered and have patches <strong>of</strong> gravel and pebbles.<br />
The brown and dark brown solid till in the<br />
Petraši0nai-1 section (north western wall <strong>of</strong> the<br />
Petraši0nai quarry) underlies compact, subhorizontally<br />
strati<strong>fi</strong> ed grey silt 0.45 m thick, which is<br />
greyish brown in the lower part. The grey silt underlies<br />
a 0.8 m thick layer <strong>of</strong> brownish grey slanted,<br />
<strong>fi</strong> nely strati<strong>fi</strong> ed silt with a greater mixture <strong>of</strong> sand<br />
(especially in the middle part). The upper part <strong>of</strong>
the complex is composed <strong>of</strong> 0.50 m thick greyish<br />
yellow indistinctly horizontal strati<strong>fi</strong> ed silt with an<br />
even greater content <strong>of</strong> sand.<br />
Pollen analysis <strong>of</strong> the 1.75 m thick silt layer has<br />
shown that pollen is well preserved. Its concentration<br />
is small. At the time <strong>of</strong> silt and sandy silt<br />
Fig. 4. Cross-section <strong>of</strong><br />
Petraši0nai-1 Pleistocene<br />
deposits in the southwestern<br />
part <strong>of</strong> the dolomite<br />
quarry (24-08-2002): a<br />
– location <strong>of</strong> Petraši0nai-1<br />
and Petraši0nai-2 crosssections;<br />
b – photograph <strong>of</strong><br />
intermorainic sediments;<br />
c – grain-size composition<br />
in separate parts (I, II, III)<br />
<strong>of</strong> intermorainic sediments;<br />
d – photograph <strong>of</strong><br />
Devonian dolomite contact<br />
with till. Other explanations<br />
as in Fig.3.<br />
Fig. 5. Photograph <strong>of</strong> the intermorainic varved clay.<br />
Table 1. Results <strong>of</strong> OSL dating <strong>of</strong> intertill sediments in Petraši0nai-1 section.<br />
Sample<br />
No<br />
Depth, m Laboratory<br />
code<br />
U<br />
(ppm)<br />
<strong>Geological</strong> <strong>Survey</strong> <strong>of</strong> <strong>Finland</strong>, <strong>Special</strong> <strong>Paper</strong> <strong>46</strong><br />
Structural characteristics <strong>of</strong> Pleistocene deposits in North Lithuania<br />
Th<br />
(ppm)<br />
deposition, the climate was cold and the plant cover<br />
poor. The spores and pollen spectra provided no basis<br />
for a more precise biostratigraphcal correlation.<br />
According to the OSL dating results, the deposition<br />
took place 86.1–81.6 thousand years ago (Table 1).<br />
K<br />
(%)<br />
D ext sed<br />
(µGy/a)<br />
P s<br />
(Gy)<br />
OSL-age,<br />
ka<br />
1 1.3–1.4 TLN 1507-093 1.00 3.70 1.76 2150 232.50 81.6±6.5<br />
2 1.7–1.8 TLN 1508-093 1.20 3.36 1.77 2185 242.00 84.4±13.7<br />
3 2.3–2.4 TLN 1509-093 0.99 3.92 1.93 2212 248.00 86.1±9.3<br />
35
<strong>Geological</strong> <strong>Survey</strong> <strong>of</strong> <strong>Finland</strong>, <strong>Special</strong> <strong>Paper</strong> <strong>46</strong><br />
Danguol Karmazien, Bronislavas Karmaza and Valentinas Baltrünas<br />
The upper (Nemunas Glacial <strong>of</strong> the Baltic Stage)<br />
till complex can be divided into two characteristic<br />
units. The thickness <strong>of</strong> the brown clayey till unit is<br />
up to 3 m (Fig. 3). Somewhere, together with intertill<br />
varves, it occurs at a lower hypsometric level. The<br />
petrographic composition <strong>of</strong> gravel and pebbles in<br />
till is characterized by the prevalence <strong>of</strong> local clastic<br />
material (Devonian dolomites and limestones) and<br />
a smaller portion <strong>of</strong> imported clastic material (Ordovician<br />
and Silurian limestones). The long axes <strong>of</strong><br />
gravel and pebbles are oriented N–S.<br />
36<br />
FORMATION FEATURES OF PLEISTOCENE SEDIMENTS:<br />
DISCUSSION<br />
According to the presented material, the greatest<br />
part <strong>of</strong> North Lithuanian Pleistocene sediments is<br />
composed <strong>of</strong> glacial deposits. The structure <strong>of</strong> these<br />
sediments, the orientation and inclination <strong>of</strong> the long<br />
axes <strong>of</strong> gravel and pebbles in till and sometimes the<br />
variation <strong>of</strong> the index <strong>of</strong> relative entropy <strong>of</strong> granulometric<br />
composition best refl ects the dynamic conditions<br />
<strong>of</strong> sedimentation. The lower (older) till <strong>of</strong> the<br />
Petraši0nai quarry is heterogeneous. The dominant<br />
orientation <strong>of</strong> the long axes <strong>of</strong> clastic material is<br />
NW–SE, with the typical inclination being SE. The<br />
typical orientation and inclination are absent only<br />
in the lower part <strong>of</strong> the till. The relative entropy is<br />
low, showing a poor mixing <strong>of</strong> till material (fraction<br />
The thin (up to 30-40 m) Pleistocene bed in the<br />
North Lithuanian region is subdivided into three<br />
lithostratigraphic complexes. These are: the lower<br />
glacial complex <strong>of</strong> the Middle Pleistocene (Medininkai<br />
sub-formation) or Upper Pleistocene (Lower<br />
Nemunas sub-formation), the overlying intertill<br />
sediments aged 86-81 thousand years and the upper<br />
till complex <strong>of</strong> the Baltic Stage <strong>of</strong> the last Ice Age.<br />
The lower (older) glacial complex in the pre-<br />
Quaternary declensions was formed in the interface<br />
between a glacier advancing from the north and a<br />
The authors are thankful to Dr. A. Molodkov, Head<br />
<strong>of</strong> the Laboratory <strong>of</strong> Quaternary Research, Institute<br />
<strong>of</strong> Geology <strong>of</strong> Tallinn Technical University, and<br />
palynologist A. Grigien from the Lithuanian Geo-<br />
Baltr0nas, V., Karmaza, B. & Karmazien, D. 2005. Pleistoceno<br />
nuogul< sandaros ir formavimosi ypatybs Šiaurs<br />
Lietuvoje. Geologija 52, 22–33. (in Lithuanian with English<br />
and Russian summary)<br />
Bucevic v<br />
i0t, S., Dobkevic v<br />
ius, M. & Marcinkevic v<br />
ius, V. 1992.<br />
Rajono geologins ir hidrogeologins s_lygos. Karstinio<br />
rajono gamtin ir technogenin situacija. Geologija 13, 30–<br />
49. (in Lithuanian with English and Russian summary)<br />
Gaigalas, A. 1971. Texture, structure and the genetic varieties<br />
<strong>of</strong> the ground-moraines (in Russian). In: Gudelis, V.<br />
& Gaigalas, A. (eds.) Structure and morphogenesis <strong>of</strong> the<br />
Middle Lithuanian morainic plain. Mintis, 28–87.<br />
<strong>Geological</strong> <strong>Survey</strong> <strong>of</strong> <strong>Finland</strong>, <strong>Special</strong> <strong>Paper</strong> <strong>46</strong><br />
Structural characteristics <strong>of</strong> Pleistocene deposits in North Lithuania<br />
CONCLUSIONS<br />
ACKNOWLEDGEMENTS<br />
REFERENCES<br />
pre-Quaternary surface inclined to the north and the<br />
east.<br />
The Upper Pleistocene glacial complex <strong>of</strong> the<br />
Baltic Stage <strong>of</strong> the last Ice Age is composed <strong>of</strong><br />
strata accumulated during two recessions <strong>of</strong> the glacier<br />
that advanced from the north. The strata differ<br />
from the older tills in a lower content <strong>of</strong> imported<br />
clastic material and a higher content <strong>of</strong> local excavated<br />
material. The strata differ among themselves<br />
in granulometric composition and sorting.<br />
logical <strong>Survey</strong> for assistance in analysing the sections<br />
<strong>of</strong> the North Lithuanian Pleistocene deposits<br />
and summarizing the research data.<br />
Lietuvos kvartero stratigra<strong>fi</strong> jos schema. 1994. Valstybini<<br />
geologini tyrim< taisykls ir metodins rekomendacijos.<br />
Lietuvos geologijos tarnyba. 17 p. (in Lithuanian)<br />
Satk0nas, J. 1999. The Upper Pleistocene stratigraphy and<br />
geochronology in Lithuania. Litosfera 3, 43–57.<br />
Šliaupa, A. 1997. The sub-Quaternary reljef <strong>of</strong> Lithuania and<br />
<strong>of</strong> adjacent territories. Litosfera 1, <strong>46</strong>–57.<br />
Šliaupa, A. 2004. Prekvartero uolien< paviršius. Lietuvos<br />
˘ems gelmi< raida ir ištekliai (ats. red. Baltr0nas, V.).<br />
˘urnalo “Litosfera” leidinys, 254–260. (in Lithuanian with<br />
English summary)<br />
37
Applied Quaternary research in the central part <strong>of</strong> glaciated terrain,<br />
edited by Peter Johansson and Pertti Sarala.<br />
<strong>Geological</strong> <strong>Survey</strong> <strong>of</strong> <strong>Finland</strong>, <strong>Special</strong> <strong>Paper</strong> <strong>46</strong>, 39–<strong>46</strong>, 2007.<br />
PERIGLACIAL CONDITIONS AND DEGLACIATION IN SOUTHERN<br />
LITHUANIA DURING THE LAST ICE AGE<br />
by<br />
Valentinas Baltr0nas 1,2 , K´stutis Švedas 2 and Violeta Pukelyt 1<br />
Baltr0nas, V., Švedas, K. & Pukelyt, V. 2007. Periglacial conditions<br />
and deglaciation in Southern Lithuania during the Last Ice<br />
Age. Applied Quaternary research in the central part <strong>of</strong> glaciated<br />
terrain. <strong>Geological</strong> <strong>Survey</strong> <strong>of</strong> <strong>Finland</strong>, <strong>Special</strong> <strong>Paper</strong> <strong>46</strong>, 39–<strong>46</strong>,<br />
4 <strong>fi</strong> gures, 2 tables.<br />
The southern Lithuanian territory is composed <strong>of</strong> glaciogenic<br />
deposits <strong>of</strong> different age and polygenetic origin. The recurring<br />
permafrost and cryogenic structures in the ground were an important<br />
phenomenon taking place in the southeastern periglacial<br />
zone. Intensive slope transformation took place together with<br />
permafrost degradation and deposition <strong>of</strong> the loess-like sediment<br />
cover. These events were followed by soil formation processes.<br />
Sediment cover is composed <strong>of</strong> three to four lithocomplexes that<br />
correlate with palaeogeographic stages <strong>of</strong> the Last Ice Age. The<br />
boundary <strong>of</strong> the Gr0da (Brandenburg) stage glaciation correlates<br />
with the maximum <strong>of</strong> the Late Nemunas (Late Weichselian) and<br />
is conditionally drawn along the poorly preserved and sporadically<br />
distributed abraded hills. The marginal hilly formations,<br />
left by the glacier <strong>of</strong> the ˘iogeliai (Frankfurt) phase, are clearly<br />
marked by the high moraine ridge on the right bank <strong>of</strong> Merkys.<br />
The speci<strong>fi</strong> c character <strong>of</strong> Baltija (Pomeranian) deglaciation was<br />
predetermined by the wide (30-40 m), dead ice elevation and the<br />
Simnas-Balbieriškis-Staklišks glaciolacustrine basin, dammed<br />
between the South Lithuania Upland and the younger South<br />
Lithuanian glacier. Its excess water eroded a great part <strong>of</strong> the<br />
Middle Nemunas valley between Punia and Merkin in a southerly<br />
direction. The middle part <strong>of</strong> the territory, extending from<br />
the southwest to the northeast is a part <strong>of</strong> Vilnius- Warsaw-Berlin<br />
Urstromtal.<br />
Key words (GeoRef Thesaurus, AGI): glacial geology, paleogeography,<br />
periglacial environment, deglaciation, glacial features,<br />
sediments, Pleistocene, Lithuania.<br />
1 Department <strong>of</strong> Quaternary Research, Institute <strong>of</strong> Geology and<br />
Geography, Vilnius, Lithuania<br />
2 Department <strong>of</strong> General Geography, Vilnius Pedagogical<br />
University, Vilnius, Lithuania<br />
E-mail: baltrunas@geo.lt<br />
39
<strong>Geological</strong> <strong>Survey</strong> <strong>of</strong> <strong>Finland</strong>, <strong>Special</strong> <strong>Paper</strong> <strong>46</strong><br />
Valentinas Baltrünas, K´stutis Švedas and Violeta Pukelyt<br />
Many publications have been dedicated to issues <strong>of</strong><br />
the Late Pleistocene palaeogeography in Lithuania.<br />
Some <strong>of</strong> them are theoretical in nature and are con<strong>fi</strong><br />
ned to general and schematic palaeogeographical<br />
characteristics <strong>of</strong> the region. The publications served<br />
both as a theoretical and methodological basis for<br />
more recent investigations (Basalykas 1965, Dvareckas<br />
1993). Some other studies were more speci<strong>fi</strong> c<br />
with a special method used for analyzing diverse<br />
geologic and geomorphologic objects and with fundamental<br />
conclusions substantially contributing to<br />
the knowledge <strong>of</strong> the history <strong>of</strong> palaeogeographic<br />
conditions <strong>of</strong> the time (Basalykas et al. 1984, Dvareckas<br />
& Diceviπien 1987, Kabailien 1990, Kon-<br />
40<br />
INTRODUCTION<br />
dratien 1996, Komarovsky 1996, Satk0nas 1999,<br />
Gaigalas 2001, Švedas 2001, Švedas et al. 2004).<br />
Furthermore, it should be recognized that a composite<br />
evaluation and more accurate cartographic depiction<br />
<strong>of</strong> the palaeogeographical conditions were<br />
not fully realized, and the correlation <strong>of</strong> Pleistocene<br />
stratigraphical events in Lithuania was not associated<br />
with changes in the periglacial conditions.<br />
The purpose <strong>of</strong> this article is to summarise previous<br />
investigations on the geology and palaeogeography<br />
<strong>of</strong> the last glaciation and soil permafrost<br />
structures in periglacial areas in southern Lithuania<br />
to obtain a comprehensive model <strong>of</strong> the evolution <strong>of</strong><br />
the area (Fig. 1).<br />
Fig. 1a) Location map <strong>of</strong> the studied area, b) Deglaciation <strong>of</strong> the Last (Weichselian, Nemunas) Glaciation in the<br />
South Lithuania (after Gaigalas (2001)): G – Gr0da (Brandenburg) stage, ˘ – ˘iogeliai (Frankfurt) phase, B (EL)<br />
– Baltija (Pomeranian) stage (East-Lithuanian phase), SL – South-Lithuanian phase, ML – Middle-Lithuanian<br />
phase, NL – North-Lithuanian phase; c) Geomorphological regions (compiled according to Atlas <strong>of</strong> Lithuania<br />
(Drobnys 1981): 1 – Middle Nemunas Plateau, 2 – South Lithuania Upland, 3 – Dainava Plain, 4 – Eišišks<br />
Plateau, 5 – Medininkai Upland.
Pleistocene deposits in southern Lithuania have<br />
been identi<strong>fi</strong> ed and described using granulometric,<br />
mineralogical (in fractions 0.2–0.1 and 0.1–0.05<br />
mm), petrographic (fractions 30–10, 10–5, and<br />
5–2 mm), and geochemical (fraction
<strong>Geological</strong> <strong>Survey</strong> <strong>of</strong> <strong>Finland</strong>, <strong>Special</strong> <strong>Paper</strong> <strong>46</strong><br />
Valentinas Baltrünas, K´stutis Švedas and Violeta Pukelyt<br />
segregation. A great variability <strong>of</strong> lith<strong>of</strong>acies and<br />
involutions <strong>of</strong> cryogenic origin are characteristic <strong>of</strong><br />
this lithocomplex.<br />
The intermediate lithocomplex (about 2 m in<br />
thickness) is also composed <strong>of</strong> <strong>fi</strong> ne-grained sandy<br />
loam-like material. It abounds in stripes <strong>of</strong> iron<br />
oxide accumulations, involution structures, and different<br />
size <strong>of</strong> pseudomorphoses, formed in places <strong>of</strong><br />
former ice wedges.<br />
The upper lithocomplex is composed <strong>of</strong> unstructured<br />
<strong>fi</strong> ne-grained sands, sandy loam and silt with<br />
sparse gravel beds with a thickness <strong>of</strong> 1–2 m. The<br />
42<br />
Petrographic groups<br />
Medininkai Upland Eišišks<br />
Plateau<br />
involutions are not very distinct and the pseudomorphoses<br />
are sparse. The upper lithocomplex is<br />
covered by the modern soil.<br />
The high amount <strong>of</strong> <strong>fi</strong> ne-grained material in the<br />
lithocomplexes (fraction 0.1–0.05 mm – 48.4%,<br />
0.05–0.01 mm – 23.5%, clay particles (< 0.01 mm)<br />
– from 9.8% to 18.4%) implies a strong infl uence <strong>of</strong><br />
cryogenic processes on the soils. A recurring cycle<br />
<strong>of</strong> freezing and thawing accelerates the rock weathering<br />
rates. As a result, the silt and clay particles accumulate<br />
at high rates, and the soils become similar<br />
to loess.<br />
Table 1. Arithmetical means (X, %), variation coef<strong>fi</strong> cients (v, %) and petrographic coef<strong>fi</strong> cients (D/L, S/C) <strong>of</strong> gravel and pebble<br />
petrographic groups <strong>of</strong> surface till in southern Lithuania. Petrographic coef<strong>fi</strong> cients: D/L – dolomite/Ordovician and Silurian<br />
limestone; C/S – total <strong>of</strong> crystalline rocks/total <strong>of</strong> sedimentary rocks.<br />
Geomorphological regions<br />
Žiogeliai zone <strong>of</strong><br />
South<br />
Lithuania<br />
Upland<br />
Baltija zone <strong>of</strong> South<br />
Lithuania Upland<br />
Number <strong>of</strong> samples 15 19 15 15<br />
Quartz X<br />
v<br />
Potassium<br />
feldspars<br />
Crystalline<br />
rocks<br />
X<br />
v<br />
X<br />
v<br />
Sandstone X<br />
v<br />
Dolomite X<br />
v<br />
Ordovician<br />
and Silurian<br />
limestone<br />
Other<br />
limestone<br />
Petrographic<br />
coef<strong>fi</strong> cients<br />
X<br />
v<br />
X<br />
v<br />
D/L<br />
C/S<br />
4.4<br />
47<br />
3.7<br />
67<br />
54.6<br />
43<br />
8.2<br />
49<br />
5.6<br />
112<br />
1.9<br />
203<br />
20.0<br />
94<br />
2.95<br />
1.76<br />
6.4<br />
50<br />
4.3<br />
79<br />
51.4<br />
38<br />
11.2<br />
54<br />
7.8<br />
112<br />
2.7<br />
213<br />
13.2<br />
113<br />
2.89<br />
1.78<br />
2.2<br />
54<br />
2.2<br />
76<br />
39.7<br />
36<br />
11.7<br />
36<br />
5.1<br />
62<br />
8.4<br />
72<br />
28.1<br />
53<br />
0.61<br />
0.79<br />
3.6<br />
122<br />
2.2<br />
99<br />
37.2<br />
39<br />
9.6<br />
<strong>46</strong><br />
9.4<br />
70<br />
11.5<br />
87<br />
23.9<br />
61<br />
0.83<br />
0.82
Heavy minerals<br />
Medininkai Upland Eišišks<br />
Plateau<br />
CHANGE OF PALAEOGEOGRAPHICAL CONDITIONS IN THE<br />
TERRITORY OF PENULTIMATE GLACIATION<br />
The damp and warm interglacial climate was followed<br />
by a period <strong>of</strong> soil degradation, associated<br />
with the cold climate at the beginning <strong>of</strong> the<br />
Weichselian Glaciation. The ground became deeply<br />
frozen and permafrost <strong>fi</strong> ssures appeared. The soils<br />
<strong>of</strong> that time contained pseudomorphoses, involutions<br />
and other kinds <strong>of</strong> cryoturbations as well as<br />
coarse-grained sand and gravel, accumulated during<br />
segregation in permafrost <strong>fi</strong> ssures. The eolian<br />
processes then reworked the <strong>fi</strong> ne-grained silt in the<br />
lower lithocomplex. These events took place in the<br />
Early Weichselian.<br />
After the long-lasting cold climate, a moderately<br />
warm climate set in. There appeared rudiments <strong>of</strong><br />
soil forming processes in coniferous forests. Traces<br />
<strong>of</strong> these processes were identi<strong>fi</strong> ed under the cover<br />
<strong>of</strong> <strong>fi</strong> ne-grained sand and silt. The following cooling<br />
<strong>of</strong> the climate disturbed the deposited sediments by<br />
new cryoturbations. The material from that time is<br />
saturated with iron oxides. It also contains carbon-<br />
Geomorphological regions<br />
Žiogeliai zone <strong>of</strong><br />
South<br />
Lithuania<br />
Upland<br />
Baltija zone <strong>of</strong> South<br />
Lithuania Upland<br />
Number <strong>of</strong> samples 15 19 15 15<br />
Iron oxides and<br />
hydroxides<br />
Magnetite and<br />
Ilmenite<br />
X<br />
v<br />
X<br />
v<br />
Zircon X<br />
v<br />
Garnet X<br />
v<br />
Apatite X<br />
v<br />
Epidote X<br />
v<br />
Hornblende X<br />
v<br />
Pyroxene X<br />
v<br />
<strong>Geological</strong> <strong>Survey</strong> <strong>of</strong> <strong>Finland</strong>, <strong>Special</strong> <strong>Paper</strong> <strong>46</strong><br />
Periglacial conditions and deglaciation in Southern Lithuania during the Last Ice Age<br />
Table 2. Arithmetical means (X, %), variation coef<strong>fi</strong> cients (v, %) and mineralogical coef<strong>fi</strong> cient (Km) <strong>of</strong> some heavy minerals (fraction<br />
0.2-0.1 mm) <strong>of</strong> surface till in South Lithuania. Km - hornblende and pyroxenes / iron oxides and hydroxides, zircon, epidote,<br />
apatite.<br />
5.6<br />
<strong>46</strong><br />
14.8<br />
41<br />
2.2<br />
52<br />
22.8<br />
41<br />
2.3<br />
43<br />
5.1<br />
45<br />
25.6<br />
41<br />
2.7<br />
51<br />
K m 1.86 1.80 2.09 2.14<br />
6.9<br />
21<br />
16.6<br />
27<br />
2.5<br />
48<br />
23.9<br />
25<br />
2.2<br />
44<br />
5.6<br />
33<br />
28.0<br />
26<br />
2.9<br />
32<br />
5.3<br />
17<br />
17.8<br />
9<br />
2.2<br />
30<br />
27.1<br />
7<br />
1.8<br />
33<br />
6.6<br />
14<br />
28.3<br />
5<br />
5.0<br />
21<br />
5.6<br />
20<br />
18.8<br />
9<br />
1.9<br />
40<br />
26.8<br />
5<br />
1.6<br />
35<br />
6.1<br />
13<br />
28.2<br />
5<br />
4.3<br />
2.14<br />
ate accumulations and poorly expressed pseudomorphoses.<br />
The formation <strong>of</strong> this layer is associated<br />
with the Middle Weichselian. Fine-grained loess-like<br />
material was deposited at the end <strong>of</strong> this period. The<br />
dry and cool climate followed at the end <strong>of</strong> Middle<br />
Weichselian causing a long-lasting permafrost and<br />
degradation <strong>of</strong> soil horizon. The sediments included<br />
strati<strong>fi</strong> ed solifl uction matter.<br />
The last phase <strong>of</strong> soil formation is related to<br />
the moderately cold climate <strong>of</strong> the Upper Pleniglacial.<br />
The formation <strong>of</strong> pseudogleyic soils resumed.<br />
When the climate cooled in its <strong>fi</strong> nal stage, the layer<br />
<strong>of</strong> frozen ground thickened considerably, the weathering<br />
processes intensi<strong>fi</strong> ed, and the layer <strong>of</strong> the upper<br />
lithocomplex was formed. It also contains well<br />
expressed marks <strong>of</strong> cryoturbation. With the climate<br />
warming and permafrost degradation at the end <strong>of</strong><br />
this period, many disturbed soils appeared, indicating<br />
the solifl uction intensity.<br />
43
<strong>Geological</strong> <strong>Survey</strong> <strong>of</strong> <strong>Finland</strong>, <strong>Special</strong> <strong>Paper</strong> <strong>46</strong><br />
Valentinas Baltrünas, K´stutis Švedas and Violeta Pukelyt<br />
44<br />
PALAEOGEOGRAPHY OF SOUTH LITHUANIA IN THE ZONE<br />
OF LAST GLACIATION<br />
During the Late Weichselian, a large part <strong>of</strong> southern<br />
Lithuania was covered by the glacier advancing<br />
from northwest. During the Gr0da stage (Brandenburg,<br />
Late Weichselian) its edge extended along the<br />
western slope bottom <strong>of</strong> the Medininkai Upland and<br />
only partly covered the western part <strong>of</strong> the Eišišks<br />
Plateau. Poorly expressed end moraines have been<br />
detected. The edge <strong>of</strong> the glacier (presumably not<br />
very thick) is marked by low washed out sand and<br />
sandy loam hills.<br />
The degradation <strong>of</strong> the last glacier <strong>of</strong> the maximal<br />
Gr0da (Branderburg, Late Weichselian) stage<br />
produced a huge amount <strong>of</strong> melt water dammed<br />
in between the decaying glacier and the southernmost<br />
moraine hills. Thus, the periglacial lakes were<br />
formed with water levels at <strong>fi</strong> rst between 180–160 m<br />
a.s.l. Later, the Verseka, Ditva, and Juodup valleys<br />
between the ridges became the outlets for southern<br />
water fl ows.<br />
The new distinct ˘iogeliai (Frankfurt) phase <strong>of</strong><br />
glaciation left well developed marginal moraine<br />
formations on the left bank <strong>of</strong> the Merkys (Fig. 3)<br />
that are overlying the glaciolacustrine <strong>fi</strong> ne- and very<br />
<strong>fi</strong> ne-grained sand <strong>of</strong> the Gr0da (Brandenburg) stage.<br />
The formation <strong>of</strong> glaci<strong>of</strong>l uvial (sandur and sandur<br />
deltas) sediments was closely linked with the history<br />
<strong>of</strong> glaciolacustrine basins. This assumption is supported<br />
by the absolute surface altitude <strong>of</strong> the mentioned<br />
sediments, which gradually decreases from<br />
160 m a.s.l. at the northeastern edge <strong>of</strong> the glacier<br />
to 130–125 m a.s.l. at the southwestern edge. This<br />
also implies an asynchronous character <strong>of</strong> their formation.<br />
It is possible to assert that the glacier edge<br />
stabilization at Kapπamiestis, Liškiava, Onuškis,<br />
and Trakai in the ˘iogeliai (Frankfurt) phase was<br />
related to a short climate warming that slowed down<br />
solifl uction and renewed cryogenic processes in the<br />
Medininkai Upland and Eišišks Plateau.<br />
The Baltija (Pomeranian) palaeogeography <strong>of</strong><br />
the studied region was associated with the Middle<br />
Nemunas ice lobe that advanced from the north,<br />
which was unable to overcome the characteristic<br />
high moraine ridge <strong>of</strong> ˘iogeliai phase. During the<br />
glacier advance and stabilization at Veisiejai, Merkin,<br />
and Semelišks, the previously formed relief<br />
endured cryogenic processes.<br />
Fig. 3. Palaeogeographical situation <strong>of</strong> the ˘iogeliai (Frankfurt) phase <strong>of</strong> Nemunas (Weichselian) Glaciation in southern Lithuania:<br />
1 – active glacier; 2 – hilly relief marginal deposits <strong>of</strong> next-to-last (Medininkai, Saalian) glaciation formed cryogenic and<br />
solifl uction processes; 3 – glaciolacustrine basin; 4 – glaciolacustrine plain; 5 – the formed sandur (glaci<strong>of</strong>l uvial) plain; 6 – valley<br />
and direction <strong>of</strong> water fl ush.
The South Lithuanian phase <strong>of</strong> glacier degradation<br />
was marked by a recessive pause north <strong>of</strong> Virbalis<br />
and Marijampol at Igliauka and Prienai (Fig.<br />
4). A lake valley, drained by melt water and opening<br />
into the large Simnas–Staklišks glaciolacustrine<br />
basin existed between the glacier and the upland,<br />
which in many places was still covered by thawing<br />
dead ice with moraine sediments. The South Lithuanian<br />
Upland in the southern and eastern coasts <strong>of</strong> this<br />
basin was also covered by moraine-bearing dead ice.<br />
A wide southward valley between high hills served<br />
as a passage for the excess water <strong>of</strong> the basin. The<br />
Merkin–Punia sector <strong>of</strong> the Middle Nemunas River<br />
valley, formed by shallow water streams fl owing<br />
from the northern to the southern glaciolacustrine<br />
<strong>Geological</strong> <strong>Survey</strong> <strong>of</strong> <strong>Finland</strong>, <strong>Special</strong> <strong>Paper</strong> <strong>46</strong><br />
Periglacial conditions and deglaciation in Southern Lithuania during the Last Ice Age<br />
basins, began to form at exactly that time. In the<br />
initial stage, the water level in the”overfl owing”<br />
basins was 125 and 120 m a.s.l. respectively. Later,<br />
the level <strong>of</strong> the northern basin fell to 115–110 m<br />
a.s.l. and the Nemunas River reversed the current<br />
direction. The level <strong>of</strong> the southern basin was more<br />
stable and related to the stable and intensive melt<br />
water fl ow through the lateral old valley from eastern<br />
Lithuania (Vilnius–Warsaw–Berlin Urstromtal)<br />
(Basalykas et al. 1984). The retreat <strong>of</strong> glaciers from<br />
southern Lithuania and the outfl ow <strong>of</strong> periglacial<br />
basins formed the geological and geomorphological<br />
basis <strong>of</strong> the region. Later, this basis was transformed<br />
by various other geological processes (solifl uction,<br />
glaciokarst, aeolian, and erosion).<br />
Fig. 4. Palaeogeographical situation <strong>of</strong> South–Lithuanian phase <strong>of</strong> the Nemunas (Weichselian) Glaciation in southern Lithuania: 1<br />
– active glacier; 2 – dead and thawing glacier; 3 – marginal deposits in hilly relief <strong>of</strong> next-to-last (Medininkai, Saalian) glaciation<br />
formed by cryogenic and solifl uction processes; 4 – marginal deposits <strong>of</strong> hilly relief <strong>of</strong> Last (Nemunas, Weichselian) Glaciation;<br />
5 – glaciolacustrine basin; 6 – glaciolacustrine plain; 7 – the formed sandur (glaci<strong>of</strong>l uvial) plain; 8 – sandur (glaci<strong>of</strong>l uvial) plain;<br />
9 – glaci<strong>of</strong>l uvial delta; 10 – valley, terrace and direction <strong>of</strong> water fl ush.<br />
45
<strong>Geological</strong> <strong>Survey</strong> <strong>of</strong> <strong>Finland</strong>, <strong>Special</strong> <strong>Paper</strong> <strong>46</strong><br />
Valentinas Baltrünas, K´stutis Švedas and Violeta Pukelyt<br />
1. The southeastern periphery <strong>of</strong> southern Lithuania<br />
endured long-lasting periglacial conditions.<br />
The northwestern part was impacted by<br />
the glaciogenic sedimentation <strong>of</strong> the ˘iogeliai<br />
(Frankfurt) and Baltija (Pomeranian) stages <strong>of</strong><br />
the Last (Weichselian) Glaciation. The middle<br />
part, extending from south-west to north-east<br />
was infl uenced by very intensive melt water erosion<br />
and accumulation (Vilnius–Warsaw–Berlin<br />
Urstromtal).<br />
2. The permafrost and cryogenic structures represented<br />
an important phenomenon <strong>of</strong> extraglacial<br />
zones. Permafrost degradation consisted <strong>of</strong> intensive<br />
slope transformation processes, which<br />
The authors are grateful to Pr<strong>of</strong>. Dr. Habil. A.<br />
Gaigalas, Dr. A. Šliaupa, Dr. P. Šinknas and Dr. M.<br />
Baltr0nas, V. 2001. Paviršiaus geologins s_lygos. In: Baltr0nas,<br />
V. (ed.) Akmens am≥ius Piet< Lietuvoje. Vilnius:<br />
Geologijos institutas, 82–89.<br />
Baltr0nas, V. 2002. Stratigraphical subdivision and correlation<br />
<strong>of</strong> Pleistocene deposits in Lithuania (methodical problems).<br />
Vilnius: Institute <strong>of</strong> Geology. 74 p.<br />
Basalykas, A. 1965. Lietuvos TSR <strong>fi</strong> zin geogra<strong>fi</strong> ja. 2. Vilnius:<br />
Mintis. 492 p.<br />
Basalykas, A., Dvareckas, V. & Diceviçien, L. 1984. The<br />
Sand Plain <strong>of</strong> Southestern Lithuania and its place in the<br />
European system <strong>of</strong> ice marginal streamways. Geogra<strong>fi</strong> jos<br />
metraštis 21, 7–21.<br />
Brodzikowski, K. & Van Loon, A. J. 1991. Glacigenic Sediments.<br />
Developments in Sedimentology 49. Amsterdam:<br />
Elsevier. 674 p.<br />
Drobnys, A. (ed.) 1981. Lietuvos TSR atlasas. Maskva: Vyriausioji<br />
geodezijos ir kartogra<strong>fi</strong> josvaldyba. 216 p.<br />
Dvareckas, V. 1993. The development <strong>of</strong> the Lithuanian river<br />
valleys in late glacial and holocene. Geogra<strong>fi</strong> ja 29, 13–18.<br />
Dvareckas, V. & Diceviπien, L. 1987. Palaeogeographical aspects<br />
<strong>of</strong> relief in the Varna district. Geogra<strong>fi</strong> ja 23, 56–64.<br />
Gaigalas, A. 2001. Viršutinio (vlyvojo) pleistoceno stratigra<strong>fi</strong> -<br />
ja ir geochronologija. In: Baltr0nas, V. (ed.) Akmens am≥ius<br />
Piet< Lietuvoje. Vilnius: Geologijos institutas, 7–24.<br />
<strong>46</strong><br />
CONCLUSIONS<br />
ACKNOWLEDGEMENTS<br />
REFERENCES<br />
infl uenced the formation <strong>of</strong> loess-like structures.<br />
The permafrost degradation began in southern<br />
Lithuania in conjunction with the melting <strong>of</strong><br />
the Baltija (Pomeranian) glaciers about 16,500–<br />
13,500 years ago.<br />
3. The speci<strong>fi</strong> c features <strong>of</strong> the Baltija stage deglaciation<br />
were predetermined by a wide (30–40 m)<br />
elevation <strong>of</strong> dead ice and a glaciolacustrine basin<br />
(Simnas–Staklišks) dammed between the the<br />
South Lithuania Upland and the younger South<br />
Lithuania glacier. The excess water <strong>of</strong> this basin<br />
washed out a large part <strong>of</strong> the Middle Nemunas<br />
River.<br />
Stanπikait for consultations and assistance in studying<br />
the Pleistocene deposits in South Lithuania.<br />
Jary, Z., Kida, J. & Snihur, M. 2002. Lessy i osady lessopochodne<br />
w poludniowo-zachodniej Polsce (Loess and loessderived<br />
sediments in SW Poland). Czasopismo Geogra<strong>fi</strong> czne<br />
73 (1–2), 63–100.<br />
Kabailien, M. 1990. Lietuvos holocenas. Vilnius: Mokslas.<br />
175 p.<br />
Kabailien, M. 2001. Vlyvojo ledynmeπio bei holoceno<br />
nuosd< stratigra<strong>fi</strong> ja. In: Baltr0nas, V. (ed.) Akmens am≥ius<br />
Piet< Lietuvoje. Vilnius: Geologijos institutas, 24–29.<br />
Kondratien, O. 1996. The Quaternary stratigraphy and paleogeography<br />
<strong>of</strong> Lithuania based on paleobotanic studies. Vilnius:<br />
Academia. 209 p.<br />
Komarovsky, M. E. 1996. Minsk and Oshmiany Uplands.<br />
Minsk: Institut geologiczeskich nauk. 124 p.<br />
Satk0nas, J. 1999. The Upper Pleistocene stratigraphy and<br />
geochronology in Lithuania. Litosfera 3, 43–57.<br />
Švedas, K. 2001. Medinink< aukštumos paleogeogra<strong>fi</strong> n raida<br />
vlyvajame Pleistocene. Geogra<strong>fi</strong> jos metraštis 34 (1),<br />
95–105.<br />
Švedas, K., Baltr0nas, V. & Pukelyt, V. 2004. Piet< Lietuvos<br />
paleogeogra<strong>fi</strong> ja vlyvojo pleistoceno Nemuno (Weichselian)<br />
apledjimo metu. Geologija 45, 6–15.
Applied Quaternary research in the central part <strong>of</strong> glaciated terrain,<br />
edited by Peter Johansson and Pertti Sarala.<br />
<strong>Geological</strong> <strong>Survey</strong> <strong>of</strong> <strong>Finland</strong>, <strong>Special</strong> <strong>Paper</strong> <strong>46</strong>, 47–54, 2007.<br />
LATE WEICHSELIAN DEGLACIATION IN FINNISH LAPLAND<br />
by<br />
Peter Johansson 1<br />
Johansson, P. 2007. Late Weichselian deglaciation in Finnish<br />
Lapland. Applied Quaternary research in the central part <strong>of</strong> glaciated<br />
terrain. <strong>Geological</strong> <strong>Survey</strong> <strong>of</strong> <strong>Finland</strong>, <strong>Special</strong> <strong>Paper</strong> <strong>46</strong>,<br />
47–54, 4 <strong>fi</strong> gures.<br />
The picture <strong>of</strong> the Late Weichselian deglaciation in northern<br />
<strong>Finland</strong> is based on studies <strong>of</strong> glacial processes and morphology.<br />
These include subglacial meltwater action and glaci<strong>of</strong>l uvial<br />
hydrography, till stratigraphy and ice fl ow directions, proglacial,<br />
marginal and lateral meltwater action and development <strong>of</strong> ice<br />
lakes. The deglaciation started from the northernmost part <strong>of</strong> the<br />
area as the ice margin retreated from the Younger Dryas End Moraines<br />
about 11,600 years ago. The last remains <strong>of</strong> the glacier disappeared<br />
from western Finnish Lapland about 10,000 years ago.<br />
Using all the palaeohydrographic information, for example by<br />
mapping the ice lake phases and the routes <strong>of</strong> the extramarginal<br />
channels between them, it has been possible to form a reliable<br />
reconstruction <strong>of</strong> successive stages <strong>of</strong> the ice retreat during these<br />
1,600 years.<br />
Key words (GeoRef Thesaurus, AGI): glacial geology, deglaciation,<br />
glaci<strong>of</strong>l uvial features, meltwater channels, glacial lakes,<br />
Pleistocene, Weichselian, Lapland Province, <strong>Finland</strong>.<br />
1 <strong>Geological</strong> <strong>Survey</strong> <strong>of</strong> <strong>Finland</strong>, P.O. Box 77, FI-96101<br />
Rovaniemi, <strong>Finland</strong><br />
E-mail: peter.johansson@gtk.<strong>fi</strong><br />
47
<strong>Geological</strong> <strong>Survey</strong> <strong>of</strong> <strong>Finland</strong>, <strong>Special</strong> <strong>Paper</strong> <strong>46</strong><br />
Peter Johansson<br />
The deglaciation phase and the <strong>fi</strong> nal disappearance<br />
<strong>of</strong> the Late Weichselian ice sheet were examined<br />
in Finnish Lapland by studying different glacial<br />
processes and their resulting landforms. These are<br />
subglacial meltwater action and glaci<strong>of</strong>l uvial hydrography,<br />
till stratigraphy and ice fl ow directions,<br />
proglacial, marginal and lateral meltwater action<br />
and the development and types <strong>of</strong> the ice lakes.<br />
Tanner (1915) was the <strong>fi</strong> rst to study deglaciation<br />
in northern <strong>Finland</strong>. The <strong>fi</strong> rst model <strong>of</strong> the retreating<br />
glacial margin was created by him and is still valid<br />
in a broad scale. Mikkola (1932), Penttilä (1963),<br />
Kujansuu (1967), Johansson (1995) and many others<br />
have by their research added more details to the<br />
The Younger Dryas ice-marginal landforms in<br />
northern Norway are situated only 20 kilometres<br />
from northern Finnish Lapland (Sollid et al. 1973,<br />
Andersen et al. 1995). The active ice fl ow stage <strong>of</strong><br />
Younger Dryas can be detected in Inari, northern<br />
Lapland, which was considerably infl uenced by the<br />
distinct ice lobe during the Younger Dryas (Punkari<br />
1980). The extensive drumlin <strong>fi</strong> eld is related to this<br />
fl ow stage and it extends as far as the Younger Dryas<br />
ice-marginal landforms in Norway and Pechenga<br />
area, NW Russia (Marthinussen 1962, Yevzerov &<br />
Koshechkin 1980, Yevzerov & Kolka 1993, Yevzerov<br />
et al. 2005, Semenova 2005). During this time<br />
the so called younger till bed or Till Bed II was<br />
deposited and occurs widely through the area. On<br />
top <strong>of</strong> the Till Bed II there is a quite common even<br />
younger till bed, known as Till Bed I or sur<strong>fi</strong> cial<br />
till (Hirvas 1991, Johansson 1995). Its deposition is<br />
related to the ice fl ow during the deglaciation following<br />
the Younger Dryas. In eastern Lapland the<br />
youngest ice fl ow direction can be used to picture<br />
the retreat <strong>of</strong> the ice sheet, because the retreat was<br />
usually in the opposite direction to that <strong>of</strong> the last<br />
ice fl ow. The network <strong>of</strong> subglacial glaci<strong>of</strong>l uvial<br />
systems indicates the direction <strong>of</strong> the retreating ice<br />
sheet even more accurately than the till fabric <strong>of</strong> the<br />
sur<strong>fi</strong> cial till. This is due to the fact that in subglacial<br />
tunnels the meltwater tends to fl ow disregarding<br />
any terrain obstacles toward the lowest pressure i.e.<br />
the margin <strong>of</strong> the glacier. The subglacial meltwater<br />
48<br />
INTRODUCTION<br />
YOUNGER DRYAS END MORAINE<br />
picture <strong>of</strong> the deglaciation. Compared with southern<br />
and central <strong>Finland</strong>, the advantage <strong>of</strong> studying deglaciation<br />
in northern <strong>Finland</strong> lies in the fact that<br />
most <strong>of</strong> the retreating ice sheet melted in a supraaquatic<br />
environment, resulting in various kinds <strong>of</strong><br />
erosional and depositional landforms. Subaquatic<br />
conditions existed only in the southwestern part <strong>of</strong><br />
Lapland because that area was covered by the waters<br />
<strong>of</strong> the Ancylus Lake phase <strong>of</strong> the Baltic Basin. Some<br />
small subaquatic areas exist in the northern part,<br />
where the Arctic Ocean for a short time penetrated<br />
into the river valleys <strong>of</strong> Teno and Lutto (Nikonov<br />
1964, Saarnisto 1973) and into the Inari Lake basin<br />
(Tanner 1915, 1936, Kujansuu et al. 1998).<br />
action was mainly erosional at <strong>fi</strong> rst, forming channels<br />
and gorges along the path <strong>of</strong> the conduit. Later,<br />
deposition prevailed closer to the ice margin and it<br />
was then that steep-sided and sharp-crested esker<br />
ridges were formed (Fig. 1). The distribution pattern<br />
<strong>of</strong> the Late Weichselian subglacial meltwater<br />
system is radial (Fig. 2) and suggests that the direction<br />
<strong>of</strong> the ice retreat was from the Younger Dryas<br />
End Moraines in Norway and Russia towards the<br />
ice divide area in northern central Lapland.<br />
Fig. 1. The Pakajärvi esker is a typical subglacial esker ridge<br />
with a sharp crest and steep sides.
<strong>Geological</strong> <strong>Survey</strong> <strong>of</strong> <strong>Finland</strong>, <strong>Special</strong> <strong>Paper</strong> <strong>46</strong><br />
Late Weichselian deglaciation in Finnish Lapland<br />
Fig. 2. Late Weichselian esker chains form a radial system which represent the direction <strong>of</strong> ice retreat from the Younger<br />
Dryas End Moraines towards the ice divide area in northern <strong>Finland</strong>. 1 = esker chain, 2 = Younger Dryas End Moraine.<br />
After Johansson et al. (2005).<br />
49
<strong>Geological</strong> <strong>Survey</strong> <strong>of</strong> <strong>Finland</strong>, <strong>Special</strong> <strong>Paper</strong> <strong>46</strong><br />
Peter Johansson<br />
50<br />
THE ICE RETREAT IN THE FELL AREAS<br />
The ice margin started to retreat from the Younger<br />
Dryas End Moraines about 11,600 years ago (Saarnisto<br />
2000, Saarnisto & Saarinen 2001). At the same<br />
time the highest felltops in northwestern and northern<br />
Lapland appeared from the ice as nunataks. In<br />
the northern part <strong>of</strong> Lapland, the ice margin retreated<br />
towards south-southwest and in the southern part <strong>of</strong><br />
Lapland to northwest. The surroundings <strong>of</strong> the Lake<br />
Inari were deglaciated approximately 10,800 years<br />
ago (Kujansuu et al. 1998) (Fig. 3).<br />
Fig. 3. Recession <strong>of</strong> the ice margin in northern <strong>Finland</strong>. 1 = position <strong>of</strong> the ice margin, 2 = areas covered by ice-dammed lakes, 3<br />
= Ancylus Lake, 4 = Younger Dryas End Moraine. After Johansson et al. (2005).
Fig. 4. Lateral drainage channels on the slopes <strong>of</strong> Jäkäläpää Fell in Inari.<br />
The ice margin reached the Lemmenjoki<br />
– Saariselkä fell range about 10,600 years ago. In<br />
the mountainous area the deglaciation was <strong>fi</strong> rst thinning<br />
<strong>of</strong> the ice. During the nunatak phase many <strong>of</strong><br />
the overfl ow channels in the Saariselkä area were<br />
also formed as a result <strong>of</strong> meltwater erosion. As the<br />
ice sheet became thinner and its surface sank, the<br />
nunataks expanded into vast ice-free areas. The ice<br />
fl ow stagnated behind the nunataks, and fractures<br />
and crevasses were consequently formed at the<br />
margin <strong>of</strong> the ice sheet. The meltwaters penetrated<br />
under the ice margin, eroded subglacial chutes and<br />
deposited engorged eskers (Johansson 1994).<br />
The meltwater action at the boundary <strong>of</strong> the ice<br />
sheet and an exposed fell slope next to it produced<br />
series <strong>of</strong> shallow meltwater channels, i.e. lateral<br />
drainage channels (Fig. 4). The channels generally<br />
occur in groups, running side by side gently sloping<br />
down the fell side. These channels are <strong>of</strong> great importance<br />
in the study <strong>of</strong> deglaciation in minor scale,<br />
since they help to construct the position <strong>of</strong> the ice<br />
margin in a great detail, which gives a picture <strong>of</strong> the<br />
inclination <strong>of</strong> the surface <strong>of</strong> the ice sheet. Additionally<br />
they indicate that the ice margin was unbroken.<br />
In favourable places on the fell slopes channel<br />
systems comprising several tens <strong>of</strong> channels were<br />
formed in which the distance between the individu-<br />
<strong>Geological</strong> <strong>Survey</strong> <strong>of</strong> <strong>Finland</strong>, <strong>Special</strong> <strong>Paper</strong> <strong>46</strong><br />
Late Weichselian deglaciation in Finnish Lapland<br />
al channels remains nearly constant. In these places<br />
the channels may have formed as a consequence <strong>of</strong><br />
the annual thinning <strong>of</strong> the ice sheet and they can be<br />
used to document the rate <strong>of</strong> melting (Penttilä 1963,<br />
Johansson 1995). Their distribution indicates that<br />
the gradient <strong>of</strong> the ice surface was between 1.5 and<br />
3:100 m and the ice margin thinned approximately<br />
1.6 m per year. The rate <strong>of</strong> recession <strong>of</strong> the ice margin<br />
varied 130 – 170 m per year, approximately 140<br />
m per year (Johansson 1995). In western Lapland<br />
the deglaciation rate was faster. Lateral drainage<br />
channels on the fellslopes in the Ylläs area show<br />
that the annual thinning was about 2.5 – 3 m and<br />
the ice retreat about 170 m per year (Abrahamsson<br />
1974, Kujansuu 1967). The melting accelerated due<br />
to the decreasing mass <strong>of</strong> the continental ice sheet<br />
as the deglaciation proceeded and to warming <strong>of</strong> the<br />
climate, which also contributed to the acceleration.<br />
As the retreat <strong>of</strong> the ice margin continued, the<br />
southern edge <strong>of</strong> the Lemmenjoki – Saariselkä fell<br />
range became exposed. The ice margin was pressing<br />
against the fell range and it became undulated with<br />
tens <strong>of</strong> kilometres long ice lobes penetrating into the<br />
valleys <strong>of</strong> Lemmenjoki, Suomujoki and Anterijoki.<br />
At the end <strong>of</strong> this ice-lobe stage, the lobes turned<br />
passive and melted down after they had lost contact<br />
with the active ice sheet.<br />
51
<strong>Geological</strong> <strong>Survey</strong> <strong>of</strong> <strong>Finland</strong>, <strong>Special</strong> <strong>Paper</strong> <strong>46</strong><br />
Peter Johansson<br />
52<br />
ICE LAKES AND EXTRAMARGINAL CHANNEL SYSTEMS<br />
To the south <strong>of</strong> the Lemmenjoki – Saariselkä fell<br />
range ice lakes were dammed in front <strong>of</strong> its margin<br />
during various stages <strong>of</strong> deglaciation. A requirement<br />
for the formation <strong>of</strong> an ice lake was that the<br />
ice margin retreated downslope along the main river<br />
valleys. The glacier had to be active and solid at its<br />
edges to be able to dam any meltwater. In such cases<br />
the meltwaters were not able to drain but formed<br />
ice-dammed lakes in the valleys. The different lake<br />
phases are indicated by the presence <strong>of</strong> raised shorelines<br />
and outlet channels, coarse outwash sediments<br />
and <strong>fi</strong> ne-grained glaciolacustrine sediments.<br />
While the ice sheet was still leaning against the<br />
southern slope <strong>of</strong> the Lemmenjoki-Saariselkä fell<br />
range, several ice lakes started to form in depressions<br />
between the fell tops (Tanner 1915, Penttilä<br />
1963, Johansson 1995). They were short-lived and<br />
small, but since they occupied valleys between fells<br />
they became deep, and they contained a considerable<br />
volume <strong>of</strong> water. On even terrains large and<br />
shallow ice lakes were formed. The largest <strong>of</strong> these<br />
ice lakes were located in Salla, eastern Lapland, in<br />
the Muoniojoki and Ounasjoki river valleys, western<br />
Lapland, and in the Inari Lake basin, northern<br />
Lapland (Fig. 3). They covered thousands <strong>of</strong> square<br />
kilometres. However, most <strong>of</strong> the ice lakes were<br />
small, occupying only the deepest parts <strong>of</strong> the river<br />
valleys. The ice lakes drained from one river valley<br />
to another across the water divides creating erosional<br />
landforms, i.e. narrow and deep overfl ow channels<br />
and broad and shallow marginal and extramarginal<br />
channels. Successive marginal and extramarginal<br />
meltwater systems formed along the retreating ice<br />
front and some <strong>of</strong> them can be followed hundreds<br />
<strong>of</strong> kilometres from the higher terrain in northwestern<br />
Lapland to the lower levels in eastern Lapland<br />
(Kujansuu 1967, Lunkka et al. 2004, Johansson<br />
& Kujansuu 2005). Initially the meltwater fl owed<br />
northwards, across the main water divide towards<br />
the Arctic Ocean. As the ice sheet became smaller<br />
and retreated southwestwards the meltwater fl ow<br />
switched eastwards towards the White Sea and <strong>fi</strong> -<br />
nally southeastwards along the retreating ice margin<br />
towards the Baltic Basin. The extensive marginal<br />
and extramarginal channel systems indicate that<br />
the ice sheet remained dynamically active until it<br />
wasted away.<br />
In eastern Lapland the deglaciation was accompanied<br />
by the damming <strong>of</strong> the largest ice lake <strong>of</strong><br />
northern <strong>Finland</strong>, the Salla Ice Lake, in the area<br />
between the present water divide and the ice margin<br />
(Johansson 1995). The water from the Salla Ice Lake<br />
fl owed east through the Kutsajoki river to the White<br />
Sea. When the new outlet channel, which led to Korouoma,<br />
had opened under the margin <strong>of</strong> the retreating<br />
glacier about 10,500 years ago, the surface <strong>of</strong><br />
the ice lake sank by more than 50 m in a short time.<br />
Extensive areas near the ice margin turned into dry<br />
land. This may have had a signi<strong>fi</strong> cant effect on the<br />
stagnation <strong>of</strong> the ice margins, the ice retreat and on<br />
the formation <strong>of</strong> the areas <strong>of</strong> hummocky moraines<br />
and ribbed moraines in the vicinity <strong>of</strong> Rovaniemi<br />
and Kemijärvi (Kurimo 1978, Taipale & Saarnisto<br />
1991, Sarala 2005).<br />
DISAPPEARANCE OF THE GLACIER IN THE ICE-DIVIDE AREA<br />
When the margin <strong>of</strong> the retreating glacier had reached<br />
the ice-divide area in northern central Lapland about<br />
10,300 years ago, it stagnated in several places at<br />
Posoaapa and Koitelainen areas and melted in situ,<br />
partially as separate patches <strong>of</strong> dead ice. Landforms<br />
typical <strong>of</strong> subglacial and marginal meltwater processes<br />
such as eskers and various channels are almost<br />
entirely missing. This shows that the marginal<br />
parts <strong>of</strong> the glaciers were broken and not capable<br />
<strong>of</strong> controlling the meltwater systems and the shallow<br />
ice lakes were obviously largely <strong>fi</strong> lled with ice<br />
blocks. In western part <strong>of</strong> the ice-divide area the ice<br />
margin was suf<strong>fi</strong> ciently intact to dam ice lakes. It<br />
retreated mainly to the west and at the <strong>fi</strong> nal stage to<br />
the southwest. Some erosional remnant fells, which<br />
rose above the even terrain, such as Kumputunturi<br />
(Johansson et al. 1996), Aakenustunturi and the fell<br />
range <strong>of</strong> Pallas–Ounastunturi controlled the ice<br />
fl ow locally and divided the ice margin into separate<br />
lobes. West <strong>of</strong> Pallas- Ounastunturi the margin<br />
retreated to the south-southwest and on the east side<br />
to the south or south-southeast (Kujansuu 1967).<br />
Glacial processes and morphology give a reliable<br />
picture <strong>of</strong> the ice recession but <strong>of</strong>fer no basis
for dating. The deglaciation <strong>of</strong> northern <strong>Finland</strong><br />
lasted about 1,500 years and its beginning (11,600<br />
years ago) can with certainty be connected with the<br />
end <strong>of</strong> the Younger Dryas chron. The last remains <strong>of</strong><br />
the glacier disappeared from Kolari, western Finnish<br />
Lapland as the ice margin retreated to northern<br />
Sweden, which according to estimation occurred<br />
about 10,000 years ago (Saarnisto 2000, Lundqvist<br />
2004) (Fig. 3). Radiocarbon dating <strong>of</strong> the bottom<br />
Fieldwork was <strong>fi</strong> nanced by GTK. I thank Hannu<br />
Hirvasniemi and Jorma Valkama for assistance in<br />
the <strong>fi</strong> eld. Constructive comments given by Juha-<br />
Abrahamsson, K. 1974. Äkäslompolo-områdets glacialmorfologi<br />
och deglaciation. Gerum. Rapport B 1. 254 p.<br />
Andersen, B. G., Mangerud, J., Sorensen, R., Reite, A.,<br />
Sveian, A., Thoresen, M. & Bergstrom, B. 1995. Younger<br />
Dryas ice-marginal deposits in Norway. Quaternary International<br />
28, 147–169.<br />
Hirvas, H. 1991. Pleistocene stratigraphy <strong>of</strong> Finnish Lapland.<br />
<strong>Geological</strong> <strong>Survey</strong> <strong>of</strong> <strong>Finland</strong>, Bulletin 354. 123 p.<br />
Johansson, P. 1995. The deglaciation in the eastern part <strong>of</strong> the<br />
Weichselian ice divide in Finnish Lapland. <strong>Geological</strong> <strong>Survey</strong><br />
<strong>of</strong> <strong>Finland</strong>, Bulletin 383. 72 p.<br />
Johansson, P., Kujansuu, R. & Mäkinen, K. 1996. Glacial<br />
and late-glacial development in NE Kittilä, northern <strong>Finland</strong>.<br />
In: Autio, S. (ed.) <strong>Geological</strong> <strong>Survey</strong> <strong>of</strong> <strong>Finland</strong>, Current<br />
Research 1995–1996. <strong>Geological</strong> <strong>Survey</strong> <strong>of</strong> <strong>Finland</strong>,<br />
<strong>Special</strong> <strong>Paper</strong> 23, 59–66.<br />
Johansson, P. & Kujansuu, R. (eds.) Eriksson, B., Grönlund,<br />
T., Johansson, P., Kejonen, A., Kujansuu, R.,<br />
Maunu, M., Mäkinen, K., Saarnisto, M., Virtanen,<br />
K. & Väisänen, U. 2005. Pohjois-Suomen maaperä:<br />
maaperäkarttojen 1:400 000 selitys. Summary: Quaternary<br />
deposits <strong>of</strong> Northern <strong>Finland</strong> – Explanation to the maps <strong>of</strong><br />
Quaternary deposits 1:400 000. Espoo: <strong>Geological</strong> <strong>Survey</strong><br />
<strong>of</strong> <strong>Finland</strong>. 236 p. (in Finnish)<br />
Kujansuu, R. 1967. On the deglaciation <strong>of</strong> the western Finnish<br />
Lapland. Bulletin de la Commission Géologique <strong>Finland</strong>e<br />
232. 98 p.<br />
Kujansuu, R., Eriksson, B. & Grönlund, T. 1998. Lake Inarijärvi,<br />
northern <strong>Finland</strong>: sedimentation and late Quaternary<br />
evolution. <strong>Geological</strong> <strong>Survey</strong> <strong>of</strong> <strong>Finland</strong>, Report <strong>of</strong> investigation<br />
143. 25 p.<br />
Kurimo, H. 1978. Late-glacial ice fl ows in northern Kainuu<br />
and Peräpohjola, North-East <strong>Finland</strong>. Fennia 156, 11–43.<br />
Lundqvist, J. 2004. Glacial history <strong>of</strong> Sweden. In: Ehlers, J.<br />
& Gibbard, P. L. (eds.) Quaternary Glaciations–Extent and<br />
ACKNOWLEDGEMENTS<br />
REFERENCES<br />
<strong>Geological</strong> <strong>Survey</strong> <strong>of</strong> <strong>Finland</strong>, <strong>Special</strong> <strong>Paper</strong> <strong>46</strong><br />
Late Weichselian deglaciation in Finnish Lapland<br />
layers <strong>of</strong> peat deposits has been used to get an approximate<br />
age <strong>of</strong> the earliest vegetation, but these<br />
ages are inaccurate, mainly too old, to represent the<br />
<strong>fi</strong> nal stage <strong>of</strong> deglaciation (Ignatius et al. 1980).<br />
After the retreat <strong>of</strong> the glacier the southern part <strong>of</strong><br />
northern <strong>Finland</strong> was to a great extent covered by<br />
the Ancylus Lake. Due to land uplift the highest<br />
shore level formed at this phase is now at an altitude<br />
<strong>of</strong> over 200 m.<br />
Pekka Lunkka and Matti Eronen improved the<br />
manuscript.<br />
Chronology, Vol. I: Europe. Amsterdam: Elsevier, 401–<br />
412.<br />
Lunkka, J. P., Johansson, P., Saarnisto, M., Sallasmaa, O.<br />
2004. Glaciation <strong>of</strong> <strong>Finland</strong>. In: Ehlers, J. & Gibbard, P. L.<br />
(eds.) Quaternary Glaciations–Extent and Chronology, Vol.<br />
I: Europe. Amsterdam: Elsevier, 93–100.<br />
Marthinussen, M. 1962. C-14 datings referring to shorelines,<br />
transgressions and glacial substages in northern Norway.<br />
Norges geologiske undersøkelse 215, 37–67.<br />
Mikkola, E. 1932. On the Physiography and Late-Glacial Deposits<br />
in Northern Lapland. Bulletin de la Commission<br />
géologique <strong>Finland</strong>e 96. 88 p.<br />
Nikonov, A. 1964. Razvitije reljefa i paleo-ge og ra<strong>fi</strong> ja antropogena<br />
na zapade Kolskogo poluostrova. Mosk va, Leningrad:<br />
Izda telstvo ”Nauka”. 182 p.<br />
Penttilä, S. 1963. The deglaciation <strong>of</strong> the Laanila area, Finnish<br />
Lapland. Bulletin de la Commission géologique <strong>Finland</strong>e<br />
203. 71 p.<br />
Punkari, M. 1980. The ice lobes <strong>of</strong> the Scandinavian ice sheet<br />
during the deglaciation in <strong>Finland</strong>. Boreas 9 (4), 307–310.<br />
Saarnisto, M. 1973. Contributions to the late-Quaternary history<br />
<strong>of</strong> the Lutto river valley, Finnish Lapland. Commentationes<br />
Physico-Mathematicae 43, 11–20.<br />
Saarnisto, M. 2000. The last glacial maximum and the deglaciation<br />
<strong>of</strong> Scandinavian Ice Sheet. In: Sandgren, P. (ed.)<br />
Environmental changes in Fennoscandia during the Late<br />
Quaternary. LUNDQUA Report 37, 26–31.<br />
Saarnisto, M. & Saarinen, T. 2001. Deglaciation chronology<br />
<strong>of</strong> the Scandinavian Ice Sheet from the Lake Onega Basin<br />
to the Salpausselkä End Moraines. Global and Planetary<br />
Change 31, 387–405.<br />
Sarala, P. 2005. Glacial morphology and dynamics with till<br />
geochemical exploration in the ribbed moraine area <strong>of</strong><br />
Peräpohjola, Finnish Lapland. <strong>Geological</strong> <strong>Survey</strong> <strong>of</strong> <strong>Finland</strong>.<br />
141 p.<br />
53
<strong>Geological</strong> <strong>Survey</strong> <strong>of</strong> <strong>Finland</strong>, <strong>Special</strong> <strong>Paper</strong> <strong>46</strong><br />
Peter Johansson<br />
Semenova, L. 2006. The types <strong>of</strong> till in the northwestern Kola<br />
Peninsula, Russia. In: Johansson, P., Lunkka J.-P. & Sarala,<br />
P. (eds.) Late Pleistocene glacigenic deposits in the central<br />
part <strong>of</strong> the Scandinavian ice sheet. The INQUA Peribaltic<br />
Group <strong>fi</strong> eld symposium in <strong>Finland</strong>, September 11.–15.<br />
2006. Abstracts, 41.<br />
Sollid, J. L., Andersen, S., Hamre, M., Kjeldsen, O., Salvigsen,<br />
O., Sturød, S., Tveitå, T. & Wilhelmsen, A. 1973.<br />
Deglaciation <strong>of</strong> Finnmark, North Norway. Norsk geogra<strong>fi</strong> sk<br />
Tidskrift 27, 233–325.<br />
Taipale, K. & Saarnisto, M. 1991. Tulivuorista jääkausiin,<br />
Suomen maankamaran kehitys. Porvoo: WSOY. 416 p.<br />
Tanner, V. 1915. Studier öfver kvartärsystemet i Fennoskandias<br />
nordliga delar III. (Résumé en français: Études sur le<br />
système qua ternaire dans les parties septentrionales de la<br />
Fennoscan die). Bulletin de la Commission géologique de<br />
<strong>Finland</strong>e 38. 815 p.<br />
54<br />
Tanner, V. 1938. Det senglasiala havets utbredning i Lutto och<br />
Suomu älvarnas dalgångar ovanför sammanfl ödet samt några<br />
ord om morfologien enna trakt. (Résumé en français:<br />
L’extension de la mer senglaciaire dans les vallées des rivières<br />
Lutto et Suomu en Laponie en amont de leur confl uent).<br />
Bulletin de la Commission géologique de <strong>Finland</strong>e<br />
115, 107–119.<br />
Yevzerov, V. Ya & Koshechkin, B. I. 1980. paleogeography <strong>of</strong><br />
the Pleistocene on the western Kola Peninsula. Leningrad:<br />
Nauka. 105 p. (in Russian)<br />
Yevzerov, V. Ya & Kolka, V. 1993. End moraines <strong>of</strong> Younger<br />
Dryas and deglaciation <strong>of</strong> northern and central Kola peninsula.<br />
In: Yevzerov, V. Ya. (ed.) Eastern Fenniscandian<br />
Younger Dryas End Moraines and Deglaciation. Excursion<br />
guide. Apatity, 5–38.
Applied Quaternary research in the central part <strong>of</strong> glaciated terrain,<br />
edited by Peter Johansson and Pertti Sarala.<br />
<strong>Geological</strong> <strong>Survey</strong> <strong>of</strong> <strong>Finland</strong>, <strong>Special</strong> <strong>Paper</strong> <strong>46</strong>, 55–62, 2007.<br />
LATE WEICHSELIAN SHEETFLOW DRAINAGE OF SUBGLACIAL<br />
LOKKA ICE LAKE<br />
by<br />
Raimo Sutinen 1 , Mari Jakonen 2 , Pauliina Liwata 1 and Eija Hyvönen 1<br />
Sutinen, R., Jakonen, M., Liwata, P. & Hyvönen, E. 2007.<br />
Late Weichselian sheetfl ow drainage <strong>of</strong> subglacial Lokka ice<br />
lake. Applied Quaternary research in the central part <strong>of</strong> glaciated<br />
terrain. <strong>Geological</strong> <strong>Survey</strong> <strong>of</strong> <strong>Finland</strong>, <strong>Special</strong> <strong>Paper</strong> <strong>46</strong>, 55–62,<br />
6 <strong>fi</strong> gures.<br />
A conceptual model regards arboreal eskers as products <strong>of</strong><br />
time-transgressive glaci<strong>of</strong>l uvial deposition within close proximity<br />
<strong>of</strong> the retreating ice margin. In contrast, an anastomosing<br />
network <strong>of</strong> tunnel valleys or esker tracks is attributed to subglacial<br />
fl ood events, but the outburst release mechanisms <strong>of</strong> former<br />
subglacial meltwater bodies have remained obscure. We studied<br />
an anastomosing network <strong>of</strong> esker tracks in Lokka, east-central<br />
Finnish Lapland. Sheetfl ow paleohydrography as compiled with<br />
a digital elevation model (DEM) and airborne gamma-ray (AGR)<br />
data disputes the concept <strong>of</strong> ice-marginal deposition, but the<br />
network displays evidence <strong>of</strong> subglacial mass-fl ows. The tracks<br />
show convex-up parts in their long pr<strong>of</strong>i les and cross topography<br />
regardless <strong>of</strong> slope indicating a subglacial origin beneath the Fennoscandian<br />
Ice Sheet (FIS). The alignment <strong>of</strong> the esker tracks,<br />
fanning out to southeast and south seems to be generated from a<br />
large subglacial reservoir beneath the FIS, and we propose that<br />
the former Lokka ice-lake had been the source <strong>of</strong> the sheetfl ow<br />
system. The coincidence <strong>of</strong> escarpments (DEM) and airborne<br />
magnetic (AM) anomalies suggests that neotectonic fault instability<br />
likely was the triggering mechanism for the outburst <strong>of</strong> the<br />
subglacial Lake Lokka.<br />
Key words (GeoRef Thesaurus, AGI): glacial geology, subglacial<br />
lakes, meltwater, drainage patterns, eskers, neotectonics, Pleistocene,<br />
Weichselian, Lokka, Lapland Province, <strong>Finland</strong>.<br />
1 <strong>Geological</strong> <strong>Survey</strong> <strong>of</strong> <strong>Finland</strong>, P.O. Box 77, FI-96101<br />
Rovaniemi, <strong>Finland</strong><br />
2 University <strong>of</strong> Oulu, Dept. <strong>of</strong> Geosciences, FI-90570<br />
Oulu, <strong>Finland</strong><br />
E-mail: raimo.sutinen@gtk.<strong>fi</strong> , marijako@mail.student.oulu.<strong>fi</strong><br />
pauliina.liwata@gtk.<strong>fi</strong> , eija.hyvonen@gtk.<strong>fi</strong><br />
55
<strong>Geological</strong> <strong>Survey</strong> <strong>of</strong> <strong>Finland</strong>, <strong>Special</strong> <strong>Paper</strong> <strong>46</strong><br />
Raimo Sutinen, Mari Jakonen, Pauliina Liwata and Eija Hyvönen<br />
Eskers and tunnel valleys have been understood to<br />
be meltwater forms, but the organization <strong>of</strong> these<br />
landforms, however, exhibits evidence <strong>of</strong> different<br />
meltdown drainage patterns <strong>of</strong> Pleistocene ice sheets.<br />
The conceptual model regards eskers as products <strong>of</strong><br />
time-transgressive glaci<strong>of</strong>l uvial deposition within<br />
close proximity <strong>of</strong> the retreating ice margin (Banerjee<br />
& McDonald 1975). On a subcontinental scale,<br />
arboreal esker systems also show time-transgressive<br />
features (Clark & Walder 1994). Eskers are commonly<br />
associated with anastomosing tunnel valleys<br />
that are found to be common in regions typi<strong>fi</strong> ed by<br />
<strong>fi</strong> ne-grained tills derived from sedimentary bedrock<br />
(Wright 1973, Clark & Walder 1994). It is assumed<br />
that high-velocity fl ood event(s) preceded the evolution<br />
<strong>of</strong> eskers found in the tunnel valleys (Wright<br />
1973, Kozlowski et al. 2005). Morphological evidence<br />
has also shown that catastrophic sheetfl ood<br />
events are capable <strong>of</strong> eroding large regions out <strong>of</strong><br />
pervasive cover <strong>of</strong> unconsolidated sediments (Kor<br />
& Cowell 1998). The anastomosing network <strong>of</strong> tunnel<br />
valleys, esker tracks or sheetfl oods are evidently<br />
attributed to subglacial lakes (Wright 1973, Shaw<br />
We compiled DEM and low altitude AGR (γ K ) to<br />
outline the anastomosing network <strong>of</strong> sheetfl ow<br />
tracks within an area <strong>of</strong> 100 by 100 km in east-central<br />
Finnish Lapland (Fig. 1). The time-stability <strong>of</strong><br />
spatial structures in the soil γ K (Hyvönen & Sutinen<br />
1998) implies that the terrain anisotropy, whether<br />
due to glacial streamlining or sheetfl ow outbursts,<br />
is revealed by the AGR-γ K . The regimes <strong>of</strong> low soil<br />
volumetric water content (0v), such as sheetfl ow<br />
esker ridges, are indicated by high γ K -signatures,<br />
while low γ K -signatures (high 0v) typify topographic<br />
lows, <strong>of</strong>ten with organic or <strong>fi</strong> ne-grained materials<br />
(Hyvönen et al. 2003, Sutinen et al. 2005). The<br />
DEM-AGR enhancement <strong>of</strong> the sheetfl ow associations<br />
was viewed closer in the subset areas <strong>of</strong> Tanhua<br />
and Suoltijoki (Fig. 1.).<br />
Compilation <strong>of</strong> AM and DEM was applied to<br />
search candidate lines to represent neotectonic faulting.<br />
The coincidental appearance <strong>of</strong> topographic<br />
escarpments and AM-anomalies, showing, for example,<br />
pre-existing hydrothermal alteration zones,<br />
56<br />
INTRODUCTION<br />
MATERIALS AND METHODS<br />
& Kvill 1984, Sutinen 1992, Kor & Cowell 1998,<br />
Sjogren et al. 2002, Kozlowski et al. 2005), but the<br />
outburst release mechanisms <strong>of</strong> former subglacial<br />
meltwater bodies have remained unknown.<br />
Radar evidence has indicated large subglacial<br />
lakes (e.g. Lake Vostok, 500 by 300 km in size)<br />
beneath the Antarctic Ice Sheet (AIS) (Robin et<br />
al. 1970, Kapitsa et al. 1996, Siegert 2000), hence<br />
potential water volumes for tunnel valley formation<br />
evidently existed beneath the former Pleistocene ice<br />
sheets. Following the concept <strong>of</strong> glacio-seismotectonics<br />
at the margin <strong>of</strong> FIS (Stewart et al. 2000),<br />
we suspect that large-magnitude seismic impacts<br />
(Arvidsson 1996, Wu et al. 1999) have been part<br />
<strong>of</strong> an abrupt release <strong>of</strong> subglacial water bodies as<br />
outburst sheetfl ows beneath the FIS. In this study,<br />
we present morphological/geophysical evidence<br />
that neotectonic fault instability likely contributed<br />
not only to paleolandslides (Sutinen 1992, 2005,<br />
Sutinen et al. this issue), but also to glaci<strong>of</strong>l uvial<br />
landform genesis shortly after the Younger Dryas<br />
(YD) episode in Finnish Lapland.<br />
marks potential zones where faults were likely<br />
reactivated within the glacio-seismotectonic subsidence-rebound<br />
processes (Arvidsson 1996, Fjeldskaar<br />
et al. 2000, Stewart et al. 2002). However, not<br />
all escarpments are neotectonic and not every AManomaly<br />
is present at sites with neotectonic faults<br />
(Ojala et al. 2004). Thus, glacio-morphological investigations<br />
are <strong>of</strong>ten needed to verify neotectonic<br />
origin (Lagerbäck 1990, Dehls et al. 2000). For the<br />
time-stratigraphic purposes, additional data on the<br />
preferred orientation <strong>of</strong> till(s) were acquired by<br />
applying non-destructive azimuthal measurements<br />
<strong>of</strong> apparent electrical conductivity (σa) (Taylor &<br />
Fleming 1988, Penttinen et al. 1999, Sutinen et<br />
al. this issue). We determined the maximum σaanisotropy<br />
(orientation) <strong>of</strong> the tills at 12 sites with<br />
a Geonics EM38 (Geonics Ltd. Mississauga, Ont.<br />
Canada) device designed to a depth range <strong>of</strong> 1.5-2<br />
m (depending on material) in vertical coil position<br />
EM38(V). The <strong>fi</strong> eld campaign was carried out in<br />
August 2005.
<strong>Geological</strong> <strong>Survey</strong> <strong>of</strong> <strong>Finland</strong>, <strong>Special</strong> <strong>Paper</strong> <strong>46</strong><br />
Late Weichselian sheetfl ow drainage <strong>of</strong> subglacial Lokka ice lake<br />
Fig. 1. Anastomosing network <strong>of</strong> sheetfl ow tracks in the Lokka area, east-central Finnish Lapland. The Tanhua and Suoltijoki<br />
subsets are viewed in more detail in the text. The Tanhua fault line (tentatively Late Glacial Fault; LGF) shown with barbs<br />
turned towards the lower block. Descriptions <strong>of</strong> pre-Late Weichselian NE-W (top <strong>of</strong> the <strong>fi</strong> gure) and N-S (in the mid <strong>of</strong> the <strong>fi</strong> gure)<br />
oriented esker tracts were given in Sutinen (1992).<br />
57
<strong>Geological</strong> <strong>Survey</strong> <strong>of</strong> <strong>Finland</strong>, <strong>Special</strong> <strong>Paper</strong> <strong>46</strong><br />
Raimo Sutinen, Mari Jakonen, Pauliina Liwata and Eija Hyvönen<br />
Time-stratigraphic context<br />
The alignment <strong>of</strong> sheetfl ow tracks, fanning out to<br />
the southeast and south indicates drainage <strong>of</strong> large<br />
subglacial reservoir beneath the FIS after YD (Fig.<br />
1). The former Lokka ice-lake most likely was the<br />
source for the sheetfl ow system. The sheetfl ow pattern<br />
crosses the N-S oriented esker system (Fig. 1),<br />
previously interpreted as Mid-Weichselian by Sutinen<br />
(1992). Also, maximum σ a-anisotropy <strong>of</strong> the<br />
tills exhibited a rather concurrent pattern with the<br />
N-S eskers (Fig. 2) suggesting that the N-S oriented<br />
eskers were generated, probably through time-transgressive<br />
evolution (Banerjee & McDonald 1975),<br />
prior to the sheetfl ow drainage <strong>of</strong> Lake Lokka. The<br />
preservation <strong>of</strong> Mid-Weichselian eskers and tillsequence<br />
indicates that the erosion rate <strong>of</strong> the Late<br />
Weichselian ice-fl ow had been low in the Lokka region.<br />
Morphologically this is supported by the lack<br />
<strong>of</strong> erosional streamlined features commonly found<br />
inside the YD End Moraines (YDEMs; Nordkalott<br />
Project 1987). We also argue against high velocity<br />
fl ood events during the sheetfl ow drainage because<br />
58<br />
RESULTS AND DISCUSSION<br />
large regions had not eroded out <strong>of</strong> unconsolidated<br />
sediments (cf. Kor & Cowell 1998).<br />
Sheetfl ows vs. arborescent eskers<br />
The anastomosing pattern <strong>of</strong> sheetfl ow tracks in<br />
the Lokka region (Figs. 1 and 3) is different from<br />
those in lower parts <strong>of</strong> northern Fennoscandia and<br />
the Canadian Shield displaying river-like drainage<br />
pattern <strong>of</strong> widely spaced tributary branches. The<br />
arborescent esker chains can <strong>of</strong>ten be followed tens<br />
or even hundreds <strong>of</strong> kilometres (Nordkalott Project<br />
1987; Clark & Walder 1994). According to Clark<br />
and Walder (1994), anastomosing or braided channel<br />
systems are attributed to sedimentary terrains with<br />
<strong>fi</strong> ne-grained and low-permeability tills, not high-permeable<br />
tills underlain by crystalline bedrock as is the<br />
case in Lokka region. We found network patterns <strong>of</strong><br />
some eskers (Fig. 4) rather similar to those described<br />
earlier by Prest (1968) and, Shaw and Kvill (1984)<br />
in Saskatschewan, Canada. However, discontinuities<br />
or even <strong>of</strong>fsets in the esker tracks are dif<strong>fi</strong> cult to explain<br />
without subglacial fault instability.<br />
Fig. 2. Anastomosing network <strong>of</strong> sheetfl ow tracks crosses the N-S-oriented esker ridges in the Lokka area. Note the majority <strong>of</strong><br />
maximum σ a-anisotropy <strong>of</strong> tills oriented transversally to the sheetfl ow system, but rather than concurrently with the N-S eskers.
In Lokka, the sheetfl ow tracks were found to<br />
be less than 20 km wide and less than 60 km long,<br />
but were minor in cross-sectional channel form (cf.<br />
Wright 1973). The tracks show convex-up parts in<br />
their long pr<strong>of</strong>i les and cross topography regard-<br />
<strong>Geological</strong> <strong>Survey</strong> <strong>of</strong> <strong>Finland</strong>, <strong>Special</strong> <strong>Paper</strong> <strong>46</strong><br />
Late Weichselian sheetfl ow drainage <strong>of</strong> subglacial Lokka ice lake<br />
less <strong>of</strong> slope. The tracks may cross the topography<br />
with 8% <strong>of</strong> slope displaying evidence <strong>of</strong> subglacial<br />
origin. The tracks contained both erosional channels<br />
and esker ridges. In some cases, the tracks exhibited<br />
3-12 parallel or subparallel ridges 5-10 m in height<br />
Fig. 3. A compilation <strong>of</strong> DEM (data from National Land <strong>Survey</strong>) and low altitude AGR (γ K ; by <strong>Geological</strong><br />
<strong>Survey</strong> <strong>of</strong> <strong>Finland</strong>) outlining the anastomosing network <strong>of</strong> sheetfl ow tracks within the Suoltijoki<br />
subset area. The grid size is 5 by 5 km.<br />
Fig. 4. A downfl ow outlook <strong>of</strong> the network <strong>of</strong> parallel/ subparallel esker ridges in the Suoltijoki subset area.<br />
59
<strong>Geological</strong> <strong>Survey</strong> <strong>of</strong> <strong>Finland</strong>, <strong>Special</strong> <strong>Paper</strong> <strong>46</strong><br />
Raimo Sutinen, Mari Jakonen, Pauliina Liwata and Eija Hyvönen<br />
(Fig. 4). Hence, the drainage mechanism is dissimilar<br />
to subglacial tunnel valleys as having wide<br />
and steep walled pr<strong>of</strong>i les (Wright 1973, Kozlowski<br />
et al. 2005) and sometimes containing hummocky<br />
moraines on the bottom <strong>of</strong> the channels (Sjogren et<br />
al. 2002). The original concept <strong>of</strong> tunnel valleys in<br />
Minnesota by Wright (1973) suggests that the meltwater<br />
reservoir likely existed in Hudson Bay and the<br />
valleys had been carved by high-velocity subglacial<br />
streams driven by the hydrostatic pressure under active<br />
ice. However, as the ice thinned to stagnation<br />
the hydrostatic head was lost and small eskers along<br />
the tunnel valleys were deposited (Wright 1973).<br />
This was not the case with the sheetfl ow tracks in<br />
Lokka because the formation <strong>of</strong> a braided system<br />
<strong>of</strong> tunnel valleys is unlikely in a region typi<strong>fi</strong> ed by<br />
thin drift underlain by crystalline bedrock (Clark &<br />
Walder 1994). Even though the outbursts and massfl<br />
ows <strong>of</strong> debris appeared to be due to abrupt events,<br />
no high-velocity events had preceded the esker<br />
deposition, otherwise large regions had eroded out<br />
<strong>of</strong> unconsolidated sediments (Kor & Cowell 1998).<br />
Mode <strong>of</strong> sheetfl ow deposition<br />
The esker ridges within the sheetfl ow tracks (Figs.<br />
1, 3-4) did not display evidence <strong>of</strong> time-transgressive<br />
evolution within the close proximity <strong>of</strong> retreating<br />
ice margin (Banerjee & McDonald 1975), but<br />
were generated by short-lived subglacial massfl<br />
ows. Hence, the mode <strong>of</strong> formation was different<br />
from those in openwork sedimentation (Banerjee<br />
& MacDonald 1975). The conduit in<strong>fi</strong> ll deposits,<br />
found in the cores <strong>of</strong> eskers and involving fl ow <strong>of</strong><br />
slurry material and heterogeneous suspension mode<br />
<strong>of</strong> full-pipe transport (Sutinen 1992) more likely<br />
was the mode <strong>of</strong> deposition in the sheetfl ow esker<br />
ridges in Lokka. Similarly to transition in particle<br />
size distribution between tills, mass-fl ow sediments<br />
(fl ow tills) and esker sediments in conduit in<strong>fi</strong> lls<br />
(Sutinen 1992, see also Fromm 1965), we argue<br />
that transition from mass-fl ows to full-pipe fl ows<br />
occurred in the conduits. Comparable to cases in the<br />
Lokka region, the lack <strong>of</strong> openwork sediments on<br />
the surfaces <strong>of</strong> the esker ridges, subangular stones<br />
and blocks on the eskers and poorly sorted material<br />
are regarded as evidence <strong>of</strong> short transport distance<br />
<strong>of</strong> esker materials by Tanner (1915) in the Utsjoki<br />
region, <strong>Finland</strong> and by Fromm (1965) in Norrbotten,<br />
Sweden.<br />
Neotectonic instability and Lake Lokka<br />
The alignment <strong>of</strong> the network <strong>of</strong> sheetfl ow tracks<br />
suggests that a subglacial water body had most<br />
likely been present in the Lake Lokka basin (Fig.<br />
1). The presence <strong>of</strong> lakes beneath the Pleistocene<br />
60<br />
ice sheets is supported by radar evidence showing<br />
large subglacial lakes beneath the AIS (Robin et al.<br />
1970, Kapitsa et al. 1996, Siegert 2000). However,<br />
the permanence <strong>of</strong> the Antarctic lakes seems to be<br />
synchronized with the seismic stability due to the<br />
equilibrium between the crustal subsidence and the<br />
overlying masses <strong>of</strong> the AIS (Johnson 1987). In<br />
contrast to the aseismic interior parts <strong>of</strong> the modern<br />
ice sheets (Johnson 1987), glacio-isostatic rebound<br />
made the crust highly instable at the retreating margin<br />
<strong>of</strong> FIS within and after YDEM (Arvidsson 1996,<br />
Wu et al. 1999, Fjeldskaar et al. 2000, Stewart et<br />
al. 2000). On the basis <strong>of</strong> the crustal subsidence-rebound<br />
model (Stewart et al. 2000), we suspect that<br />
fault instability was the driving force for the sheetfl<br />
ow outbursts <strong>of</strong> subglacial Lake Lokka beneath<br />
the FIS shortly after the YDEM-phases. One <strong>of</strong> the<br />
major fault lines (tentatively late glacial fault; LGF)<br />
was revealed with a compilation <strong>of</strong> AM and DEM<br />
(Fig. 5) in the Tanhua area (see location in Fig. 1).<br />
The vertical escarpment was clearly visible in the<br />
<strong>fi</strong> eld with a lower block in the up-ice direction (Fig.<br />
6), hence being directionally consistent with the<br />
postglacial rebound concept (Stewart et al. 2000).<br />
However, the appearance <strong>of</strong> the Tanhua escarpment<br />
is dissimilar to those within the PGFs, where<br />
previously deposited sediments (e.g. dating back to<br />
Younger Dryas) have undergone drastic earthquake<br />
deformations (Lagerbäck 1990, Dehls et al. 2000).<br />
Rather, the sheetfl ow tracks crossing the fault line,<br />
particularly without signs <strong>of</strong> collapsed esker forms,<br />
more likely were syndepositional with or shortly<br />
after the subglacial faulting.<br />
The abundance <strong>of</strong> sheetfl ow tracks in the Lokka<br />
area (Fig. 1) has required the presence <strong>of</strong> a large<br />
amount <strong>of</strong> subglacial meltwater. The hydrology<br />
model by Arnold and Sharp (2002) suggests that<br />
the FIS in northern Fennoscandia was warm-based<br />
during deglaciation after 16,000 yr BP and a substantial<br />
amount <strong>of</strong> meltwater had discharged in<br />
14,000-12,000 yr BP. Hence, potential volumes <strong>of</strong><br />
subglacial water existed during the YDEMs. Subglacial<br />
lakes, capable <strong>of</strong> bringing about catastrophic<br />
outbursts, may also be due to volcanic eruptions<br />
(Björnsson 1998), but no evidence indicates Late<br />
Pleistocene volcanic activity in the Lokka region.<br />
It remains unclear if the sheetfl ows were due to one<br />
major fault deformation (see Fig. 1, 5-6) or if several<br />
faults transgressively contributed to subglacial<br />
meltwater outbursts (see Sutinen et al. this issue).<br />
Since the sheetfl ow tracks display discontinuities<br />
and sometimes <strong>of</strong>fsets (see Fig. 1), multiple faults<br />
were apparently present and most likely concurrent<br />
with the maximum fault instability in Fennoscandia<br />
11,000-9,000 yr BP (Wu et al. 1999).
Fig. 5. A compilation <strong>of</strong> low<br />
altitude airborne magnetic<br />
(AM by the <strong>Geological</strong> <strong>Survey</strong><br />
<strong>of</strong> <strong>Finland</strong>) and DEM (from<br />
National Land <strong>Survey</strong>) data<br />
coincidentally demonstrating<br />
fault lineament; here interpreted<br />
as Tanhua Late Glacial<br />
Fault (LGF). The grid size is<br />
one by one km.<br />
Fig. 6. A view showing the Tanhua LGF escarpment (peat bog<br />
on the left towards the lower (up-ice) block. Note absence <strong>of</strong><br />
sediments on the LGF escarpment and postglacial weathering<br />
<strong>of</strong> rock.<br />
<strong>Geological</strong> <strong>Survey</strong> <strong>of</strong> <strong>Finland</strong>, <strong>Special</strong> <strong>Paper</strong> <strong>46</strong><br />
Late Weichselian sheetfl ow drainage <strong>of</strong> subglacial Lokka ice lake<br />
61
<strong>Geological</strong> <strong>Survey</strong> <strong>of</strong> <strong>Finland</strong>, <strong>Special</strong> <strong>Paper</strong> <strong>46</strong><br />
Raimo Sutinen, Mari Jakonen, Pauliina Liwata and Eija Hyvönen<br />
Arnold, N. & Sharp, M. 2002. Flow variability in the Scandinavian<br />
ice sheet: modelling the coupling between ice<br />
sheet fl ow and hydrology. Quaternary Science Reviews 21,<br />
485–502.<br />
Arvidsson, R. 1996. Fennoscandian earthquakes: whole crustal<br />
rupturing related to postglacial rebound. Science 274,<br />
744–7<strong>46</strong>.<br />
Banerjee, I. & McDonald, B. C. 1975. Nature <strong>of</strong> esker sedimentation.<br />
In: Joping, A. V. & McDonald, B. C. (eds.)<br />
Glacvi<strong>of</strong>l uvial and glaciolacustrine sedimentation, Tulsa,<br />
Oklahoma. Society <strong>of</strong> Economic Paleontologists and Mineralogists,<br />
<strong>Special</strong> Publication 23, 132–154.<br />
Björnsson, H. 1998. Hydrological characteristics <strong>of</strong> the drainage<br />
system beneath a surging glacier. Nature 395, 771–<br />
774.<br />
Clark, P. U. & Walder, J. S. 1994. Subglacial drainage, eskers<br />
and deforming beds beneath the Laurentide and Eurasian<br />
ice sheets. Bulletin <strong>of</strong> the <strong>Geological</strong> Society <strong>of</strong> America<br />
106, 304–314.<br />
Dehls, J. F., Olesen, O., Olsen, L. & Blikra, L. H. 2000. Neotectonic<br />
faulting in northern Norway, the Stuoragurra and<br />
Nordmannvikdalen faults. Quaternary Science Reviews 19,<br />
1447–1<strong>46</strong>0.<br />
Fjeldskaar, W., Lindholm, C., Dehls, J. F. & Fjeldskaar, I.<br />
2000. Postglacial uplift, neotectonics and seismicity in Fennoscandia.<br />
Quaternary Science Reviews 1, 1413–1422.<br />
Fromm, E. 1965. Beskrivning till jordartskarta over Norrbottens<br />
län nedanför Lappmarksgränsen. With English summary:<br />
Quaternary deposits <strong>of</strong> the southern part <strong>of</strong> the<br />
Norrbotten countu. Sveriges Geologiska Undersökning Ca<br />
39. 236 p.<br />
Hyvönen, E. & Sutinen, R. 1998. Gamma-radiation applied<br />
to forest regeneration. In: Casas (ed.) Proc IV Meeting <strong>of</strong><br />
Environmental and Engineering Geophysical Society, September<br />
14–17, 1998, Barcelona, 813–816.<br />
Hyvönen, E., Pänttäjä, M., Sutinen, M.-L. & Sutinen, R.<br />
2003. Assessing site suitability for Scots pine using airborne<br />
and terrestrial gamma-ray measurements in Finnish Lapland.<br />
Canadian Journal <strong>of</strong> Forest Research 33, 796–806.<br />
Johnston, A. C. 1987. Suppression <strong>of</strong> earthquakes by large<br />
continental ice sheets. Nature 330, <strong>46</strong>7–<strong>46</strong>9.<br />
Kapitsa, A. P., Ridley, J. K., Robin, G. de Q., Siegert, M. J.<br />
& Zotikov, I. A. 1996. A large deep freshwater lake beneath<br />
the ice <strong>of</strong> central East Antarctica. Nature 381, 684–686.<br />
Kor, P. S. G. & Cowell, D. W. 1998. Evidence for catastrophic<br />
subglacial meltwater sheetfl ood events on the Bruce Peninsula,<br />
Ontario. Canadian Journal <strong>of</strong> Earth Sciences 35,<br />
1180–1202.<br />
Kozlowski, A. L., Kehew, A. E. & Bird, B. C. 2005. Outburst<br />
fl ood origin <strong>of</strong> the Central Kalamazoo River Valley, Michigan,<br />
USA. Quaternary Science Reviews 24, 2345–2374.<br />
Lagerbäck, R. 1990. Late Quaternary faulting and paleoseismicity<br />
in northern Fennoscandia with particular reference<br />
to the Landsjärv area, northern Sweden. Geologiska Föreningens<br />
I Stockholm Förhandlingar 112, 333–354.<br />
Nordkalott Project. 1987. <strong>Geological</strong> map, Northern Fennoscandia,<br />
1:1 mill. <strong>Geological</strong> <strong>Survey</strong>s <strong>of</strong> <strong>Finland</strong>, Norway<br />
and Sweden.<br />
62<br />
REFERENCES<br />
Ojala, V. J., Kuivamäki, A. & Vuorela, P. 2004. Postglacial<br />
deformation <strong>of</strong> bedrock in <strong>Finland</strong>. <strong>Geological</strong> <strong>Survey</strong> <strong>of</strong><br />
<strong>Finland</strong>, Nuclear Waster Disposal Research, Report YST-<br />
120. 23 p.<br />
Penttinen, S., Sutinen, R. & Hänninen, P. 1999. Determination<br />
<strong>of</strong> anisotropy <strong>of</strong> tills by means <strong>of</strong> azimuthal resistivity<br />
and conductivity measurements. Nordic Hydrology 30,<br />
317–332.<br />
Prest, V. K. 1968. Nomenclature <strong>of</strong> moraines and ice-fl ow features<br />
as applied to the glacial map <strong>of</strong> Canada. <strong>Geological</strong><br />
<strong>Survey</strong> <strong>of</strong> Canada, <strong>Paper</strong> 67–57. 32 p.<br />
Robin, G. de Q., Swithinbank, C. W. M. & Smith, B. M.<br />
E. 1970. Radio echo exploration <strong>of</strong> the Antactic ice sheet.<br />
International Association <strong>of</strong> Scienti<strong>fi</strong> c Hydrology 86, 97–<br />
115.<br />
Shaw, J. & Kvill, D. 1984. A glaci<strong>of</strong>l uvial origin for drumlins<br />
<strong>of</strong> the Livingstone Lake area, Saskattchewan. Canadian<br />
Journal <strong>of</strong> Earth Sciences 21, 1442–1459.<br />
Siegert, M. J. 2000. Antarctic subglacial lakes. Earth Science<br />
Reviews 50, 29–50.<br />
Siegert, M. J., Kwok, R., Mayer, C. & Hubbard, B. 2000.<br />
Water excange between the subglacial Lake Vostok and the<br />
overlying ice sheet. Nature 403, 643–6<strong>46</strong>.<br />
Sjogren, D. B., Fisher, T. G., Taylor, L. D., Jol, H. M. &<br />
Munro-Stasiuk, M. J. 2002. Incipient tunnel channels.<br />
Quaternary International 90, 41–56.<br />
Stewart, I. S., Sauber, J. & Rose, J. 2000. Glacio-seismotectonics:<br />
ice sheets, crustal deformation and seismicity. Quaternary<br />
Science Reviews 19, 1367–1389.<br />
Sutinen, R. 1992. Glacial deposits, their electrical properties<br />
and surveying by image interpretation and ground penetrating<br />
radar. <strong>Geological</strong> <strong>Survey</strong> <strong>of</strong> <strong>Finland</strong>, Bulletin 359. 123<br />
p.<br />
Sutinen, R. 2005. Timing <strong>of</strong> early Holocene landslides in Kittilä,<br />
Finnish Lapland. <strong>Geological</strong> <strong>Survey</strong> <strong>of</strong> <strong>Finland</strong>, <strong>Special</strong><br />
<strong>Paper</strong> 40, 53–58.<br />
Sutinen, R., Hyvönen, E., Ruther, A., Ahl, A. & Sutinen, M.-<br />
L. 2005. Soil-driven timberline <strong>of</strong> spruce (Picea abies) in<br />
Tanaelv Belt-Lapland Granulite transition, <strong>Finland</strong>. Arctic,<br />
Antarctic, and Alpine Research 37: 4, 611–619.<br />
Sutinen, R., Piekkari, M. & Liwata, P. Time-transgressive<br />
evolution <strong>of</strong> landslides possibly induced by seismotectonic<br />
events in Lapland. <strong>Geological</strong> <strong>Survey</strong> <strong>of</strong> <strong>Finland</strong>, <strong>Special</strong><br />
<strong>Paper</strong> <strong>46</strong> (this publication), 121-128.<br />
Tanner, V. 1915. Studier öfver kvartärsystemet in Fennoskandias<br />
nordliga delar. III. Om landisens rörelser och afsmältning<br />
i Finska Lappland och angränsande trackter. Bulletin de la<br />
Commission géologique de <strong>Finland</strong>e 38. 815 p.<br />
Taylor, R. W. & Fleming, A. 1988. Characterizing jointed systems<br />
by azimuthal resistivity surveys. Ground Water 26: 4,<br />
<strong>46</strong>4–474.<br />
Wright, H. E. J. 1973. Tunnel valleys, glacial surges, and<br />
subglacial hydrology <strong>of</strong> the Superior lobe, Minnesota. In:<br />
Black, R. F., Goldthwait, R. P. & William, H. B. (eds.) <strong>Geological</strong><br />
Society <strong>of</strong> America Memoir 136, 251–276.<br />
Wu, P., Johnston, P. & Lambeck, K. 1999. Postglacial rebound<br />
and fault instability in Fennoscandia. Geophysical<br />
Journal International 139, 657–670.
Applied Quaternary research in the central part <strong>of</strong> glaciated terrain,<br />
edited by Peter Johansson and Pertti Sarala.<br />
<strong>Geological</strong> <strong>Survey</strong> <strong>of</strong> <strong>Finland</strong>, <strong>Special</strong> <strong>Paper</strong> <strong>46</strong>, 63–68, 2007.<br />
SPATIAL DISTRIBUTION AND MORPHOLOGICAL ASPECTS<br />
OF ESKERS AND BEDROCK VALLEYS IN NORTH ESTONIA:<br />
IMPLICATIONS FOR THE RECONSTRUCTION OF A SUBGLACIAL<br />
DRAINAGE SYSTEM UNDER THE LATE WEICHSELIAN BALTIC ICE<br />
STREAM<br />
by<br />
Maris Rattas 1<br />
Rattas. M. 2007. Spatial distribution and morphological aspects<br />
<strong>of</strong> eskers and bedrock valleys in north Estonia: implications for<br />
the reconstruction <strong>of</strong> a subglacial drainage system under the Late<br />
Weichselian Baltic Ice Stream. Applied Quaternary research in<br />
the central part <strong>of</strong> glaciated terrain. <strong>Geological</strong> <strong>Survey</strong> <strong>of</strong> <strong>Finland</strong>,<br />
<strong>Special</strong> <strong>Paper</strong> <strong>46</strong>, 63–68, 4 <strong>fi</strong> gures.<br />
The spatial distribution <strong>of</strong> eskers and bedrock valleys, their<br />
antecedent role in draining subglacial meltwater and their relationship<br />
to bedrock lithology are discussed. Bedrock valleys and<br />
eskers are arranged in a sub-parallel pattern refl ecting former<br />
meltwater fl ow towards the ice margin. Several esker systems<br />
are con<strong>fi</strong> ned to the valley limits following either the valley fl oors<br />
or lying upon their shoulders. Such spatial relationships suggest<br />
that the initial focusing <strong>of</strong> meltwater may have been controlled<br />
by the location <strong>of</strong> bedrock valleys. Alternatively, some <strong>of</strong> the<br />
buried valleys or segments <strong>of</strong> valleys may be the result <strong>of</strong> tunnel<br />
valley formation. Some valleys have clear morphological characteristics<br />
<strong>of</strong> a tunnel valley, like abrupt termination and undulating<br />
or convex-up longitudinal pr<strong>of</strong>i les. Sedimentary records suggest<br />
that some valley in<strong>fi</strong> ll and esker sediments may have been developed<br />
as a successive formation.<br />
Key words (GeoRef Thesaurus, AGI): glacial geology, subglacial<br />
environment, meltwater, drainage patterns, eskers, valleys, Pleistocene,<br />
Weichselian, Estonia.<br />
1 Institute <strong>of</strong> Geology, University <strong>of</strong> Tartu, Vanemuise <strong>46</strong>,<br />
EE-51014, Tartu, Estonia<br />
E-mail: maris.rattas@ut.ee<br />
63
<strong>Geological</strong> <strong>Survey</strong> <strong>of</strong> <strong>Finland</strong>, <strong>Special</strong> <strong>Paper</strong> <strong>46</strong><br />
Maris Rattas<br />
Subglacial meltwater storage and drainage have<br />
been identi<strong>fi</strong> ed as a key factor in determining rates<br />
<strong>of</strong> glacier fl ow and patterns and processes <strong>of</strong> subglacial<br />
sedimentation. Warmed-based Pleistocene ice<br />
sheets appear to be drained <strong>of</strong> their basal meltwater<br />
either by channelized fl ow or as groundwater fl ow<br />
(Benn & Evans 1998). The subglacial tunnel discharge<br />
and groundwater fl ow are coupled depending<br />
on water pressure gradients, primarily controlled by<br />
the basal melting rate and bed transmissivity (Boulton<br />
et al. 2001, 2003). The quantity <strong>of</strong> meltwater<br />
that can fl ow away as groundwater determines how<br />
much is left for tunnels, and it is therefore one <strong>of</strong> the<br />
key issues in understanding the spatial distribution<br />
<strong>of</strong> eskers and tunnel valleys.<br />
Estonia plays a signi<strong>fi</strong> cant role in the former<br />
meltwater drainage characteristics and pathways in<br />
the region <strong>of</strong> the Scandinavian Ice Sheet, between<br />
the Fennoscandian Shield and the Paleozoic sedimentary<br />
rock basin. Typical esker systems occur<br />
only in the northern and western parts <strong>of</strong> the territory<br />
associated with less permeable Ordovician and<br />
Silurian carbonaceous bedrock. Further to south,<br />
in areas <strong>of</strong> more permeable Devonian siliciclastic<br />
rocks (mostly sandstone) typical esker systems are<br />
less common and subglacial water has to be drained<br />
through the permeable bed or through the bedrock/<br />
tunnel valleys (Fig. 1). However, following the bedrock<br />
lithology, we see two totally different bedrock<br />
valley systems; in the carbonaceous bedrock area<br />
the valleys are distributed parallel to one another<br />
and arranged mostly from the northwest to southeast;<br />
in the Devonian sandstone area, they have a<br />
more uneven distribution forming a complicated<br />
jointed drainage network.<br />
The broad aim <strong>of</strong> the ongoing project is to<br />
evaluate the meltwater drainage system beneath<br />
the Weichselian Baltic Ice Stream and to determine<br />
64<br />
INTRODUCTION<br />
Fig. 1. A general geological map <strong>of</strong> Estonia showing the distribution<br />
<strong>of</strong> bedrock valleys (by Suuroja 1997), eskers (by Kajak<br />
1999) and the Late Weichselian ice margins (by Kalm 2006).<br />
the role <strong>of</strong> subglacial tunnels in groundwater fl ow<br />
patterns during the last glaciation period in Estonia.<br />
Further details <strong>of</strong> studies include the identi<strong>fi</strong> cation<br />
and documentation <strong>of</strong> subglacial tunnels and their<br />
morpho-sedimentary relations to evaluate the development<br />
<strong>of</strong> the subglacial drainage system and<br />
to construct a relative chronology for the last deglaciation<br />
events in the region. The distribution and<br />
morphology <strong>of</strong> eskers and bedrock valleys has been<br />
thoroughly mapped (Kajak 1999, Suuroja 1997), but<br />
the nature <strong>of</strong> sediments and hydrologic characteristics<br />
<strong>of</strong> the tunnels are still poorly de<strong>fi</strong> ned. Up to now,<br />
no direct interpolations have been made to identify<br />
which <strong>of</strong> the bedrock valleys, both buried and open,<br />
can be considered to be <strong>of</strong> subglacially meltwatereroded<br />
origin. In this paper, the spatial distribution<br />
<strong>of</strong> eskers and bedrock valleys, their antecedent role<br />
in draining subglacial meltwater and their relationship<br />
to bedrock lithology will be discussed.
<strong>Geological</strong> <strong>Survey</strong> <strong>of</strong> <strong>Finland</strong>, <strong>Special</strong> <strong>Paper</strong> <strong>46</strong><br />
Spatial distribution and morphological aspects <strong>of</strong> eskers and bedrock valleys in north Estonia: implications for the reconstruction<br />
<strong>of</strong> a subglacial drainage system under the Late Weichselian Baltic Ice Stream<br />
In northern Estonia, bedrock valleys appear in the<br />
morphology <strong>of</strong> the incised substratum either at the<br />
present land surface or are buried under younger<br />
sediments (Fig. 2). The origin <strong>of</strong> the valleys has<br />
been a matter <strong>of</strong> controversy and in many cases, a<br />
composite origin should be considered. A number<br />
<strong>of</strong> valleys originated from the pre-Quaternary river<br />
drainage (Miidel & Raukas 1991), but were de<strong>fi</strong> -<br />
nitely heavily modi<strong>fi</strong> ed during the glaciation cycles.<br />
Older, pre-existing valleys have been re-used as<br />
subglacial drainage pathways and preferentially<br />
eroded over and over again during several glaciations.<br />
Individual valleys can be characterized as rectilinear<br />
to slightly sinuous, mostly orientated parallel<br />
or near parallel to the direction <strong>of</strong> ice movement,<br />
that is northwest to southeast. Thus, direct glacial<br />
erosion (quarrying) is considered to have played the<br />
most important role on their formation (Tavast &<br />
Raukas 1982). Occasionally the valleys are abrupt,<br />
with up to 90° angld bends that appear to be related<br />
to the bedrock fracture zones. Maximum valley<br />
BEDROCK VALLEYS<br />
depths reach about 150 m (to about 150 m a.s.l.)<br />
in the fore-clint area, but in the area <strong>of</strong> carbonate<br />
plateau generally not more than 10-40 m. The width<br />
is <strong>of</strong>ten 200-600 m, but may range up to 2 km in<br />
the fore-clint area. The cross-sections are mostly Ushaped<br />
with rather steep sides and fl at fl oors. Often<br />
the valleys contain postglacial streams, lakes and<br />
small bogs along the valley fl oors (Fig. 2).<br />
The sedimentary in<strong>fi</strong> ll <strong>of</strong> deeper buried valleys<br />
consists <strong>of</strong> several till beds strati<strong>fi</strong> ed with aqueoglacial<br />
deposits, and may be as old as Saalian, and in<br />
places, Eemian interglacial deposits (Raukas 1978,<br />
Kadastik et al. 2003). Shallow valleys <strong>of</strong>ten contain<br />
only meltwater deposits lying directly on the valley<br />
fl oor and with a relatively coarse grained material in<br />
the lower unit. The morphological characteristics <strong>of</strong><br />
these valleys suggest strong erosion by pressurized<br />
water in the tunnels. Longitudinal valley pr<strong>of</strong>i les<br />
are slightly irregular with multiple lows and thresholds.<br />
Some valleys begin and then terminate rather<br />
abruptly.<br />
Fig. 2. Digital elevation model (DEM) <strong>of</strong> the bedrock surface showing the relationship between bedrock valleys<br />
and eskers in northern Estonia. DEM is constructed from geological mapping data with 5 m interval isolines.<br />
Postglacial streams and lakes <strong>of</strong>ten occur in bedrock valleys.<br />
65
<strong>Geological</strong> <strong>Survey</strong> <strong>of</strong> <strong>Finland</strong>, <strong>Special</strong> <strong>Paper</strong> <strong>46</strong><br />
Maris Rattas<br />
Eskers in Estonia are located in the northern part<br />
<strong>of</strong> the territory and are associated with Paleozoic<br />
carbonaceous bedrock. The morphology and sedimentology<br />
<strong>of</strong> eskers in Estonia were investigated in<br />
more detail in the 1960s (Rähni 1957, 1960, Raukas<br />
et al. 1971, cf. Karukäpp 2005). Entire esker ridges<br />
can vary from tens <strong>of</strong> metres to several kilometres<br />
in length. They are generally less than 500 m in<br />
width, but may exceed one kilometre. The relative<br />
height reaches up to 35 m, but is usually 10-20 m,<br />
and the gradient <strong>of</strong> the slopes is up to 40° (Raukas<br />
et al. 1971). The largest esker system crosses almost<br />
north to south and the central part <strong>of</strong> the Pandivere<br />
Upland has a length <strong>of</strong> about 60 km (Fig. 2). Eskers<br />
show a large variation in facies characteristics<br />
A preliminary model <strong>of</strong> meltwater drainage pathways<br />
has been presented according to the spatial<br />
distribution <strong>of</strong> eskers and bedrock valleys (Rattas<br />
2005, 2006). Several studies in the areas <strong>of</strong> the<br />
former ice sheets demonstrate that eskers and incised<br />
bedrock valleys are <strong>of</strong>ten interconnected (e.g.<br />
Attig et al. 1989, Fisher et al. 2005, Kozlowski et al.<br />
2005, Jørgensen & Sandersen 2006). In northern Estonia,<br />
both bedrock valleys and eskers are arranged<br />
in a sub-parallel pattern, mostly from northwest to<br />
southeast, or sub-parallel to palaeo-ice streams refl<br />
ecting former meltwater fl ow towards the ice margin<br />
(Fig. 2). Most <strong>of</strong> the esker systems are con<strong>fi</strong> ned<br />
to the valley limits following either along the valley<br />
fl oors or lying upon valley shoulders or sometimes<br />
replacing a valley if it disappears over a short distance.<br />
Occasionally, some eskers cross valleys at<br />
rather sharp angles. This has been associated with<br />
late-glacial tectonic movements along tectonic fault<br />
zones (Rähni 1973) leading to the ice splitting and<br />
formation <strong>of</strong> open crevasses above the valleys. Considering<br />
that the main precondition for esker formation<br />
is low-permeability, and especially rigid substratum,<br />
then esker formation within valleys <strong>fi</strong> lled<br />
66<br />
ESKERS<br />
DISCUSSION<br />
indicating non-uniform sedimentation due to fast<br />
changes in meltwater volume, energy and velocity.<br />
Two general types <strong>of</strong> esker systems have been<br />
observed – those that have formed subglacially in<br />
tunnels and those that appear on the ice-marginals<br />
in deltaic or fan environments. Earlier investigations<br />
suggest that the majority <strong>of</strong> the radial eskers<br />
were formed in the open crevasses <strong>of</strong> the dead or<br />
passive ice (Raukas et al. 1971). There has been<br />
signi<strong>fi</strong> cant development in glacier hydrology and<br />
glacial sedimentology, and revision <strong>of</strong> the de<strong>fi</strong> nition<br />
and classi<strong>fi</strong> cation <strong>of</strong> Estonian eskers is needed<br />
regarding the morpho-sedimentary relations <strong>of</strong> eskers<br />
and the hydraulic processes responsible for their<br />
formation.<br />
with permeable s<strong>of</strong>t sediments, or above permeable<br />
tectonic fault zones could presumably be responsive<br />
to changes in subglacial hydraulic conditions<br />
leading to tunnel creation. When the tunnel forms,<br />
the water pressure rapidly decreases causing strong<br />
groundwater fl ow towards the tunnel. The large<br />
upward fl ow in tunnels and rapid pressure release<br />
seems to be responsible for carbonate precipitation.<br />
Such carbonate-cemented sand and gravel deposits<br />
are common in eskers and valley <strong>fi</strong> lls indicating<br />
their subglacial origin (Figs 3 and 4).<br />
The sedimentary record suggests that some valley<br />
in<strong>fi</strong> ll and esker sediments may have developed as<br />
a successive formation during periodical sedimentation<br />
by a number <strong>of</strong> meltwater fl ow episodes. Alternatively,<br />
some <strong>of</strong> the buried valleys or segments <strong>of</strong><br />
valleys may be the result <strong>of</strong> tunnel valley formation<br />
with clear morphological characteristics <strong>of</strong> a tunnel<br />
valley, like abrupt termination and undulating<br />
or convex-up longitudinal pr<strong>of</strong>i les. This suggests<br />
that the initial focusing <strong>of</strong> meltwater may have been<br />
controlled by the location <strong>of</strong> bedrock valleys, and<br />
the steady-state discharges most likely preferred to<br />
follow pre-de<strong>fi</strong> ned meltwater pathways.
<strong>Geological</strong> <strong>Survey</strong> <strong>of</strong> <strong>Finland</strong>, <strong>Special</strong> <strong>Paper</strong> <strong>46</strong><br />
Spatial distribution and morphological aspects <strong>of</strong> eskers and bedrock valleys in north Estonia: implications for the reconstruction<br />
<strong>of</strong> a subglacial drainage system under the Late Weichselian Baltic Ice Stream<br />
Fig. 3. Poorly sorted cobble and boulder<br />
gravel are cemented by calcium carbonate<br />
due to groundwater discharge into<br />
the tunnel during the esker formation.<br />
See Fig. 2 for location (Photo: M. Rattas,<br />
2002).<br />
Fig. 4. Strongly cemented meltwater deposits on the slope <strong>of</strong> buried valley. See Fig. 2 for location (Photo: M. Rattas, 2002).<br />
67
<strong>Geological</strong> <strong>Survey</strong> <strong>of</strong> <strong>Finland</strong>, <strong>Special</strong> <strong>Paper</strong> <strong>46</strong><br />
Maris Rattas<br />
In northern Estonia, bedrock valleys and eskers are<br />
arranged in a sub-parallel pattern refl ecting former<br />
meltwater fl ow towards the ice margin. The spatial<br />
relationships between bedrock valleys and eskers<br />
suggest that the initial meltwater focusing may have<br />
been controlled by the location <strong>of</strong> bedrock valleys.<br />
The steady-state discharges most likely preferred to<br />
follow pre-de<strong>fi</strong> ned meltwater pathways. Sedimen-<br />
The study is supported by research grant No 6962<br />
and the target-<strong>fi</strong> nanced project SF0182530s03 from<br />
the Estonian Science Foundation. The Estonian<br />
Attig, J. W., Michelson, D. M. & Clayton, L. 1989. Late Wisconsin<br />
landform distribution and glacier bed conditions in<br />
Wisconsin. Sedimentary Geology 62, 399–405.<br />
Benn, D. I. & Evans, D. J. A. 1998. Glaciers and Glaciations.<br />
London: Arnold. 734 p.<br />
Boulton, G. S., Zatsepin, S. & Maillot, B. 2001. Analysis <strong>of</strong><br />
groundwater fl ow beneath ice sheets. SKB Technical Report<br />
TR-01-06, 1–53.<br />
Boulton, G. S., Vidstrand, P., Maillot, B. & Zatsepin, S. 2003.<br />
Theory <strong>of</strong> drainage beneath ice sheets and the origin <strong>of</strong> esker<br />
and tunnel valley systems from the last European ice<br />
sheet. INQUA XVI International Congress, Reno, Nevada,<br />
USA, July 23–30, 2003. Programs with Abstracts, 124.<br />
Fisher, T. G., Jol, H. M. & Boudreau, A. M. 2005. Saginaw<br />
Lobe tunnel channels (Laurentide Ice Sheet) and their signi<strong>fi</strong><br />
cance in south-central Michigan, USA. Quaternary Science<br />
Reviews 25, 2375–2391.<br />
Jørgensen, F. & Sandersen, P. B. E. 2006. Buried and open<br />
tunnel valleys in Denmark – erosion beneath multiple ice<br />
sheet. Quaternary Science Reviews 25, 1339–1363.<br />
Kadastik, E., Kalm, V., Liivrand, E., Mäemets, H. & Sakson,<br />
M. 2003. Stratigraphy <strong>of</strong> a site with Eemian interglacial<br />
deposits in north Estonia (Juminda Peninsula). GFF<br />
125, 229–236.<br />
Kajak, K. 1999. Quaternary deposits <strong>of</strong> Estonia. Map in scale<br />
1:400 000. Explanatory note. Tallinn: <strong>Geological</strong> <strong>Survey</strong> <strong>of</strong><br />
Estonia. 34 p. (in Estonian)<br />
Kalm, V. 2006. Pleistocene chronostratigraphy in Estonia,<br />
southeastern sector <strong>of</strong> the Scandinavian glaciation. Quaternary<br />
Science Reviews 25, 960–975.<br />
Karukäpp, R. 2005. Eskers in the periphery <strong>of</strong> their distribution<br />
in North Estonia. Proceedings Estonian Academy <strong>of</strong><br />
Sciences. Geology 54, 26–39.<br />
Kozlowski, A. L., Kehew, A. E. & Bird, B. C. 2005. Outburst<br />
fl ood origin <strong>of</strong> the Central Kalamzoo River Valley, Michigan,<br />
USA. Quaternary Science Reviews 24, 2354–2374.<br />
Miidel, A. & Raukas, A. 1991. The evolution <strong>of</strong> the river systems<br />
in the East Baltic. In: Starkel, L., Gregory, K. J. &<br />
68<br />
CONCLUSIONS<br />
ACKNOWLEDGEMENTS<br />
REFERENCES<br />
tary records suggest that some valley in<strong>fi</strong> ll and esker<br />
sediments may have been developed as a successive<br />
formation. Alternatively, some <strong>of</strong> the buried valleys<br />
or segments <strong>of</strong> valleys may be the result <strong>of</strong> tunnel<br />
valley formation. Some valleys have clear morphological<br />
characteristics <strong>of</strong> a tunnel valley, like abrupt<br />
termination and undulating or convex-up longitudinal<br />
pr<strong>of</strong>i les.<br />
Land Board and the <strong>Geological</strong> <strong>Survey</strong> <strong>of</strong> Estonia<br />
provided the geological mapping data.<br />
Thornes, J. B. (eds.) Temperate Palaeohydrology. London:<br />
John Wiley & Sons Ltd., 365–380.<br />
Rattas, M. 2005. Subglacial drainage system under an East-<br />
Baltic Weichselian ice stream: distribution <strong>of</strong> eskers and<br />
tunnel valleys in Estonia. In: Kolka, V. & Korsakova, O.<br />
(eds.) Quaternary geology and landforming processes, proceedings<br />
<strong>of</strong> the International Field Symposium, Kola Peninsula,<br />
NW Russia, September 4–9, 2005. Apatity: Kola<br />
Science Centre RAS, 52–54.<br />
Rattas, M. 2006. Spatial distribution and morphological aspects<br />
<strong>of</strong> eskers and bedrock valleys in North Estonia. In: Johansson,<br />
P., Lunkka, J.-P. & Sarala, P. (eds.) Late Pleistocene<br />
glacigenic deposits in the central part <strong>of</strong> the Scandinavian<br />
ice sheet. The INQUA Peribaltic Group Field Symposium<br />
in <strong>Finland</strong>, September 11.–15. 2006. Abstracts. Rovaniemi:<br />
<strong>Geological</strong> <strong>Survey</strong> <strong>of</strong> <strong>Finland</strong>, 35.<br />
Raukas, A. 1978. Pleistocene deposits <strong>of</strong> the Estonian SSR.<br />
Tallinn: Valgus. 310 p. (in Russian)<br />
Raukas, A., Rähni, E. & Miidel, A. 1971. Marginal glacial<br />
formations in North Estonia. Tallinn: Valgus. 219 p. (in<br />
Russian)<br />
Rähni, E. 1957. About the morphology <strong>of</strong> eskers <strong>of</strong> Pandivere<br />
Upland, Estonian SSR. In: Gudelis, V. (ed.) Scienti<strong>fi</strong> c Reports<br />
IV: Transactions <strong>of</strong> the regional conference on the<br />
study <strong>of</strong> the Quaternary deposits <strong>of</strong> the Baltic states and the<br />
Byelorussian SSR. Academy <strong>of</strong> Sciences Lithuanian SSR,<br />
<strong>Geological</strong> and Geographical Institute, 363–369. (in Russian)<br />
Rähni, E. 1960. Über die Entstehung der Oser Nordestlands.<br />
ENSV TA Geoloogia Instituudi uurimused V, 259–268. (in<br />
Russian)<br />
Rähni, E. 1973. On the neotectonic block movements <strong>of</strong> the<br />
Earth’s crust on the territory <strong>of</strong> Estonia. Eesti NSV TA<br />
Toimetised. Keemia. Geoloogia 22, 331–340. (in Russian)<br />
Suuroja, K. 1997. The bedrock geological map <strong>of</strong> Estonia <strong>of</strong> a<br />
scale 1:400 000. Explanatory note. Tallinn: <strong>Geological</strong> <strong>Survey</strong><br />
<strong>of</strong> Estonia. 60 p. (in Estonian)<br />
Tavast, E. & Raukas, A. 1982. The bedrock relief <strong>of</strong> Estonia.<br />
Tallinn: Valgus. 194 p. (in Russian)
Applied Quaternary research in the central part <strong>of</strong> glaciated terrain,<br />
edited by Peter Johansson and Pertti Sarala.<br />
<strong>Geological</strong> <strong>Survey</strong> <strong>of</strong> <strong>Finland</strong>, <strong>Special</strong> <strong>Paper</strong> <strong>46</strong>, 69–78, 2007.<br />
TUNNEL CHANNELS OF THE SAGINAW LOBE, MICHIGAN, USA<br />
by<br />
Alan E. Kehew 1 and Andrew L. Kozlowski 2<br />
Kehew, A. E. & Kozlowski, A. L. 2007. Tunnel Channels <strong>of</strong> the<br />
Saginaw Lobe, Michigan, USA. Applied Quaternary research in<br />
the central part <strong>of</strong> glaciated terrain. <strong>Geological</strong> <strong>Survey</strong> <strong>of</strong> <strong>Finland</strong>,<br />
<strong>Special</strong> <strong>Paper</strong> <strong>46</strong>, 69–78, 10 <strong>fi</strong> gures.<br />
During the last advance <strong>of</strong> the Laurentide Ice Sheet into southern<br />
Michigan, USA, the Saginaw Lobe advanced asynchronously<br />
with respect to the adjacent Lake Michigan and Huron-Erie<br />
Lobes, reaching its terminal position <strong>fi</strong> rst, and then stagnating or<br />
retreating while the other lobes continued to advance.<br />
A complex network <strong>of</strong> tunnel channels was formed in an intermittent<br />
and time-transgressive fashion beneath the Saginaw<br />
Lobe. One set <strong>of</strong> fl ow-parallel channels radiates from E-W to<br />
NE-SW to N-S orientations around the lobe. The channels typically<br />
exceed one kilometer in width and tens <strong>of</strong> meters in depth.<br />
In places, eskers occupy valley bottoms <strong>of</strong> the tunnel channels.<br />
Another set <strong>of</strong> channels cuts orthogonally across these channels<br />
at an approximate orientation <strong>of</strong> E-W to NW-SE.<br />
Toward the southern limit <strong>of</strong> the Saginaw Lobe terrain, the<br />
channels were partially to nearly completely buried by ice and<br />
sediment deposited during collapse <strong>of</strong> the Saginaw Lobe and by<br />
sediment deposited during the overriding advances <strong>of</strong> the Lake<br />
Michigan and Huron-Erie Lobes. Relief in some channels subsequently<br />
increased as the buried ice melted. When the Lake Michigan<br />
Lobe began to retreat, the most recent set <strong>of</strong> tunnel channels,<br />
oriented trending westerly, were eroded by subglacial outbursts<br />
draining toward the former margin <strong>of</strong> the Saginaw Lobe.<br />
Five genetic types <strong>of</strong> tunnel channels were identi<strong>fi</strong> ed in southern<br />
Michigan. These include: large, unburied channels (Type I),<br />
palimpsest channels partially buried by an end moraine formed<br />
by a readvance <strong>of</strong> the same lobe (Type II), palimpsest channels<br />
nearly completely buried by a readvance <strong>of</strong> the same lobe and<br />
not located near an end moraine (Type III), palimpsest channels<br />
partially buried by an advance <strong>of</strong> a different lobe than that under<br />
which the channels originally formed (Type IV), and unburied to<br />
partially buried channels that contain eskers (Type V).<br />
Key words (GeoRef Thesaurus, AGI): glacial geology, glacial<br />
lobes, subglacial environment, meltwater channels, Pleistocene,<br />
Michigan, United States.<br />
1 Geosciences Dept., Western Michigan University., Kalamazoo,<br />
MI 49024 USA<br />
2 New York State Museum/Geologic <strong>Survey</strong>, 3140 Cultural<br />
Education Center, Albany, NY 12230 USA<br />
E-mail: alan.kehew@wmich.edu<br />
69
<strong>Geological</strong> <strong>Survey</strong> <strong>of</strong> <strong>Finland</strong>, <strong>Special</strong> <strong>Paper</strong> <strong>46</strong><br />
Alan E. Kehew and Andrew L. Kozlowski<br />
Recognition and descriptions <strong>of</strong> subglacially eroded<br />
channels formed beneath the former Laurentide and<br />
Scandinavian ice sheets have increased in recent<br />
years. These large, predominantly linear valleys are<br />
called tunnel channels when an origin by a single<br />
discharge <strong>of</strong> subglacial meltwater is inferred, or<br />
tunnel valleys when considered to form gradually<br />
or episodically, or when no genetic mechanism is<br />
implied (Clayton et al. 1999). Several de<strong>fi</strong> ning characteristics<br />
<strong>of</strong> tunnel channels include: 1) dimensions<br />
reaching > 100 km in length, 4 km in width, and >3<br />
m in depth, 2) generally straight reaches oriented<br />
parallel to the subglacial hydraulic gradient <strong>of</strong> the<br />
ice lobe, 3) undulating and adverse longitudinal gradients,<br />
and 4) irregular side slopes and valley bottoms<br />
(Kehew et al. 2007). The valleys appear to be<br />
most common near former ice margins, where they<br />
terminate at large glaci<strong>of</strong>l uvial fans. They may be<br />
prominent topographic features or buried either partially<br />
or completely by younger glacial drift. Eskers<br />
may or may not be present on the valley bottoms.<br />
Tunnel channels formed beneath the Scandinavian<br />
ice sheet have been described in German by<br />
Ehlers (1981), Grube (1983), and Piotrowski (1994).<br />
Jørgensen and Sanderson (2006) review the literature<br />
on Danish tunnel valleys. Most <strong>of</strong> the known<br />
tunnel channels associated with the Laurentide Ice<br />
Sheet are located in the glacial lobes <strong>of</strong> the Great<br />
Lakes region <strong>of</strong> North America. Wright (1973) <strong>fi</strong> rst<br />
interpreted valleys in Minnesota as erosional forms<br />
<strong>of</strong> catastrophic subglacial discharges. Other studies<br />
have focused on tunnel channels in Minnesota<br />
(Mooers 1989, Patterson 1994, Hooke & Jennings<br />
2006); Wisconsin (Attig et al. 1989, Clayton et al.<br />
1999, Johnson 1999, Cutler et al. 2002); Michigan<br />
(Kehew et al. 1999, 2005, Fisher & Taylor 2002,<br />
Sjogren et al. 2002, Fisher et al. 2005, Kozlowski et<br />
al. 2005); and Ontario (Brennand & Shaw 1994).<br />
70<br />
O ,<br />
C<strong>of</strong>aigh (1996) grouped the hypotheses for<br />
formation <strong>of</strong> tunnel channels into three main categories:<br />
(1) formation by subglacial sediment deformation,<br />
(2) gradual or time transgressive formation<br />
near ice margins, and (3) catastrophic subglacial<br />
sheet fl oods. The sediment deformation hypothesis<br />
is based on the work <strong>of</strong> Boulton and Hindmarsh<br />
(1987), who proposed that shallow channels carrying<br />
subglacial meltwater are initiated by piping from<br />
the ice margin and would gradually be enlarged by<br />
the creep <strong>of</strong> deformable sediment toward the channel<br />
and the subsequent removal <strong>of</strong> the sediment by<br />
meltwater fl ow. Opposition to this hypothesis is<br />
INTRODUCTION<br />
based upon arguments questioning the existence<br />
<strong>of</strong> a fl uid-pressure gradient toward the channels<br />
and the occurrence <strong>of</strong> tunnel channels in bedrock<br />
lithologies, in which sediment deformation would<br />
not be possible (O ,<br />
C<strong>of</strong>aigh 1996).<br />
Time transgressive formation near ice margins<br />
is a hypothesis advocated by many authors. Formation<br />
was suggested by Mooers (1989) to be a more<br />
gradual, steady process, in which subglacial meltwater<br />
was augmented by diversion <strong>of</strong> supraglacial<br />
meltwater to the base <strong>of</strong> the glacier. On the other<br />
hand, most hypotheses invoke a sudden or catastrophic<br />
release <strong>of</strong> channelized subglacial meltwater<br />
because <strong>of</strong> the large clast size deposited in ice-marginal<br />
fans located at the termination <strong>of</strong> the channels<br />
(Piotrowski 1994, Cutler et al. 2002) and the size<br />
and dimensions <strong>of</strong> the channels (Kozlowski et al.<br />
2005). The sudden release <strong>of</strong> subglacial reservoirs is<br />
<strong>of</strong>ten attributed to failure <strong>of</strong> a permafrost seal at the<br />
margin (Piotrowski 1994, 1997, Cutler et al. 2002,<br />
Jørgensen & Sanderson 2006, Hooke & Jennings,<br />
2006). Piotrowski (1997) and Hooke & Jennings<br />
(2006) suggest a cyclical process in which a seal<br />
is punctured and leads to a catastrophic release <strong>of</strong><br />
an impoundment, followed by the reestablishment<br />
<strong>of</strong> the seal and the re<strong>fi</strong> lling <strong>of</strong> the impoundment.<br />
Hooke & Jennings (2006) propose that piping and<br />
headward erosion back to meltwater impoundment<br />
initiate the outburst.<br />
The catastrophic subglacial meltwater hypothesis<br />
for tunnel channels is one component <strong>of</strong><br />
a complicated hypothesis for the origin <strong>of</strong> drumlins,<br />
Rogen moraine, megafl utes and other glacial<br />
landforms by broad subglacial sheetfl oods (Shaw<br />
2002). To account for the formation <strong>of</strong> landforms<br />
such as drumlins during the same megafl ood that<br />
produced tunnel channels, advocates suggest the<br />
transition from sheetfl ow to channelized fl ow as the<br />
event progresses (Fisher et al. 2005). The sheetfl ood<br />
hypothesis is controversial, however, and has been<br />
challenged on various grounds (Clarke et al. 2005,<br />
Evans et al. 2006).<br />
The presence <strong>of</strong> eskers in tunnel channels suggests<br />
that a depositional phase follows the erosional<br />
phase <strong>of</strong> channel formation, implying that the subglacial<br />
channel persists for a relatively long period<br />
<strong>of</strong> time. During deglaciation, collapse <strong>of</strong> ice and<br />
sediment into the channel may <strong>fi</strong> ll the channel for<br />
some period <strong>of</strong> time (Kehew et al. 1999, 2005, Kozlowski<br />
et al. 2005, Jørgensen & Sanderson 2006).<br />
Sediment from more recent glacial events may be
deposited over the <strong>fi</strong> lled channel, leading to crosscutting<br />
relationships that would be hard to explain<br />
without the presence <strong>of</strong> buried ice (Kehew et al.<br />
The topography <strong>of</strong> southern Michigan, also known<br />
as the Lower Peninsula, is strongly controlled by<br />
the three lobes <strong>of</strong> the Laurentide Ice Sheet that occupied<br />
the area during the last (Wisconsin) glaciation.<br />
Ice advanced into Michigan around 26,000 14 C<br />
yr BP and retreated for the last time around 11,000<br />
14 C yr BP (Larson & Schaetzl 2001). From west to<br />
east, the lobes include the Lake Michigan, the Saginaw,<br />
and the Huron-Erie Lobes (Figure 1). Both the<br />
Lake Michigan and Huron-Erie Lobes eroded deep<br />
troughs, now occupied by Lakes Michigan, Huron,<br />
and Erie. The Saginaw Lobe fl owed southwest-<br />
GLACIAL LOBES IN MICHIGAN<br />
<strong>Geological</strong> <strong>Survey</strong> <strong>of</strong> <strong>Finland</strong>, <strong>Special</strong> <strong>Paper</strong> <strong>46</strong><br />
Tunnel Channels <strong>of</strong> the Saginaw Lobe, Michigan, USA<br />
1999). Gradual melting <strong>of</strong> the buried ice creates the<br />
<strong>fi</strong> nal valley form, destroying the sharp, channel-like<br />
characteristics <strong>of</strong> the original valley.<br />
erly across the interior <strong>of</strong> the Peninsula, eroding<br />
Saginaw Bay <strong>of</strong> Lake Huron, which only extends<br />
partially along the fl ow path. Kehew et al. (2005)<br />
suggested that the Lake Michigan and Huron-Erie<br />
Lobes developed rapid, streaming fl ow, accounting<br />
for the size and depth <strong>of</strong> the troughs they created.<br />
By contrast, the central Saginaw Lobe advanced<br />
earlier into the area, but weakened or stagnated, as<br />
the fl anking lobes grew stronger and encroached<br />
upon the recently deglaciated Saginaw Lobe terrain<br />
(Kehew et al. 1999, 2005).<br />
Fig. 1. Hillshade DEM <strong>of</strong> the Lower Peninsula <strong>of</strong> Michigan showing approximate extent <strong>of</strong> Lake Michigan, Saginaw, and<br />
Huron-Erie Lobes <strong>of</strong> the Laurentide Ice Sheet. Boxes show locations <strong>of</strong> other <strong>fi</strong> gures. GV: Grand Valley. TV: Thornapple<br />
Valley. KV: Kalamazoo Valley.<br />
71
<strong>Geological</strong> <strong>Survey</strong> <strong>of</strong> <strong>Finland</strong>, <strong>Special</strong> <strong>Paper</strong> <strong>46</strong><br />
Alan E. Kehew and Andrew L. Kozlowski<br />
72<br />
SAGINAW LOBE TUNNEL CHANNELS<br />
The most distinctive feature <strong>of</strong> the Saginaw Lobe<br />
terrain is the network <strong>of</strong> sub-parallel channels that<br />
radiate outward from the center <strong>of</strong> the lobe. These<br />
channels are best developed down stream from the<br />
Saginaw Bay lowland, where they range in orientation<br />
from north-south in eastern part <strong>of</strong> the area, to<br />
northeast-southwest in the western part <strong>of</strong> the area<br />
(Fig. 2). These channels are interpreted as tunnel<br />
Fig. 2. Closeup view <strong>of</strong> tunnel channel networks <strong>of</strong> the central<br />
Saginaw Lobe.<br />
Fig. 3. Hillshade DEM displaying network<br />
<strong>of</strong> channels coalescing into the head <strong>of</strong> the<br />
central Kalamazoo Valley. Channels (black<br />
lines) interpreted as Saginaw Lobe tunnel<br />
channels. Dashed white lines are present<br />
day drainage divides. (From Kehew et al.<br />
2007).<br />
channels because <strong>of</strong> their orientation (parallel to the<br />
subglacial hydraulic gradient <strong>of</strong> the lobe), their undulating<br />
to adverse longitudinal pr<strong>of</strong>i les (Kozlowski<br />
et al. 2005) and the presence <strong>of</strong> eskers in some <strong>of</strong><br />
the channels. The network <strong>of</strong> channels is cross cut<br />
by channels oriented nearly perpendicular to them<br />
(east-west), the largest <strong>of</strong> which are (from north to<br />
south), the Grand Valley, the Thornapple Valley, and<br />
the Kalamazoo Valley (Fig. 1). These channels are<br />
deeper and are interpreted as younger tunnel channels,<br />
although the Grand Valley was utilized as a<br />
proglacial lake spillway and enlarged from its presumed<br />
original size (Kehew 1993). The east-west<br />
reach <strong>of</strong> the Kalamazoo Valley, which was probably<br />
eroded subaerially, appears to have been fed by an<br />
anastomosing network <strong>of</strong> southwest-trending tributary<br />
tunnel valleys (Fig. 3) that conveyed meltwater<br />
to an ice margin. (Kozlowski et al. 2005).<br />
South <strong>of</strong> the Kalamazoo Valley, the southwesttrending<br />
tunnel channels are much less distinct than<br />
the channels north <strong>of</strong> the valley. A major reason for<br />
this is that the channels appear to have been initially<br />
eroded when the Saginaw Lobe was at or near its<br />
Late Glacial Maximum (LGM) position, and then<br />
partially buried by sediment from later advances<br />
<strong>of</strong> the Saginaw Lobe or by sediment from the Lake
Michigan Lobe as it advanced into terrain vacated<br />
by the Saginaw Lobe. Because <strong>of</strong> their modi<strong>fi</strong> cation<br />
by subsequent advances, these tunnel channels<br />
have been described as palimpsest tunnel channels<br />
(Kehew et al. 1999). Cross-cutting relationships to<br />
be discussed below indicate that after formation,<br />
ice collapsed into the tunnel channel and became<br />
buried by debris, similar to tunnel channels in Denmark<br />
(Jørgensen & Sanderson 2006). This burial<br />
probably delayed melt out <strong>of</strong> the collapsed ice and<br />
formation <strong>of</strong> the valley for a period <strong>of</strong> hundreds to<br />
thousands <strong>of</strong> years.<br />
EXAMPLES OF TUNNEL CHANNEL MORPHOLOGY<br />
AND INFERRED FORMATION<br />
In this section, <strong>fi</strong> ve examples <strong>of</strong> tunnel channels will<br />
be presented to illustrate the range in topography<br />
and post-erosional modi<strong>fi</strong> cation.<br />
Type I Tunnel channels<br />
Type I tunnel channels are generally large and<br />
display the least degree <strong>of</strong> burial (Figs. 4 and 5).<br />
They are interpreted to form by a subglacial burst <strong>of</strong><br />
drainage to an ice margin followed by subsequent<br />
deglaciation without extensive collapse and <strong>fi</strong> lling<br />
with sediment. As a result, they are very distinct<br />
topographic features. Type I tunnel channels in the<br />
study area include both southwest and east-west<br />
Fig. 4. Locations <strong>of</strong> types <strong>of</strong> tunnel channels discussed in text.<br />
Locations shown on Fig. 1. A. Hillshade DEM <strong>of</strong> Thornapple<br />
Valley. B. Contour map made from DEM (countour interval<br />
approximately 3 m.) Kalamazoo Valley is large valley in upper<br />
part <strong>of</strong> diagram. Ice margin is the Kalamazoo Moraine <strong>of</strong> the<br />
Lake Michigan Lobe. C. Contour map made from DEM.<br />
<strong>Geological</strong> <strong>Survey</strong> <strong>of</strong> <strong>Finland</strong>, <strong>Special</strong> <strong>Paper</strong> <strong>46</strong><br />
Tunnel Channels <strong>of</strong> the Saginaw Lobe, Michigan, USA<br />
orientations. The east-west channels cross cut the<br />
southwest trending channels and are interpreted to<br />
be younger.<br />
Fig. 5. Origin <strong>of</strong> Type I tunnel channels. A. Subglacial erosion<br />
<strong>of</strong> tunnel channel into bedrock. B. Remnants <strong>of</strong> collapsed ice<br />
and debris in channel after deglaciation. The amount <strong>of</strong> ice is<br />
relatively small in this case. C. Valley after meltout <strong>of</strong> buried<br />
ice. Valley walls are relatively straight and smooth.<br />
73
<strong>Geological</strong> <strong>Survey</strong> <strong>of</strong> <strong>Finland</strong>, <strong>Special</strong> <strong>Paper</strong> <strong>46</strong><br />
Alan E. Kehew and Andrew L. Kozlowski<br />
Type II Tunnel channels<br />
Type II tunnel channels (Figs. 4C and 6) are palimpsest<br />
channels that cut through terminal moraines<br />
<strong>of</strong> a more recent advance than the advance in which<br />
the channels were formed. The Sturgis Moraine <strong>of</strong><br />
the Saginaw Lobe (Figs. 1 and 4C) is a good example<br />
<strong>of</strong> this type <strong>of</strong> tunnel channel. After erosion <strong>of</strong><br />
the subglacial channel, it was likely <strong>fi</strong> lled to the top<br />
with collapsed ice and debris. Collapsed ice in the<br />
channel was still present at the time <strong>of</strong> the subsequent<br />
advance <strong>of</strong> the Saginaw Lobe to the position<br />
at which it formed the Sturgis Moraine. Melting <strong>of</strong><br />
the buried, stagnant ice after formation <strong>of</strong> the moraine<br />
resulted in the development <strong>of</strong> indistinct valleys<br />
cutting through the moraine.<br />
Type III Tunnel channels<br />
The Type III tunnel channel (Fig. 4B and 7) represents<br />
another type <strong>of</strong> palimpsest tunnel channel.<br />
Here, after <strong>fi</strong> lling <strong>of</strong> the valley by collapsed ice, a<br />
subsequent advance <strong>of</strong> the Saginaw Lobe completely<br />
overrode the channel, probably the same advance<br />
that formed the Sturgis Moraine. A more complex<br />
<strong>fi</strong> ll, involving a diamicton from the later advance,<br />
and sur<strong>fi</strong> cial outwash, comprises the stratigraphy <strong>of</strong><br />
the channel. Because <strong>of</strong> the degree <strong>of</strong> post-erosional<br />
<strong>fi</strong> lling <strong>of</strong> the channel, channels <strong>of</strong> this type are very<br />
subtle features on the modern landscape. The two<br />
Type III tunnel channels shown on Fig. 4B are recognizable<br />
only by an alignment <strong>of</strong> lake basins and<br />
no valley exits at land surface.<br />
Fig. 7. Origin <strong>of</strong> Type III tunnel channels. A. Erosion <strong>of</strong> tunnel<br />
channel by Saginaw Lobe as in Fig. 5A and meltout <strong>of</strong> most<br />
or all <strong>of</strong> buried ice as in Fig. 5C. B. Readvance <strong>of</strong> Saginaw<br />
Lobe over site with deposition <strong>of</strong> diamicton (till). C. Outwash<br />
deposited during retreat <strong>of</strong> Saginaw Lobe or advance <strong>of</strong> Lake<br />
Michigan Lobe from west. Final valley is subtle, low relief<br />
topographic feature identi<strong>fi</strong> ed by linear chain <strong>of</strong> lakes on<br />
landscape.<br />
74<br />
Fig. 6. Origin <strong>of</strong> Type II tunnel channels. A. Channel eroded<br />
as in Fig. 5A by early advance <strong>of</strong> Saginaw Lobe, <strong>fi</strong> lled with<br />
thick buried ice and debris, and deglaciated by retreat <strong>of</strong> lobe.<br />
B. Readvance <strong>of</strong> the Saginaw Lobe to form Sturgis Moraine at<br />
terminal position <strong>of</strong> readvance (Figs. 4C and 1). C. Gradual<br />
meltout and collapse <strong>of</strong> buried ice to form present-day valley,<br />
which cuts through the moraine.
Type IV Tunnel channels<br />
The Type IV tunnel channel model is shown in<br />
Figs. 4B, 8 and 9A. This type <strong>of</strong> palimpsest tunnel<br />
channel forms when sediment from a different lobe<br />
than the lobe <strong>of</strong> origin partially buries the channel.<br />
The example in Figs. 4B and 9A was previously<br />
described by Kehew et al. (1999, 2005). As the<br />
Lake Michigan Lobe advanced into terrain that had<br />
been recently deglaciated by the Saginaw Lobe,<br />
large glaci<strong>of</strong>l uvial fans were deposited from the ice<br />
margin shown in Figs. 4B and 9A. These fans slope<br />
toward the large Saginaw Lobe tunnel channel and<br />
continue with exactly the same slope on southeast<br />
side <strong>of</strong> the channel. The best way to explain this<br />
cross cutting relationship is that the tunnel channel<br />
was completely <strong>fi</strong> lled with ice and debris at the time<br />
<strong>of</strong> fan deposition. After the fans were deposited, the<br />
buried ice gradually melted and the modern valley<br />
formed.<br />
Fig. 9. A. Digital elevation model <strong>of</strong><br />
Type IV tunnel channel. Origin <strong>of</strong><br />
channel conforms to model shown in<br />
Fig. 8. B. Digital elevation model <strong>of</strong><br />
Type V tunnel channels containing<br />
eskers. Origin shown in Fig. 10.<br />
<strong>Geological</strong> <strong>Survey</strong> <strong>of</strong> <strong>Finland</strong>, <strong>Special</strong> <strong>Paper</strong> <strong>46</strong><br />
Tunnel Channels <strong>of</strong> the Saginaw Lobe, Michigan, USA<br />
Fig. 8. Origin <strong>of</strong> Type IV tunnel channels. A. Tunnel channel<br />
is subglacially eroded and completely <strong>fi</strong> lled with ice and debris.<br />
B. Lake Michigan Lobe advances from west and deposits<br />
outwash fans over buried tunnel channel. C. Buried ice melts<br />
to form present-day valley. Slope <strong>of</strong> fan remnants west <strong>of</strong><br />
valley slope is identical to slope <strong>of</strong> fan remnants east <strong>of</strong> valley.<br />
75
<strong>Geological</strong> <strong>Survey</strong> <strong>of</strong> <strong>Finland</strong>, <strong>Special</strong> <strong>Paper</strong> <strong>46</strong><br />
Alan E. Kehew and Andrew L. Kozlowski<br />
Type V Tunnel channels<br />
The last type <strong>of</strong> tunnel channel to be described is<br />
shown in Figs. 4A, 9B and 10. The presence <strong>of</strong> eskers<br />
in the valley bottoms <strong>of</strong> these channels indicates<br />
that they were not <strong>fi</strong> lled with ice and debris after<br />
channel erosion. An esker in one <strong>of</strong> these valleys<br />
was drilled using rotasonic methods in the summer<br />
<strong>of</strong> 2006 (unpublished data). The stratigraphy <strong>of</strong> the<br />
esker consists <strong>of</strong> a <strong>fi</strong> ning upward sequence from<br />
gravel in the tunnel channel to interbedded <strong>fi</strong> ne<br />
sand and silt near the top <strong>of</strong> the esker. The base <strong>of</strong><br />
the tunnel channel was not reached in the borehole.<br />
This stratigraphic sequence indicates that fl ow in<br />
the channel declined from high velocities at the base<br />
to intermittent, low-energy conditions at the top.<br />
The tunnel may have contained impounded to very<br />
slowly moving water at times. These conditions<br />
suggest that the tunnel was occupied continuously<br />
or intermittently over a relatively long period <strong>of</strong><br />
time, perhaps during stagnation and/or deglaciation<br />
<strong>of</strong> the lobe.<br />
Tunnel channels <strong>of</strong> the Saginaw Lobe <strong>of</strong> the Laurentide<br />
Ice Sheet provide important clues to the subglacial<br />
hydrology <strong>of</strong> the lobe and the interaction <strong>of</strong><br />
the lobe with its adjacent lobes. Five types <strong>of</strong> tunnel<br />
channels are recognized in this study:<br />
• Type I–large, mostly unburied channels.<br />
• Type II–partially buried palimpsest channels cutting<br />
an end moraine produced by readvance <strong>of</strong><br />
same lobe.<br />
• Type III–deeply buried palimpsest channels behind<br />
end moraines produced during readvance <strong>of</strong><br />
same lobe.<br />
• Type IV–palimpsest channels partially buried by<br />
deposits from a different lobe than the lobe under<br />
which they were formed.<br />
• Type V–unburied to partially buried channels that<br />
contain eskers.<br />
Two predominant sets <strong>of</strong> channels include southwesterly<br />
and westerly trending segments. The<br />
southwesterly channels appear to be the oldest,<br />
perhaps dating from the LGM or retreat <strong>of</strong> the lobe<br />
following the LGM. South <strong>of</strong> the Kalamazoo Val-<br />
76<br />
CONCLUSIONS<br />
Fig. 10. Origin <strong>of</strong> Type V tunnel channels. A. Tunnel channel<br />
is subglacially eroded. B. Channel persists for long period <strong>of</strong><br />
time during ice stagnation or retreat. Discharge and velocity<br />
through tunnel decreases through time. C. After retreat, esker<br />
with <strong>fi</strong> ning upward stratigraphic sequence remains in valley.<br />
ley, the tunnel channels are palimpsest features<br />
overridden or buried by sediment from more recent<br />
advances <strong>of</strong> the Saginaw or Lake Michigan<br />
Lobes. The presence <strong>of</strong> eskers in tunnel channels<br />
north <strong>of</strong> the Kalamazoo Valley suggests the persistence<br />
<strong>of</strong> these subglacial channels until late in the<br />
deglacial history <strong>of</strong> the lobe. Some <strong>of</strong> these channels<br />
were probably cut time-transgressively during<br />
the younger advance <strong>of</strong> the lobe to the Sturgis<br />
Moraine or more recent ice-marginal positions. The<br />
west-trending channels cross cut the southwesterly<br />
channels and are interpreted to represent the most<br />
recent episode <strong>of</strong> subglacial drainage. The change<br />
in orientation <strong>of</strong> these channels may be the result<br />
<strong>of</strong> retreat <strong>of</strong> the Lake Michigan Lobe, which was<br />
impinging upon the western margin <strong>of</strong> the Saginaw<br />
Lobe. Large, probably catastrophic subaerial meltwater<br />
fl ows can be traced from the west trending<br />
tunnel channels southward between the two lobes as<br />
the Lake Michigan lobe was retreating (Kozlowski<br />
et al. 2005). Further, more detailed study <strong>of</strong> these<br />
channels will be necessary to fully understand their<br />
origin and temporal relationships.
Attig, J. W., Mickelson, D. M. & Clayton, L. 1989. Late Wisconsin<br />
landform distribution and glacier bed conditions in<br />
Wisconsin. Sedimentary Geology 62, 399–405.<br />
Boulton, G. S. & Hindmarsh, R. C. A. 1987. Sediment deformation<br />
beneath glaciers: rheology and geological consequences.<br />
Journal <strong>of</strong> Geophysical Research 92 (B9),<br />
9059–9082.<br />
Brennand, T. A. & Shaw, J. 1994. Tunnel channels and associated<br />
landforms, south-central Ontario: Their implications<br />
for ice-sheet hydrology. Canadian Journal <strong>of</strong> Earth<br />
Sciences 31, 505–522.<br />
Clarke, G. K. C., Leverington, D. W., Teller, J. T., Dyke,<br />
A. S. & Marshall, S. J. 2005. Fresh arguments to David<br />
Sharpe on “Paleohydraulics <strong>of</strong> the last outburst fl ood from<br />
glacial Lake Agassiz and 8200 BP cold event.” Quaternary<br />
Science Reviews 24, 1533–1541.<br />
Clayton, L., Attig, J. W. & Mickelson, D. M. 1999. Tunnel<br />
channels formed in Wisconsin during the last glaciation. In:<br />
Mickelson, D. M. & Attig, J. W. (eds.) Glacial Processes<br />
Past and Present. <strong>Geological</strong> Society <strong>of</strong> America <strong>Special</strong><br />
<strong>Paper</strong> 337, 69–82.<br />
Cutler, P. M., Colgan, P. M. & Mickelson, D. M. 2002.<br />
Sedimentologic evidence for outburst fl oods from the Laurendtide<br />
Ice Sheet margin in Wisconsin, USA: Implications<br />
for tunnel channel formation. Quaternary International 90,<br />
23–40.<br />
Ehlers, J. 1981. Some aspects <strong>of</strong> glacial erosion and deposition<br />
in North Germany. Annals <strong>of</strong> Glaciology 2, 143–1<strong>46</strong>.<br />
Evans, D. J. A., Rea, B. R., Hiemstra, J. A. & O ,<br />
C<strong>of</strong>aigh,<br />
C. 2006. A critical assessment <strong>of</strong> subglacial mega-fl oods:<br />
a case study <strong>of</strong> glacial sediments and landforms in southcentral<br />
Alberta, Canada. Quaternary Science Reviews 25,<br />
1638–1667.<br />
Fisher, T. G. & Taylor, L. D. 2002. Sedimentary and stratigraphic<br />
evidence for subglacial fl ooding, south-central<br />
Michigan, USA. Quaternary International 90, 87–115.<br />
Fisher, T. G., Jol, H. M. & Boudreau, A. M. 2005. Saginaw<br />
Lobe tunnel channels (Laurentide Ice Sheet) and their signi<strong>fi</strong><br />
cance in south-central Michigan, USA. Quaternary Science<br />
Reviews 24, 2375–2391.<br />
Grube, F. 1983. Tunnel valleys. In: Ehlers, J. (ed.) Glacial deposits<br />
in north-west Europe. Balkema, 257–258.<br />
Hooke, R. L. & Jennings, C. E. 2006. On the formation <strong>of</strong> tunnel<br />
valleys. Quaternary Science Reviews 25, 1364–1372.<br />
Johnson, M. D. 1999. Spooner Hills, northwest Wisconsin:<br />
high-relief hills carved by subglacial meltwater <strong>of</strong> the Superior<br />
Lobe. In: Mickelson, D. M. & Attig, J. W. (eds.)<br />
Glaciers Past and Present. <strong>Geological</strong> Society <strong>of</strong> America<br />
<strong>Special</strong> <strong>Paper</strong> 337, 83–92.<br />
REFERENCES<br />
Jørgensen, F. & Sanderson, P. B. E. 2006. Buried and open<br />
tunnel valleys in Denmark – erosion beneath multiple ice<br />
sheets. Quaternary Science Reviews 25, 1339–1363.<br />
Kehew, A. E., Nicks, L. P. & Straw, W. T. 1999. Palimpsest<br />
tunnel valleys: Evidence for relative timing <strong>of</strong> advances in<br />
an interlobate area <strong>of</strong> the Laurentide Ice Sheet. Annals <strong>of</strong><br />
Glaciology 28, 47–52.<br />
Kehew, A. E., Beukema, S. P., Bird, B. C. & Kozlowski, A. L.<br />
2005. Fast fl ow <strong>of</strong> the Lake Michigan Lobe: evidence from<br />
sediment-landform assemblages in southwestern Michigan,<br />
USA. Quaternary Science Reviews 24, 2335–2353.<br />
Kehew, A. E., Lord, M. L. & Kozlowski, A. L. 2007. Glacifl uvial<br />
landforms <strong>of</strong> erosion. In: Elias, S.A. (ed.) Encyclopedia<br />
<strong>of</strong> Quaternary Science. Elsevier, 818–831.<br />
Kozlowski, A. L., Kehew, A. E. & Bird, B. C. 2005. Outburst<br />
fl ood origin <strong>of</strong> the central Kalamazoo River valley, Michigan,<br />
USA. Quaternary Science Reviews 24, 2354–2374.<br />
Larson, G. & Schaetzl, R. 2001. Origin and Evolution <strong>of</strong> the<br />
Great Lakes. Journal <strong>of</strong> Great Lakes Research 27, 518–<br />
5<strong>46</strong>.<br />
Mooers, H. D. 1989. On the formation <strong>of</strong> tunnel valleys <strong>of</strong> the<br />
Superior Lobe, central Minnesota. Quaternary Research 32,<br />
O ,<br />
<strong>Geological</strong> <strong>Survey</strong> <strong>of</strong> <strong>Finland</strong>, <strong>Special</strong> <strong>Paper</strong> <strong>46</strong><br />
Tunnel Channels <strong>of</strong> the Saginaw Lobe, Michigan, USA<br />
24–35.<br />
C<strong>of</strong>aigh, C. 1996. Tunnel valley genesis. Progress in Physical<br />
Geography 20, 1–19.<br />
Patterson, C. J. 1994. Tunnel-valley fans <strong>of</strong> the St. Croix<br />
moraine, east-central Minnesota, USA. In: Warren, W. &<br />
Croot, C. (eds.) Formation and Deformation <strong>of</strong> Glacial Deposits.<br />
Balkema, 69–87.<br />
Piotrowski, J. A. 1994. Tunnel-valley formation in northwest<br />
Germany – geology, mechanisms <strong>of</strong> formation and subglacial<br />
bed condtions for the Bornhoved tunnel valley.Sedimentary<br />
Geology 89, 107–141.<br />
Piotrowski, J. A. 1997. Subglacial hydrology in north-western<br />
Germany during the last glaciation: groundwater fl ow,<br />
tunnel valleys and hydrological cycles. Quaternary Science<br />
Reviews 16, 169–185.<br />
Shaw, J. 2002. The meltwater hypothesis for subglacial bedforms.<br />
Quaternary International 90, 5–22.<br />
Sjogren, D. B., Fisher, T. G., Taylor, L. D., Jol, H. M. &<br />
Munro-Stasiuk, M. J. 2002. Incipient tunnel channels.<br />
Quaternary International 90, 41–56.<br />
Wright, H. E. 1973. Tunnel valleys, glacial surges, and subglacial<br />
hydrology <strong>of</strong> the Superior Lobe, Minnesota. In: Black,<br />
R., Goldthwait, R. & Willman, H. (eds.) The Wisconsinan<br />
Stage, <strong>Geological</strong> Society <strong>of</strong> America Memoir 136, 251–<br />
276.<br />
77
Applied Quaternary research in the central part <strong>of</strong> glaciated terrain,<br />
edited by Peter Johansson and Pertti Sarala.<br />
<strong>Geological</strong> <strong>Survey</strong> <strong>of</strong> <strong>Finland</strong>, <strong>Special</strong> <strong>Paper</strong> <strong>46</strong>, 79–86, 2007.<br />
PROGLACIAL SEDIMENTARY ENVIRONMENT IN<br />
PÄRNU AREA, WESTERN ESTONIA AS DERIVED FROM<br />
THE VARVED CLAY STUDIES<br />
by<br />
Tiit Hang, Peeter Talviste, Raul Reinson and Marko Kohv 1<br />
Hang, T., Talviste, P., Reinson, R. & Kohv, M. 2007. Proglacial<br />
sedimentary environment in Pärnu area, western Estonia as derived<br />
from the varved clay studies. Applied Quaternary research<br />
in the central part <strong>of</strong> glaciated terrain. <strong>Geological</strong> <strong>Survey</strong> <strong>of</strong> <strong>Finland</strong>,<br />
<strong>Special</strong> <strong>Paper</strong> <strong>46</strong>, 79–86, 5 <strong>fi</strong> gures, 1 table.<br />
Distribution, grain-size and varve thickness data <strong>of</strong> the<br />
Late Weichselian varved clays have been analysed to describe<br />
the sedimentary environment and the ice sheet recession at the<br />
distal position <strong>of</strong> the Pandivere–Neva (13,500–13,300 yrs BP)<br />
ice-marginal formations, western Estonia. Dominating clay and<br />
silt fractions and very low sand content refl ects an infl ow <strong>of</strong><br />
mainly <strong>fi</strong> ne-grained material. Vertical changes in grain-size are<br />
characterised by the decrease <strong>of</strong> clay content and increase <strong>of</strong> silt<br />
content towards the depth. Gradually decreasing upwards total<br />
varve thickness and characteristic changes in relation to seasonal<br />
layer thicknesses within each varve refl ect normal sedimentation<br />
in the proglacial lake where, at each point, proximal conditions<br />
gradually changed to more distal conditions. There is no evidence<br />
from the varve clay studies pointing to the stagnation or<br />
readvance <strong>of</strong> the ice terminus prior or during the formation <strong>of</strong> the<br />
Pandivere–Neva ice marginal formations.<br />
Key words (GeoRef Thesaurus, AGI): glaciolacustrine sedimentation,<br />
clay, varves, grain size, thickness, deglaciation, Pleistocene,<br />
Weichselian, Pärnu, Estonia.<br />
1 Institute <strong>of</strong> Geology, University <strong>of</strong> Tartu, Vanemuise <strong>46</strong>,<br />
EE-Tartu, Estonia<br />
E-mail: Tiit.Hang@ut.ee, Peeter@geotehnika.ee,<br />
Reinson@ut.ee, Marko.Kohv@ut.ee<br />
79
<strong>Geological</strong> <strong>Survey</strong> <strong>of</strong> <strong>Finland</strong>, <strong>Special</strong> <strong>Paper</strong> <strong>46</strong><br />
Tiit Hang, Peeter Talviste, Raul Reinson and Marko Kohv<br />
The decay <strong>of</strong> Weichselian ice from Estonian territory<br />
took place between 14.7 and 12.7 ka BP (Kalm<br />
2006). More <strong>of</strong>ten, compared to the preceding<br />
deglaciation stages, extensive proglacial bodies <strong>of</strong><br />
water were present in front <strong>of</strong> the receding ice margin.<br />
This is refl ected in the wide distribution <strong>of</strong> the<br />
glaciolacustrine sediments including varved clays.<br />
Glacial varved clays with their characteristic summer<br />
(silty) and winter (clayey) layers are interpreted<br />
to refl ect seasonal variations in the sedimentation<br />
environment in the proglacial lake (De Geer 1940).<br />
Varve thickness changes, together with inside structure<br />
and fabric, can produce more details about the<br />
proglacial environment and the deglaciation. Interrupted<br />
chains <strong>of</strong> end moraines and glaci<strong>of</strong>l uvial for-<br />
The study area (Fig. 1) includes the coastal area<br />
south <strong>of</strong> the Pandivere–Neva (13,500–13,300 ka<br />
yrs BP., Hang 2001, Kalm 2006) belt <strong>of</strong> ice marginal<br />
formations in western Estonia. The surface <strong>of</strong><br />
Devonian sandstones in the area lies at an altitude<br />
<strong>of</strong> -10 – -15 m above the present sea level (a.s.l.)<br />
(Tavast & Raukas 1982). Over the entire study area,<br />
the area is covered by bluish-grey loamy till <strong>of</strong> Late<br />
Weichselian age. The latter is followed by up to 30<br />
m thick glaciolacustrine varved clay and silt. The<br />
thickness <strong>of</strong> Holocene marine sands and silts, covering<br />
these deposits, reaches at its maximum <strong>of</strong> 10<br />
m, being mostly 2–3 m and is only locally absent.<br />
Varved clays in western Estonia have been deposited<br />
in the Baltic Ice Lake (Fig. 1). These glacial<br />
clays are characterised by an average thickness <strong>of</strong><br />
10–20 m with very distinct laminations. Seasonal<br />
layers are easily distinguishable. Varves are usually<br />
thick and clayey (having the highest clay content<br />
70–80 % among the Estonian glaciolacustrine clays)<br />
with silty microlayers in some sequences (Saarse &<br />
80<br />
INTRODUCTION<br />
GEOLOGICAL SETTING<br />
mations in Estonia mark marginal positions <strong>of</strong> the<br />
ice sheet in present topography. It is believed that<br />
they represent temporary stagnations (Karukäpp &<br />
Raukas 1997, Boulton et al. 2001) or even readvances<br />
(Raukas 1992, Raukas et al. 2004, Kalm 2006) <strong>of</strong><br />
the ice terminus when the glacier regime was close<br />
to equilibrium. This, in turn, is most likely refl ected<br />
also in the proglacial sedimentary environment in<br />
front <strong>of</strong> the ice margin. In the current article, the<br />
distribution <strong>of</strong> varved clays, grain-size and varve<br />
thickness changes are analyzed to describe the characteristics<br />
<strong>of</strong> the ice recession prior to the formation<br />
<strong>of</strong> the Pandivere–Neva belt <strong>of</strong> ice marginal formations<br />
in the Pärnu area, western Estonia.<br />
Pirrus 1988). Current ripple marks and erosional<br />
features are quite rare as well as synsedimentary<br />
disturbances.<br />
The Pandivere–Neva ice marginal zone in Estonia<br />
starts from the West Estonian Archipelago and<br />
continues on the mainland towards the northeast<br />
(Fig. 1). Most <strong>of</strong>ten, the corresponding zone in northwestern<br />
Russia is considered to be the Neva zone<br />
(Raukas et al. 1971, Lundqvist & Saarnisto 1995,<br />
Raukas et al. 2004). The Pandivere–Neva zone is<br />
represented by a curved belt <strong>of</strong> push end-moraines,<br />
glaci<strong>of</strong>l uvial deltas and marginal eskers (Karukäpp<br />
& Raukas 1997). In western Estonia the marginal<br />
eskers, which represent a speci<strong>fi</strong> c type <strong>of</strong> glaci<strong>of</strong>l uvial<br />
delta (Raukas 1992), are the most outlined landforms<br />
due to a more or less continuous length <strong>of</strong> 150<br />
km. Due to Holocene wave erosion, the forms have<br />
been levelled while the height <strong>of</strong> features ranges<br />
only from a few meters up to a maximum <strong>of</strong> 20 m.<br />
In the Pärnu area, the Pandivere–Neva formations<br />
are buried under younger marine sediments.
Fig. 1. Location<br />
<strong>of</strong> the study area<br />
in western Estonia<br />
(green square). The<br />
distribution map <strong>of</strong><br />
glacial varved clays in<br />
Estonia after Saarse<br />
& Pirrus (1998) with<br />
complements. Ice<br />
marginal positions<br />
are incorporated from<br />
Raukas et al. (2004).<br />
<strong>Geological</strong> <strong>Survey</strong> <strong>of</strong> <strong>Finland</strong>, <strong>Special</strong> <strong>Paper</strong> <strong>46</strong><br />
Proglacial sedimentary environment in Pärnu area, western Estonia as derived from the varved clay studies<br />
For the varve thickness studies and description <strong>of</strong> facial<br />
units <strong>of</strong> varved clays, 15 undisturbed sequences<br />
<strong>of</strong> varved clay were obtained with a Russian type<br />
peat corer in the surroundings <strong>of</strong> Pärnu and in the<br />
bottom <strong>of</strong> Pärnu Bay in the Baltic Sea (Fig. 2). Varve<br />
thickness study and construction <strong>of</strong> varve graphs<br />
followed the traditional method introduced by De<br />
Geer (1940). The varve graphs display the number<br />
<strong>of</strong> varves on the x-axes starting traditionally with<br />
the oldest varve on the right and the thickness <strong>of</strong> individual<br />
varve on the y-axes. The relative timescale<br />
is different for each varve graph.<br />
Within the current study, a total <strong>of</strong> 84 samples,<br />
taken from three sediment cores, were analysed for<br />
the grain-size composition. The conventional pipette<br />
method was used for the silt and clay fractions<br />
(>0.063mm; 0.063–0.016mm; 0.016–0.008mm;<br />
0.008–0.002mm; 0.063mm) material. In<br />
addition, earlier results <strong>of</strong> grain-size analysis <strong>of</strong> 105<br />
samples from 11 geotechnical corings were used to<br />
describe the grain-size distribution <strong>of</strong> glacial varved<br />
clay in the Pärnu area.<br />
METHODS<br />
Fig. 2. Location <strong>of</strong> the studied sequences (circles) and clay<br />
sequences discussed in the text (squares) at the distal position<br />
<strong>of</strong> the Pandivere–Neva ice marginal formations in western<br />
Estonia. At the Audru site (A–1–03), 8 parallel sequences were<br />
studied for varve thickness changes.<br />
Morphology <strong>of</strong> the upper surface as well as thickness<br />
and distribution <strong>of</strong> clay is described through<br />
data originating from 848 geotechnical corings from<br />
the Pärnu area.<br />
81
<strong>Geological</strong> <strong>Survey</strong> <strong>of</strong> <strong>Finland</strong>, <strong>Special</strong> <strong>Paper</strong> <strong>46</strong><br />
Tiit Hang, Peeter Talviste, Raul Reinson and Marko Kohv<br />
Distribution <strong>of</strong> varved clays in Pärnu area<br />
Over the entire study area, the hummocky upper<br />
surface <strong>of</strong> the Late Weichselian bluish-grey loamy<br />
till is covered by glaciolacustrine varved clay or silt<br />
(Fig. 1). Glaci<strong>of</strong>l uvial deposits on top <strong>of</strong> the till have<br />
been only locally reported. The maximum thickness<br />
<strong>of</strong> varved clay in the Pärnu area is 30 m, but on average<br />
between 5–9 m. Locally rapid changes in clay<br />
thickness are due to the underlying topography. The<br />
upper surface <strong>of</strong> the clay dips towards the south at an<br />
altitude <strong>of</strong> –8 m a.s.l. approximately 5 km <strong>of</strong>fshore<br />
and –2.5/–3 m a.s.l. at the current coastline <strong>of</strong> Pärnu<br />
Bay. At the distance <strong>of</strong> ca. 2 km north <strong>of</strong> coastline,<br />
the altitude <strong>of</strong> the clay surface rapidly changes from<br />
zero to 4 m a.s.l..<br />
Grain-size<br />
Clay and silt fraction dominate in the grain-size<br />
composition <strong>of</strong> proglacial clays in the Pärnu area<br />
(Fig. 3). With few exceptions, a common clay tex-<br />
82<br />
RESULTS<br />
ture exceeding 60% is typical for the winter layers<br />
through the studied sections (Fig. 3A). Data<br />
points expressing the texture <strong>of</strong> the summer layers<br />
is grouped towards the textural class <strong>of</strong> silt but is<br />
more scattered compared to the data <strong>of</strong> the winter<br />
layers (Fig. 3A). Currently analysed massive<br />
diamicton has the coarsest grain-size plotted in Fig.<br />
3A. Earlier grain-size analysis <strong>of</strong> mean samples<br />
(different seasonal layers included in one sample)<br />
support the current results (Fig. 3B) as the samples<br />
are closely grouped within the textural classes <strong>of</strong> silt<br />
and clay. It is obvious that the analysis <strong>of</strong> annual<br />
or multi-annual samples clearly underestimates the<br />
true content <strong>of</strong> clay and silt fraction in the deposit<br />
(Fig. 3). However, the analysed section PB-12-03<br />
(Fig. 3A) probably infl uences the results as only this<br />
section contains clay unit E. Results <strong>of</strong> multi-annual<br />
sample analysis (Fig. 3B) clearly demonstrate vertical<br />
changes in grain-size composition (Fig. 3B) as<br />
the content <strong>of</strong> silt fraction increases and the clay<br />
Fig. 3. Triangular plots <strong>of</strong> the grain–size composition <strong>of</strong> studied sequences (A) and clay units discussed in the text (B). Analysed<br />
summer and winter layers (A) belong to the same varves. Note, the different scales on the plots. Location <strong>of</strong> the studied sequences<br />
see in Fig. 2.
<strong>Geological</strong> <strong>Survey</strong> <strong>of</strong> <strong>Finland</strong>, <strong>Special</strong> <strong>Paper</strong> <strong>46</strong><br />
Proglacial sedimentary environment in Pärnu area, western Estonia as derived from the varved clay studies<br />
fraction decreases towards the depth (from unit B<br />
to unit E). Unit D, representing the aforementioned<br />
clayey diamicton, contains the coarsest material.<br />
In Fig. 4A, details about vertical changes in grainsize<br />
composition <strong>of</strong> sequence KK–10–03 (Fig.<br />
2) are displayed. An increase <strong>of</strong> clay fraction and<br />
a decrease <strong>of</strong> <strong>fi</strong> ne-silt (0.008–0.002 mm) upwards<br />
are the main tendencies in summer layer composition.<br />
Notable changes in summer layers are taking<br />
place in the lower and upper portion <strong>of</strong> varved clay<br />
sequences both characterized by higher percentage<br />
<strong>of</strong> silt fraction (Fig. 4A). Grain-size composition <strong>of</strong><br />
the winter layers is highly dominated by the clay<br />
fraction that in the lower portion <strong>of</strong> clay constitutes<br />
about 50–60% and in the upper part remains over<br />
80%. Contents <strong>of</strong> the <strong>fi</strong> ne-silt fraction ranges between<br />
5–10%. The content is higher (up to 35%) in<br />
the lowermost and uppermost portion <strong>of</strong> the varved<br />
clay (Fig. 4A).<br />
Eight samples were analysed within an individual<br />
varve for their grain-size composition (Fig. 4B).<br />
Fine- and medium-silt fractions are predominant<br />
in the summer layer. Contents <strong>of</strong> the clay fraction<br />
increase rapidly in the upper part <strong>of</strong> the summer<br />
layer and begin to dominate at the transition from<br />
the summer to the winter layer (Fig. 4B). Somewhat<br />
surprising is the increased value <strong>of</strong> the coarse-silt<br />
(0.063–0.016 mm) fraction content in the upper<br />
portion <strong>of</strong> the summer layer.<br />
Fig. 4. Vertical changes <strong>of</strong> the grain-size composition in the varved clay sequence (A) and within an individual varve (B). On<br />
plot A, the red colour indicates the summer layers and the blue colour indicates the winter layers. Horizontal dashed-line on plot<br />
B marks the visual boundary between the summer and the winter layer. Location <strong>of</strong> the sequences seen in Fig. 2 and vertical<br />
location <strong>of</strong> the analysed varves within the sequences seen in Fig. 5.<br />
83
<strong>Geological</strong> <strong>Survey</strong> <strong>of</strong> <strong>Finland</strong>, <strong>Special</strong> <strong>Paper</strong> <strong>46</strong><br />
Tiit Hang, Peeter Talviste, Raul Reinson and Marko Kohv<br />
Varve thickness changes<br />
Varve thickness changes in three clay sequences<br />
from different key areas are displayed in Figure 5.<br />
Varve graphs are presented on a similar scale to the<br />
background <strong>of</strong> the relative timescale with the zero<br />
different for each sequence. According to total varve<br />
thickness changes and the relation between seasonal<br />
layer thicknesses within each varve, the varve series<br />
are divided into three groups (E, C, B). Summer layers<br />
dominate (52–80% <strong>of</strong> individual varve thickness)<br />
within the thick varves <strong>of</strong> group E (Fig. 5). Greenish<br />
grey silty summer layers display alternating silt and<br />
sandy silt layers or in places ripple bedding. Winter<br />
layers consist <strong>of</strong> reddish brown massive clay. Seasonal<br />
layers are easy to distinguish.<br />
Winter layer thickness dominates (51–85% <strong>of</strong><br />
individual varve thickness) within the varves <strong>of</strong><br />
group C (Fig. 5). Although the individual layer<br />
thicknesses changing over a great range, the overall<br />
tendency is towards an increase in relative winter<br />
layer thicknesses. Total varve thickness decreases<br />
Fig. 5. Examples <strong>of</strong> the<br />
varve thickness graphs <strong>of</strong><br />
glacial varved clays from<br />
the sediment sequences<br />
<strong>of</strong> the Pärnu basin. Lower<br />
diagrams on each plot show<br />
the relation <strong>of</strong> individual<br />
layer thickness within a<br />
varve. E, C, B varve<br />
groups <strong>of</strong> different clay<br />
units discussed in the text.<br />
Vertical lines, indicating a<br />
certain varve, point to the<br />
transition between the varve<br />
groups. Note that the graphs<br />
on the <strong>fi</strong> gure are not correlated<br />
between each other.<br />
Location <strong>of</strong> the sequences is<br />
displayed in Fig. 2.<br />
84<br />
upwards. Greenish grey massive silt constitutes the<br />
summer layers and dark brown massive clay the<br />
winter layer. In some varve intervals within group<br />
C, distinguishing between the seasonal layers is<br />
problematic.<br />
The third group <strong>of</strong> varves (B) is characterised<br />
by decreased thickness compared to the previous<br />
varve groups. The thickness <strong>of</strong> individual varves<br />
changes greatly as do the seasonal layer thicknesses<br />
within an individual varve (Fig. 5). Distinguishing<br />
between the seasonal layers is problematic. In the<br />
upper portion <strong>of</strong> this group, visually distinguishing<br />
between the varves is also problematic and this is<br />
why the number <strong>of</strong> varves in this group is usually<br />
bigger than displayed in any <strong>of</strong> the varve graphs.<br />
Only the varves <strong>of</strong> group E with clear dominance<br />
<strong>of</strong> the summer layers are present in the sequence<br />
from Pärnu Bay (Pärnu Bay-12-03) (Fig. 5C). Erosional<br />
discontinuity at the upper contact with overlying<br />
marine sand points to the post-sedimentary<br />
erosion at this location.
<strong>Geological</strong> <strong>Survey</strong> <strong>of</strong> <strong>Finland</strong>, <strong>Special</strong> <strong>Paper</strong> <strong>46</strong><br />
Proglacial sedimentary environment in Pärnu area, western Estonia as derived from the varved clay studies<br />
According to different geotechnical parameters<br />
(mineralogical and chemical composition, plasticity,<br />
water content) (Kattel 1989) as well as varve<br />
thickness, inside structure and fabric, the glacial clay<br />
complex in the Pärnu area could be divided into <strong>fi</strong> ve<br />
facial units (A-E) (Table 1) with transitional rather<br />
than <strong>fi</strong> xed boundaries. Dehydrated clay in unit A has<br />
been recorded at a higher (more than 5 m) altitude<br />
and represents up to 1 m thick upper clay interval<br />
that emerged due to water level lowering after the<br />
clay accumulation. Periodic freezing-melting cycles<br />
and accompanying chemical processes have<br />
destroyed the varve structure, and where present,<br />
the unclear thin lamination has been reported. Unit<br />
B represents a series <strong>of</strong> thin winter layer dominating<br />
clayey varves with changing thickness between<br />
individual couplets. These uppermost varves are<br />
interpreted to have been formed in the distal part<br />
<strong>of</strong> the proglacial lake. Moving downwards, unit<br />
C varves are also winter layer dominating clayey<br />
couplets. Varve thickness is greater compared to the<br />
previous interval. Thickness <strong>of</strong> clearly distinguishable<br />
individual couplets increases downwards. The<br />
clay <strong>of</strong> unit C is interpreted to have been formed<br />
distally far from the areas <strong>of</strong> sediment infl ux, in the<br />
deeper central part <strong>of</strong> the proglacial lake. Thickest<br />
varves <strong>of</strong> the clay sequences in the Pärnu area contain<br />
the coarsest material. Multiple graded summer<br />
layers dominate in these lowermost varves, which<br />
belong to the unit E and are formed in varying sedimentary<br />
conditions close to the ice margin. Normal<br />
varve series from the proximal varves (unit E) to<br />
distal varves (units A, B) is interrupted by an interval<br />
<strong>of</strong> waterline glacial diamicton (unit D). Unit<br />
D represents an up to 8 m thick massive silty-clay<br />
DISCUSSION AND CONCLUSIONS<br />
with dispersed grains <strong>of</strong> sand. This unit has a scattered<br />
distribution with maximum thicknesses in the<br />
northern and northeastern part <strong>of</strong> the study area<br />
and is missing in the nearshore area <strong>of</strong> Pärnu Bay.<br />
Similar deposits have been described earlier in the<br />
West Estonian Archipelago and are interpreted as a<br />
waterline diamicton (Kadastik & Kalm 1998). The<br />
scattered distribution <strong>of</strong> unit D in Pärnu area is hard<br />
to explain. The selected erosion is most likely not<br />
an option while in clay sequences from Pärnu Bay,<br />
an interval <strong>of</strong> ca. 10 varves with dispersed grains <strong>of</strong><br />
sand in the winter layers were reported. According<br />
to preliminary varve correlation, the above interval<br />
stratigraphically corresponds to unit D described<br />
in the sequences from the city <strong>of</strong> Pärnu and demonstrating,<br />
thus, that the accumulation <strong>of</strong> unit D<br />
deposits is the result <strong>of</strong> one sedimentary event in<br />
the proglacial environment. Unfortunately, details<br />
about the genesis <strong>of</strong> this unit currently are unclear.<br />
Dominating clay and silt fraction (Fig. 3) and low<br />
(2–5%) sand content refl ects an infl ow <strong>of</strong> mainly <strong>fi</strong> ne<br />
grained material. Continuously increasing clay and<br />
decreasing silt content upwards demonstrate that<br />
the proximal sedimentary conditions at each point<br />
in the proglacial lake gradually changed to become<br />
more distal. This conclusion is also supported by the<br />
thickness changes <strong>of</strong> the varves. All investigated sequences<br />
display a normal varve series with decreasing<br />
varve thickness upwards. From studies into<br />
grain-size, internal structure and thickness changes<br />
<strong>of</strong> the varves, there is no evidence to conclude any<br />
stagnation and/or readvances <strong>of</strong> the ice margin<br />
during the varve formation. This is surprising because<br />
the study area is located at the distal position<br />
from the Pandivere–Neva ice marginal formations,<br />
Table 1. Facial units distinguished in the proglacial clay sequences in the Pärnu area, western Estonia.<br />
Facial units Description<br />
A Dehydrated greenish-grey clay, varve structure destroyed due to emergence after clay accumulation and due to<br />
soil forming processes<br />
B Varved clay containing a series <strong>of</strong> thin winter layer dominating clayey, hardly distinguishable seasonal couplets<br />
C Varved clay, varves are winter layer dominating with clearly distinguishable clayey seasonal couplets; total<br />
varve thickness is less than in unit E and its decreasing upwards. Where present, the lower boundary with unit<br />
D is sharp<br />
D Waterline glacial diamicton; grey massive silty-clay with dispersed grains <strong>of</strong> sand; discontinuous lateral<br />
distribution; maximum known thickness 8 m<br />
E Varved clay; summer layer dominating varves with clearly distinguishable seasonal layers; thickest varves <strong>of</strong><br />
clay sequence with upwards decreasing varve thickness; unstable sedimentary environment close to the ice<br />
margin is refl ected in multiple graded summer layers with rare ripples; where present the upper boundary with<br />
unit D sharp otherwise the transition from unit E to C displays continuous lamination<br />
85
<strong>Geological</strong> <strong>Survey</strong> <strong>of</strong> <strong>Finland</strong>, <strong>Special</strong> <strong>Paper</strong> <strong>46</strong><br />
Tiit Hang, Peeter Talviste, Raul Reinson and Marko Kohv<br />
which is believed to have formed during the temporary<br />
stagnation <strong>of</strong> the ice terminus. Moreover, the<br />
normal series <strong>of</strong> varves, with only some disturbed<br />
intervals, were also reported at a distance less than<br />
one kilometre from the marginal formations. This<br />
highlights the question <strong>of</strong> the formation <strong>of</strong> the Pandivere–Neva<br />
belt <strong>of</strong> ice marginal formations. For<br />
further conclusions, additional lithostratigraphical<br />
and sedimentological as well as varve correlation<br />
are needed across the Pandivere–Neva formations.<br />
In summary, the following conclusions can be<br />
drawn:<br />
– Clay complex in the Pärnu area is divided into<br />
<strong>fi</strong> ve facial units (A-E) with transitional boundaries.<br />
– Units E and C-A represent a normal series from<br />
proximal to distal varves. Upper dehydrated clay<br />
unit A lost its laminated character due to the<br />
emergence after the clay accumulation. Unit D<br />
represents a waterline glacial diamicton with a<br />
limited distribution and variegating thickness.<br />
Details about the genesis <strong>of</strong> this unit are unclear.<br />
This article derives from the projects supported by<br />
Estonian Science Foundation Grants 5681, 6992<br />
and Estonian target funding project 0182530s03.<br />
Boulton, G. S., Dongelmans, P., Punkari, M. & Brodgate,<br />
M. 2001. Palaeoglaciology <strong>of</strong> an ice sheet through a glacial<br />
cycle: the European ice sheet through the Weichselian.<br />
Quaternary Science Reviews 20, 591–625.<br />
De Geer, G. 1940. Geochronologia Suecica Principles. Kungliga<br />
Svenska Vetenskapsakademiens handlingar, Ser III,<br />
18(6). 367 p.<br />
Hang, T. 2001. Proglacial sedimentary environment, varve<br />
chronology and Late Weichselian development <strong>of</strong> the Lake<br />
Peipsi, eastern Estonia. Quaternaria A, 11. 44 p.<br />
Kadastik, E. & Kalm, V. 1998. Lithostratigraphy <strong>of</strong> Late<br />
Weichselian tills on the West Estonian Islands. <strong>Geological</strong><br />
Society <strong>of</strong> <strong>Finland</strong>, Bulletin 70, 5–17.<br />
Kalm, V. 2006. Pleistocene chronostratigraphy in Estonia,<br />
southeastern sector <strong>of</strong> the Scandinavian glaciation. Quaternary<br />
Science Reviews 25, 960–975.<br />
Karukäpp, R. & Raukas, A. 1997. Deglaciation history. In:<br />
Raukas, A. & Teedumäe, A. (eds.) Geology and mineral resources<br />
<strong>of</strong> Estonia. Tallinn: Estonian Academy Publishers,<br />
263–267.<br />
86<br />
ACKNOWLEDGEMENTS<br />
REFERENCES<br />
– Dominating clay and silt fraction and very low<br />
content <strong>of</strong> sand refl ects an infl ow <strong>of</strong> mainly <strong>fi</strong> negrained<br />
material.<br />
– Grain-size changes within an individual varve<br />
demonstrate the dominance <strong>of</strong> the <strong>fi</strong> ne to medium<br />
grained silt fraction in the summer layer,<br />
very rapid increase <strong>of</strong> clay content below the<br />
upper boundary <strong>of</strong> the summer layer and clear<br />
dominance <strong>of</strong> the clay fraction in the winter<br />
layer. Rapid increase <strong>of</strong> coarse-silt content at<br />
the end <strong>of</strong> summer season could be connected to<br />
increased storm activity before the cold season.<br />
– According to total varve thickness, the relation<br />
between thicknesses <strong>of</strong> seasonal layers, internal<br />
structure and fabric <strong>of</strong> the varves, a continuous<br />
sedimentation during gradual ice recession was<br />
determined with a clearly de<strong>fi</strong> ned series from<br />
proximal to distal varves.<br />
– From the varve clay studies, there is no evidence<br />
pointing to the stagnation or readvance <strong>of</strong> the<br />
ice terminus prior or during the formation <strong>of</strong> the<br />
Pandivere–Neva ice marginal formations.<br />
The journal reviewers Antti E. K. Ojala and Peter<br />
Johansson are acknowledged for valuable criticism.<br />
Kattel, T. 1989. Spatial variability <strong>of</strong> the varved clays in Pärnu<br />
area. Unpablished Bachelor Theses, Institute <strong>of</strong> Geology,<br />
University <strong>of</strong> Tartu. 49 p. (in Estonian)<br />
Lundqvist, J. & Saarnisto, M. 1995. Summary <strong>of</strong> the project<br />
IGCP-253. Quaternary International 28, 9–17.<br />
Raukas, A. 1992. Ice marginal formations <strong>of</strong> the Palivere zone<br />
in the eastern Baltic. Sveriges Geologiska Undersökning<br />
Ca 81, 277–284.<br />
Raukas, A., Rähni, E. & Miidel, A. 1971. Marginal glacial<br />
formations in North Estonia. Tallinn: Valgus. 226 p. (in<br />
Russian)<br />
Raukas, A., Kalm, V., Karukäpp, R. & Rattas, M. 2004.<br />
Pleistocene Glaciations in Estonia. In: Ehlers, J. & Gibbard,<br />
P. (eds.) Quaternary Glaciations – Extent and Chronology.<br />
Amsterdam: Elsevier, 83–91.<br />
Saarse, L. & Pirrus, E. 1988. Lithology and formation <strong>of</strong> the<br />
Estonian varved clays. In: Punning, J.-M. (ed.) Estonia. Geographical<br />
research. Tallinn: Estonian Academy Publishers,<br />
73–83.<br />
Tavast, E. & Raukas, A. 1982. The bedrock relief <strong>of</strong> Estonia.<br />
Tallinn: Valgus. 194 p. (in Russian)
Applied Quaternary research in the central part <strong>of</strong> glaciated terrain,<br />
edited by Peter Johansson and Pertti Sarala.<br />
<strong>Geological</strong> <strong>Survey</strong> <strong>of</strong> <strong>Finland</strong>, <strong>Special</strong> <strong>Paper</strong> <strong>46</strong>, 87–92, 2007.<br />
BURIED ORGANIC SEDIMENTS IN ESTONIA RELATED TO THE<br />
ANCYLUS LAKE AND LITORINA SEA<br />
by<br />
Leili Saarse, Jüri Vassiljev, Avo Miidel and Eve Niinemets 1<br />
Saarse, L., Vassiljev, J., Miidel, A. & Niinemets, E. 2007. Buried<br />
organic sediments in Estonia related to the Ancylus Lake and<br />
Litorina Sea. Applied Quaternary research in the central part <strong>of</strong><br />
glaciated terrain. <strong>Geological</strong> <strong>Survey</strong> <strong>of</strong> <strong>Finland</strong>, <strong>Special</strong> <strong>Paper</strong><br />
<strong>46</strong>, 87–92, 5 <strong>fi</strong> gures.<br />
A database <strong>of</strong> buried organic deposits related to the development<br />
<strong>of</strong> the Ancylus Lake and Litorina Sea in Estonia was created.<br />
Of the 78 sites included in that database, 45 are <strong>of</strong> pre-Ancylus<br />
and Ancylus and 33 <strong>of</strong> post-Ancylus and Litorina age. Radiocarbon<br />
dates <strong>of</strong> buried organic beds have a large age scatter. In several<br />
cases, recent radiocarbon dates are older than those obtained<br />
earlier, referring to methodological problems or failure <strong>of</strong> sample<br />
collection and preservation. Buried organic deposits <strong>of</strong> Ancylus<br />
Lake age are mostly characterised by the dominance <strong>of</strong> Pinus<br />
pollen. This was the main reason why the age <strong>of</strong> the Ancylus<br />
transgression in Estonia was considered to be about a thousand<br />
years younger than in the neighbouring countries. The pollen<br />
spectra <strong>of</strong> the Litorina buried organic strata differ considerably<br />
between sites. A simulation <strong>of</strong> buried organic beds and shoreline<br />
isobases shows discrepancies, especially in the surroundings <strong>of</strong><br />
Pärnu Bay, obviously due to landslides, re-deposition, erosion or<br />
erroneous initial data. Comparisons <strong>of</strong> shore displacement curves<br />
and the ancient settlement positions do not support the concept <strong>of</strong><br />
multiple Litorina Sea transgressions.<br />
Key words (GeoRef Thesaurus, AGI): buried soils, organic sediments,<br />
Ancylus Lake, Litorina Sea, pollen analysis, absolute age,<br />
14 C, Holocene, Estonia.<br />
1 Institute <strong>of</strong> Geology at Tallinn University <strong>of</strong> Technology,<br />
Tallinn, Estonia.<br />
E-mail: Saarse@gi.ee, Vassilje@gi.ee, Miidel@gi.ee,<br />
Even@ut.ee<br />
87
<strong>Geological</strong> <strong>Survey</strong> <strong>of</strong> <strong>Finland</strong>, <strong>Special</strong> <strong>Paper</strong> <strong>46</strong><br />
Leili Saarse, Jüri Vassiljev, Avo Miidel and Eve Niinemets<br />
The study <strong>of</strong> beach formations and littoral deposits<br />
in Estonia, extending back to ca 150 years, was<br />
initiated by Schmidt (1869) and followed by the<br />
classic works <strong>of</strong> Hausen (1913) and Ramsay (1929).<br />
These studies were advanced by the elevated position<br />
<strong>of</strong> shorelines due to the location <strong>of</strong> Estonia in<br />
the glacioisostatically uplifting area. The organic<br />
strata buried under the coastal formations <strong>of</strong> the<br />
Ancylus Lake and Litorina Sea was discovered for<br />
the <strong>fi</strong> rst time on the banks <strong>of</strong> the Pärnu and Narva<br />
rivers (Hausen 1913, Thomson 1933, 1937). By the<br />
1960s, ten sites with organic deposits buried during<br />
the Baltic Sea transgressions were known (Kessel<br />
1960). The increasing use <strong>of</strong> gravel and sand deposits<br />
accelerated the exploration <strong>of</strong> resources, during<br />
The shoreline database compiled recently for the<br />
Baltic Ice Lake, Ancylus Lake and Litorina Sea<br />
contains more than 600 sites, 424 <strong>of</strong> which are from<br />
Estonia and the rest from adjoining areas (Saarse<br />
et al. 2003). The Holocene buried organic sediment<br />
database <strong>of</strong> Estonia includes 78 sites: 45 sites <strong>of</strong><br />
pre-Ancylus and Ancylus age, and 33 sites <strong>of</strong> post-<br />
Ancylus and Litorina age. The database includes<br />
the site’s number, name, elevation and coordinates,<br />
calibrated and uncalibrated radiocarbon dates and<br />
laboratory number, description <strong>of</strong> dated material,<br />
and references. The complete list <strong>of</strong> the shoreline<br />
database <strong>of</strong> Estonia and neighbouring areas is not<br />
yet available, but the Estonian database <strong>of</strong> the buried<br />
organic beds was recently published (Saarse et<br />
al. 2006).<br />
The buried organic beds are positioned along the<br />
north and west coasts <strong>of</strong> the Estonian mainland and<br />
on the islands <strong>of</strong> Hiiumaa and Saaremaa (Figs. 1a,<br />
b). The coastal formations <strong>of</strong> the Ancylus Lake are<br />
located at heights between 45 and 3 m a.s.l. (above<br />
the present day sea level), while the highest Lito-<br />
88<br />
INTRODUCTION<br />
MATERIAL AND METHODS<br />
RESULTS AND DISCUSSION<br />
which a number <strong>of</strong> new gravel pits were opened and<br />
many new buried peat sites were discovered. By<br />
1968, H. Kessel had already described 38 such sites.<br />
These are mostly small compressed peat patches,<br />
less than 50 cm, occasionally up to 100 cm in thickness,<br />
embedded into sand and gravel (Veski et al.<br />
2005). Especially in the Pärnu area, buried peat is<br />
up to 2.7 m thick (Talviste et al. 2006).<br />
The present paper gives an overview <strong>of</strong> the distribution<br />
and age <strong>of</strong> the buried organic deposits,<br />
which were submerged during the Ancylus Lake<br />
and Litorina Sea transgressions, considering also<br />
the shore displacement, isobases and the position <strong>of</strong><br />
buried deposits.<br />
The above-mentioned databases were used to reconstruct<br />
water-level surfaces <strong>of</strong> the Ancylus Lake<br />
and Litorina Sea using a point kriging interpolation<br />
with linear trend approaches (Saarse et al. 2003).<br />
Residuals (actual site elevation difference from the<br />
interpolated surfaces) for every site were calculated<br />
and sites with residuals <strong>of</strong> more than 0.7 m were<br />
discarded. The surfaces <strong>of</strong> the buried organic sediments<br />
were reconstructed in the same way for two<br />
time intervals: 10,800–9,500 cal BP (9,500–8,500<br />
uncal BP) and 9,400–7,800 cal BP (8,400–7,000 uncal<br />
BP) and compared to the water-level surfaces <strong>of</strong><br />
the Ancylus Lake and Litorina Sea, respectively.<br />
rina Sea limit lies between 25 and 5 m (Fig. 2).<br />
This means that near the Estonian/Latvian border,<br />
the Ancylus deposits lie at a lower altitude than the<br />
Litorina ones. The surface <strong>of</strong> the buried organic bed<br />
commonly remains 1–2 m lower than the highest<br />
shoreline limit. In northern and western Estonia, the
Fig. 1. Distribution <strong>of</strong> Holocene buried organic beds in Estonia. Organic deposits buried (A) during pre-Ancylus time and<br />
Ancylus transgressions, and (B) during post-Ancylus time and Litorina transgressions. Modi<strong>fi</strong> ed after Saarse et al. (2006).<br />
Fig. 2. (A) Isobases <strong>of</strong> the Ancylus Lake shore displacement (solid line) and buried organic deposits lower limit (dashed line) and<br />
(B) isobases <strong>of</strong> the Litorina Sea shore displacement (solid line) and buried organic deposits lower limit (dashed line). Isobases <strong>of</strong><br />
organic matter show disturbances in the surroundings <strong>of</strong> Pärnu, discussed in the text. Red crosses (+) mark the sites with buried<br />
organic deposits used in modelling. Shore displacement isobases are modi<strong>fi</strong> ed after Saarse et al. (2003).<br />
thickness <strong>of</strong> buried deposits is smaller than in the<br />
Narva and Pärnu areas, where the covering strata<br />
are up to 4–5 m thick.<br />
Comparisons <strong>of</strong> the Ancylus Lake isobases with<br />
the isobases <strong>of</strong> buried organic matter (mainly peat)<br />
displays nonconformity in the Pärnu area (sites 35,<br />
36, Figs. 1a, 2a). Both conventional and AMS radiocarbon<br />
dates veri<strong>fi</strong> es that peat was formed during<br />
the Ancylus transgression, but lies about 4–5 m<br />
lower than at the nearby sites. One can suspect that<br />
buried peat is not in situ position, as marine deposits<br />
rest on varved clays, which are highly susceptible<br />
to landslides. Similar nonconformity appears when<br />
comparing the isobases <strong>of</strong> the Litorina Sea shorelines<br />
with the isobases <strong>of</strong> buried organic matter. At<br />
some sites (Figs. 1b, 2b; sites 77, 78) in the Pärnu<br />
<strong>Geological</strong> <strong>Survey</strong> <strong>of</strong> <strong>Finland</strong>, <strong>Special</strong> <strong>Paper</strong> <strong>46</strong><br />
Buried organic sediments in Estonia related to the Ancylus Lake and Litorina Sea<br />
area, a great difference (up to 12 m) has been recorded<br />
in the elevation <strong>of</strong> the highest shoreline and<br />
the buried strata surfaces (Talviste et al. 2006), and<br />
the buried peat lies below the modern sea level.<br />
The reason for such phenomena is not yet clear and<br />
more detailed studies are required. However, the<br />
low position <strong>of</strong> the buried peat could be explained<br />
by low water levels prior the Litorina transgression<br />
(Talviste et al. 2006).<br />
At present, 71 radiocarbon dates are available<br />
from the pre-Ancylus and Ancylus buried organic<br />
deposits <strong>of</strong> 30 different sites (Fig. 3). Uncalibrated<br />
14 C radiocarbon dates vary between 9,980±120<br />
(Tln-2349) and 8,440±70 (TA-263). Buried peat,<br />
which was formed during the Ancylus Lake regression<br />
(pre-Litorina beds) and Litorina transgression,<br />
89
<strong>Geological</strong> <strong>Survey</strong> <strong>of</strong> <strong>Finland</strong>, <strong>Special</strong> <strong>Paper</strong> <strong>46</strong><br />
Leili Saarse, Jüri Vassiljev, Avo Miidel and Eve Niinemets<br />
Fig. 3. Distribution <strong>of</strong> radiocarbon dates with error bars. The blue line marks the age <strong>of</strong> the lower limit <strong>of</strong> the buried organic beds<br />
(cal BP), red line – the age <strong>of</strong> the upper limit. The bold black line shows water level changes in the surroundings <strong>of</strong> Pärnu (after<br />
Veski et al. 2005). The age <strong>of</strong> the different phases <strong>of</strong> the Baltic Sea basin according to Andrén et al. (2000). (BIL = Baltic Ice<br />
Lake).<br />
has been dated in 22 localities and a total <strong>of</strong> 66<br />
14 C dates are available (Fig. 3; Saarse et al. 2006,<br />
Talviste et al. 2006). Uncalibrated dates range from<br />
8,570±150 (Ta-2843) to 5,520±100 (Tln-178). Obviously,<br />
this is due to different factors as radiocarbon<br />
dates depending on the material analysed (wood,<br />
seeds, bulk organic matter, insoluble or soluble fraction),<br />
its preservation and availability to weathering,<br />
contamination with older carbon or younger rootlets<br />
(Olsson 1986, Wohlfarth et al. 1998). Wood, peat<br />
and seeds from locations 27, 28 and 35 (Fig. 1a),<br />
all connected with the Ancylus Lake development,<br />
were subjected to conventional and AMS radiocarbon<br />
dating. It was determined that the dates from<br />
the peat were older than those from wood and seeds<br />
at the same depth (Veski 1998). Several sites (5, 11,<br />
21, 31, 70; Figs. 1a, b) were re-examined. The new<br />
14 C dates obtained are commonly older than the previous<br />
ones and more consistent with pollen stratigraphy<br />
(Veski 1998). One reason for incorrect dates<br />
could be the preservation <strong>of</strong> samples (not kept in a<br />
refrigerator) and the time span between the collection<br />
and dating, which in some cases was formerly<br />
more than one year.<br />
According to the re-examined radiocarbon dates,<br />
90<br />
the Ancylus Lake transgression started about 10,800<br />
cal BP and culminated ca 300–500 years later.<br />
Around 10,100 cal BP, a rather rapid regression <strong>of</strong><br />
up to 30 m (Raukas et al. 1996) followed in the areas<br />
<strong>of</strong> rapid uplift. Buried organic deposits <strong>of</strong> Ancylus<br />
age are mostly characterised by the maximum <strong>of</strong><br />
Pinus pollen (Fig. 4). This was the main reason why<br />
the Ancylus transgression in Estonia was estimated<br />
to be about 1,000 years younger (Kessel & Raukas<br />
1979) than in neighbouring countries. According to<br />
radiocarbon dates, the Litorina transgression started<br />
about 8,300–7,800 cal BP and culminated at different<br />
times in different regions, <strong>fi</strong> rst in the areas<br />
<strong>of</strong> rapid uplift (Kessel & Raukas 1984, Miettinen<br />
2002). Pollen spectra <strong>of</strong> the Litorina Sea buried organic<br />
strata differ considerably between sites, still<br />
showing an af<strong>fi</strong> liation to the Atlantic chronozone.<br />
Comparisons <strong>of</strong> shore displacement curves with<br />
the positions <strong>of</strong> ancient settlements (Fig. 5) do not<br />
support the idea <strong>of</strong> multiple Litorina transgressions.<br />
However, this does not rule out smaller sea-level<br />
changes caused, for example, by stormy waves.<br />
Detailed bio- and chronostratigraphic analyses are<br />
needed to study the character <strong>of</strong> Litorina transgression<br />
more precisely.
<strong>Geological</strong> <strong>Survey</strong> <strong>of</strong> <strong>Finland</strong>, <strong>Special</strong> <strong>Paper</strong> <strong>46</strong><br />
Buried organic sediments in Estonia related to the Ancylus Lake and Litorina Sea<br />
Fig. 4. Pollen diagram from Kõpu (No 28, Fig. 1a). Buried organic beds are enriched with Pinus pollen, which was the main<br />
reason to consider their formation during the Boreal period. Analyses by S. Veski.<br />
Fig. 5. Comparison <strong>of</strong> shore displacement curves from Saaremaa with the settlement sites and cemetery locations. Ages<br />
uncal BP. (I) shore displacement curve for site 35, (II) site 33 and (III) 30 m Ancylus isobase in Saaremaa Island.<br />
91
<strong>Geological</strong> <strong>Survey</strong> <strong>of</strong> <strong>Finland</strong>, <strong>Special</strong> <strong>Paper</strong> <strong>46</strong><br />
Leili Saarse, Jüri Vassiljev, Avo Miidel and Eve Niinemets<br />
The study was supported by the Estonian State Target<br />
Funding Project No. 0332710s06 and the Esto-<br />
Andrén, E., Andrén, T. & Kunzendorf, H. 2000. Holocene<br />
history <strong>of</strong> the Baltic Sea as a background for assessing<br />
records <strong>of</strong> human impact in the sediments <strong>of</strong> the Gotland<br />
Basin. The Holocene 10, 687–702.<br />
Hausen, H. 1913. Über die Entwicklung Oberfl ächenformen<br />
in den Russischen Ostseeländern und Angrenzenden Gouvernements<br />
in der Quartärzeit. Fennia 32. 142 p.<br />
Kessel, H. 1960. Holozäne Küstenbildungen der Ostsee auf<br />
dem Territorium der Estnischen SSR. Geoloogia Instituudi<br />
Uurimused V. Tallinn: Eesti NSV Teaduste Akadeemia,<br />
279–303 (in Russian with German summary)<br />
Kessel, H. 1968. Mattunud soo- ja järvesetetest. Eesti Loodus<br />
1, 12–16.<br />
Kessel, H. & Raukas, A. 1979. The Quaternary history <strong>of</strong> the<br />
Baltic, Estonia. In: Gudelis, V. & Königsson, L.-K. (eds.)<br />
The Quaternary history <strong>of</strong> the Baltic. Acta Universitatis<br />
Upsaliensis. Annum Quingentesimum Celebrantis 1, 127–<br />
1<strong>46</strong>.<br />
Kessel, H. & Raukas, A. 1984. Correlation <strong>of</strong> the Baltic ancient<br />
coastal formations in Estonia and Sweden. Proceedings<br />
<strong>of</strong> the Academy <strong>of</strong> Sciences <strong>of</strong> the Estonian SSR 33,<br />
1<strong>46</strong>–157.<br />
Miettinen, A. 2002. Relative Sea Level Changes in the Eastern<br />
Part <strong>of</strong> the Gulf <strong>of</strong> <strong>Finland</strong> during the Last 8000 Years. Annales<br />
Academiae Scientiarum Fennicae, Geologica-Geographica<br />
162. 102 p.<br />
Olsson, I. U. 1986. Radiocarbon dating. In: Berglund, B. E.<br />
(ed.) Handbook <strong>of</strong> Holocene Palaeoecology and Palaeohydrology.<br />
Chichester: Wiley & Sons, 273–292.<br />
Ramsay, W. 1929. Niveauverschiebungen, Eisgestaute Seen<br />
und Rezession des Inlandeises in Estland. Fennia 52. 48 p.<br />
Raukas, A., Tavast, E. & Molodkov, A. 1996. Partsi – a new<br />
promising area for the investigation <strong>of</strong> Late Boreal and<br />
Early Atlantic water level changes <strong>of</strong> the Baltic Sea. Proceedings<br />
<strong>of</strong> the Estonian Academy <strong>of</strong> Sciences, Geology<br />
45, 92–101.<br />
92<br />
ACKNOWLEDGEMENTS<br />
REFERENCES<br />
nian Science Foundation Grant No. 6736. We thank<br />
Mrs. H. Kukk and A. Noor for linguistic help.<br />
Saarse, L., Vassiljev, J. & Miidel, A. 2003. Simulation <strong>of</strong> the<br />
Baltic Sea Shorelines in Estonia and Neighbouring Areas.<br />
Journal <strong>of</strong> Coastal Research 19, 261–268.<br />
Saarse, L., Vassiljev, J., Miidel, A. & Niinemets, E. 2006.<br />
Holocene buried organic sediments in Estonia. Proceedings<br />
<strong>of</strong> the Estonian Academy <strong>of</strong> Sciences, Geology 55,<br />
296–320.<br />
Schmidt, F. B. 1869. Notiz über neuere Untersuchungen im<br />
Gebiete der Glacial- und Postglacialformation in Estland<br />
und Schweden. In: Helmersen, G. (ed.) Studien über die<br />
Wanderblöcke und die Diluvialgebilde Russlands. Memorials<br />
Academy <strong>of</strong> Sciences St. Petersburg, VII Ser.Tome XIV:<br />
7, 55–59.<br />
Talviste, P., Hang, T. & Veski, S. 2006. Low early Holocene<br />
sea level in Pärnu area, Estonia, as recorded from buried<br />
organic deposits. In: Lukševiπs, E., Kalnina, L. & Stinkulis,<br />
G. (eds.) The Baltic Sea geology. The ninth marine<br />
geological conference, Jurmala, Latvia. Extended abstracts,<br />
102–103.<br />
Thomson, P. W. 1933. Ein von Ancylusstrandbildungen bedecktes<br />
Torfl ager bei Jelgimägi. Beiträge zur Kunde Est-,<br />
Liv- und Kurlands 18, 176–177.<br />
Thomson, P. W. 1937. Narva diatomiit. Eesti Loodus 5, 214–<br />
216.<br />
Veski, S. 1998. Vegetation history, human impact and palaeogeography<br />
<strong>of</strong> West Estonia. Pollen analytical studies <strong>of</strong> lake<br />
and bog sediments. Striae 38, 1–119.<br />
Veski, S., Heinsalu, A., Klassen, V., Kriiska, A., Lõugas, L.,<br />
Poska, A. & Saluäär, U. 2005. Early Holocene coastal settlements<br />
and palaeoenvironment on the shore <strong>of</strong> the Baltic<br />
Sea at Pärnu, southwestern Estonia. Quaternary International<br />
130, 75–85.<br />
Wohlfarth, B., Possnert, G. & Skog, G. 1998. Pitfalls in the<br />
AMS radiocarbon-dating <strong>of</strong> terrestrial macr<strong>of</strong>ossils. Journal<br />
<strong>of</strong> Quaternary Science 13, 137–145.
Applied Quaternary research in the central part <strong>of</strong> glaciated terrain,<br />
edited by Peter Johansson and Pertti Sarala.<br />
<strong>Geological</strong> <strong>Survey</strong> <strong>of</strong> <strong>Finland</strong>, <strong>Special</strong> <strong>Paper</strong> <strong>46</strong>, 93–98, 2007.<br />
MACROFOSSIL EVIDENCE DISPUTE UBIQUITOUS BIRCH-PINE-<br />
SPRUCE SUCCESSION IN WESTERN FINNISH LAPLAND<br />
by<br />
Raimo Sutinen 1 , Ilkka Aro 1 , Hannu Herva 2 , Tapio Muurinen 1 ,<br />
Matti Piekkari 1 and Mauri Timonen 3<br />
Sutinen, R., Aro, I., Herva, H., Muurinen, T., Piekkari, M.<br />
& Timonen, M. 2007. Macr<strong>of</strong>ossil evidence dispute ubiquitous<br />
birch-pine-spruce succession in western Finnish Lapland.<br />
Applied Quaternary research in the central part <strong>of</strong> glaciated terrain.<br />
<strong>Geological</strong> <strong>Survey</strong> <strong>of</strong> <strong>Finland</strong>, <strong>Special</strong> <strong>Paper</strong> <strong>46</strong>, 93–98,<br />
5 <strong>fi</strong> gures.<br />
Reconstruction <strong>of</strong> the post-glacial migration <strong>of</strong> Norway spruce<br />
(Picea abies (L.) Karst.) into northern Fennoscandia is based on<br />
pollen records and radiocarbon ( 14 C) ages from organic deposits.<br />
However, no macr<strong>of</strong>ossil evidence indicates the distribution <strong>of</strong><br />
spruce beyond its present timberline-treeline ecotone. We applied<br />
total sampling to study Holocene succession <strong>of</strong> tree species<br />
at two sites: Pousujärvi peat bog (68°51’N, 21°10’E), beyond<br />
the present tree limits <strong>of</strong> spruce and Scots pine (Pinus sylvestris<br />
L.) and at Lake Kompsiotievanlammit (68°30’N, 22°30’E) at<br />
the present pine treeline in western Finnish Lapland. Subfossil<br />
pine logs at the Pousujärvi site yielded 14 C-ages from 5,000±40<br />
to 5,110±60 yr BP (5,730 to 5,900 cal. BP). The pioneer species<br />
were found to be birch (Betula pubescens ssp.) yielding 14 C-age<br />
<strong>of</strong> 7,980±60 yr BP (8,810 cal. yr BP). No spruce was present.<br />
All subfossil trunks sampled from Lake Kompsiotievanlammit<br />
were pines, and yielded ages less than 3500 yr BP. No spruce was<br />
present. Our results imply that Holocene tree species succession<br />
is incomplete in that spruce is absent in the chrono-stratigraphic<br />
sequences in regions where an edaphic dispersal barrier for<br />
spruce is comprised <strong>of</strong> tills derived from felsic rocks, particularly<br />
granulites.<br />
Key words (GeoRef Thesaurus, AGI): paleobotany, Betula,<br />
Pinus, Picea, wood, mires, lakes, absolute age, 14 C, Holocene,<br />
Lapland Province, <strong>Finland</strong>.<br />
1 <strong>Geological</strong> <strong>Survey</strong> <strong>of</strong> <strong>Finland</strong>, P.O. Box 77, FI-96101<br />
Rovaniemi, <strong>Finland</strong><br />
2 Finnish Forest Research Institute, Muoniontie 21A,<br />
FI-95900 Kolari, <strong>Finland</strong><br />
3 Finnish Forest Research Institute, Eteläranta 55, FI-96300<br />
Rovaniemi, <strong>Finland</strong><br />
E-mail: raimo.sutinen@gtk.<strong>fi</strong> , ilkka.aro@gtk.<strong>fi</strong> ,<br />
tapio.muurinen@gtk.<strong>fi</strong> , matti.piekkari@gtk.<strong>fi</strong> ,<br />
hannu.herva@metla.<strong>fi</strong> , mauri.timonen@metla.<strong>fi</strong><br />
93
<strong>Geological</strong> <strong>Survey</strong> <strong>of</strong> <strong>Finland</strong>, <strong>Special</strong> <strong>Paper</strong> <strong>46</strong><br />
Raimo Sutinen, Ilkka Aro, Hannu Herva, Tapio Muurinen, Matti Piekkari and Mauri Timonen<br />
The static model <strong>of</strong> the (aspen-) birch-pine-spruce<br />
successional sequence advocates that forests repeat<br />
the same regeneration and succession stages after<br />
forest disturbances (Pastor et al. 1999) and within<br />
the Holocene migration <strong>of</strong> tree species. Conifer tree<br />
limits and timberlines, however, display evidence<br />
<strong>of</strong> diverse succession and migration patterns during<br />
the Holocene. East <strong>of</strong> Fennoscandia, spruce (Picea<br />
abies ssp. obovata) forms the present coniferous tree<br />
limit reaching 66°20’-69°25’N, whereas the tree<br />
limit <strong>of</strong> Scots pine (Pinus sylvestris L.) remains at<br />
latitudes 64°30’-66°N, respectively (Veijola 1998,<br />
MacDonald et al. 2000, Payette et al. 2002). In Fennoscandia,<br />
the northern limits <strong>of</strong> Norway spruce<br />
(Picea abies (L.) Karst.) and Scots pine both reach<br />
a latitude <strong>of</strong> 70°N, but the timberline <strong>of</strong> spruce is<br />
located at signi<strong>fi</strong> cantly lower latitudes than Scots<br />
pine (Kallio et al. 1971, Veijola 1998, MacDonald<br />
et al. 2000; Fig. 1). Even though spruce is a climax<br />
species in the successional sequence, it is absent<br />
over a large region in the northern boreal forests <strong>of</strong><br />
Lapland (Fig. 1), where Scots pine is a dominant<br />
species and birch (Betula pendula Roth. and B. pubescens<br />
Ehrh.) is a secondary species.<br />
Holocene migration <strong>of</strong> tree species, tree-line<br />
fl uctuations and forest disturbances are associated<br />
with climate-driven factors (Moe 1970, Eronen &<br />
Hyvärinen 1987, Kremenetski et al. 1999, Mac-<br />
Donald et al. 2000, Kullman 2002, Payette et al.<br />
2002). Evidenced by 14 C-dated subfossil trunks, the<br />
expansion <strong>of</strong> spruce to sites north <strong>of</strong> the modern<br />
treeline in Eurasian Russia occurred 9,000-8,000 yr<br />
BP, and the retreat <strong>of</strong> spruce to its current treeline<br />
position occurred 4,000-3,000 yr BP (Kremenetski<br />
et al. 1998, MacDonald et al. 2000). Also, spruce<br />
macr<strong>of</strong>ossils well above the present alpine tree limit<br />
in the Caledonian mountain range in central Sweden<br />
indicate that spruce was part <strong>of</strong> the forest migration<br />
Study sites<br />
The Pousujärvi (68°51’N, 21°10’E) site was selected<br />
because one <strong>of</strong> the present co-writers (M.<br />
Piekkari) discovered (within the geochemistry mapping<br />
<strong>of</strong> tills by the <strong>Geological</strong> <strong>Survey</strong> <strong>of</strong> <strong>Finland</strong>)<br />
that subfossil logs were present in peat layers. The<br />
Pousujärvi site is located beyond the present spruce<br />
and pine (Pinus silvestris L) tree limits (Fig. 1). The<br />
Lake Kompsiotievanlammit (68°30’N, 22°30’E;<br />
94<br />
INTRODUCTION<br />
MATERIALS AND METHODS<br />
Fig. 1. Study sites in northern <strong>Finland</strong>. Timberlines <strong>of</strong> Norway<br />
spruce (blue line) and Scots pine (red line) adopted from<br />
Sutinen et al. (2005).<br />
during the early Holocene time period (8,000-11,000<br />
yr BP; Kullman 2002). Hence, climate factors did<br />
not constrain the early migration <strong>of</strong> spruce in Fennoscandia.<br />
However, the conceptual pollen-derived<br />
migration model advocates that spruce reached its<br />
northernmost range limit as late as 3,500 yr BP in<br />
northern Fennoscandia (Moe 1970, Kremenetski et<br />
al. 1999). We argue that lithological provinces constitute<br />
edaphic dispersal barriers, such that spruce<br />
is absent on terrains with low soil water availability<br />
and nutrients and typi<strong>fi</strong> ed by acidic tills derived<br />
from felsic rocks, such as the granulite belt in northeast<br />
Fennoscandia (Sutinen et al. 2002, 2005). We<br />
attempted to see if spruce had been present, similar<br />
to the Russian (MacDonald et al. 2000) or Swedish<br />
(Kullman 2002) cases, in the early Holocene succession<br />
beyond its present tree limit/ timberline.<br />
Fig. 1) site was selected on the basis <strong>of</strong> relative location<br />
to the present Scots pine treeline. Previous<br />
studies by Eronen et al. (2002) have indicated that<br />
subfossil pine logs are common in the lakes <strong>of</strong> Lapland,<br />
hence we located potential survey sites with<br />
airborne surveillance. A helicopter search revealed<br />
that logs were present on the bottom <strong>of</strong> Kompsiotievanlammit.
<strong>Geological</strong> <strong>Survey</strong> <strong>of</strong> <strong>Finland</strong>, <strong>Special</strong> <strong>Paper</strong> <strong>46</strong><br />
Macr<strong>of</strong>ossil evidence dispute ubiquitous birch-pine-spruce succession in western Finnish Lapland<br />
Sampling<br />
Both selected sites were logistically accessible,<br />
hence we applied a total megafossil sampling to<br />
verify a tree species succession pattern in the outermost<br />
corner in northwest <strong>of</strong> Finnish Lapland. We<br />
used a 20 ton excavator at the Pousujärvi site to<br />
sample all subfossil trees 2.5 m in thickness from<br />
the peat bog. At the Kompsiotievanlammit site, we<br />
used haul-skidder with a 12-m-long loading crane<br />
Fig. 2. Sampling with loading crane and log grips.<br />
Fig. 3. Disk sampling for 14 C-datings and tree-ring analyses.<br />
and log grips (Fig. 2) to sample all subfossil trunks<br />
at the bottom <strong>of</strong> the lake. At both sites, disk samples<br />
were collected with a chain saw (Fig. 3). The peat<br />
pr<strong>of</strong>i le was investigated and sampled for 14 C-datings<br />
at the <strong>Geological</strong> <strong>Survey</strong> <strong>of</strong> <strong>Finland</strong>. Disks from the<br />
subfossil logs were analysed at the dendrological<br />
laboratory at the Finnish Forest Research Institute,<br />
Kolari station.<br />
95
<strong>Geological</strong> <strong>Survey</strong> <strong>of</strong> <strong>Finland</strong>, <strong>Special</strong> <strong>Paper</strong> <strong>46</strong><br />
Raimo Sutinen, Ilkka Aro, Hannu Herva, Tapio Muurinen, Matti Piekkari and Mauri Timonen<br />
Birch megafossils<br />
Near the bottom <strong>of</strong> the bog at the Pousujärvi site<br />
a birch (Betula pubencens ssp.) layer was detected.<br />
The most distinctive subfossil birch trunk, 20 cm<br />
in diameter and from 220cm depth (Fig. 4) yielded<br />
a 14 C-age <strong>of</strong> 7,980±60 (8,810 cal. BP), making this<br />
the oldest tree megafossil found in the Kilpisjärvi<br />
area, <strong>Finland</strong>. The supra-long Scots pine tree-ring<br />
record by Eronen et al. (2002) extends to 7,500 yr<br />
BP, but the oldest 14 C-dated pine log in Lapland<br />
had yielded a date <strong>of</strong> 6,930 yr BP (7,680 cal. BP)<br />
(Eronen 1979). Wood material from the birch<br />
trunks was decomposed, but perfect in shape such<br />
that white bark and tree-rings were clearly visible<br />
(Fig. 4). Birch megafossils are not commonly found<br />
in Lapland, but one has been found beneath paleolandslide<br />
materials in Kittilä (67°47’N, 25°28’E)<br />
yielding a 14 C-age <strong>of</strong> 8,720 yr BP (9,730 cal. BP)<br />
(Sutinen 2005). Pollen statigraphy at the Toskaljavri<br />
site (69°11’N, 21°27’E at 704 m a.s.l.) (Seppä et<br />
al. 2002) also indicates that birch was the pioneer<br />
tree species after the deglaciation <strong>of</strong> the Kilpisjärvi<br />
area, but the time <strong>of</strong> early migration <strong>of</strong> 9,600 cal.<br />
yr BP is not concurrent with the megafossil data<br />
obtained here. Our observations are also supported<br />
by the <strong>fi</strong> ndings <strong>of</strong> birch megafossils (9,709-8,954<br />
cal. yr BP) found in peat layers in Siberia (between<br />
70°59’N and 69°43’N) indicating that birch is a pioneer<br />
species (MacDonald et al. 2000). It should be<br />
noted, however, that the Yamal Peninsula and other<br />
regions eastward were not covered by the Fennoscandian<br />
Ice Sheet (FIS) during the Late Weichselian<br />
time period (Larsen et al. 2006). Thus, the timing <strong>of</strong><br />
migration in the Kola Peninsula and Fennoscandia<br />
had been delayed by the retreating ice (MacDonald<br />
2000).<br />
Fig. 4. A 8810-yr-old birch megafossil found at the bottom <strong>of</strong><br />
the Pousujärvi peat bog.<br />
96<br />
RESULTS AND DISCUSSION<br />
Pine megafossils<br />
The subfossil pine logs (21 in number) at the Pousujärvi<br />
site were found at depths <strong>of</strong> 1-2 m below<br />
the surface <strong>of</strong> the mire. The three dated logs yielded<br />
14 C-ages from 5,000±40 to 5,110±60 BP yr (5,730<br />
to 5,900 cal. BP). On the basis <strong>of</strong> tree-ring analyses,<br />
the two oldest pine logs yielded a date <strong>of</strong> 6,006-<br />
6,054 cal. yr BP, and the three youngest 4,698,<br />
4,385, and 4,369 cal. yr BP, respectively. Hence,<br />
pine had been present at Pousujarvi between 6,000-<br />
4,400 yr. BP. The Pousujärvi site is the very last site<br />
before Lake Kilpisjärvi on the Finnish-Norwegian<br />
border, where subfossil Scots pine logs were found.<br />
The altitude <strong>of</strong> 450 m (a.s.l.) is much lower than the<br />
nearest <strong>fi</strong> nding at Ailakkavaaran lompolo (68°57’N,<br />
20°57’E at 515 m a.s.l.) by Eronen and Zetterberg<br />
(1996). Their time-envelop for the presence <strong>of</strong> pine<br />
ranges from 6,000 to 4,085 cal. yr BP, coinciding<br />
with our dates for the immigration time <strong>of</strong> pine. The<br />
stomata/pollen stratigraphy at the Toskaljavri site<br />
by Seppä et al. (2002), indicates pine immigration<br />
as early as 8,300 cal. yr BP, but this is not supported<br />
by pine megafossils.<br />
The subfossil pine logs (37 in number) sampled<br />
from the bottom <strong>of</strong> Lake Kompsiotievanlammit<br />
yielded ages less than 3,500 yr BP as dated by<br />
the tree-ring Advance-10 master-series. Based on<br />
the radiocarbon ( 14 C) dates <strong>of</strong> subfossil Scots pine<br />
logs, pine spread through northern Fennoscandia<br />
between 8,000-7,000 yr BP and reached its maximum<br />
distribution between 6,000-4,000 cal. yr BP,<br />
followed by a gradual retreat to its modern range<br />
limit (Eronen & Hyvärinen 1987, Eronen et al.<br />
1999, 2002, Payette et al. 2002). After the retreat <strong>of</strong><br />
pine to its present treeline, we suspect that the tree<br />
line had been stable for 3000 yr.<br />
Peat pr<strong>of</strong>i le<br />
The existence <strong>of</strong> Equisetum and Menyanthes indicate<br />
that the type <strong>of</strong> Pousujärvi mire was a wet,<br />
oligotrophic fen. The huminosity <strong>of</strong> peat is H3-4.<br />
The top layer down to 60 cm is composed <strong>of</strong> Carex-<br />
Sphagnum peat with gyttja-horizons containing<br />
dystrophic algae. The second layer, from 60 to 190<br />
cm, has an abundance <strong>of</strong> Equisetum indicating a<br />
wet environment. However, the top <strong>of</strong> this layer is<br />
typi<strong>fi</strong> ed by Bryales-Sphagnum peat also contains<br />
nanoligniquids suggesting temporary drier periods.<br />
The lower part <strong>of</strong> this second layer (130-190<br />
cm), with Carex-Sphagnum peat, indicates a stable<br />
fen-stage. The lowermost peat layer (190-210 cm),<br />
lying on gyttja deposits, is composed <strong>of</strong> eutrophic
Fig. 5. The Pousujärvi peat pr<strong>of</strong>i le. Given numbers refer to<br />
dates (cal. BP) obtained from peat samples.<br />
<strong>Geological</strong> <strong>Survey</strong> <strong>of</strong> <strong>Finland</strong>, <strong>Special</strong> <strong>Paper</strong> <strong>46</strong><br />
Macr<strong>of</strong>ossil evidence dispute ubiquitous birch-pine-spruce succession in western Finnish Lapland<br />
Bryales-Sphagnum (H3) peat with an abundance <strong>of</strong><br />
Menyanthes. The 50 cm thick gyttja layer is lying<br />
on lacustrine silt.<br />
The sampled peat pr<strong>of</strong>i le yielded 14 C-ages were<br />
consistent with the dates <strong>of</strong> pine and birch megafossils:<br />
2,920±60 BP yr (3,060 cal. BP) at 30-cm-depth,<br />
4,<strong>46</strong>0±50 BP yr (5,050 cal. BP) at 70-cm-depth,<br />
5,640±60 BP yr (6,410 cal. BP) at 150-cm-depth,<br />
6140±60 BP yr (7,000 cal. BP) at 200-cm-depth,<br />
and 7,830±80 yr BP (8,600 cal. BP) at 240-cmdepth,<br />
respectively (Fig. 5). The results indicate that<br />
the maximum growth <strong>of</strong> peat was achieved between<br />
5,050-7,000 cal. yr BP varying in rate from 0.6<br />
mm/yr to 0.85 mm/yr. A clear climatic deterioration<br />
reduced the growth rate after 5,050 cal. yr BP,<br />
descending to 0.2 mm/yr and <strong>fi</strong> nally to 0.1 mm/yr.<br />
During the early Holocene, the rate was also rather<br />
low, 0.25 mm/yr. Similar to Pousujärvi pine megafossils,<br />
the timing <strong>of</strong> the maximum growth rate <strong>of</strong><br />
the Pousujärvi peat are concurrent with the record<br />
<strong>of</strong> 14 C-dated pine megafossils, indicating that pine<br />
was present between 6,000-4,000 cal. yr in outermost<br />
northwest Finnish Lapland (Eronen & Hyvärinen<br />
1987, Eronen et al. 1999, 2002). However,<br />
the maximum peat growth between 6,000-7,000 cal.<br />
yr. BP had no equivalent in the megafossils at the<br />
Pousujärvi study site.<br />
Lack <strong>of</strong> spruce<br />
We found no macr<strong>of</strong>ossil evidence to indicate the<br />
presence <strong>of</strong> Norway spruce during the Holocene<br />
in northwest Finnish Lapland. Prior to our study, a<br />
number <strong>of</strong> subfossil logs were investigated in the<br />
area, but all have been identi<strong>fi</strong> ed as pines (Eronen<br />
& Hyvärinen 1987, Eronen et al. 1999, 2002). One<br />
may argue that spruce logs were decomposed or<br />
destroyed in the lakes by wave action. However, according<br />
to our visual observations birch megafossils<br />
are present at the bottom <strong>of</strong> the small ponds, such<br />
as in the Malla Strict Nature Reserve (69°03’N,<br />
20°38’E at 500 m a.s.l.), and birch logs were preserved<br />
through the Holocene in the peat <strong>of</strong> the Pousujärvi<br />
site. Also, fragments <strong>of</strong> early Holocene birch<br />
wood (9,730 cal. BP) beneath 3.5 m thick landslide<br />
material have been preserved (Sutinen 2005). In addition,<br />
spruce stumps were preserved in the Siberian<br />
tundra and Caledonian mountain range in Sweden<br />
through the Holocene (MacDonald et al. 2000,<br />
Kullman 2002).<br />
On the basis <strong>of</strong> 14 C-dated megafossils, spruce<br />
(Picea abies ssp. obovata) migrated (app. 9,400 cal.<br />
yr BP) beyond its present tree limit much earlier<br />
compared to pine (app. 7,500 cal. yr BP) in Siberia<br />
(MacDonald et al. 2000). Also, spruce megafossils<br />
well above the present alpine tree limit in central<br />
Sweden indicate that spruce was part <strong>of</strong> the forest<br />
migration during the early Holocene (8,000-11,000<br />
cal. yr BP; Kullman 2002). Thus, the conceptual<br />
migration model that advocated that spruce reached<br />
its northernmost range limit as late as 3,500 yr BP<br />
in northern Fennoscandia (Moe 1970, Kremenetski<br />
et al. 1999) appears controversial. Spruce is able<br />
to thrive at high altitudes and low temperature<br />
conditions similar to pine (Nikolov & Helmisaari<br />
1992), hence the opposite spreading behaviour in<br />
northern Fennoscandia sounds irrational, that is<br />
spreading at the time <strong>of</strong> climatic deterioration and<br />
retreat <strong>of</strong> spruce in Siberia (MacDonald et al. 2000)<br />
and pine in Lapland (Eronen 1979, Eronen & Hyvärinen<br />
1987), and as seen by the reduced growth<br />
<strong>of</strong> Pousujärvi peat. The Kompsiotievanlammit site<br />
lies on the present pine treeline, while the present<br />
spruce treeline is 60 km southeast <strong>of</strong> the site. If<br />
spruce arrived Lapland 3,500 cal. yr BP (Moe<br />
1970, Kremenetski et al. 1999), why is there no evidence<br />
to indicate a spruce migration with a similar<br />
topoclimatic position as pine. Also, the presence <strong>of</strong><br />
Norway spruce after 4,000 cal. yr BP in the Toskaljavri<br />
pollen stratigraphy (Seppä et al. 2002) appears<br />
vague. If spruce migrated to the Kilpisjärvi area, it<br />
97
<strong>Geological</strong> <strong>Survey</strong> <strong>of</strong> <strong>Finland</strong>, <strong>Special</strong> <strong>Paper</strong> <strong>46</strong><br />
Raimo Sutinen, Ilkka Aro, Hannu Herva, Tapio Muurinen, Matti Piekkari and Mauri Timonen<br />
should have left macro-signatures in the peat layers<br />
<strong>of</strong> Pousujärvi and other investigated peat sites in the<br />
region (Eronen & Zetterberg 1996).<br />
With respect to the present spruce timberline in<br />
the transition between the ma<strong>fi</strong> c Tanaelv belt and<br />
felsic Lapland granulite belt in Finnish Lapland<br />
(Sutinen et al. 2005), we argue that in contrast to<br />
Siberian cases (MacDonald et al. 2000), spruce<br />
has not been a ubiquitous member <strong>of</strong> the Holocene<br />
tree succession sequence in northern Fennoscandia.<br />
We thank Finnish Forest and Park Service for allowing<br />
us to make the research at the Pousujärvi<br />
and Kompsiotievanlammit sites. Osmo Äikää is<br />
Eronen, M. 1979. The retreat <strong>of</strong> pine forest in Finnish Lapland<br />
since the Holocene climatic optimum: a general discussion<br />
with radiocarbon evidence from subfossil pines. Fennia<br />
157: 2, 93–114.<br />
Eronen, M. & Hyvärinen, P. 1987. Radiocarbon-dated subfossil<br />
pines from Finnish Lapland. Geogra<strong>fi</strong> ska Annaler<br />
69A: 2, 297–304.<br />
Eronen, M. & Zetterberg, P. 1996. Climatic change in northern<br />
Europe since late glacial times, with spezial reference to<br />
dendroclimatological studies in northern Finnish Lapland.<br />
Geophysica 32, 35–60.<br />
Eronen, M., Zetterberg, P., Briffa, K. R., Lindholm, M.,<br />
Meriläinen, J. & Timonen, M. 2002. The supra-long<br />
Scots pine tree-ring record for Finnish Lapland: Part 1,<br />
chronology construction and initial inferences. Holocene<br />
12, 673–680.<br />
Kallio, P., Laine, U. & Mäkinen, Y. 1971. Vascular fl ora <strong>of</strong><br />
Inari Lapland. 2. Pinaceae and Cupressaeae. Reports from<br />
Kevo Subarctic Research Station 8, 73–100.<br />
Kremenetski, C. V., Sulerzhitsky, L. D. & Hantemirov, R.<br />
1998. Holocene history <strong>of</strong> the northern range limits <strong>of</strong> some<br />
trees and shrubs in Russia. Arctic and Alpine Research 30,<br />
317–333.<br />
Kremenetski, C., Vaschalova, T. & Sulerzhitsky, L. 1999.<br />
The Holocene vegetation history <strong>of</strong> the Khibiny Mountains:<br />
implications for the postglacial expansion <strong>of</strong> spruce and alder<br />
on the Kola Peninsula, northwestern Russia. Journal <strong>of</strong><br />
Quaternary Science 14: 1, 29–43.<br />
Kullman, L. 2002. Boreal tree taxa in the central Scandes during<br />
the Late-Glacial: implications for Late-Quaternary forest<br />
history. Journal <strong>of</strong> Biogeography 29: 9, 1117–1124.<br />
Larsen, E., Kjær, K., Demidov, I., Funder, S., Grøsfjeld,<br />
K., Houmark-Nielsen, M., Jensen, M., Linge, H. & Lyså,<br />
A. 2006. Late Pleistocene glacial and lake history <strong>of</strong> northwestern<br />
Russia. Boreas 35: 3, 394–424.<br />
98<br />
ACKNOWLEDGEMENTS<br />
REFERENCES<br />
Since spruce and pine have distinctly different site<br />
requirements with respect to soil water availability<br />
and nutrients (Sutinen et al. 2002), the reverse<br />
behaviour between the timberlines and migration<br />
patterns <strong>of</strong> Eurasian spruce and pine species may<br />
be associated with differences between the soils derived<br />
from the rocks <strong>of</strong> the Baltic Shield and those<br />
derived from Cambrian sedimentary rocks in subarctic<br />
Siberia.<br />
acknowledged for the 14 C-datings and Viena Arvola<br />
for editorial help.<br />
MacDonald, G. M., Velichko, A. A., Kremenetski, C. V.,<br />
Borisova, O. K., Goleva, A. A., Andreev, A. A., Cwynar,<br />
L. C., Riding, R. T., Forman, S. L., Edvards, T. W. D.,<br />
Aravena, R., Hammarlund, D., Szeicz, V. N. & Gattaulin,<br />
V. N. 2000. Holocene treeline history and climatic<br />
change across northern Eurasia. Quaternary Research 53,<br />
302–311.<br />
Moe, D. 1970. The post-glacial immigration <strong>of</strong> Picea abies into<br />
Fennoscandia. Botaniska Notiser 122, 61–66.<br />
Nikolov, N. & Helmisaari, H. 1992. Silvics <strong>of</strong> the circumpolar<br />
boreal forest tree species. In: Sugart, H., Leemans, R.<br />
& Bonan, G. (eds.) A system analysis <strong>of</strong> the boreal forest.<br />
Cambridge University Press, Cambridge, 13–84.<br />
Pastor, J., Cohen, Y. & Moen, R. 1999. Generation <strong>of</strong> spatial<br />
patterns in boreal forest landscapes. Ecosystems 2,<br />
439–450.<br />
Payette, S., Eronen, M. & Jasisnski, J. J. P. 2002. The circumpolar<br />
tundra-taiga interfaces: Late Pleistocene and<br />
Holocene changes. Ambio <strong>Special</strong> Reports 12, 15–22.<br />
Seppä, H., Nyman, M., Korhola, A. & Weckström, J. 2002.<br />
Changes <strong>of</strong> treelines and alpine vegetation in relation to<br />
postglacial climate dynamics in northern Fennoscandia<br />
based on pollen and chironomid records. Journal <strong>of</strong> Quaternary<br />
Science 17, 287–301.<br />
Sutinen, R., Teirilä, A., Pänttäjä, M. & Sutinen, M.-L. 2002.<br />
Distribution and diversity <strong>of</strong> tree species with respect to<br />
soil electrical characteristics in Finnish Lapland. Canadian<br />
Journal <strong>of</strong> Forest Research 32: 7, 1158–1170.<br />
Sutinen, R., Hyvönen, E., Ruther, A., Ahl., A. & Sutinen,<br />
M.-L. 2005. Soil-driven timberline <strong>of</strong> spruce (Picea abies)<br />
in Tanaelv Belt-Lapland Granulite transition, <strong>Finland</strong>. Arctic,<br />
Antarctic, and Alpine Research, 37: 4, 611–619.<br />
Veijola, P. 1998. The northern timberline and timberline forests<br />
in Fennoscandia. The Finnish Forest Research Institute, Research<br />
<strong>Paper</strong>s 672, 1–242.
Applied Quaternary research in the central part <strong>of</strong> glaciated terrain,<br />
edited by Peter Johansson and Pertti Sarala.<br />
<strong>Geological</strong> <strong>Survey</strong> <strong>of</strong> <strong>Finland</strong>, <strong>Special</strong> <strong>Paper</strong> <strong>46</strong>, 99–102, 2007.<br />
POLLEN DIAGRAM OF THE LATE PLEISTOCENE INTERSTADIAL<br />
DEPOSITS FROM THE KOLA PENINSULA, RUSSIA<br />
by<br />
Alla Sharapova and Ljudmila Semenova 1<br />
Sharapova, A. & Semenova, L. 2007. Pollen diagram <strong>of</strong> the<br />
Late Pleistocene interstadial deposits from the Kola Peninsula,<br />
Russia. Applied Quaternary research in the central part <strong>of</strong> glaciated<br />
terrain. <strong>Geological</strong> <strong>Survey</strong> <strong>of</strong> <strong>Finland</strong>, <strong>Special</strong> <strong>Paper</strong> <strong>46</strong>,<br />
99–102, 2 <strong>fi</strong> gures.<br />
A 40-meter long sediment succession from the Svjatoy Nos<br />
Cape, Murman Coast <strong>of</strong> the Kola Peninsula, has been analyzed.<br />
Lithostratigraphic investigations combined with pollen analysis<br />
have revealed new evidence on the Late Pleistocene history <strong>of</strong><br />
the area. Five sedimentary units have been identi<strong>fi</strong> ed. These units<br />
represent various sedimentary environments including coastal<br />
marine sediments (the oldest unit I), marine sediments (unit II),<br />
glaci<strong>of</strong>l uvial deposits (unit III), till (unit IV) and soil (unit V).<br />
Marine deposits (unit II) yielded abundant assemblages <strong>of</strong> pollen,<br />
belonging to 22 morphotypes. The pollen percentage diagram<br />
was divided into two pollen assemblage zones. The zones are<br />
characterized by dominance <strong>of</strong> Betula sect. Albae and Ericales.<br />
The upper pollen zone is marked by rapidly increasing values<br />
<strong>of</strong> Betula sect. Nanae, Cyperaceae and Artemisia. The pollen<br />
record is interpreted to refl ect the Late Pleistocene interstadial<br />
conditions with birch-forest tundra and tundra vegetation.<br />
Key words (GeoRef Thesaurus, AGI): paleobotany, sediments,<br />
biostratigraphy, pollen analysis, interstadial environment, Pleistocene,<br />
Kola Peninsula, Russian Federation.<br />
1 Russian <strong>Geological</strong> Research Institute (VSEGEI), 199 106<br />
Sredniy 74, St. Petersburg, Russia<br />
E-mail: alla_sharapova@mail.ru, ljudmilasemenova@mail.ru<br />
99
<strong>Geological</strong> <strong>Survey</strong> <strong>of</strong> <strong>Finland</strong>, <strong>Special</strong> <strong>Paper</strong> <strong>46</strong><br />
Alla Sharapova and Ljudmila Semenova<br />
The biostratigraphy <strong>of</strong> the Late Quaternary sequence<br />
from the Kola Peninsula is poorly known. There are<br />
a few palynological studies <strong>of</strong> the Pleistocene deposits<br />
from this area (Nikonov & Vostruhina 1964,<br />
Armand 1969, Armand et al. 1969, Evserov et al.<br />
The Kola Peninsula is situated in northeast Fennoscandia<br />
and is bounded by the Barents Sea to the<br />
north and the White Sea to the south. The climate<br />
is infl uenced by the relatively warm Murman Coast<br />
current, a branch <strong>of</strong> the North Atlantic current.<br />
Mean January temperatures range from -5 to -9°C<br />
for the Barents shoreline, and from -10 to -14°C for<br />
the central part <strong>of</strong> the Kola Peninsula. Mean July<br />
temperatures range from 8 to 10°C and from 11 to<br />
14°C respectively (Koshechkin et al. 1975). Study<br />
site SN-1 is located in the northeastern part <strong>of</strong> the<br />
Kola Peninsula on the Barents Sea coast (Fig. 1).<br />
The vegetation <strong>of</strong> the study area belongs to tundra<br />
zone (Ramenskaya 1983).<br />
Pollen analysis was carried out on samples with a<br />
vertical thickness <strong>of</strong> 1 cm. Wet weight for the samples<br />
was 50 g. In general, treatment followed the<br />
method described by V. Grychuk (1940), including<br />
disintegration in 10% KOH and separation in heavy<br />
liquid KI + CdI 2 , density 2.3. For each sample, 300<br />
arboreal pollen grains were counted on magni<strong>fi</strong> ca-<br />
100<br />
INTRODUCTION<br />
STUDY AREA<br />
METHODS<br />
1980). The aim <strong>of</strong> the present study is to establish<br />
a palynostratigraphy and vegetation history <strong>of</strong> the<br />
Late Pleistocene interstadial event from the northeastern<br />
part <strong>of</strong> the Kola Peninsula.<br />
Fig. 1. Map <strong>of</strong> the study area.<br />
tion x 600; nonarboreal pollen and spores were also<br />
tallied. Plant nomenclature follows Vascular Plants<br />
<strong>of</strong> Russia and Adjacent States (1995). Pollen diagrams<br />
were made using the TILIA program (Grimm<br />
1990). Percentages <strong>of</strong> pollen and spore taxa were<br />
calculated per total sum <strong>of</strong> pollen and spores.
A 40-meter long sediment succession from the<br />
Svjatoy Nos Cape, Murman Coast <strong>of</strong> the Kola<br />
Peninsula was analyzed. Five sedimentary units<br />
were identi<strong>fi</strong> ed. The lowermost lithological unit I,<br />
coastal marine deposits (37.6-32.6 m), overlies the<br />
crystalline bedrock and consists <strong>of</strong> sand, gravel and<br />
boulder. Lithological unit II, marine deposits (32.6-<br />
5.3 m), is composed <strong>of</strong> clay. Lithological unit III,<br />
glaci<strong>of</strong>l uvial deposits (5.3-2.8 m) consists <strong>of</strong> sand,<br />
gravel and boulder. Lithological unit IV, glacial<br />
deposits (2.8-0.7 m), represents till. Lithological<br />
unit V (0.7-0 m) consists <strong>of</strong> soil (Fig. 2). Marine<br />
deposits (unit II) were studied for spore and pollen<br />
analysis. Twenty-two morphotypes <strong>of</strong> Quaternary<br />
pollen and spores were identi<strong>fi</strong> ed. The pollen<br />
percentage diagram was divided into two pollen<br />
assemblage zones (Fig. 2). Trees and shrubs dominated<br />
in the pollen assemblages <strong>of</strong> zone 1 (subzone<br />
1a, 1b, 1c, 1d; 30.6-10.2 m) and zone 2 (10.2-5.3<br />
m), changing from 47 to 70%. The values <strong>of</strong> spores<br />
were 22-48%; contents <strong>of</strong> herbs were 5-18%. These<br />
zones are characterized by the dominance <strong>of</strong> Betula<br />
<strong>Geological</strong> <strong>Survey</strong> <strong>of</strong> <strong>Finland</strong>, <strong>Special</strong> <strong>Paper</strong> <strong>46</strong><br />
Pollen diagram <strong>of</strong> the Late Pleistocene interstadial deposits from the Kola Peninsula, Russia<br />
RESULT AND DISCUSSION<br />
Fig. 2. Pollen percentage diagram <strong>of</strong> the Late Pleistocene deposits from the Svjatoy Nos Cape.<br />
sect. Albae and Ericales. Pollen zone 2 is marked<br />
by rapidly increasing values <strong>of</strong> Betula sect. Nanae,<br />
Cyperaceae and Artemisia sp.<br />
Pollen zone 1 refl ects birch-forest tundra vegetation,<br />
and pollen zone 2 marks tundra vegetation.<br />
The surface sediment sample from the Holocene<br />
soil (unit V) is typi<strong>fi</strong> ed by the dominance <strong>of</strong> Pinus<br />
sylvestris (48%) and Betula sect. Albae (28%). The<br />
conclusion is that low contents <strong>of</strong> Pinus sylvestris<br />
in pollen zones 1 and 2 (5-10%) indicate cooler<br />
climatic conditions in comparison with present day.<br />
The pollen record is thus interpreted to represent the<br />
Late Pleistocene interstadial event.<br />
The pollen assemblages <strong>of</strong> zone 1 and zone 2 are<br />
similar to the pollen records from the Middle Valdaian<br />
(Middle Weichselian) deposits from the southwestern<br />
part <strong>of</strong> the Murmansk region (Evserov et<br />
al. 1980) and from the Peräpohjola region, northern<br />
<strong>Finland</strong> (Korpela 1969).<br />
Radiocarbon data from the studied site obtained<br />
previously (<strong>46</strong>,540±1,770 14 C BP (Gudina & Evserov<br />
1973); 41,900±1,290 14 C BP, 43,160±1,330<br />
101
<strong>Geological</strong> <strong>Survey</strong> <strong>of</strong> <strong>Finland</strong>, <strong>Special</strong> <strong>Paper</strong> <strong>46</strong><br />
Alla Sharapova and Ljudmila Semenova<br />
14 C BP, 47,940±1,820 14 C BP (Arslanov et al.<br />
1981)) point to the Middle Valdaian (Middle Weichselian)<br />
age <strong>of</strong> marine deposits. But Th-230/U-234<br />
date – 97,000±4,000 BP (Arslanov et al. 1981) does<br />
Financial support for this project was provided by<br />
Russian <strong>Geological</strong> Research Institute (VSEGEI),<br />
grant 18 – Improvement <strong>of</strong> the Kola Legend-200<br />
Armand, A. 1969. Paudorf interstadial <strong>of</strong> the southwestern<br />
part <strong>of</strong> the Kola Peninsula. In: Grave, M. & Koshechkin, B.<br />
(eds.) Main problems <strong>of</strong> geomorphology and anthropogenic<br />
stratigraphy <strong>of</strong> the Kola Peninsula. Leningrad: Nauka,<br />
63–79. (in Russian)<br />
Armand, A., Armand, N., Grave, M., Evserov, V. & Lebedeva,<br />
R. 1969. Stratigraphical scheme <strong>of</strong> the Quaternary<br />
deposits <strong>of</strong> the Kola Peninsula (new aspect). In: Grave, M.<br />
& Koshechkin, B. (eds.) Main problems <strong>of</strong> geomorphology<br />
and anthropogenic stratigraphy <strong>of</strong> the Kola Peninsula. Leningrad:<br />
Nauka, 7–24. (in Russian)<br />
Arslanov, H., Evserov, V., Tertychny, N., Gerasimova, S. &<br />
Lokshin, N. 1981. On the age <strong>of</strong> deposits <strong>of</strong> Boreal transgression<br />
(Ponoi layers) in the Kola Peninsula. In: Velichko,<br />
A. & Faustova, M. (eds.) Pleistocene glaciations at the East<br />
European Plain. Moskva: Nauka, 28–37. (in Russian)<br />
Evserov, V., Kagan, L., Lebedeva, R. & Rajamjae, R. 1980.<br />
Valdaian deposits near the city Kovdor (south-western part<br />
<strong>of</strong> the Murmansk region). In: Afanasjev, A. (ed.) Geology<br />
and mineral deposits <strong>of</strong> Mesozoic and Kainozoic formation<br />
<strong>of</strong> the Kola Peninsula. Apatity, 112–125. (in Russian)<br />
Grychuk, V. 1940. A method <strong>of</strong> preparation <strong>of</strong> sedimentary<br />
rocks poor in organic remnants for the pollen analysis.<br />
Problems <strong>of</strong> Physical Geography 8, 53–56. (in Russian)<br />
102<br />
ACKNOWLEDGEMENTS<br />
REFERENCES<br />
not con<strong>fi</strong> rm this conclusion. Further investigation<br />
will clarify the chronostratigraphic position <strong>of</strong> these<br />
deposits.<br />
“Methodical guarantee <strong>of</strong> the regional geological<br />
and geophysical investigation”.<br />
Grimm, E. 1990. TILIA and TILIA-GRAF.PC spreadsheet and<br />
graphics s<strong>of</strong>tware for pollen data. INQUA. Working Group<br />
on Data-Handing Methods. Newsletter 4, 5–7.<br />
Gudina, V. & Evserov, U. 1973. Stratigraphy and foraminifera<br />
<strong>of</strong> the Late Pleistocene <strong>of</strong> the Kola Peninsula. Novosibirsk:<br />
Nauka. 150 p. (in Russian)<br />
Korpela, K. 1969. Die Weichsel-Eiszeit und ihr Interstadial in<br />
Peräpohjola (Nördliches Nord<strong>fi</strong> nnland) in Licht von submoränene<br />
Sedimenten. Annales Academiae Scientiarum<br />
Fennicae. Series A. III Geologica-geographica 99. 108 p.<br />
Koshechkin, B., Predovskiy, A. & Jakovlev, B. 1975. Geography<br />
<strong>of</strong> the Murmansk Region. Murmansk. 141 p. (in<br />
Russian)<br />
Nikonov, A. & Vostruhina, T. 1964. Anthropogenic stratigraphy<br />
<strong>of</strong> the north-eastern part <strong>of</strong> the Kola Peninsula. Doklady<br />
Akademii nauk USSR 158: 4, 104–107. (in Russian)<br />
Ramenskaya, M. 1983. Flora <strong>of</strong> the Murmansk Region and<br />
Karelia. Leningrad: Nauka. 215 p. (in Russian)<br />
Vascular Plants <strong>of</strong> Russia and Adjacent States (the former<br />
USSR). 1995. Cambridge University Press. 516 p.
Applied Quaternary research in the central part <strong>of</strong> glaciated terrain,<br />
edited by Peter Johansson and Pertti Sarala.<br />
<strong>Geological</strong> <strong>Survey</strong> <strong>of</strong> <strong>Finland</strong>, <strong>Special</strong> <strong>Paper</strong> <strong>46</strong>, 103–112, 2007.<br />
POLLEN AND IR-OSL EVIDENCE FOR PALAEOENVIRONMENTAL<br />
CHANGES BETWEEN CA 39 KYR TO CA 33 KYR BP RECORDED IN<br />
THE VOKA KEY SECTION, NE ESTONIA<br />
by<br />
Natalia S. Bolikhovskaya 1 and Anatoly N. Molodkov 2<br />
Bolikhovskaya, N. S. & Molodkov, A. N. 2007. Pollen and IR-<br />
OSL evidence for palaeoenvironmental changes between ca 39<br />
kyr to ca 33 kyr BP recorded in the Voka key section, NE Estonia.<br />
Applied Quaternary research in the central part <strong>of</strong> glaciated terrain.<br />
<strong>Geological</strong> <strong>Survey</strong> <strong>of</strong> <strong>Finland</strong>, <strong>Special</strong> <strong>Paper</strong> <strong>46</strong>, 103–112,<br />
4 <strong>fi</strong> gures.<br />
The sediment sequences <strong>of</strong> the Voka site situated on the southeastern<br />
coast <strong>of</strong> the Gulf <strong>of</strong> <strong>Finland</strong> were analysed to reconstruct<br />
the environmental evolution <strong>of</strong> northern Estonia over the last Ice<br />
Age. Our reconstruction is based on an optically-dated record<br />
<strong>of</strong> pollen-induced palaeoclimate (palaeoenvironmental) proxies.<br />
Plotted against depth, palynological analysis and luminescence<br />
datings <strong>of</strong> the samples produced a dated sequence ranging from<br />
ca 39 to ca 33 kyr BP, which reveal the speci<strong>fi</strong> c features <strong>of</strong> the<br />
palaeoenvironmental variations before the last glacial maximum<br />
(LGM). Representative pollen spectra from 45 samples provided<br />
convincing evidence <strong>of</strong> noticeable changes in vegetation and<br />
climate in northeastern Estonia. Two intervals <strong>of</strong> severe climate<br />
and two considerably milder ones were recognised. Matching <strong>of</strong><br />
the Voka chronoclimatic pattern to the Greenland ice core variations<br />
shows a good <strong>fi</strong> t with the palaeoclimatic signals recorded in<br />
Greenland ice cores between Greenland Interstadials 8 and 5.<br />
Key words (GeoRef Thesaurus, AGI): palaeoenvironment,<br />
palaeoclimatology, palaeobotany, sediments, pollen analysis,<br />
geochronology, optically stimulated luminescence, Pleistocene,<br />
Weichselian, Voka, Estonia.<br />
1 Department <strong>of</strong> Geography, Moscow State University,<br />
119899 Moscow, Russia<br />
2 Research Laboratory for Quaternary Geochronology, Institute<br />
<strong>of</strong> Geology, Tallinn University <strong>of</strong> Technology,<br />
Ehitajate Rd. 5, 19086 Tallinn, Estonia<br />
E-mail: nbolikh@geogr.msu.ru, molodkov@gi.ee<br />
103
<strong>Geological</strong> <strong>Survey</strong> <strong>of</strong> <strong>Finland</strong>, <strong>Special</strong> <strong>Paper</strong> <strong>46</strong><br />
Natalia S. Bolikhovskaya and Anatoly N. Molodkov<br />
The last Ice Age is generally assumed to have been<br />
characterised by pronounced climatic variations, recorded<br />
in many geological archives around the Baltic<br />
sphere (Mangerud 1981, Grichuk 1982, Lagerback<br />
& Robertsson 1988, Behre 1989, Mamakowa 1989,<br />
Liivrand 1991, Donner 1995, Kondratien 1996,<br />
Helmens et al. 2000, Kalnina 2001). However, the<br />
timing and reconstruction <strong>of</strong> palaeoenvironmental<br />
evolution on the basis <strong>of</strong> available fragments <strong>of</strong> geological<br />
record remains a problem in Quaternary geology.<br />
There are <strong>of</strong>ten gaps in the geological record,<br />
and the absolute age <strong>of</strong> its constituents is frequently<br />
unknown. Local stratigraphic schemes are <strong>of</strong>ten<br />
dif<strong>fi</strong> cult to correlate with interregional time divisions<br />
and with the global palaeoclimatic levels <strong>of</strong><br />
the ice-core and deep-sea oxygen isotope records.<br />
This especially holds true in the Baltic countries<br />
where the late Pleistocene glacial erosion over this<br />
area could have been very intensive and, therefore,<br />
palaeoenvironmental records here may consist <strong>of</strong> a<br />
number <strong>of</strong> hiatuses. As a result, even the number <strong>of</strong><br />
Järva (=Weichselian) glaciations or big stadials in<br />
Estonia, the northernmost <strong>of</strong> the three Baltic states,<br />
is not yet precisely known (Raukas 2003). In the<br />
Estonian Weichselian, two till beds (Valgjärv and<br />
Võrtsjärv subfor mations) are distinguished. The till<br />
beds correspond to two Järva glaciation cycles, each<br />
<strong>of</strong> which lasted some 50–55,000 years (Raukas et al.<br />
2004); however, this arouses doubts, see, for example,<br />
Kalm (2006). As well, it is not yet clear whether<br />
the oldest Valgjärv till belongs to the lower or middle<br />
Weichse lian (Raukas 2003). The till is widely<br />
104<br />
INTRODUCTION<br />
distributed in central and southern Estonia but is<br />
absent from the bedrock areas and other regions<br />
<strong>of</strong> intense glacial erosion in the northern and north<br />
western parts <strong>of</strong> the country (Raukas et al. 2004).<br />
For the corresponding early Weichselian glaciation,<br />
Kalm (2006) leaves only some 25 kyr (68–43 kyr<br />
BP). Therefore, it becomes understandable why different,<br />
<strong>of</strong>ten contradicting schemes <strong>of</strong> stratigraphic<br />
subdivision and palaeoenvironmental interpretations<br />
<strong>of</strong> past climates and sedimentary history <strong>of</strong> the<br />
region during the last Ice Age have been proposed<br />
in the last decades (Kajak et al. 1976, Raukas & Kajak<br />
1995, Gaigalas 1995, Satk0nas 1997).<br />
The survival <strong>of</strong> well-preserved, in situ pre-LGM<br />
deposits is very rare in northern Estonia. In this area,<br />
glacial erosion prevailed and the thickness <strong>of</strong> the<br />
Quaternary deposits is usually less than 5 m. Therefore,<br />
interdisciplinary study <strong>of</strong> those sections that<br />
do exist, such as Voka site, can potentially provide<br />
a unique opportunity to reconstruct the palaeoenvironmental<br />
history <strong>of</strong> the region in greater detail.<br />
The aim <strong>of</strong> this study was to identify the main<br />
palaeoenvironmental stages in northern Estonia using<br />
palaeoclimate proxies based on detailed palynological<br />
analysis <strong>of</strong> the deposits from the new late<br />
Pleistocene section at the Voka site, north eastern<br />
Estonia. A depth-age model in this study was constructed<br />
using regression analysis <strong>of</strong> the infrared<br />
optically stimulated luminescence (IR-OSL) dating<br />
results obtained on the samples collected from this<br />
section (Molodkov 2007).<br />
STUDY SITE AND RESEARCH METHODS<br />
The Voka site is located on the south eastern coast<br />
<strong>of</strong> the Gulf <strong>of</strong> <strong>Finland</strong> where the Estonian part <strong>of</strong> the<br />
Baltic Clint is interrupted by an about 2.2-km-wide<br />
depression – the Voka Clint Bay (Figs. 1A, B). The<br />
latter, in its turn, is intersected by a deep canyonlike<br />
palaeoincision. According to drilling data, most<br />
<strong>of</strong> the incision is <strong>fi</strong> lled with <strong>fi</strong> ne-grained sand and<br />
silt with a total thickness <strong>of</strong> at least 147 m. Layers<br />
<strong>of</strong> gravely sand, coarse- to medium-grained sand<br />
and clays also occur. The northernmost part <strong>of</strong> the<br />
valley deepens very abruptly, with the bottom gradient<br />
reaching 12 m per km and the slope gradient is<br />
more than 500 m per km (Molodkov et al. 2007).<br />
The deposits studied are exposed along the Gulf<br />
coast in the V3 outcrop (59°24.86´N, 27°35.88´E)<br />
situated about 500 m to the east from the mouth<br />
<strong>of</strong> the Voka (Vasavere) River (see Fig. 1B). Immediately<br />
on the shore, the height <strong>of</strong> the outcrop is<br />
about 22 m a.s.l. The sandy to clayey sedimentary<br />
sequence comprises at least two lithostratigraphic<br />
units – A and B (Fig. 2). Topwards unit A in the V3<br />
outcrop is overlain by about 1.1-m-thick brownishgrey<br />
to light-brown soil resting upon ca 0.7-m-thick<br />
layer <strong>of</strong> light-brown silt-like deposits showing signs
<strong>Geological</strong> <strong>Survey</strong> <strong>of</strong> <strong>Finland</strong>, <strong>Special</strong> <strong>Paper</strong> <strong>46</strong><br />
Pollen and IR-OSL evidence for palaeoenvironmental changes between ca 39 kyr to ca 33 kyr BP recorded in the Voka key<br />
section, NE Estonia<br />
Fig. 1. Location map <strong>of</strong> the study area (A) and the scheme <strong>of</strong> the Voka Clint Bay with locations <strong>of</strong> the outcrop V3 (B); 1– altitudes<br />
above sea level in metres; 2 – Clint Bay boundary; 3 – outcrop; 4 – 20 m contour line; 5 – coastline; 6 – clint.<br />
<strong>of</strong> soil formation, densely penetrated by roots and<br />
<strong>fi</strong> lled krotovina-like irregular tunnels made probably<br />
by burrowing animals. The boundary between units<br />
A and B is marked by a gravel bed. The thickness<br />
<strong>of</strong> unit A in the V3 section is about 10 m. unit A<br />
in this section is characterised by alternating laminated<br />
<strong>fi</strong> ne sand and clay with dispersed particles <strong>of</strong><br />
lower Ordovician Dictyonema argillite. Unit B is<br />
represented by coarse-grained cross-bedded sands.<br />
The maximum visible thickness <strong>of</strong> the unit (shown<br />
only partly in Fig. 2) is about 15 m.<br />
More than 90 samples were taken from unit A<br />
<strong>of</strong> the V3 section and from overlying soil deposits<br />
for detailed palynological analysis. In the present<br />
study, the palyno-climatostratigraphic method was<br />
applied to identify pollen zones in the record. The<br />
standard palynological technique, which includes<br />
treatment by 10% HCl, 10% KOH and acetolysis<br />
solution, was applied for extraction <strong>of</strong> pollen and<br />
spore grains from deposits (Grichuk & Zaklinskaya<br />
1948). Samples <strong>of</strong> sands at the depths between 1.8–<br />
5.0 m turned out to be poor in pollen and spores.<br />
Since the deposits were devoid <strong>of</strong> macroscopic<br />
organic remains, the infrared optically-stimulated<br />
luminescence (IR-OSL) technique was applied to<br />
produce an absolute chronology <strong>of</strong> the deposits.<br />
Fifteen samples from unit A <strong>of</strong> the sections were<br />
measured with IR-OSL and an age model was developed<br />
(Molodkov 2007) to provide a time scale<br />
for the unit and a temporal base for palaeoenvironmental<br />
reconstructions (all IR-OSL ages reported in<br />
this paper were obtained in the Research Laboratory<br />
for Quaternary Geochronology, Tallinn; the IR-OSL<br />
ages given here are in calendar years before present,<br />
BP; the dating results obtained for unit A from the<br />
Fig. 2. Stratigraphic column<br />
<strong>of</strong> unit A <strong>of</strong> the V3 section at<br />
the Voka site. The numbered<br />
circles show the location <strong>of</strong><br />
the IR-OSL sampling points.<br />
Shown to the right <strong>of</strong> the<br />
columns are the positions<br />
<strong>of</strong> pollen sampling points<br />
and the variations with<br />
depth <strong>of</strong> the Dictyonema<br />
argillite distribution in the<br />
deposits along the sections.<br />
Calendar time scale for<br />
unit A <strong>of</strong> the V3 section is<br />
indicated on the left (for<br />
detail see Molodkov 2007);<br />
1 – soil; 2 – silt; 3 – sand; 4<br />
– horizontally bedded sands;<br />
5 – crossbedded sands; 6<br />
– laminated clayey deposits;<br />
7 – marker bed; 8 – IR-OSL<br />
sampling points; 9 – interrupted<br />
(a) and varve-like (b)<br />
layers <strong>of</strong> Dictyonema-bearing<br />
sediments.<br />
105
<strong>Geological</strong> <strong>Survey</strong> <strong>of</strong> <strong>Finland</strong>, <strong>Special</strong> <strong>Paper</strong> <strong>46</strong><br />
Natalia S. Bolikhovskaya and Anatoly N. Molodkov<br />
exposure V3 are available in Molodkov (2007) on<br />
Quaternary Geochronology Online).<br />
Such an integrated approach based on two independent<br />
methods applied to one and the same source<br />
106<br />
<strong>of</strong> climate-stratigraphic information gives a unique<br />
opportunity to reveal speci<strong>fi</strong> c features <strong>of</strong> pre-LGM<br />
palaeoenvironmental variations.<br />
RESULTS OF PALAEOENVIRONMENTAL RECONSTRUCTIONS<br />
Plotted against depth, palynological analysis and<br />
luminescence datings <strong>of</strong> the samples taken from<br />
the section produced a dated sedimentary sequence<br />
within the whole unit A (between the depths <strong>of</strong><br />
12.15 m and 1.80 m) covering the period from ca<br />
39 to 31 kyr BP (Fig. 2). Deposits from the depths<br />
between 12.15 m and 5.00 m reveal speci<strong>fi</strong> c features<br />
<strong>of</strong> pre-LGM palaeoenvironmental variations during<br />
the time span <strong>of</strong> ca 6 kyr.<br />
The deposits overlying unit A are most likely<br />
post-LGM in age as indicated by an IR-OSL date <strong>of</strong><br />
8.1 ± 0.8 kyr for the sample taken from these deposits<br />
at a depth <strong>of</strong> 1.60 m (Molodkov 2007). According<br />
to several preliminary age determinations (ibid),<br />
Fig. 3. Pollen and spore percentage diagram from unit A <strong>of</strong> the V3 section (5.00–12.15 m).<br />
the dated deposits <strong>of</strong> unit B span the period from at<br />
least 115 kyr to at least 70 kyr. The presence <strong>of</strong> older<br />
deposits (>115 kyr) is expected in the lower part <strong>of</strong><br />
the sections currently unavailable due to the thick<br />
talus at the base <strong>of</strong> the outcrops. Representative pollen<br />
spectra derived from 45 samples taken at depths<br />
between 12.15 m and 5.00 m provide convincing<br />
evidence <strong>of</strong> noticeable changes in vegetation and<br />
climate in northern Estonia during the period from<br />
ca 39 to 33 kyr BP.<br />
The results <strong>of</strong> palynological analysis <strong>of</strong> the<br />
studied sediments are presented on the spore-pollen<br />
diagram (Fig. 3). Most <strong>of</strong> the taxa <strong>of</strong> the studied<br />
palyn<strong>of</strong>l ora are grouped by genera and families to
<strong>Geological</strong> <strong>Survey</strong> <strong>of</strong> <strong>Finland</strong>, <strong>Special</strong> <strong>Paper</strong> <strong>46</strong><br />
Pollen and IR-OSL evidence for palaeoenvironmental changes between ca 39 kyr to ca 33 kyr BP recorded in the Voka key<br />
section, NE Estonia<br />
make the diagram more compact. The palynological<br />
data obtained testify that the period <strong>of</strong> accumulation<br />
<strong>of</strong> the middle Weichselian (=middle Valdai, middle<br />
Järva) sediments under consideration corresponds<br />
to four climatostratigraphic subdivisions – two intervals<br />
<strong>of</strong> severe climate and two interstadials with<br />
remarkably milder climatic conditions.<br />
The pollen data from the middle Weichselian<br />
deposits are rather scarce in Estonia. Pollen assemblages<br />
recovered from the periglacial middle<br />
Weichselian deposits in Tõravere, Valguta, Savala<br />
and other sections were interpreted by E. Liivrand<br />
(1991, 1999) as evidence <strong>of</strong> cold stadial environments<br />
with widely spread tundra and xerophytic<br />
communities (with dominance <strong>of</strong> dwarf birch Betula<br />
nana, wormwood Artemisia, wormseed Chenopodiaceae,<br />
Poaceae/Gramineae and Cyperaceae). No<br />
middle Weichselian interstadial warmings have been<br />
identi<strong>fi</strong> ed up to now. In this connection, we shall<br />
consider in more detail the climatostratigraphic subdivision<br />
<strong>of</strong> the investigated deposits as well as the<br />
changes that took place in vegetation and climate<br />
during the period <strong>of</strong> sedimentation.<br />
The 1st Voka interstadial (VIS-1A, 38.6 – 37.6<br />
kyr BP)<br />
The <strong>fi</strong> rst period <strong>of</strong> relative warming (38.6–37.6 kyr<br />
BP) is revealed by pollen assemblages between<br />
11.20–12.20 m (Fig. 3). At the Voka site, this interstadial<br />
was marked by the dominance <strong>of</strong> mainly<br />
periglacial forest-tundra, locally with open forest<br />
patches <strong>of</strong> spruce (Picea sect. Picea) and common<br />
pine (Pinus sylvestris), with a mixture <strong>of</strong> larch Larix<br />
and Siberian cedar pine Pinus sibirica.<br />
Five pollen zones (1a–1e) corresponding to <strong>fi</strong> ve<br />
phases <strong>of</strong> vegetation and climate evolution refl ect<br />
dynamics <strong>of</strong> palaeoenvironmental changes during<br />
this interval. Periglacial forest-tundra comprising<br />
patches <strong>of</strong> pine forests (with an admixture <strong>of</strong> Larix<br />
sp.) prevailed during the <strong>fi</strong> rst phase (pollen zone 1a;<br />
12.0–12.2 m). Later, in the second phase (pollen<br />
zone 1b; 11.9–12.0 m), the climate became colder<br />
and dryer. This resulted in an increased abundance<br />
<strong>of</strong> cryophytes and xerophytes in the vegetation –<br />
Betula sect. Nanae, Alnaster fruticosus, Selaginella<br />
selaginoides, Artemisia (including Artemisia subgenus<br />
Seriphidium), Chenopodiaceae, etc. Patches<br />
<strong>of</strong> larch open forests occasionally occurred. Open<br />
tundra-steppe landscapes dominated.<br />
The most signi<strong>fi</strong> cant warming within this interstadial<br />
and expansion <strong>of</strong> coniferous trees over the<br />
study area took place during the third phase (pollen<br />
zone 1c; 11.7–11.9 m). Pinus sylvestris accounted<br />
for more than 90% in the relevant palynospectra.<br />
Pine forests and open forests <strong>of</strong> common pine (Pinus<br />
sylvestris) dominated. The fourth phase (pollen<br />
zone 1d; 11.6–11.7 m) is characterised by the dominance<br />
<strong>of</strong> periglacial forest-tundra with spruce-pine<br />
forests, in combination with yernik (formed by the<br />
Betula nana and Alnaster fruticosus), and Chenopodiaceae-Artemisia<br />
communities.<br />
During the <strong>fi</strong> fth phase (pollen zone 1e; 11.2–11.6<br />
m), the studied area was occupied by periglacial<br />
forest-tundra with Siberian cedar pine-spruce-common<br />
pine forests with a mixture <strong>of</strong> larch, along with<br />
steppe and shrubby (Betula nana and Salix sp., Alnaster<br />
fruticosus) communities. The steppe biotopes<br />
were prevailed (Poaceae, Asteraceae, Primulaceae,<br />
Onagraceae, Primulaceae, Polygonaceae, Rumex<br />
sp., Urtica sp., Plantago media, Ranunculus sp.,<br />
etc.) and wormwood (Artemisia subgenus Euartemisia,<br />
A. subgenus Seriphidium) associations.<br />
The 1st Voka stadial (VS-1A, 37.6 – 36.8 kyr<br />
BP)<br />
The <strong>fi</strong> rst period <strong>of</strong> warming (VIS-1A) was followed<br />
by a relatively short interval <strong>of</strong> a colder and dryer<br />
climate, which lasted some 800 years (37.6–36.8<br />
kyr BP; 10.4–11.2 m). According to palynological<br />
data (see Fig. 3), the prevailing landscapes were<br />
tundra-steppe and tundra-forest-steppes.<br />
The herb-dwarf shrub pollen (mainly Artemisia,<br />
Chenopodiaceae, Poaceae, Cyperaceae) and<br />
spores (Bryales, Sphagnum) predominate in all pollen<br />
assemblages (NAP – 41 to 70%; Spores – 6 to<br />
20%). Besides, the pollen spectra are characterized<br />
by high percentages <strong>of</strong> cryophytes and xerophytes,<br />
such as Betula nana, Alnaster fruticosus, Artemisia<br />
(including A. subgen. Seriphidium, A. subgen. Dracunculus),<br />
Chenopodiaceae, Ephedra, Lycopodium<br />
dubium, Diphazium alpinum, Selaginella selaginoides.<br />
Pollen zones 2a, 2b and 2c correspond to three<br />
phases <strong>of</strong> environmental evolution and reveal<br />
transformations <strong>of</strong> vegetation during this stadial<br />
episode.<br />
In the <strong>fi</strong> rst phase (pollen zone 2a; 11.1–11.2 m)<br />
open tundra-steppe environments predominated.<br />
In the second phase (pollen zone 2b; 10.5–11.1<br />
m) humidity increased, and the tundra-forest-steppes<br />
with patches <strong>of</strong> Siberian cedar pine-spruce-common<br />
pine light forests became dominant.<br />
In the third phase (pollen zone 2c; 10.4–10.5<br />
m), the climate turned drier and tundra-steppes prevailed<br />
again.<br />
During the <strong>fi</strong> rst and third phases, tundra-steppe<br />
vegetation was most widespread in the surroundings<br />
<strong>of</strong> Voka. The distinctive features <strong>of</strong> the<br />
107
<strong>Geological</strong> <strong>Survey</strong> <strong>of</strong> <strong>Finland</strong>, <strong>Special</strong> <strong>Paper</strong> <strong>46</strong><br />
Natalia S. Bolikhovskaya and Anatoly N. Molodkov<br />
long-term second phase were the more humid climate,<br />
expansion <strong>of</strong> patches <strong>of</strong> coniferous (Siberian<br />
cedar pine–spruce–common pine) light forests and<br />
predominance <strong>of</strong> tundra-forest-steppes.<br />
The 2nd Voka interstadial (VIS-2A; 36.8 – 35.3<br />
kyr BP)<br />
The next interstadial (36.8–35.3 kyr BP; 8.75–10.40<br />
m), much warmer than the previous one, was characterised<br />
by a new expansion <strong>of</strong> boreal forest species<br />
onto the area under study. Six climatic-phytocoenotic<br />
phases were reconstructed, refl ecting changes in<br />
the plant communities during this interval. These<br />
successions show that at least twice – during wetter<br />
and warmer climatic phases – periglacial foresttundra<br />
(locally with open spruce and pine forests)<br />
was replaced by more humid landscapes with<br />
prevailing northern taiga communities.<br />
During the <strong>fi</strong> rst phase, the Siberian cedar pine–<br />
spruce–common pine (Pinus sylvestris) forests and<br />
parkland forests dominated, corresponding to pollen<br />
zone 3a (10.1–10.4 m). In the evolution <strong>of</strong> vegetation,<br />
this was the warmest interval <strong>of</strong> the whole<br />
interstadial. In the dendr<strong>of</strong>l ora, the total boreal pollen<br />
accounted for about 70–90%. The second phase<br />
(pollen zone 3b; 9.65–10.1 m) was prevailed by periglacial<br />
forest-tundra with patches <strong>of</strong> Siberian cedar<br />
pine–pine open forests. In approximately the middle<br />
<strong>of</strong> this interstadial – in the third phase (pollen zone<br />
3c; 9.55–9.65 m) – a short interval with a signi<strong>fi</strong> -<br />
cantly colder climate and domination <strong>of</strong> periglacial<br />
tundra is recorded.<br />
During the forth phase (pollen zone 3d; 9.15–<br />
9.55 m) periglacial forest-tundras with patches <strong>of</strong><br />
pine-spruce and Siberian pine-spruce-pine light<br />
forests dominated.<br />
Periglacial light forests <strong>of</strong> Siberian cedar pine<br />
(Pinus sibirica), spruce (Picea sect. Picea) and common<br />
pine (Pinus sylvestris) prevailed in the Voka<br />
area during the <strong>fi</strong> fth phase characterized by pollen<br />
zone 3e (8.85–9.15 m), refl ecting a new warming<br />
within VIS-2A. During the latest sixth phase (pollen<br />
zone 3f; 8.75–8.85 m), periglacial forest-tundras<br />
with small patches <strong>of</strong> spruce–pine open woodlands<br />
predominated in the studied area.<br />
The 2nd Voka stadial (VS-2A; 35.3 – 32.6 kyr<br />
BP)<br />
During the last interval (VS-2A; 35.3–32.6 kyr BP),<br />
periglacial tundra remained the dominant landscape<br />
in the region. The considerably colder climate and<br />
expansion <strong>of</strong> permafrost resulted in the appearance<br />
<strong>of</strong> wetlands <strong>of</strong> moss and grass types. The pollen<br />
assemblages were dominated by Betula nana,<br />
108<br />
Poaceae and Cyperaceae, together with the spores<br />
<strong>of</strong> Sphagnum, Bryales, Selaginella selaginoides,<br />
Lycopodium dubium, Diphazium alpinum and other<br />
typical tundra species. This suggests that the interval<br />
was close to the <strong>fi</strong> nal part <strong>of</strong> the middle Weichselian<br />
preceding the late Weichselian ice sheet expansion<br />
into the region.<br />
Pollen-and-spore spectra recovered from the<br />
deposits at the depths between 8.75 and 4.95 m allowed<br />
for reconstruction below the presented seven<br />
successive phases in the evolution <strong>of</strong> vegetation and<br />
climate during this second cold episode.<br />
In the <strong>fi</strong> rst phase (pollen zone 4a; 8.45–8.75 m),<br />
periglacial tundra dominated with a prevalence <strong>of</strong><br />
yernik bushes (from dwar<strong>fi</strong> sh birch Betula nana)<br />
and shrubby communities (from juniper Juniperus<br />
sp., willow Salix sp., Alnaster fruticosus, etc.) and<br />
grass-moss bogs.<br />
In the second phase (pollen zone 4b; 8.05–8.45<br />
m), a distinctive feature <strong>of</strong> vegetation was the almost<br />
ubiquitous expansion <strong>of</strong> periglacial tundra with the<br />
domination <strong>of</strong> moss bogs and the presence <strong>of</strong> small<br />
patches <strong>of</strong> tundra shrubs.<br />
Sands in the depth interval 7.55–8.05 m contained<br />
only single pollen grains.<br />
In the third phase (pollen zone 4c; 7.45–7.55 m),<br />
periglacial forest-tundra with small patches <strong>of</strong> pine<br />
light forests (<strong>of</strong> Pinus sylvestris) occupied the Voka<br />
area under warmer climate conditions.<br />
In the fourth phase (pollen zone 4d; 6.95–7.45<br />
m), the forested areas were considerably reduced<br />
due to the cooling <strong>of</strong> the climate. The role <strong>of</strong> microthermic<br />
tundra plants (Betula nana, Alnaster fruticosus,<br />
Selaginella selaginoides, Lycopodium dubium,<br />
L.appressum, Diphazium alpinum, etc.) increased.<br />
Periglacial tundras dominated. Pinus sylvestris and<br />
Larix sp. were edi<strong>fi</strong> cators in forest stands <strong>of</strong> rare<br />
forest-tundra communities.<br />
A new short warming led to reduction <strong>of</strong> tundra<br />
shrubby coenoses in the <strong>fi</strong> fth phase (pollen zone 4e;<br />
6.70–6.95 m). The signi<strong>fi</strong> cance <strong>of</strong> periglacial forest-tundras<br />
and boreal tree species (Pinus sylvestris,<br />
Larix, etc.) increased.<br />
In the sixth phase (pollen zone 4f; 6.25–6.70 m),<br />
the incipient climate cooling triggered a new expansion<br />
<strong>of</strong> grassy cryophytes (Selaginella selaginoides,<br />
Diphazium alpinum, Lycopodium dubium, L. appressum,<br />
etc.) and domination <strong>of</strong> periglacial tundras.<br />
In the <strong>fi</strong> nal seventh phase <strong>of</strong> this stadial (pollen<br />
zone 4g; 4.95–6.25 m), periglacial tundra predominated<br />
in the Voka area with a prevalence <strong>of</strong> yernik<br />
bushes (from dwarf birch Betula nana) and grassmoss<br />
bogs.
<strong>Geological</strong> <strong>Survey</strong> <strong>of</strong> <strong>Finland</strong>, <strong>Special</strong> <strong>Paper</strong> <strong>46</strong><br />
Pollen and IR-OSL evidence for palaeoenvironmental changes between ca 39 kyr to ca 33 kyr BP recorded in the Voka key<br />
section, NE Estonia<br />
Fig. 4. Matching Voka chronoclimatic pattern (this work) to the Greenland ice-core variations (Shackleton et al. 2004). The best<br />
<strong>fi</strong> t lies between Greenland Interstadial 8 (GIS8) and GIS5.<br />
Thus, two minor warmings are recognised<br />
within the second cold event (VS-2A) at depths <strong>of</strong><br />
about 7.50 m and 6.70–6.95 m corresponding to the<br />
ages <strong>of</strong> 34.2 kyr and between 33.7 and 33.8 kyr BP,<br />
respectively. During these short-term warmings,<br />
The reconstructed paleoenvironmental changes give<br />
evidence for speci<strong>fi</strong> c individual features <strong>of</strong> the mid-<br />
Weichselian palaeoclimatic stages.<br />
The obtained pollen data show that the share <strong>of</strong><br />
dark coniferous trees – spruce and Siberian cedar<br />
pine – was considerable in the forest communities<br />
during the interstadial between ca 38.6 – 37.6 kyr<br />
BP, whereas during the younger interstadial ca 36.8<br />
– 35.3 kyr BP spruce (Picea sect. Picea) and Pinus<br />
sibirica were far less abundant. Forest biotopes <strong>of</strong><br />
this warmer interstadial were rather dominated by<br />
larch (Larix sp.).<br />
Palaeoenvironments <strong>of</strong> each cold interval also<br />
had their own characteristic features. This primarily<br />
concerns the dominant zonal types <strong>of</strong> vegetation.<br />
Climatic conditions <strong>of</strong> the oldest interval were more<br />
arid, and the study territory was covered by tundrasteppe<br />
and tundra-forest-steppe. The open grasslow<br />
bush biotopes were dominated by Chenopodiaceae-Artemisia<br />
associations. During a long cold<br />
DISCUSSION<br />
the dominating periglacial tundras were replaced<br />
by periglacial forest-tundras with small patches <strong>of</strong><br />
light forests, in which Pinus sylvestris served as an<br />
edi<strong>fi</strong> cator.<br />
epoch that lasted for about 2500 years from ca 35.3<br />
kyr BP till at least 32.6 kyr BP, the Voka area was<br />
characterized by periglacial tundra with grasses and<br />
sedges dominating the open landscapes. Also, such<br />
arctic alpine and hypoarctic tundra grass species<br />
as Selaginella selaginoides, Diphazium alpinum,<br />
Lycopodium dubium, L. appressum, Botrychium<br />
boreale were abundant.<br />
The data on the duration <strong>of</strong> the reconstructed<br />
interstadials and stadials during the Weichselian<br />
glacial epoch are <strong>of</strong> critical importance for detailed<br />
chrono- and climatostratigraphy. Based on the obtained<br />
IR-OSL data, the duration <strong>of</strong> the established<br />
interstadials is estimated at approximately 1000 and<br />
1500 years. Due to the incompleteness <strong>of</strong> the geological<br />
record <strong>of</strong> the most ancient <strong>of</strong> the interstadials,<br />
caused by a relatively long break in sedimentation,<br />
its duration was not less than 1500 years. The<br />
duration <strong>of</strong> the reconstructed mid-Weichselian cold<br />
stadials is even more different. The <strong>fi</strong> rst cooling<br />
109
<strong>Geological</strong> <strong>Survey</strong> <strong>of</strong> <strong>Finland</strong>, <strong>Special</strong> <strong>Paper</strong> <strong>46</strong><br />
Natalia S. Bolikhovskaya and Anatoly N. Molodkov<br />
lasted for about 800 years (ca 37.6 – 36.8 kyr BP),<br />
but the next one was at least 2700 years long (ca<br />
35.3 – 32.6 kyr BP). These data together with the<br />
obtained fl oristic, phytocoenotic, and climatostratigraphic<br />
characteristics <strong>of</strong> the investigated interstadials<br />
and stadials should be considered when identifying<br />
and correlating palaeogeographical events <strong>of</strong><br />
the Weichselian (Valdai, Järva) glacial epoch. Our<br />
data unambiguously demonstrate that the studied<br />
sediment sequence in the Voka section is by no<br />
means a late glacial formation. This is substantiated<br />
by comparison <strong>of</strong> the climatophytocoenotic features<br />
and chronological extent <strong>of</strong> the studied intervals<br />
with analogous data on the late glacial events in<br />
Estonia and adjacent regions.<br />
Firstly, the late glacial warm and cold intervals<br />
had a shorter duration than the stratigraphical units<br />
investigated in the Voka section. Secondly, the Voka<br />
interstadials strongly differ from the Allerød, which<br />
is well represented in the Baltic countries, also in<br />
the dominant type <strong>of</strong> palaeovegetation. Forests <strong>of</strong><br />
the reconstructed warm epochs were lacking birch<br />
stands and were dominated by coniferous communities.<br />
In southern and northern Estonia, birch was<br />
predominate among arboreal species during the <strong>fi</strong> rst<br />
half <strong>of</strong> the Allerød, and only during its second half<br />
was replaced by pine (Pinus sylvestris) (Pirrus 1969,<br />
Pirrus & Raukas 1996, Kabailien & Raukas 1987).<br />
During the Allerød, forests composed <strong>of</strong> Betula<br />
sect. Albae and alder (Alnus sp.) were widespread<br />
to the east from Estonia, in the vicinity <strong>of</strong> the Lake<br />
It was established in the present study that optical<br />
ages and palynological features derived from unit A<br />
<strong>of</strong> the V3 section mark the time <strong>of</strong> the existence <strong>of</strong><br />
relatively complex and changeable environmental<br />
conditions during the middle Weichselian pleniglacial.<br />
Representative palynological data obtained at<br />
the Voka site have provided convincing evidence <strong>of</strong><br />
the occurrence <strong>of</strong> two severe and two considerably<br />
milder climate intervals in the time span ca 39–33<br />
kyr.<br />
The <strong>fi</strong> rst interstadial at the Voka site (38.6–37.6<br />
kyr) was marked by the dominance <strong>of</strong> mainly<br />
periglacial forest-tundra, locally with open forest<br />
patches <strong>of</strong> spruce and common pine with a mixture<br />
<strong>of</strong> larch and Siberian cedar pine. During the follow-<br />
110<br />
CONCLUSIONS<br />
Il’men’ (Razina & Savel’eva 2001). Further north,<br />
in the southern Karelia, the birch Betula sect. Albae,<br />
including Betula pubescens, was also a dominant<br />
species (Elina et al. 1995, Wohlfarth et al. 2002).<br />
Matching our Voka chronoclimatic pattern to the<br />
Greenland ice-core variations shows that there is<br />
only one good <strong>fi</strong> t with the palaeoclimatic signals recorded<br />
in Greenland ice cores, which exists between<br />
Greenland Interstadial 8 (GIS8) and GIS5 (Fig. 4).<br />
The <strong>fi</strong> rst Voka interstadial VIS-1A identi<strong>fi</strong> ed within<br />
unit A corresponds to GIS8. The second Voka warm<br />
event VIS-2A is clearly comparable with GIS7. It<br />
is highly probable that two warm spells identi<strong>fi</strong> ed<br />
in the Voka section during the second Voka stadial<br />
VS-2A can be correlated with GIS6 and GIS5. As<br />
well, this Voka stadial VS-2A can be correlated with<br />
Greenland Stadial 6 (GS6), GS5 and with the initial<br />
part <strong>of</strong> GS4.<br />
As in the Greenland ice core record, the second<br />
interstadial in the Voka section is warmer than the<br />
previous one. It also seems that the initial part <strong>of</strong> the<br />
interstadial correlative to GIS8 is absent in the Voka<br />
section because the corresponding part <strong>of</strong> the sediments<br />
is interrupted by a gravel bed at the bottom<br />
<strong>of</strong> unit A. As well, like in the ice core, the second<br />
Voka stadial VS-2A is also somewhat colder than<br />
the previous one. Thus, it seems that there are quite<br />
a few coincidences between features in the ice core<br />
and the Voka records. In view <strong>of</strong> this, there is a possibility<br />
that these coincidences are not accidental.<br />
ing relatively short (37.6–36.8 kyr) interval with<br />
a colder and dryer climate, landscapes <strong>of</strong> tundrasteppe<br />
and tundra-forest-steppes prevailed. The next<br />
interstadial (36.8–35.3 kyr), much warmer than the<br />
previous one, was characterised by a new expansion<br />
<strong>of</strong> boreal forest species into the study area. The last<br />
interval (35.3–32.6 kyr) was characterised by landscapes<br />
where a periglacial tundra type <strong>of</strong> vegetation<br />
dominated. The considerably colder climate at that<br />
time and expansion <strong>of</strong> permafrost resulted in the appearance<br />
<strong>of</strong> wetlands <strong>of</strong> moss and grass types. This<br />
suggests that this interval was close to the <strong>fi</strong> nal part<br />
<strong>of</strong> the middle Weichselian preceding the late Weichselian<br />
ice sheet expansion into the region.<br />
The Voka outcrops studied do not display the<br />
assumed late-glacial deposits. Instead, it was estab-
<strong>Geological</strong> <strong>Survey</strong> <strong>of</strong> <strong>Finland</strong>, <strong>Special</strong> <strong>Paper</strong> <strong>46</strong><br />
Pollen and IR-OSL evidence for palaeoenvironmental changes between ca 39 kyr to ca 33 kyr BP recorded in the Voka key<br />
section, NE Estonia<br />
lished that the deposits exposed in the Voka outcrops<br />
demonstrate a general similarity between the Voka<br />
and Greenland ice-core records. Matching the Voka<br />
chronoclimatic pattern to the Greenland ice-core<br />
We are grateful to A. Miidel, A. Nikonov and K.<br />
Ploom for valuable discussions. We also thank T.<br />
Balakhnichova, T. Metslang, V. Nikonov and T.<br />
Tubli for their helpful support during <strong>fi</strong> eldworks, T.<br />
Balakhnichova and M. Osipova for their contribution<br />
to the laboratory work, and H. Kukk for revision<br />
<strong>of</strong> the English text. <strong>Special</strong> thanks go to the referees<br />
Behre, K.-E. 1989. Biostratigraphy <strong>of</strong> the last glacial period in<br />
Europe. Quaternary Science Reviews 8, 25–44.<br />
Donner, J. 1995. The Quaternary history <strong>of</strong> Scandinavia. Cambridge:<br />
Cambridge University Press. 200 p.<br />
Elina, G. A., Filimonova, L. V. & Klimanov. V. A. 1995. Late<br />
glacial and Holocene paleogeography <strong>of</strong> East Fennoscandia.<br />
In: Velichko, A. A. (ed.) Climate and environment<br />
changes <strong>of</strong> East Europe during Holocene and Late-Middle<br />
Pleistocene. Materials <strong>of</strong> IGU conference: Global changes<br />
and geography, Moscow, August 14–18, 1995. Moscow:<br />
Institute <strong>of</strong> Geography <strong>of</strong> Russian Academy <strong>of</strong> Sciences,<br />
20–27.<br />
Gaigalas, A. 1995. Glacial history <strong>of</strong> Lithuania. In: Ehlers,<br />
J., Kozarski, S. & Gibbard, Ph. (eds.) Glacial deposits in<br />
North-East Europe. Rotterdam: Balkema, 127–135.<br />
Grichuk, V. P. 1982. Rastitel’nost’ Evropy v pozdnem plejstotsene<br />
(Vegetation <strong>of</strong> Europe During Late Pleistocene). In:<br />
Gerasimov, V. P. & Velichko, A. A. (eds.) Palaeogeography<br />
<strong>of</strong> Europe during the last 100,000 years (Atlas-monograph).<br />
Moscow: Nauka, 92–109. (in Russian)<br />
Grichuk, V. P. & Zaklinskaya, E. D. 1948. Analiz iskopaemykh<br />
pyltsy i spor i ego primenenie v paleogeogra<strong>fi</strong> i (Pollen-and-spores<br />
analysis and its application in palaeogeoraphy).<br />
Moscow: Moscow Lomonosov State University,<br />
Geography Press. 223 p. (in Russian)<br />
Helmens, K. F, Räsänen, M. E, Johansson, P. W, Jungner,<br />
H. & Korjonen, K. 2000. The Last Interglacial-Glacial cycle<br />
in NE Fennoscandia: a nearly continuous record from<br />
Sokli (Finnish Lapland). Quaternary Science Reviews 19,<br />
1605–1623.<br />
Kabailien, M. & Raukas, A. 1987. Stratigraphy <strong>of</strong> lake and<br />
bog deposits and climatic changes in the late-glacial and<br />
Holocene in the Soviet Baltic Republics: review. Boreas 16,<br />
125–131.<br />
ACKNOWLEDGEMENTS<br />
REFERENCES<br />
variations shows a good <strong>fi</strong> t with the palaeoclimatic<br />
signals recorded in Greenland ice cores between<br />
Greenland Interstadials 8 and 5.<br />
Dr. Antti E.K. Ojala and Dr. Heikki Hirvas for their<br />
valuable comments on the paper. This research was<br />
supported through grants nos. 5440 and 6112 from<br />
the Estonian Science Foundation and by Estonian<br />
State Target Funding Projects nos. 0331759s01 and<br />
0332089s02.<br />
Kajak, K., Kessel, H., Liivrand, E., Pirrus, R., Raukas, A.<br />
& Sarv, A. 1976. Mestnaya rabochaya stratigra<strong>fi</strong> cheskaya<br />
skhema chetvertichnykh otlozhenij Estonii (Local Estonian<br />
version <strong>of</strong> the stratigraphical scheme <strong>of</strong> Quaternary deposits).<br />
Vilnius: Stratigra<strong>fi</strong> ya chetvertichnykh otlozhenij Pribaltiki,<br />
4–52. (in Russian)<br />
Kalm, V. 2006. Pleistocene chronostratigraphy in Estonia,<br />
southeastern sector <strong>of</strong> the Scandinavian glaciation. Quaternary<br />
Science Reviews 8, 960–975.<br />
Kalnina, L. 2001. Middle and Late Pleistocene environmental<br />
changes recorded in the Latvian part <strong>of</strong> the Baltic Sea basin.<br />
Stockholm: Stockholm University, Department <strong>of</strong> Physical<br />
Geography and Quaternary Geology. 173 p. (Ph.D Thesis)<br />
Kondratien, O. 1996. Quaternary stratigraphy and paleogeography<br />
<strong>of</strong> Lithuania based on palaeobotanical studies. Vilnius:<br />
Academia. 213 p. (in Russian with English summary)<br />
Lagerback, R. & Robertsson, A.-M. 1988. Kettle holes<br />
– stratigraphical archives for Weichselian geology and<br />
palaeoenvironment in northermost Sweden. Boreas 17,<br />
439–<strong>46</strong>8.<br />
Liivrand, E. 1991. Biostratigraphy <strong>of</strong> the Pleistocene deposits<br />
in Estonia and correlations in the Baltic region. Stockholm:<br />
Stockholm University, Department <strong>of</strong> Quaternary Research.<br />
114 p. (Ph.D Thesis)<br />
Liivrand, E. 1999. Palynological investigations <strong>of</strong> the early<br />
and middleValdaian periglacial deposits in Estonia. In: Bolikhovskaya,<br />
N. S. & Rovnina, L. V. (eds.) Urgent problems<br />
<strong>of</strong> palynology on the boundary <strong>of</strong> the third millennium. Abstracts<br />
<strong>of</strong> IX Palynological Conference, Moscow, September<br />
13–17, 1999. Moscow: IGiRGI, 162–163. (in Russian)<br />
Mamakowa, K. 1989. Late Middle Polish Glaciation Eemian<br />
and Early Vistulian vegetation at Imbramowice near<br />
Wroc¬aw and the pollen stratigraphy <strong>of</strong> this part <strong>of</strong> the<br />
Pleistocene in Poland. Acta Palaeobotanica 29 (1), 11–176.<br />
111
<strong>Geological</strong> <strong>Survey</strong> <strong>of</strong> <strong>Finland</strong>, <strong>Special</strong> <strong>Paper</strong> <strong>46</strong><br />
Natalia S. Bolikhovskaya and Anatoly N. Molodkov<br />
Mangerud, J. 1981. The Early and Middle Weichselian in Norway:<br />
a review. Boreas 10, 381–393.<br />
Molodkov, A. 2007. IR-OSL dating <strong>of</strong> uranium-rich deposits<br />
from the new late Pleistocene section at the Voka site,<br />
North-Eastern Estonia. Quaternary Geochronology 2, 208-<br />
215.<br />
Molodkov, A., Bolikhovskaya, N., Miidel, A. & Ploom, K.<br />
2007. The sedimentary sequence recovered from the Voka<br />
outcrops, North-Eastern Estonia: Implications for late Pleistocene<br />
stratigraphy. Estonian Journal <strong>of</strong> Earth Sciences 56<br />
(1), 47–62.<br />
Pirrus, R. 1969. Stratigra<strong>fi</strong> cheskoe raschlenenie pozdnelednikovykh<br />
otlozhenij yuzhnoj Éstonii po dannym sporovopyl’tcevogo<br />
analiza (Stratigraphic division <strong>of</strong> South Estonian<br />
late glacial deposits by means <strong>of</strong> pollen analysis).<br />
Proceedings <strong>of</strong> the Estonian Academy <strong>of</strong> Sciences. Chemistry,<br />
Geology 18, 181–190. (in Russian)<br />
Pirrus, R. & Raukas, A. 1996. Late-glacial stratigraphy in Estonia.<br />
Proceedings <strong>of</strong> the Estonian Academy <strong>of</strong> Sciences.<br />
Geology 45, 34–45.<br />
Raukas, A. 2003. Progress in Estonian Quarternary stratigraphy<br />
during the last decade. Geologija 41, 36–43.<br />
Raukas, A. & Kajak, K. 1995. Quaternary stratigraphy in Estonia.<br />
Proceedings <strong>of</strong> the Estonian Academy <strong>of</strong> Sciences.<br />
Geology 44, 149–162.<br />
112<br />
Raukas, A., Kalm, V., Karukäpp, R. & Rattas, M. 2004.<br />
Pleistocene glaciations in Estonia. In: Ehlers, J. & Gibbard,<br />
P. L. (eds) Quaternary Glaciations – Extent and Chronology,<br />
Part I: Europe. Amsterdam: Elsevier, 83–91.<br />
Razina, V. & Savel’eva, L. 2001. Palynological results <strong>of</strong> the<br />
late glacial and Holocene sediments <strong>of</strong> Lake Il’men. In:<br />
Climate and environment during the last deglaciation and<br />
Holocene in NW Russia and around the Baltic. International<br />
Workshop, March 28–April 2, 2001, St. Petersburg–Znamenka.<br />
Abstract volume, 36.<br />
Satk0nas, J. 1997. Outline <strong>of</strong> Quaternary stratigraphy <strong>of</strong><br />
Lithuania. INQUA-SEQS Symp. In: Satk0nas, J. (ed.) The<br />
Late Pleistocene in eastern Europe: stratigraphy, palaeoenvironment<br />
and climate. Abstract volume and excursion<br />
guide <strong>of</strong> the INQUA-SEQS Symposium, September 14–19,<br />
1997, Lithuania, 65–68.<br />
Shackleton, N. J., Fairbanks, R. G., Chiu, T.-C. & Parrenin,<br />
F. 2004. Absolute calibration <strong>of</strong> the Greenland time scale:<br />
implications for Antarctic time scales and for ∆14C. Quaternary<br />
Science Reviews 23, 1513–1522.<br />
Wohlfarth, B., Filimonova, L., Bennike, O., Björkman, L.,<br />
Brunnberg, L., Lavrova, N., Demidov, I. & Possnert,<br />
G. 2002. Late-Glacial and Early Holocene Environmental<br />
and Climatic Changes at Lake Tambichozero, Southeastern<br />
Russian Korelia. Quaternary Research 58, 261–272.
Applied Quaternary research in the central part <strong>of</strong> glaciated terrain,<br />
edited by Peter Johansson and Pertti Sarala.<br />
<strong>Geological</strong> <strong>Survey</strong> <strong>of</strong> <strong>Finland</strong>, <strong>Special</strong> <strong>Paper</strong> <strong>46</strong>, 113–120, 2007.<br />
DATED – A GIS-BASED RECONSTRUCTION AND DATING DATABASE<br />
OF THE EURASIAN DEGLACIATION<br />
by<br />
Richard Gyllencreutz, Jan Mangerud, John-Inge Svendsen and Øystein Lohne 1<br />
Gyllencreutz, R., Mangerud, J., Svendsen, J.-I. & Lohne, Ø.<br />
2007. DATED – A GIS-based Reconstruction and dating Database<br />
<strong>of</strong> the Eurasian Deglaciation. Applied Quaternary research<br />
in the central part <strong>of</strong> glaciated terrain. <strong>Geological</strong> <strong>Survey</strong> <strong>of</strong> <strong>Finland</strong>,<br />
<strong>Special</strong> <strong>Paper</strong> <strong>46</strong>, 113–120, 3 <strong>fi</strong> gures.<br />
The goal <strong>of</strong> the ongoing project DATED is to describe and<br />
document the ice growth towards the LGM and the deglaciation<br />
<strong>of</strong> the large ice sheets in northwest Eurasia. Digitized ice<br />
margins and other relevant published features are compiled in a<br />
geographical information system, which is coupled to a database<br />
with dates ( 14 C, OSL, TL, cosmogenic exposure, clay-varve).<br />
The <strong>fi</strong> rst version <strong>of</strong> the database and the GIS will be available on<br />
the internet in 2007, and will be successively updated. The main<br />
purpose <strong>of</strong> DATED is to serve as a source for the deglaciation<br />
history <strong>of</strong> the Eurasian ice sheets to provide accurate digital maps<br />
with calendar-year isochrones to modelers and other researchers.<br />
It will also serve as an aid for identifying areas where data is<br />
lacking, and to facilitate future reinterpretation <strong>of</strong> the deglaciation<br />
pattern.<br />
Key words (GeoRef Thesaurus, AGI): glacial geology, ice sheets,<br />
deglaciation, geographic information systems, data bases, dates,<br />
DATED Project, Eurasia.<br />
1 Dept. <strong>of</strong> Earth Science, University <strong>of</strong> Bergen, Allégaten 41,<br />
NO-5007 Bergen, Norway<br />
E-mail: richard.gyllencreutz@geo.uib.no<br />
113
<strong>Geological</strong> <strong>Survey</strong> <strong>of</strong> <strong>Finland</strong>, <strong>Special</strong> <strong>Paper</strong> <strong>46</strong><br />
Richard Gyllencreutz, Jan Mangerud, John-Inge Svendsen and Øystein Lohne<br />
The timing and pattern <strong>of</strong> the deglaciation <strong>of</strong> the<br />
Eurasian Ice Sheet is <strong>of</strong> key importance for Late<br />
Quaternary environments, on a local and global<br />
scale. The increasing resolution <strong>of</strong> glacier and climate<br />
models demands detailed information about<br />
the deglaciation on a calendar-year time scale. This<br />
is the rationale for the ongoing project DATED,<br />
whose goal is to serve as a primary source <strong>of</strong> information<br />
about the ice growth towards LGM and the<br />
deglaciation <strong>of</strong> Eurasia by presenting digital maps<br />
<strong>of</strong> ice growth and decay, and a database <strong>of</strong> published<br />
dates ( 14 C, OSL, TL, cosmogenic exposure, clayvarve),<br />
end moraines, and other relevant features.<br />
Large volumes <strong>of</strong> data on the Eurasian deglaciation<br />
pattern and chronology exist in the literature,<br />
but most investigations provide information only on<br />
the local or regional level. Therefore, it is dif<strong>fi</strong> cult<br />
to make wide ice-sheet syntheses, as interpretations<br />
between areas differ, and much <strong>of</strong> the relevant information<br />
is published in local journals, maps, and<br />
theses. Previous large scale reconstructions <strong>of</strong> the<br />
entire Eurasian Ice Sheet or its major constituents<br />
(e.g. Andersen 1981, Lundqvist & Saarnisto 1995,<br />
Kleman et al. 1997, Boulton et al. 2001, Svendsen<br />
et al. 2004) have the disadvantage <strong>of</strong> not being fully<br />
transparent to their data sources. These reconstructions<br />
are therefore dif<strong>fi</strong> cult to validate and re<strong>fi</strong> ne by<br />
further investigations. Recently, large efforts have<br />
been made to overcome these problems by creating<br />
digital maps connected to relational databases,<br />
where the information can be traced back to its<br />
original source. The GIS maps produced by Ehlers<br />
and Gibbard (2004) shows a compilation <strong>of</strong> glacial<br />
morphological features from the entire Eurasian<br />
Ice Sheet, but the level and amount <strong>of</strong> information<br />
varies widely between the contributing countries,<br />
114<br />
INTRODUCTION<br />
and chronologic information is only available as<br />
sparse, interpreted ages <strong>of</strong> certain features, <strong>of</strong>ten<br />
without reference to the original dates. The BRIT-<br />
ICE-project (Clark et al. 2004, Evans et al. 2005)<br />
produced a freely available GIS with detailed information<br />
about glacial features related to the last<br />
British (Devensian) Ice Sheet, with full sourcetransparency.<br />
The BRITICE database, however,<br />
does not include chronologic data, partly because <strong>of</strong><br />
the very limited number <strong>of</strong> available dates (Clark et<br />
al. 2004). The success <strong>of</strong> the BRITICE project was<br />
a major inspiration for creating the ice-sheet wide<br />
DATED database, where all available morphologic<br />
as well as chronologic information is collected.<br />
The main purpose <strong>of</strong> DATED is to serve as an<br />
updated source <strong>of</strong> interpreted ice margins and dates<br />
for the deglaciation <strong>of</strong> the Eurasian Ice Sheet, to<br />
provide accurate digital maps with calendar-year<br />
isochrones to modelers and other researchers. It<br />
will also show where data is lacking, and facilitate<br />
reinterpretation <strong>of</strong> the deglaciation pattern.<br />
The present paper is a project description <strong>of</strong><br />
work in progress. The <strong>fi</strong> rst version <strong>of</strong> DATED will<br />
be published and made available on the internet in<br />
2007, in a format readable for ordinary web-browsers.<br />
Information about DATED can be found on the<br />
web site http://www.gyllencreutz.se. This task is a<br />
part <strong>of</strong> the British-Dutch-Norwegian co-operative<br />
project Ocean Reconstruction and Modelling <strong>of</strong><br />
the European deglaciation (ORMEN, http://www.<br />
bridge.bris.ac.uk/projects/ORMEN/Index.html) led<br />
by Sandy Harrison, University <strong>of</strong> Bristol, and is also<br />
part <strong>of</strong> the project Ice Age Development and Human<br />
Settlement in northern Eurasia (ICEHUS), led by<br />
John Inge Svendsen, University <strong>of</strong> Bergen.
The area comprised in DATED includes all areas<br />
covered by the northwest Eurasian (Scandinavian-,<br />
British-Irish-, and Barents-Kara-) ice sheets (Fig.<br />
1), that is part <strong>of</strong> or the entire following countries:<br />
Ireland, Great Britain, Denmark, Norway, Swe-<br />
STUDY AREA<br />
den, <strong>Finland</strong>, Germany, Poland, Ukraine, Belarus,<br />
Lithuania, Latvia, Estonia, Russia, the Arctic areas<br />
between 0° E and 110° E, as well as the surrounding<br />
sea areas.<br />
Fig. 1. Geographical extension <strong>of</strong> DATED, which is approximately within the asynchronous LGM reconstruction by Svendsen et<br />
al. (2004) (white line). Elevation data from the SRTM30PLUS dataset (Becker & Sandwell 2006).<br />
Database (DATED 1)<br />
The database is created and maintained using Micros<strong>of</strong>t<br />
Access®. The goal <strong>of</strong> the database is to cover<br />
all available dates <strong>of</strong> the Eurasian deglaciation,<br />
based on radiocarbon ( 14 C), optically stimulated<br />
luminescence (OSL), thermoluminescence (TL),<br />
cosmogenic exposure (e.g. 10 Be, 36 Cl), and clayvarve<br />
records. The database will include ice growth<br />
towards the LGM, and therefore start with dates <strong>of</strong><br />
the Ålesund Interstadial, c. 35-38 cal kyr BP (Mangerud<br />
et al. 2003). Dates showing the vertical extent<br />
<strong>of</strong> the ice sheet will also be included (e.g. Linge et<br />
al. 2006, Ballantyne et al. 1998).<br />
<strong>Geological</strong> <strong>Survey</strong> <strong>of</strong> <strong>Finland</strong>, <strong>Special</strong> <strong>Paper</strong> <strong>46</strong><br />
DATED – A GIS-based Reconstruction and dating Database <strong>of</strong> the Eurasian Deglaciation<br />
METHODS<br />
The dates in the database are collected from published<br />
scienti<strong>fi</strong> c papers <strong>of</strong> various kinds (original research<br />
articles, reviews and syntheses, map descriptions,<br />
or PhD-theses). When necessary, additional<br />
metadata (e.g. map coordinates and sediment descriptions)<br />
are acquired using the unique laboratory<br />
codes, for example, from published 14 C-laboratory<br />
reports (e.g. Håkansson 1982) or directly from the<br />
author.<br />
All entries or changes to the database are performed<br />
by the authors <strong>of</strong> this paper to secure the<br />
data integrity and quality control. Researchers who<br />
wish to contribute with data or otherwise comment<br />
115
<strong>Geological</strong> <strong>Survey</strong> <strong>of</strong> <strong>Finland</strong>, <strong>Special</strong> <strong>Paper</strong> <strong>46</strong><br />
Richard Gyllencreutz, Jan Mangerud, John-Inge Svendsen and Øystein Lohne<br />
on the work are encouraged to contact us directly.<br />
The database will be maintained by the Department<br />
<strong>of</strong> Earth Science, University <strong>of</strong> Bergen until 2011,<br />
after which a permanent location for the database<br />
and maintaining personnel will be determined.<br />
Data are entered into the database in two different<br />
ways. Single dates are entered through a custom<br />
made form, with <strong>fi</strong> elds and drop-down menus for<br />
all entries. Large numbers <strong>of</strong> dates from common<br />
source publications are entered together, to minimize<br />
the risk <strong>of</strong> entry errors, after customizing the table<br />
to match the DATED database structure. It should<br />
be noted that as a rule, only published information<br />
(including PhD theses) is used, which provides a<br />
crude quality control, and ensures that all data can<br />
be traced back to its original source. Exceptions to<br />
this are made for unpublished dates that supply veri<strong>fi</strong><br />
able information suf<strong>fi</strong> cient for a critical evaluation<br />
(name <strong>of</strong> researcher, lab code, map coordinates,<br />
dated material, sedimentary setting); these dates are<br />
still traceable to laboratory records, and are entered<br />
(as “unpublished”) into the database with reference<br />
to the researcher who supplied them.<br />
The database contains a large number <strong>of</strong> potentially<br />
relevant entry <strong>fi</strong> elds, <strong>of</strong> which the following<br />
features are considered crucial for incorporation to<br />
the database: Country, Locality, Longitude, Latitude,<br />
Dated material, Stratigraphic relative position<br />
(relation to ice margin position), Dating method,<br />
Laboratory code, Age, Age error, References, and<br />
Flag. “Flag” denotes comments important for interpretation<br />
<strong>of</strong> the dates, for example, if a date<br />
was interpreted to be erroneous by the original or<br />
subsequent authors. For dates obtained from compilations<br />
such as reviews or syntheses, references<br />
are given both to the original publication and to the<br />
compilation. Only short references (author(s), year)<br />
are given in the database, while a complete list <strong>of</strong><br />
full references will be given in a separate document<br />
available from the same web site.<br />
All dates in the database are also given in a format<br />
considered to represent calendar years. Radiocarbon<br />
dates are entered as uncalibrated ages, but are also<br />
given as (re-) calibrated dates using INTCAL04<br />
(Reimer et al. 2004). Marine samples are corrected<br />
for reservoir ages using ∆R-values given in the<br />
database and Marine04 (Hughen et al. 2004) for<br />
the Holocene. For older marine dates, we will use<br />
reservoir corrections from Bondevik et al. (2006)<br />
and other new results. No calibration is performed<br />
on OSL, TL, or Exposure dates; these are treated as<br />
calendar ages. Clay-varve records connected to the<br />
Swedish Time Scale (STS) are corrected by adding<br />
900 years to varve ages younger than 10,300 varve<br />
116<br />
years BP, based on the correlation between the STS<br />
and the GRIP δ 18 O record by Andrén et al. (1999,<br />
2002) in conjunction with the new Greenland ice<br />
core chronology GICC05 (Rasmussen et al. 2006).<br />
The database is coupled to the GIS (DATED 2),<br />
enabling rapid data viewing by selecting features in<br />
the map view (Figs. 2 and 3), as well as advanced<br />
querying.<br />
GIS (DATED 2)<br />
The GIS maps are created using Intergraph’s Geo-<br />
Media® Pr<strong>of</strong>essional s<strong>of</strong>tware. Besides basic cartographic<br />
information (country borders, lakes, rivers<br />
etc.), the DATED GIS contains a digital elevation<br />
model (DEM), mapped and interpreted ice margins,<br />
ice marginal deposits (end moraines, glacifl uvial<br />
deltas, eskers, hummocky moraines, and boulder<br />
<strong>fi</strong> elds), and interpreted isochrones, with references<br />
to original authors as well as to authors <strong>of</strong> compilations,<br />
reviews or syntheses. Examples <strong>of</strong> the GIS<br />
and the database data are shown in Figs. 2 and 3.<br />
More detailed examples with references will be presented<br />
when we <strong>fi</strong> rst publish the results <strong>of</strong> DATED.<br />
For practical reasons, no references for the data in<br />
Fig. 2 (except for the highlighted example features)<br />
are given here, because a full reference list would be<br />
too space consuming. Reconstructions <strong>of</strong> the vertical<br />
extent <strong>of</strong> the ice sheet will also be included (e.g.<br />
Linge et al. 2006, Ballantyne et al. 1998). DATED<br />
is also planned to include ice-dammed lakes and<br />
Fig. 2. Detail <strong>of</strong> the DATED GIS, showing the southeastern<br />
sector <strong>of</strong> the Scandinavian ice sheet and a sample <strong>of</strong> the<br />
data incorporated by October 2006. Black lines indicate ice<br />
margins, and white dots mark locations <strong>of</strong> dates. All features<br />
are thoroughly referenced in the databases, but for practical<br />
reasons, no references for the data sources are given here. The<br />
dark red line indicates the Younger Dryas ice margin according<br />
to Ehlers and Gibbard (2004). Examples <strong>of</strong> the GIS and<br />
database entries are given in Fig. 3. The yellow circle shows<br />
an example <strong>of</strong> (unedited) confl icting ice margin locations<br />
within the North Lithuanian Moraine (western line by Zelcs<br />
and Markots (2004) and eastern line by Raukas et al. (1995)).
ice-directional indicators (meltwater channels, eskers,<br />
drumlins, lineations and striae), inspired by the<br />
BRITICE project (Clark et al. 2004), but the chronology<br />
and pattern <strong>of</strong> the deglaciation is prioritized.<br />
The GIS map features are generalized for the scale<br />
1:2.5 million.<br />
Two different modes <strong>of</strong> workfl ow are used for<br />
the primary data capture. For the incorporation <strong>of</strong><br />
data from previous GIS sources, such as the GIS<br />
CD-ROM in “Quaternary Glaciations - Extent and<br />
Chronology Part I: Europe” by Ehlers and Gibbard<br />
(2004), digital ice margins are imported to the<br />
DATED GIS in their original format, and additional<br />
metadata (e.g. references, ages and alternative ice<br />
margin names) are added. Published deglaciation<br />
maps or map <strong>fi</strong> gures are scanned and then georeferenced<br />
in the GIS using af<strong>fi</strong> ne transformation (most<br />
<strong>of</strong>ten based on control points along the coastline),<br />
before the ice margins are digitized into the GIS,<br />
and additional metadata (as above) are added.<br />
<strong>Geological</strong> <strong>Survey</strong> <strong>of</strong> <strong>Finland</strong>, <strong>Special</strong> <strong>Paper</strong> <strong>46</strong><br />
DATED – A GIS-based Reconstruction and dating Database <strong>of</strong> the Eurasian Deglaciation<br />
Fig. 3. Examples <strong>of</strong> the information stored in DATED, as<br />
displayed in the GIS when selecting a) a date (white dots in<br />
Fig. 2), or b) an ice margin (black lines in Fig. 2).<br />
117
<strong>Geological</strong> <strong>Survey</strong> <strong>of</strong> <strong>Finland</strong>, <strong>Special</strong> <strong>Paper</strong> <strong>46</strong><br />
Richard Gyllencreutz, Jan Mangerud, John-Inge Svendsen and Øystein Lohne<br />
118<br />
CONFLICT MANAGEMENT OF ICE MARGIN LOCATIONS<br />
Several areas show confl icting ice margin locations<br />
due to previous digitizing errors, gaps or mis<strong>fi</strong> ts<br />
between maps by different authors, or due to inconsistent<br />
interpretations (Fig. 2). In these areas, the<br />
original lines are edited to construct a consistent and<br />
glaciologically plausible pattern, and the modi<strong>fi</strong> ed<br />
De<strong>fi</strong> nition <strong>of</strong> the Last Glacial Maximum (LGM)<br />
One goal <strong>of</strong> DATED is a map <strong>of</strong> the isochronous<br />
ice margin location at the time when the integrated<br />
ice covered area was the greatest, <strong>of</strong>ten called the<br />
LGM. However, the LGM is not an unambiguous<br />
term. The LGM ice margin, as reconstructed by Svendsen<br />
et al. (2004), Boulton et al. (2001), Kleman<br />
et al. (1997), and Andersen (1981) for example,<br />
represents the furthest ice margin advances between<br />
about 30 and 15 kyr BP (Houmark-Nielsen & Kjaer<br />
2003), and not an isochronous ice margin. Since the<br />
timing <strong>of</strong> the maximum extent <strong>of</strong> the ice margin depends<br />
on glacier dynamics and regional variations<br />
in climate, topography, and bed conditions, the ice<br />
margin was at its maximum position at different<br />
times along the margins <strong>of</strong> the Eurasian Ice Sheet,<br />
1. DATED is an ongoing effort to produce an improved<br />
and transparent reconstruction <strong>of</strong> the<br />
last growth and deglaciation <strong>of</strong> the Eurasian ice<br />
sheets (Barents-Kara, Scandinavian, British).<br />
The <strong>fi</strong> rst version will be published on the web in<br />
2007 and present ice margins and dates around<br />
the entire perimeter <strong>of</strong> the ice sheets in a calendar-year<br />
scale. The data used is compiled from<br />
the literature, with references to all sources.<br />
DATED consists <strong>of</strong> two parts.<br />
2. Part one is the Database on Eurasian Deglaciation<br />
Dates (DATED 1) was designed to cover all<br />
available dates ( 14 C, OSL, TL, cosmogenic<br />
exposure, and clay-varve records) <strong>of</strong> the last<br />
growth (from c. 40 cal kyr BP) and decay <strong>of</strong> the<br />
Eurasian ice sheets.<br />
3. Part two is the Digital Atlas <strong>of</strong> the Eurasian<br />
Deglaciation (DATED 2) presenting the new re-<br />
DISCUSSION<br />
CONCLUSIONS<br />
lines are stored separate from the originals in the<br />
GIS, with thorough referencing. The editing is performed<br />
in collaboration with the relevant authors,<br />
with the additional aid <strong>of</strong> stratigraphic information,<br />
satellite images, and high-resolution DEMs (c.100<br />
m resolution).<br />
and certainly between different glaciers and ice<br />
sheets. A de<strong>fi</strong> nition <strong>of</strong> the LGM as the most recent<br />
maximum in global ice volume at about 21 kyr BP<br />
(Mix et al. 2001) is thus not applicable to the areal<br />
extent <strong>of</strong> individual glaciers or parts <strong>of</strong> ice sheets,<br />
and the former should, in our opinion, be called the<br />
Last Global Glacial Maximum (LGGM). A map <strong>of</strong><br />
isochronous ice margins during the extended time<br />
period <strong>of</strong> ice advance and retreat, will demonstrate<br />
the asynchroneity <strong>of</strong> the “LGM-line” <strong>of</strong> Svendsen<br />
et al. (2004) for example, and provide a way to<br />
determine the maximum areal (and volume) extent<br />
<strong>of</strong> the Eurasian Ice Sheet. This can eventually be<br />
conceived through spatial querying <strong>of</strong> the DATED<br />
GIS isochrones, given suf<strong>fi</strong> cient data input.<br />
construction. However, DATED 2 also includes<br />
a database <strong>of</strong> end moraines, other morphological<br />
features and earlier reconstructions <strong>of</strong> the deglaciation<br />
for the entire or parts <strong>of</strong> the area. On the<br />
web, DATED 1 and 2 are connected so that readers<br />
easily can identify the background data for<br />
reconstructions.<br />
4. The main objective with DATED is to serve as<br />
an updated source <strong>of</strong> interpreted ice margins<br />
and dates for the deglaciation <strong>of</strong> the Eurasian<br />
Ice Sheet, to provide accurate digital maps with<br />
calendar-year isochrones to modelers and other<br />
researchers. The transparency to data sources<br />
will facilitate evaluation and reinterpretation <strong>of</strong><br />
the deglaciation reconstruction. DATED may<br />
also assist <strong>fi</strong> eld workers in locating future areas<br />
<strong>of</strong> investigation, by showing where data is lacking<br />
or sparse.
This research is funded by the Research Council <strong>of</strong><br />
Norway. We thank the participants <strong>of</strong> the Peribaltic<br />
Symposium in Oulu (September 11-15, 2006) for<br />
valuable contributions and comments. The Intergraph<br />
Registered Research Laboratory program<br />
kindly provided GeoMedia® Pr<strong>of</strong>essional s<strong>of</strong>tware.<br />
We are thankful for constructive comments by Peter<br />
Andersen, B. G. 1981. Late Weichselian Ice Sheets in Eurasia<br />
and Greenland. In: Denton, G. H. & Hughes, T. J. (eds.) The<br />
last great ice sheets. Wiley-Interscience, 1–65.<br />
Andrén, T., Björck, J. & Johnsen, S. 1999. Correlation <strong>of</strong><br />
Swedish glacial varves with the Greenland (GRIP) oxygen<br />
isotope record. Journal <strong>of</strong> Quarternary Science 14,<br />
361–371.<br />
Andrén, T., Lindeberg, G. & Andrén, E. 2002. Evidence <strong>of</strong><br />
the <strong>fi</strong> nal drainage <strong>of</strong> the Baltic Ice Lake and the brackish<br />
phase <strong>of</strong> the Yoldia Sea in glacial varves from the Baltic<br />
Sea. Boreas 31, 226–238.<br />
Ballantyne, C. K., McCarroll, D., Nesje, S. O. & Stone, J.<br />
O. 1998. The last ice sheet in north-west Scotland: reconstruction<br />
and implications. Quaternary Science Reviews<br />
17, 1149–1148.<br />
Becker, J. J. & Sandwell, D. T. 2006. SRTM30_PLUS:<br />
SRTM30, coastal & ridge multibeam, estimated topography.<br />
Electronic journal. URL: http://topex.ucsd.edu/<br />
WWW_html/srtm30_plus.html<br />
Bondevik, S., Mangerud, J., Birks, H. H., Gulliksen, S. &<br />
Reimer, P. 2006. Changes in North Atlantic Radiocarbon<br />
Reservoir Ages During the Allerød and Younger Dryas.<br />
Science 312, 1514–1517.<br />
Boulton, G. S., Dongelmans, P., Punkari, M. & Broadgate,<br />
M. 2001. Palaeoglaciology <strong>of</strong> an ice sheet through a glacial<br />
cycle: the European ice sheet through the Weichselian.<br />
Quaternary Science Reviews 20, 591–625.<br />
Clark, C. D., Evans, D. J. A., Khatwa, A., Bradwell, T., Jordan,<br />
C. J., Marsh, S. H., Mitchell, W. A. & Bateman,<br />
M. D. 2004. Map and GIS database <strong>of</strong> glacial landforms<br />
and features related to the last British Ice Sheet. Boreas 33,<br />
359–375.<br />
Ehlers, J. & Gibbard, P. L. (eds.) 2004. Quaternary Glaciations<br />
– Extent and chronology Part I: Europe. Elsevier.<br />
475 p.<br />
Evans, D. J. A., Clark, C. D. & Mitchell, W. A. 2005. The last<br />
British Ice Sheet: A review <strong>of</strong> the evidence utilised in the<br />
compilation <strong>of</strong> the Glacial Map <strong>of</strong> Britain. Earth-Science<br />
Reviews 70, 253–312.<br />
Håkansson, S. 1982. University <strong>of</strong> Lund radiocarbon dates XV.<br />
Radiocarbon 24, 194–213.<br />
Houmark-Nielsen, M. & Kjær, K. H. 2003. Southwest Scandinavia,<br />
40–15 ka BP: palaeogeography and environmental<br />
change. Journal <strong>of</strong> Quaternary Science 18, 769–786.<br />
<strong>Geological</strong> <strong>Survey</strong> <strong>of</strong> <strong>Finland</strong>, <strong>Special</strong> <strong>Paper</strong> <strong>46</strong><br />
DATED – A GIS-based Reconstruction and dating Database <strong>of</strong> the Eurasian Deglaciation<br />
ACKNOWLEDGEMENTS<br />
REFERENCES<br />
Johansson and Pertti Sarala. This work is a contribution<br />
to the projects Ocean Reconstruction and<br />
Modelling <strong>of</strong> the European deglaciation (ORMEN),<br />
and Ice Age Development and Human Settlement in<br />
northern Eurasia (ICEHUS), and is <strong>fi</strong> nanced through<br />
grants from the Research Council <strong>of</strong> Norway.<br />
Hughen, K. A., Baillie, M. G. L., Bard, E., Bayliss, A., Beck,<br />
J. W., Bertrand, C. J. H., Blackwell, P. G., Buck, C. E.,<br />
Burr, G. S., Cutler, K. B., Damon, P. E., Edwards, R.<br />
L., Fairbanks, R. G., Friedrich, M., Guilderson, T. P.,<br />
Kromer, B., McCormac, F. G., Manning, S. W., Bronk<br />
Ramsey, C., Reimer, P. J., Reimer, R. W., Remmele, S.,<br />
Southon, J. R., Stuiver, M., Talamo, S., Taylor, F. W.,<br />
van der Plicht, J. & Weyhenmeyer, C. E. 2004. Marine04<br />
Marine radiocarbon age calibration, 26 - 0 ka BP. Radiocarbon<br />
<strong>46</strong>, 1059–1086.<br />
Kalm, V. 2006. Pleistocene chronostratigraphy in Estonia,<br />
southeastern sector <strong>of</strong> the Scandinavian glaciation. Quaternary<br />
Science Reviews 25, 960–975.<br />
Kleman, J., Hättestrand, C., Borgström, I. & Stroeven, A.<br />
1997. Fennoscandian paleoglaciology reconstructed using<br />
a glacial geological inversion model. Journal <strong>of</strong> Glaciology<br />
43, 283–299.<br />
Linge, H., Brook, E. J., Nesje, A., Raisbeck, G. M., Yioud,<br />
F. & Clark, H. 2006. In situ 10Be exposure ages from<br />
southeastern Norway: implications for the geometry <strong>of</strong> the<br />
Weichselian Scandinavian ice sheet. Quaternary Science<br />
Reviews 25, 1097–1109.<br />
Lundqvist, J. & Saarnisto, M. 1995. Summary <strong>of</strong> project<br />
IGCP-253. Quaternary International 28, 9–18.<br />
Mangerud, J., Løvlie, R., Gulliksen, S., Hufthammer, A.-K.,<br />
Larsen, E. & Valen, V. 2003. Paleomagnetic correlations<br />
between Scandinavian Ice-Sheet fl uctuations and Greenland<br />
Dansgaard–Oeschger events, 45,000–25,000 yr B.P.<br />
Quaternary Research 59, 213–222.<br />
Mix, A. C., Bard, E. & Schneider, R. 2001. Environmental<br />
processes <strong>of</strong> the ice age: land, oceans, glaciers (EPILOG).<br />
Quaternary Science Reviews 20, 627–657.<br />
Mojski, J. E. 2000. The evolution <strong>of</strong> the southern Baltic coastal<br />
zone. Oceanologia 42, 285–303.<br />
Rasmussen, S. O., Andersen, K. K., Svensson, A. M., Steffensen,<br />
J. P., Vinther, B. M., Clausen, H. B., Siggaard-<br />
Andersen, M.-L., Johnsen, S. J., Larsen, L. B., Dahl-<br />
Jensen, D., Bigler, M., Röthlisberger, R., Fischer, H.,<br />
Goto-Azuma, K., Hansson, M. E. & Ruth, U. 2006. A<br />
new Greenland ice core chronology for the last glacial termination.<br />
Journal <strong>of</strong> Geophysical Research 111, d06102.<br />
Raukas, A., Aboltins, O. & Gaigalas, A. 1995. Current state<br />
and new trends in the Quaternary geology <strong>of</strong> the Baltic<br />
States. Proceedings <strong>of</strong> the Estonian Academy <strong>of</strong> Sciences<br />
44, 1–14.<br />
119
<strong>Geological</strong> <strong>Survey</strong> <strong>of</strong> <strong>Finland</strong>, <strong>Special</strong> <strong>Paper</strong> <strong>46</strong><br />
Richard Gyllencreutz, Jan Mangerud, John-Inge Svendsen and Øystein Lohne<br />
Reimer, P. J., Baillie, M. G. L., Bard, E., Bayliss, A., Beck,<br />
J. W., Bertrand, C. J. H., Blackwell, P. G., Buck, C. E.,<br />
Burr, G. S., Cutler, K. B., Damon, P. E., Edwards, R.<br />
L., Fairbanks, R. G., Friedrich, M., Guilderson, T. P.,<br />
Hogg, A. G., Hughen, K. A., Kromer, B., McCormac, G.,<br />
Manning, S., Bronk Ramsey, C., Reimer, R.W., Remmele,<br />
S., Southon, J. R., Stuiver, M., Talamo, S., Taylor,<br />
F. W., van der Plicht, J. & Weyhenmeyer, C. E. 2004.<br />
INTCAL04 terrestrial radiocarbon age calibration, 0–26 cal<br />
kyr BP. Radiocarbon <strong>46</strong>, 1029–1058.<br />
Svendsen, J., Alexanderson, H., Astakhov, V., Demidov, I.,<br />
Dowdeswell, J., Funder, S., Gataullin, V., Henriksen, M.,<br />
Hjort, C., Houmark-Nielsen, M., Hubberten, H., Ingólf-<br />
120<br />
son, O., Jakobsson, M., Kjær, K., Larsen, E., Lokrantz,<br />
H., Lunkka, J., Lyså, A., Mangerud, J., Matiouchkov,<br />
A., Murray, A., Möller, P., Niessen, F., Nikolskaya, O.,<br />
Polyak, P., Saarnisto, M., Siegert, C., Siegert, M., Spielhagen,<br />
R. & Stein, R. 2004. Late Quaternary ice sheet history<br />
<strong>of</strong> Northern Eurasia. Quaternary Science Reviews 23,<br />
1229–1271.<br />
Us ´cinowicz, S. 1999. Southern Baltic area during the last deglaciation.<br />
<strong>Geological</strong> Quaterly 43, 137–148.<br />
Zelcs, V. & Markots, A. 2004. Deglaciation history <strong>of</strong> Latvia.<br />
In: Ehlers, J. & Gibbard P. L. (eds.) Quaternary Glaciations<br />
– Extent and chronology. Elsevier. 225–243.
Applied Quaternary research in the central part <strong>of</strong> glaciated terrain,<br />
edited by Peter Johansson and Pertti Sarala.<br />
<strong>Geological</strong> <strong>Survey</strong> <strong>of</strong> <strong>Finland</strong>, <strong>Special</strong> <strong>Paper</strong> <strong>46</strong>, 121–128, 2007.<br />
TIME-TRANSGRESSIVE EVOLUTION OF LANDSLIDES POSSIBLY<br />
INDUCED BY SEISMOTECTONIC EVENTS IN LAPLAND<br />
by<br />
Raimo Sutinen, Matti Piekkari and Pauliina Liwata 1<br />
Sutinen, R., Piekkari, M. & Liwata, P. 2007. Time-transgressive<br />
evolution <strong>of</strong> landslides possibly induced by seismotectonic<br />
events in Lapland. Applied Quaternary research in the central<br />
part <strong>of</strong> glaciated terrain. <strong>Geological</strong> <strong>Survey</strong> <strong>of</strong> <strong>Finland</strong>, <strong>Special</strong><br />
<strong>Paper</strong> <strong>46</strong>, 121–128, 7 <strong>fi</strong> gures.<br />
Paleolandslides are evidence <strong>of</strong> the occurrence <strong>of</strong> seismotectonic<br />
events associated with glacio-isostatic recovery, but their<br />
time-transgressive distribution is poorly understood in northeastern<br />
Fennoscandia. We investigated Early Holocene paleolandslides<br />
along a gradient from Utsjoki close to the Younger Dryas<br />
End Moraines (YDEMs) in northern Finnish Lapland down to<br />
Kittilä, close to the so-called ice divide zone <strong>of</strong> the Fennoscandian<br />
Ice Sheet (FIS) in southwestern Lapland. Morphological<br />
evidence demonstrated that the Utsjoki landslides were nunatak/<br />
ice-marginal meaning that during the slides the valley fl oors were<br />
still ice-covered, and we estimated that the slides had occurred<br />
around 10,180 yr BP. Paleolandslides in Kittilä are younger and<br />
yielded 14 C-ages up to 8,700 yr BP. According to present knowledge,<br />
at the northeastern Fennoscandian paleolandslides, major<br />
fault instability had been time-transgressively present at and behind<br />
the retreating margin <strong>of</strong> the FIS after the YDEMs.<br />
Key words (GeoRef Thesaurus, AGI): landslides, neotectonics,<br />
faults, seismotectonics, Holocene, Lapland Province, <strong>Finland</strong>.<br />
1 <strong>Geological</strong> <strong>Survey</strong> <strong>of</strong> <strong>Finland</strong>, P.O. Box 77, FI-96101<br />
Rovaniemi, <strong>Finland</strong><br />
E-mail: raimo.sutinen@gtk.<strong>fi</strong> , matti.piekkari@gtk.<strong>fi</strong> ,<br />
pauliina.liwata@gtk.<strong>fi</strong><br />
121
<strong>Geological</strong> <strong>Survey</strong> <strong>of</strong> <strong>Finland</strong>, <strong>Special</strong> <strong>Paper</strong> <strong>46</strong><br />
Raimo Sutinen, Matti Piekkari and Pauliina Liwata<br />
Northern Fennoscandia has experienced high-magnitude<br />
(up to Mag=8.2) postglacial fault deformations<br />
(PGFs) attributable to glacio-isostatic rebound<br />
(Arvidsson 1996). According to the subsidence-rebound<br />
model by Stewart et al. (2000), the occurrence<br />
<strong>of</strong> PGFs includes bending <strong>of</strong> the crust causing<br />
stress at the edge <strong>of</strong> the receding ice sheets, hence<br />
the ice-marginal terrains were subjected to seismic<br />
impacts (Arvidsson 1996, Wu et al. 1999). Conceptual<br />
models suggest paleolandslides were associated<br />
with these crustal events (Kujansuu 1972,<br />
Lagerbäck 1990, Sutinen 1992, 2005, Olesen et al.<br />
2004), but their time-transgressivity and distribution<br />
particularly in the region close to YDEMs have<br />
remained obscure.<br />
On the basis <strong>of</strong> radiocarbon dates ( 14 C) <strong>of</strong> landslide-buried<br />
organic sediments, we have recently<br />
found that the PGF-activity had continued through<br />
the early Holocene in west-central Lapland (Sutinen<br />
2005). This <strong>fi</strong> nding demonstrates that glacioisostatic<br />
recovery involving major earthquakes seems to<br />
70 o<br />
65 o<br />
122<br />
18o<br />
SWEDEN<br />
Rovaniemi<br />
Tromso<br />
Kiruna<br />
Pärvie<br />
Lansjärv<br />
GULF OF<br />
BOTHNIA<br />
Landslides in Norrbotten and Lapland<br />
Landslides in Utsjoki (this study)<br />
Stuoragurra<br />
NORWAY<br />
Rietsamo<br />
INTRODUCTION<br />
Suasselkä<br />
Utsjoki<br />
Rovaniemi<br />
FINLAND<br />
Fiskarhalvö<br />
RUSSIA<br />
70 o<br />
NORWAY<br />
Younger Dryas End Moraines<br />
Fault line<br />
have continued at least 2000 years after the disappearance<br />
<strong>of</strong> the FIS in western Finnish Lapland. If<br />
the time-transgression concept holds for late-/postglacial<br />
crustal rebound, paleolandslides close to the<br />
YDEMs in Utsjoki should be older compared to<br />
those in the so-called ice-divide zone in Kittilä (see<br />
Fig. 1). Even though recent fault instability is minimal<br />
(Milne et al. 2001) compared to that <strong>of</strong> late Pleistocene-early<br />
Holocene recovery events (Arvidsson<br />
1996), reconnaissance <strong>of</strong> PGFs and paleolandslides<br />
provides important information for example, for<br />
site evaluations within nuclear waste disposal studies<br />
(Lagerbäck & Witchard 1983, Ojala et al. 2004).<br />
Our attempt was to i) document large-scale <strong>fi</strong> elds <strong>of</strong><br />
landslides by acquiring data from terrains close to<br />
the YDEMs down to the so-called ice-divide zone<br />
<strong>of</strong> southwestern Lapland and ii) to evaluate if the<br />
northeastern Fennoscandian paleolandslides can<br />
be time-transgressively attributed to glacioisostatic<br />
rebound.<br />
30 o<br />
o 30o<br />
18<br />
SWEDEN<br />
Arctic Circle<br />
FINLAND<br />
RUSSIA<br />
100 km<br />
70 o<br />
65 o<br />
70 o<br />
Fig. 1. Locations <strong>of</strong> northern<br />
Fennoscandian postglacial<br />
faults (PGFs) according to<br />
Tanner (1930), Kujansuu (1964),<br />
Lundqvist and Lagerbäck (1976),<br />
Lagerbäck (1979), Dehls et al.<br />
(2000), Sutinen (2005) and this<br />
study. Barbs along the fault<br />
lines are turned towards the<br />
lower block. Locations <strong>of</strong> late- or<br />
postglacial landslides according<br />
to Kujansuu (1972), Lagerbäck<br />
(1990), Sutinen (2005) (depicted<br />
as dots), and this study (depicted<br />
as crosses); Younger Dryas End<br />
Moraines (YDEMs; with grey<br />
shading) according to the<br />
Nordkalott Project (1987).
We applied stereoscopic airphoto (AP) interpretation<br />
and digital elevation model (DEM based on<br />
the data-base by National Land <strong>Survey</strong>) to recognize<br />
landslides and neotectonic faults (tentatively<br />
PGFs) along a transect from Utsjoki 70°N28’E, 30<br />
km south <strong>of</strong> YDEMs, down to Kittilä, 67°30’N24’,<br />
Finnish Lapland (Fig. 1). Much <strong>of</strong> the conspicuous<br />
landslide scars in Utsjoki were found on the range<br />
<strong>of</strong> treeless fells (high altitude and strong relief features<br />
above treeline) that reaches 330-443 m (a.s.l.)<br />
in the Stuorra Skallovarri-Kanesvarri-area (Figs.<br />
1–4). The complex <strong>of</strong> paleolandslides in Stuorra<br />
Skalluvarri covers an area <strong>of</strong> 30 km 3 (Fig. 2).<br />
1km<br />
Fig. 2. Landslide scars (slide directions shown by arrows) and<br />
PGF-lines (shown as F) in the Stuorra Skallovarri fell area,<br />
Utsjoki.<br />
The largest ‘continuous’ <strong>fi</strong> eld <strong>of</strong> paleolandslide<br />
ridges and mounds found in Utsjoki is the Lake<br />
Fanasjavri slide covering an area <strong>of</strong> approximately<br />
9 km 2 , and located at an altitude <strong>of</strong> 400–360 m a.s.l.<br />
(Fig. 5). Field reconnaissance <strong>of</strong> the slides and faults<br />
were carried out in May 2005.<br />
A number <strong>of</strong> rotational slip-type paleolandslides<br />
in Kittilä (Fig. 1) are well documented in earlier papers<br />
by Kujansuu (1972) and Sutinen (2005), hence<br />
we targeted our surveys on previously unrecognised<br />
<strong>fi</strong> eld <strong>of</strong> slides, located in the Rietsamo area, western<br />
Kittilä (location in Fig. 1). This particular <strong>fi</strong> eld <strong>of</strong><br />
paleoslides covers more than 20 km 2 on the southern<br />
slope <strong>of</strong> the Rietsamo fell, reaching an elevation<br />
<strong>Geological</strong> <strong>Survey</strong> <strong>of</strong> <strong>Finland</strong>, <strong>Special</strong> <strong>Paper</strong> <strong>46</strong><br />
Time-transgressive evolution <strong>of</strong> landslides possibly induced by seismotectonic events in Lapland<br />
MATERIALS AND METHODS<br />
F<br />
Fig. 3. Down-slope view <strong>of</strong> a landslide scar (800 m long, 350<br />
m wide) on the north-sloping (2%) Kanesvarri fell, Utsjoki.<br />
The slide thrust wall highlighted with mountain birch trees.<br />
Note the barren rock on the bottom <strong>of</strong> the scar.<br />
Photo R. Sutinen 2005.<br />
Fig. 4. Upslope view <strong>of</strong> landslide scar (750 m long, 400 m<br />
wide) on the south-sloping (8%) Kanesvarri fell, Utsjoki.<br />
Blocks up to 2 m 2 are common in the slide material.<br />
Photo R. Sutinen 2005.<br />
1km<br />
Fig. 5. Paleolandslides (slide directions shown by arrows)<br />
covering an area <strong>of</strong> 9 km 2 at Lake Fanasjavri site, Utsjoki.<br />
123
<strong>Geological</strong> <strong>Survey</strong> <strong>of</strong> <strong>Finland</strong>, <strong>Special</strong> <strong>Paper</strong> <strong>46</strong><br />
Raimo Sutinen, Matti Piekkari and Pauliina Liwata<br />
<strong>of</strong> 310–250 m a.s.l. (Fig. 6). The highest peaks <strong>of</strong><br />
fells in the area reach 425 m a.s.l. Within the routine<br />
mapping <strong>of</strong> Quaternary deposits (scale 1:400k)<br />
these landforms have been interpreted as hummocky<br />
moraines (without genetic speci<strong>fi</strong> cation) by Penttilä<br />
and Kujansuu (1963). Following the analogy<br />
<strong>of</strong> studies by Kujansuu (1972) and Sutinen (2005)<br />
that indicate that the fabric <strong>of</strong> the landslide materials<br />
are dissimilar to those <strong>of</strong> ice-fl ow directions, we<br />
attempted to rule out the concept <strong>of</strong> ice-deposition<br />
by determining the preferred orientation <strong>of</strong> the materials<br />
in cores <strong>of</strong> the landslide ridges in Rietsamo.<br />
Instead <strong>of</strong> conventional techniques (like excavation<br />
124<br />
<strong>of</strong> test pits and fabric analyses), we determined the<br />
maximum anisotropy (orientation) <strong>of</strong> the sediments<br />
at 27 sites by applying non-destructive azimuthal<br />
measurements <strong>of</strong> apparent electrical conductivity<br />
(σ a) (Taylor & Fleming 1988, Sauck & Zabik 1992,<br />
Penttinen et al. 1999). We applied a Geonics EM31<br />
(Geonics Ltd. Mississauga, Ont. Canada) device<br />
designed to a depth range <strong>of</strong> 3 m in a horizontal coil<br />
position EM31(H) to determine the σ a-anisotropy <strong>of</strong><br />
sediments forming the cores <strong>of</strong> the landslide ridges.<br />
Reference data was acquired at four sites on the till<br />
plain south <strong>of</strong> the margin <strong>of</strong> the slide ridges. The<br />
<strong>fi</strong> eld campaign was carried out in June 2006.<br />
Fig. 6. DEM showing paleolandslide ridges fanning out to the south on the Rietsamo fell, western Kittilä. Sediment anisotropy<br />
shown as rose diagrams <strong>of</strong> azimuthal conductivity measurements with EM-31 in horizontal coil position. Elongation <strong>of</strong> small<br />
ridges (numbers 4-10) shown by red bars on rose diagrams. Field measurements conducted in June 2006.
Postglacial fault alignment<br />
The orientation <strong>of</strong> the AP-interpreted fault lines<br />
(tentatively PGFs) in Utsjoki (Figs. 1-2) was inconsistent<br />
with the predominant southwest-northeast<br />
pattern found in Kittilä and elsewhere in northern<br />
Fennoscandia, but is rather similar in orientation<br />
to those (NW-SE) reported from Kalastajasaarento<br />
(Rybachi Peninsula) (Tanner 1930) and those in the<br />
Kola Peninsula (Roberts et al. 1997). On the basis<br />
<strong>of</strong> a higher block in the down-ice direction, one may<br />
consider the northwest-southeast pattern <strong>of</strong> the PGFs<br />
to coincide with the retreat pattern <strong>of</strong> the margin <strong>of</strong><br />
FIS after the YDEMs (see Norkalott Project 1987).<br />
The major PGFs recognized in northern Fennoscandia,<br />
however, are trending southwest to northeast;<br />
including the Suasselkä-Homevaara fault in <strong>Finland</strong><br />
(Kujansuu 1964, Sutinen 2005), the Pärvie fault in<br />
Sweden (Lundqvist & Lagerbäck 1976, Lagerbäck<br />
1979) as well as the Stuorragurra fault in Norway<br />
(Dehls et al. 2000; Fig. 1). Such orientation seems<br />
not to directly coincide with the retreat pattern <strong>of</strong><br />
the FIS.<br />
<strong>Geological</strong> <strong>Survey</strong> <strong>of</strong> <strong>Finland</strong>, <strong>Special</strong> <strong>Paper</strong> <strong>46</strong><br />
Time-transgressive evolution <strong>of</strong> landslides possibly induced by seismotectonic events in Lapland<br />
RESULTS AND DISCUSSION<br />
Morphology<br />
We found more than 30 paleolandslides/landslide<br />
scars in the Utsjoki area (Figs. 1-5). The slides were<br />
found at altitudes <strong>of</strong> 405-360 m (a.s.l.), demonstrating<br />
that the valley fl oors were still ice-covered at<br />
the time <strong>of</strong> slides (Figs. 2 and 5). This is particularly<br />
well demonstrated in the case <strong>of</strong> the Lake Fanasjavri<br />
paleoslides at altitudes <strong>of</strong> 400-360 m a.s.l.,<br />
but with no signs <strong>of</strong> sediment disturbances on the<br />
valley fl oor at an altitude <strong>of</strong> approximately 300<br />
m a.s.l. (Fig. 5). The slide features on the Stuorra<br />
Gallovarri fell were distributed on all expositions <strong>of</strong><br />
the fell slopes (Fig. 2), but some slides were found<br />
even in moderately fl at surfaces. The length <strong>of</strong><br />
the slides varied from 0.9 to 1.2 km, width from<br />
0.3-0.5 km, and slope from 3.5 to 7.8%, respectively.<br />
The initiation <strong>of</strong> the slides had occurred at<br />
390-405 m a.s.l. Bare rock and/or large boulders<br />
were <strong>of</strong>ten on the fl oors <strong>of</strong> the slide scars (Fig 3-<br />
4), demonstrating that soil moisture saturation had<br />
preceded the slide events (Sutinen 1992, 2005, Hänninen<br />
& Sutinen 1994).<br />
Fig. 7. Outlook <strong>of</strong> small paleolandslide ridge (foreground/ clearcut; location shown by arrow for sites 4-11) and 15m high ridge<br />
(upper right-hand corner/ Norway spruce-downy birch-aspen-forest) in Rietsamo, Kittilä.<br />
125
<strong>Geological</strong> <strong>Survey</strong> <strong>of</strong> <strong>Finland</strong>, <strong>Special</strong> <strong>Paper</strong> <strong>46</strong><br />
Raimo Sutinen, Matti Piekkari and Pauliina Liwata<br />
The Rietsamo <strong>fi</strong> eld <strong>of</strong> paleolandslides (see location<br />
in Fig. 1) are composed <strong>of</strong> arch-shape ridges<br />
varying in height from 2 to 15 m and fanning out to<br />
the south (Figs. 1 and 6). Some <strong>of</strong> the ridges in the<br />
northern part <strong>of</strong> the landslide <strong>fi</strong> eld (sites coded R25-<br />
27 in Fig. 6) were mantled with boulders, but the<br />
material, in general, was not coarse-textured. According<br />
to <strong>fi</strong> eld observations and the composition<br />
<strong>of</strong> forest canopy, which included Norway spruce as<br />
a dominant tree species and downy birch as a principle<br />
associate (Fig. 7) with a silty matrix that was<br />
rather common in the slide materials (see Sutinen et<br />
al. 2002). However, texture or matrix does not play<br />
a crucial role in sliding susceptibility, but a much<br />
more important feature is soil saturation as seen<br />
with modern and Holocene landslides (Keefer 2002,<br />
Sutinen 1992, 2005, Hänninen & Sutinen 1994, Friele<br />
& Claque 2002).<br />
Sedimentary anisotropy<br />
Azimuthal measurements <strong>of</strong> electrical conductivity<br />
(σ a) with EM31(H) indicated that the slide materials<br />
in the Rietsamo ridges had a maximum anisotropy<br />
indicating a fanning-out pattern to the south (Fig<br />
6; R16-31). This pattern clearly deviated from the<br />
maximum anisotropy (WSW-ENE) obtained from<br />
the reference till plain on the south side the slide<br />
<strong>fi</strong> eld (Fig. 6; R1-3) or R12 that was made (distally)<br />
just outside the landslide ridge demarcating the Rietsamo<br />
<strong>fi</strong> eld <strong>of</strong> paleolandslides (see Fig. 6). The crests<br />
<strong>of</strong> small ridges such as those shown in Fig. 7 (out <strong>of</strong><br />
DEM-resolution) were oriented as follows: 60-260°<br />
for R4-5, 30-210° for R6, 170-350° for R7-8 as well<br />
as 20-200° for R9, 0-180° for R10. R11 was on a<br />
non-oriented hummock. The variation in maximum<br />
σ a-anisotropy was large, suggesting that the sliding<br />
event(s) was catastrophic in nature and likely triggered<br />
by fault instability. The anisotropy-pattern<br />
was not coherent with the ice-fl ow stages, which on<br />
the basis <strong>of</strong> till fabric have the southwest-northwest<br />
(Late Weichselian) and northwest-southeast directions<br />
(Early Weichselian) (Sutinen 1992). The nearest<br />
known neotectonic fault line is the Homevaara<br />
fault, 13 km southeast <strong>of</strong> Rietsamo landslide <strong>fi</strong> eld<br />
(Sutinen 2005). Homevaara fault is an extension <strong>of</strong><br />
the Suasselkä fault described by Kujansuu (1964,<br />
1972).<br />
126<br />
ACKNOWLEDGEMENTS<br />
Time-transgression<br />
The age <strong>of</strong> the YDEMs, close to the border <strong>of</strong> <strong>Finland</strong><br />
and Norway (Fig. 1), has been estimated to be<br />
within the envelope <strong>of</strong> 12,500-10,300 yr BP (Sollid<br />
et al. 1973, Andersen et al. 1995). Applying the YD<br />
(ended 10,300 yr BP) ice surface model by Andersen<br />
et al. (1995) and the descend rate <strong>of</strong> 1.25 m/yr <strong>of</strong> the<br />
ice surface, as we estimated with ice-marginal (annual)<br />
meltwater channels, the studied landslides occurred<br />
around 10,180 yr BP in Utsjoki. The retreat<br />
rate <strong>of</strong> the post-YD ice margin was estimated about<br />
80-90 m/yr, hence the area was ice-free by around<br />
9,900 yr BP. The above time frame estimated for<br />
the Utsjoki paleo-landslides is concurrent with the<br />
maximum fault instability in Fennoscandia between<br />
11,000-9,000 yr BP (Wu et al. 1999).<br />
The time-transgressivity <strong>of</strong> the landslides inside<br />
the YDEMs is attributed to maximum crustal<br />
subsidence in the interior part <strong>of</strong> Fennoscandia<br />
(Fjeldskaar et al. 2000; Stewart et al. 2000) and subsequent<br />
fault instability within the glacio-isostatic<br />
recovery (Arvidsson 1996, Wu et al. 1999). Consequently,<br />
the mass-fl ows <strong>of</strong> the <strong>of</strong>fshore sediments in<br />
the Norwegian fjords provides evidence <strong>of</strong> at least<br />
three separate large-magnitude earthquakes affecting<br />
northern and western Norway during the period<br />
<strong>of</strong> 11,700-9,000 yrs. BP (Bøe et al. 2004, Olesen et<br />
al. 2004).<br />
No morphological evidence was found to indicate<br />
that the Rietsamo paleolandslides in Kittilä<br />
were ice-marginal. Hence, those likely fall into<br />
the time-envelope <strong>of</strong> 9,300-9,000 yr BP based on<br />
stratigraphic evidence for the intra-plate PGFs in<br />
the Nordkalott area (Lagerbäck 1992, Dehls et al.<br />
2000), and/or 8,140-6,600 yr BP based on indirect<br />
age-estimates from peat deposits on top <strong>of</strong> the slide<br />
scars (Kujansuu 1972, Lagerbäck 1990). The best<br />
estimate so far are the 14 C-dated fragments <strong>of</strong> subfossil<br />
trees found beneath the landslide materials<br />
yielding age <strong>of</strong> 8,720±170 yrs B.P. (cal 9,730 yr BP)<br />
in Kittilä (Sutinen 2005). These observations indicate<br />
the paleolandslides in Kittilä are younger than<br />
those in Utsjoki and the fault instability associated<br />
with glacio-isostatic recovery was evidently present<br />
at and behind the retreating ice margin <strong>of</strong> the FIS<br />
after the YDEM in a time-transgressive manner.<br />
We thank Aleksi Sutinen for <strong>fi</strong> eld assistance at Riet- samo site and Viena Arvola for editorial help.
Andersen, B. G., Mangerud, J., Sørensen, R., Reite, A.,<br />
Sveian, H., Thoresen, M. & Bergström, B. 1995. Younger<br />
Dryas ice-marginal deposits in Norway. Quaternary International<br />
28, 147–169.<br />
Arvidsson, R. 1996. Fennoscandian earthquakes: whole crustal<br />
rupturing related to postglacial rebound. Science 274,<br />
744–7<strong>46</strong>.<br />
Bøe, R., Longva, O., Lepland, A., Blikra, L. H., Sønstegaard,<br />
E., Hafl idason, H., Bryn, P. & Lien, R. 2004.<br />
Postglacial mass movements and their causes in fl ords and<br />
lakes in western Norway. Norwegian Journal <strong>of</strong> Geology<br />
84, 35–55.<br />
Friele, P. A. & Clague, J. J. 2002. Large Holocene landslides<br />
from Pylon Peak, southwestern British Columbia. Canadian<br />
Journal <strong>of</strong> Earth Sciences 41, 165–182.<br />
Dehls, J. F., Olesen, O., Olsen, L. & Blikra, L. H. 2000. Neotectonic<br />
faulting in northern Norway, the Stuoragurra and<br />
Nordmannvikdalen faults. Quaternary Science Reviews 19,<br />
1447–1<strong>46</strong>0.<br />
Hänninen, P. & Sutinen, R. 1994. Dielectric prediction <strong>of</strong><br />
landslide susceptibility: A model applied to recent sediment<br />
fl ow deposits. In: Oliveira, R., Rodrigues, L. F., Coelho,<br />
A. G. & Punha, A. P. (eds.) Proc. 7th International IAEG<br />
Congress. Rotterdam: Balkema, 137–144.<br />
Keefer, D. K. 2002. Investigating landslides caused by earthquakes<br />
– A historical review. <strong>Survey</strong>s in Geophysics 23,<br />
473–510.<br />
Kujansuu, R. 1964. Nuorista siirroksista Lapissa. Summary:<br />
Recent faults in Lapland. Geologi 16, 30–36.<br />
Kujansuu, R. 1972. On landslides in Finnish Lapland. <strong>Geological</strong><br />
<strong>Survey</strong> <strong>of</strong> <strong>Finland</strong>, Bulletin 256. 22 p.<br />
Lagerbäck, R. 1979. Neotectonic structures in northern Sweden.<br />
Geologiska Föreningens i Stockholm Förhandlingar<br />
100, 263–269.<br />
Lagerbäck, R. 1990. Late Quaternary faulting and paleoseismicity<br />
in northern Fennoscandia with particular reference<br />
to the Landsjärv area, northern Sweden. Geologiska Föreningens<br />
i Stockholm Förhandlingar 112, 333–354.<br />
Lagerbäck, R. 1992. Dating <strong>of</strong> Late Quaternary faulting in<br />
northern Sweden. Journal <strong>of</strong> the <strong>Geological</strong> Society 149,<br />
258–291.<br />
Lundqvist, J. & Lagerbäck, R. 1976. The Pärve Fault: A lateglacial<br />
fault in the Precambrian <strong>of</strong> Swedish Lapland. Geologiska<br />
Föreningens i Stockholm Förhandlingar 98, 45–51.<br />
Lagerbäck, R. & Witschard, F. 1983. Neotectonics in northern<br />
Sweden – geological investigations. SKBF/KBS Technical<br />
Report 83–58. Stockholm: Swedish Nuclear Fuel and<br />
Waste Management Co. 58 p.<br />
Milne, G. A., Davis, J. L., Mitrovica, J. X., Scherneck, H.-<br />
G., Johansson, J. M., Vermeer, M. & Koivula H. 2001.<br />
Space-geodetic constraints on glacial isostatic adjustment<br />
in Fennoscandia. Science 291, 2381–2385.<br />
Nordkalott Project 1987. <strong>Geological</strong> map, Northern Fennoscandia,<br />
1:1 mill. <strong>Geological</strong> <strong>Survey</strong>s <strong>of</strong> <strong>Finland</strong>, Norway<br />
and Sweden.<br />
<strong>Geological</strong> <strong>Survey</strong> <strong>of</strong> <strong>Finland</strong>, <strong>Special</strong> <strong>Paper</strong> <strong>46</strong><br />
Time-transgressive evolution <strong>of</strong> landslides possibly induced by seismotectonic events in Lapland<br />
REFERENCES<br />
Ojala, V. J., Kuivamäki, A. & Vuorela, P. 2004. Postglacial<br />
deformation <strong>of</strong> bedrock in <strong>Finland</strong>. <strong>Geological</strong> <strong>Survey</strong> <strong>of</strong><br />
<strong>Finland</strong>, Nuclear Waster Disposal Research, Report YST-<br />
120. 23 p.<br />
Olesen, O., Blikra, L. H., Braathen, A., Dehls, J. F., Olsen,<br />
L., Rise, L., Roberts, D., Riis, F., Faleide, J. I. & Anda, E.<br />
2004. Neotectonic deformation in Norway and its implications:<br />
a rewiew. Norwegian Journal <strong>of</strong> Geology 84, 3–34.<br />
Penttilä, S. & Kujansuu, R. 1963. Kittilä. General geological<br />
map <strong>of</strong> <strong>Finland</strong> 1:400 000, Quaternary deposits, Sheet 27.<br />
<strong>Geological</strong> <strong>Survey</strong> <strong>of</strong> <strong>Finland</strong>.<br />
Penttinen, S., Sutinen, R. & Hänninen, P. 1999. Determination<br />
<strong>of</strong> anisotropy <strong>of</strong> tills by means <strong>of</strong> azimuthal resistivity<br />
and conductivity measurements. Nordic Hydrology 30,<br />
317–332.<br />
Roberts, D., Olesen, O. & Karpuz, M. R. 1997. Seismo- and<br />
neotectonics in Finnmark, Kola Peninsula and the southern<br />
Barents Sea. Part 1: <strong>Geological</strong> and neotectonic framework.<br />
Tectonophysics 270, 1–13.<br />
Sauck, W. A. & Zabik, S. M. 1992. Azimuthal resistivity techniques<br />
and the directional variations <strong>of</strong> hydraulic conductivity<br />
in glacial sediments. In: Bell, R. S. (ed.) Symposium<br />
on the Application <strong>of</strong> Geophysics to Engineering and Environmental<br />
Problems. Society <strong>of</strong> Engineering and Mining<br />
geophysicists. Golden, Co, 197–222.<br />
Sollid, J. L., Andersen, S., Hamre, N., Kjeldsen, O., Salviksen,<br />
O., Sturød, S., Tveitå, T. & Wilhelmsen, A. 1973.<br />
Deglaciation <strong>of</strong> Finmark, North Norway. Norsk geogra<strong>fi</strong> ska<br />
Tidsskriftningar 27, 233–325.<br />
Sutinen, R. 1992. Glacial deposits, their electrical properties<br />
and surveying by image interpretation and ground<br />
penetrating radar. <strong>Geological</strong> <strong>Survey</strong> <strong>of</strong> <strong>Finland</strong>, Bulletin<br />
359. 123 p.<br />
Sutinen, R. 2005. Timing <strong>of</strong> early Holocene landslides in Kittilä,<br />
Finnish Lapland. <strong>Geological</strong> <strong>Survey</strong> <strong>of</strong> <strong>Finland</strong>, <strong>Special</strong><br />
<strong>Paper</strong> 40, 53–58.<br />
Sutinen R., Teirilä, A., Pänttäjä, M. & Sutinen, M.-L. 2002.<br />
Distribution and diversity <strong>of</strong> tree species with respect to<br />
soil electrical characteristics in Finnish Lapland. Canadian<br />
Journal <strong>of</strong> Forest Research 32: 7, 1158–1170.<br />
Stewart, I. S., Sauber, J. & Rose, J. 2000. Glacio-seismotectonics:<br />
ice sheets, crustal deformation and seismicity. Quaternary<br />
Science Reviews 19, 1367–1389.<br />
Tanner, V. 1930. Studier over kvartärsystemet I Fennoskandias<br />
nordliga delar IV. Bulletin de la Commission géologique de<br />
<strong>Finland</strong>e 88. 594 p.<br />
Taylor, R. W. & Fleming, A. 1988. Characterizing jointed systems<br />
by azimuthal resistivity surveys. Ground Water 26: 4,<br />
<strong>46</strong>4–474.<br />
Wu, P., Johnston, P. & Lambeck, K. 1999. Postglacial rebound<br />
and fault instability in Fennoscandia. Geophysical<br />
Journal International 139, 657–670.<br />
127
128
Applied Quaternary research in the central part <strong>of</strong> glaciated terrain,<br />
edited by Peter Johansson and Pertti Sarala.<br />
<strong>Geological</strong> <strong>Survey</strong> <strong>of</strong> <strong>Finland</strong>, <strong>Special</strong> <strong>Paper</strong> <strong>46</strong>, 129–134, 2007.<br />
GEOLOGICAL EVIDENCE OF THE SEISMICITY IN THE KOLA<br />
REGION DURING THE LATE PLEISTOCENE AND HOLOCENE<br />
by<br />
Vladimir Yevzerov and Svetlana Nikolaeva 1<br />
Yevzerov, V. & Nikolaeva, S. 2007. <strong>Geological</strong> evidence <strong>of</strong> the<br />
seismicity in the Kola region during the Late Pleistocene and<br />
Holocene. Applied Quaternary research in the central part <strong>of</strong> glaciated<br />
terrain. <strong>Geological</strong> <strong>Survey</strong> <strong>of</strong> <strong>Finland</strong>, <strong>Special</strong> <strong>Paper</strong> <strong>46</strong>,<br />
129–134, 2 <strong>fi</strong> gures.<br />
Deglaciation <strong>of</strong> the Kola region during the Late Valdaian<br />
(Weichselian) occurred mainly by separation <strong>of</strong> the vast ice<br />
peripheral covers from the active ice massif and the subsequent<br />
melt <strong>of</strong> dead ice. After last ice advance in the Younger Dryas,<br />
the ice sheet was dissected by extended marine gulfs during the<br />
beginning <strong>of</strong> the Holocene and quickly melted. The ice had the<br />
highest surface gradient in the Older Dryas and deglaciation was<br />
fastest in the area that was covered by the Younger Dryas ice.<br />
Glacioisostatic uplift <strong>of</strong> the Kola region in the western part <strong>of</strong> the<br />
Kola Peninsula was more intensive compared to the eastern part.<br />
Such a tendency prevailed during the end <strong>of</strong> the Late Pleistocene<br />
and Holocene. At the same time, the speed <strong>of</strong> glacioisostatic uplift<br />
decreased everywhere in time, but the uplift proceeds even at<br />
present.<br />
Palaeoseismic dislocations studied using geologic-geomorphologic<br />
methods are expressed in the topography in the form <strong>of</strong><br />
seismic ditches, scarps, gorges, fractures in crystalline rocks and<br />
disturbances in the Quaternary sediment units. Epicentres <strong>of</strong> the<br />
ancient earthquakes basically coincide with epicentres <strong>of</strong> modern<br />
earthquakes and are concentrated on territory that was covered<br />
by active ice with the greatest gradient <strong>of</strong> its surface during the<br />
Older Dryas and, which elevated most intensively after deglaciation<br />
<strong>of</strong> the area. All the data assumes that the main reason for the<br />
seismicity <strong>of</strong> the region is a tension that was caused the glacioisostatic<br />
uplift during and after deglaciation.<br />
Key words (GeoRef Thesaurus, AGI): glacial geology, deglaciation,<br />
neotectonics, glacial rebound, seismicity, Holocene, Pleistocene,<br />
Kola Peninsula, Russian Federation.<br />
1 <strong>Geological</strong> Institute <strong>of</strong> Kola Science Centre, 184209 Apatity,<br />
Fersman str., 14, Russia<br />
E-mail: yevzerov@geoksc.apatity.ru,<br />
nikolaeva@geoksc.apatity.ru<br />
129
<strong>Geological</strong> <strong>Survey</strong> <strong>of</strong> <strong>Finland</strong>, <strong>Special</strong> <strong>Paper</strong> <strong>46</strong><br />
Vladimir Yevzerov and Svetlana Nikolaeva<br />
Subsidence <strong>of</strong> the Earth’s crust took place during<br />
glaciations, resulting from an increase in ice loading.<br />
The subsidence was followed by uplift during<br />
and after deglaciation. The glacial loading and unloading<br />
results a deep-seated viscoelastic response<br />
<strong>of</strong> the crust and produces faulting and earthquakes<br />
130<br />
INTRODUCTION<br />
in its upper part (Stewart et al. 2000). The present<br />
article focuses on the seismic activity <strong>of</strong> the Kola<br />
region, which, in our opinion, is connected to deglaciation<br />
<strong>of</strong> the Late Valdaian ice sheets. The Murmansk<br />
district and adjacent areas <strong>of</strong> the shelves <strong>of</strong><br />
the Barents and White seas are also discussed.<br />
DEGLACIATION AND GLACIOISOSTATIC UPLIFT<br />
In the Kola region, the Late Valdaian ice sheet<br />
reached its maximum extent 16,000–17,000 years<br />
BP. It had a low gradient surface during the maximum<br />
extent and the whole period <strong>of</strong> deglaciation.<br />
A low surface gradient was caused by an occurrence<br />
<strong>of</strong> peripheral parts <strong>of</strong> the ice cover on a low<br />
plain covered by friable water-saturated sediments<br />
similar to those lying on the modern continent and<br />
shelf. The presence <strong>of</strong> the water-saturated friable<br />
substratum on the glacier bed essentially reduced<br />
the resistance <strong>of</strong> ice movement at the contact between<br />
ice and bed and resulted in a slight inclination<br />
<strong>of</strong> the glacier’s surface. Degradation <strong>of</strong> the ice<br />
sheets took place during cyclic climatic variations<br />
<strong>of</strong> different ranks (cf. Alm & Vorren 1990, Lehman<br />
& Keigwin 1992). Each variation took place within<br />
500 to 2000 years including a rather fast warming<br />
and a subsequent gradual cooling. During interstadial<br />
warm events, the surface gradient <strong>of</strong> glacial ice<br />
was low and extensive peripheral ice margins were<br />
cut <strong>of</strong>f from the main active ice mass (Yevzerov<br />
1998). During the same warm periods, the edge <strong>of</strong><br />
the dynamically active ice was in contact with rising<br />
or already existing periglacial water basins under<br />
favourable geomorphological conditions. The high<br />
heat capacity <strong>of</strong> water promoted a fast juxtaposition<br />
<strong>of</strong> the active ice margin with the line <strong>of</strong> zero glacier<br />
mass balance and a long preservation <strong>of</strong> the stable<br />
ice margin’s position. Conditions for accumulation<br />
<strong>of</strong> thick glaci<strong>of</strong>l uvial deposits were created at the<br />
ice front that terminated in water. Subsequently, after<br />
a complete disappearance <strong>of</strong> ice, these deposits<br />
are shown in the relief as dump moraine ridges, the<br />
so-called marginal eskers. dead ice melting was ongoing<br />
for a long time including several interstadial<br />
warmings. The glacier that advanced again during<br />
the phases <strong>of</strong> stadial coolings deformed interstadial<br />
deposits and built mainly push moraine ridges. Thus,<br />
a marginal belt was formed during each interstadial-stadial<br />
climatic cycle at the edge <strong>of</strong> active ice,<br />
which consists <strong>of</strong> two bands <strong>of</strong> marginal ridges: the<br />
inner band – a dump moraine, and the outer band – a<br />
push moraine. Three marginal belts (I, II, III) were<br />
formed during the period between the Last Glacial<br />
Maximum and the Preboreal in the Kola region.<br />
Based on the results <strong>of</strong> palaeogeographic research,<br />
the formation <strong>of</strong> belt III occurred in connection<br />
with the warming that took place between 14,700<br />
and 16,100 years BP and the subsequent cooling in<br />
an interval from ~14,700 up to 13,400–12,900 years<br />
BP. Formation <strong>of</strong> marginal belts II and I correspond<br />
to climatic rhythms <strong>of</strong> the Bølling - Older Dryas<br />
and Allerød - Younger Dryas, respectively (Yevzerov<br />
1998). The ice surface in the Older Dryas had<br />
the greatest ice surface gradient. After the last ice<br />
advance in the Younger Dryas, the ice sheet was dissected<br />
by extended marine gulfs during the warming<br />
at the beginning <strong>of</strong> the Holocene. In these gulfs,<br />
glaciomarine sediments were followed by marine<br />
deposits, probably due to the <strong>fi</strong> nal ice melting about<br />
9,000 years BP. The deglaciation was fastest in the<br />
territory occupied by the Younger Dryas ice cover.<br />
Glacioisostatic uplift <strong>of</strong> the Kola region was<br />
a consequence <strong>of</strong> deglaciation. Isolation basins<br />
were studied in locations limited in area at different<br />
heights between the high marine limit and the<br />
modern seacoast. The deposits <strong>of</strong> marine- lacustrine<br />
or lacustrine-marine transitions have been studied<br />
in holes’ cores, with subsequent diatomic analysis.<br />
Samples from transitional zones were dated using<br />
the radiocarbon method. Diagrams <strong>of</strong> the sea<br />
coastline movement were then reconstructed from<br />
the dating results and high-altitude positions <strong>of</strong><br />
isolation basins thresholds. The work on the three<br />
locations on the Barents Sea and the three locations<br />
on the White Sea coasts <strong>of</strong> the Kola Peninsula were
completed. The diagrams allowed for the construction<br />
<strong>of</strong> isobases for the territorial rise. The arrangement<br />
<strong>of</strong> isobases for the last 9,000 years and all the<br />
locations studied are shown in Fig. 1.<br />
Fig. 1. Scheme isobases <strong>of</strong> the Kola region for the last<br />
approximately 9,000 years (on the data V. Yevzerov, V.<br />
Kolka, J. Møller, D. Corner; Snyder et al. 1997) 1-6 sites <strong>of</strong><br />
investigations. On setting a modern rising <strong>of</strong> the Kola region<br />
in mm\year is shown (Andersen & Borns 1994).<br />
<strong>Geological</strong> <strong>Survey</strong> <strong>of</strong> <strong>Finland</strong>, <strong>Special</strong> <strong>Paper</strong> <strong>46</strong><br />
<strong>Geological</strong> evidence <strong>of</strong> the seismicity in the Kola region during the Late Pleistocene and Holocene<br />
The Kola Peninsula, as an element <strong>of</strong> the northwestern<br />
Baltic Shield, is not a high-seismicity region at<br />
present. This has not always been the case as is seen<br />
in palaeoseismic deformation structures refl ecting<br />
strong earthquakes. These were observed during<br />
the geological-geomorphological investigations<br />
and the analysis <strong>of</strong> air photos (Nikolaeva 2001).<br />
Palaeoseismic deformations are expressed in the<br />
topography as seismic ditches, scarps, gorges, fractures<br />
in crystalline rocks and disturbances <strong>of</strong> Quaternary<br />
sediment structures. These dislocations are<br />
accompanied by such phenomena as collapses, rock<br />
pillars, rock falls, empty niches (blocks displaced<br />
away) and other seismic signatures, which are not<br />
found outside seismogenous structures, and are con<strong>fi</strong><br />
ned to active fault zones. Deformations in incoherent<br />
sediments provoked by modern earthquakes are<br />
known not only in seismoactive regions, but also in<br />
territories <strong>of</strong> moderate seismicity, such as Canada,<br />
Sweden, Norway and <strong>Finland</strong>.<br />
Recently, special studies have been carried out to<br />
de<strong>fi</strong> ne different types <strong>of</strong> deformations in Quaternary<br />
sediments exposed in quarries and natural outcrops<br />
SEISMICITY<br />
This rise most likely had a dome-shaped form;<br />
the western part <strong>of</strong> the Kola Peninsula rose more<br />
intensively than the eastern one. Such a tendency<br />
prevailed during the end <strong>of</strong> the Late Pleistocene<br />
and Holocene. At the same time, the speed <strong>of</strong> uplift<br />
decreased in time everywhere, but nevertheless the<br />
raising continues today as well. It is not dif<strong>fi</strong> cult to<br />
see that the nature <strong>of</strong> the rise has not changed until<br />
the present, which probably indicates that glacioisostatics<br />
has been present up to now. <strong>Geological</strong> data<br />
and theoretical calculations also testify to this suggestion.<br />
There is reason to believe that the territory<br />
examined should still be lifted by approximately 40-<br />
60 m. Buried mouths <strong>of</strong> big river valleys are located<br />
at the negative marks <strong>of</strong> such an order. These valleys<br />
were generated probably during the Pliocene. Their<br />
present position is most likely caused by the fact<br />
that the isostatic balance had no time to be restored<br />
during the rather short intervals <strong>of</strong> the Quaternary<br />
interglacials as the constant relaxation considerably<br />
exceeded the generally accepted one for several<br />
thousands years.<br />
along river banks in the northwestern Kola region<br />
and to discriminate these sediments from those related<br />
to glaciotectonic structures. All palaeoseismic<br />
deformations were formed during the late-glacial<br />
and post-glacial periods. Previously, we established<br />
that a strong earthquake occurred in the vicinity <strong>of</strong><br />
Murmansk about 8,950±150 ca BP (Yevzerov &<br />
Nikolaeva 1995). This age value characterizes the<br />
initial stage <strong>of</strong> organic matter accumulation in a<br />
lake formation that was related to the damming <strong>of</strong><br />
a small creek valley by landslides after the earthquake.<br />
A similar age for a seismic event (8,720±170<br />
ca BP) was obtained in Finnish Lapland (Sutinen<br />
2005). Seismogenic deformations were found in<br />
postglacial marine sediments in the Pechenga river<br />
valley (Nikolaeva 2006). The age <strong>of</strong> this seismic<br />
event was determined using the radiocarbon method<br />
on sea shells. The deformations occurred earlier<br />
than 8,500-8,700 ca BP. This period corresponds to<br />
the Boreal warm climatic phase that excludes any<br />
infl uence <strong>of</strong> glaciers or cryogenic processes on the<br />
deformation <strong>of</strong> sediments. Thus, the available data<br />
indicates that at least two seismic events occurred<br />
131
<strong>Geological</strong> <strong>Survey</strong> <strong>of</strong> <strong>Finland</strong>, <strong>Special</strong> <strong>Paper</strong> <strong>46</strong><br />
Vladimir Yevzerov and Svetlana Nikolaeva<br />
in the Holocene. Characteristic features <strong>of</strong> the morphology,<br />
dimensions and types <strong>of</strong> the palaeoseismic<br />
deformations allow us to conclude that the intensity<br />
<strong>of</strong> earthquakes (I) was no less then 7 and possibly 8<br />
or greater according to the MSK-64 scale.<br />
A scheme <strong>of</strong> ancient earthquake epicenters<br />
(Fig. 2) was made on the basis <strong>of</strong> geological data<br />
and air photo interpretation. Seismic dislocations<br />
directly indicate residual tectonic deformations in<br />
the epicenter zones <strong>of</strong> ancient earthquakes, which<br />
are largely concentrated in the west and centre<br />
<strong>of</strong> the Kola Peninsula. The epicenters <strong>of</strong> ancient<br />
earthquakes and the epicenters <strong>of</strong> most historical<br />
and recent earthquakes coincide, which testi<strong>fi</strong> es to<br />
the inherited nature <strong>of</strong> historical and recent earthquakes.<br />
The epicenters are concentrated in the area<br />
that was occupied by active ice during the Older and<br />
Younger Drays.<br />
The existing knowledge <strong>of</strong> seismicity <strong>of</strong> the<br />
region corresponds to a short-term period <strong>of</strong> instrumental<br />
and macroseismic observations. The<br />
instrumental measurements have been carried since<br />
1956 when the seismic station “Apatity” started to<br />
work. For this period, the region was subjected to<br />
earthquakes with intensities <strong>of</strong> 3-4 and locally up<br />
to 5. Seismic activity zones are situated in the Kandalaksha<br />
Gulf, on the Murmansk Coast, especially<br />
in the Kola Bay area, and in the Khibiny Mountains.<br />
Information about historical earthquakes is recorded<br />
in archival documents, annals and newspaper publications.<br />
Such events have been known on the Kola<br />
Peninsula since the 17th century. The strongest<br />
The pr<strong>of</strong>i le <strong>of</strong> the Late Weichselian ice sheet had a<br />
low gradient in the Kola region. Therefore, an areal<br />
type <strong>of</strong> deglaciation dominated for a long time. A<br />
dissecting type <strong>of</strong> deglaciation took place only in<br />
the Holocene. The epicenters <strong>of</strong> ancient and modern<br />
earthquakes mainly occupy the territory that was<br />
covered by active ice during the last stages <strong>of</strong> deglaciation<br />
and was glacioisostatically uplifted with the<br />
greatest speed after deglaciation. Such a distribution<br />
<strong>of</strong> dislocations is probably explained by the highest<br />
ice surface gradient <strong>of</strong> the area that was covered<br />
132<br />
CONCLUSION<br />
Fig.2. Scheme showing the density <strong>of</strong> residual deformations,<br />
the epicenters <strong>of</strong> modern earthquakes and the disposition <strong>of</strong><br />
the edge <strong>of</strong> active ice in the Kola region. Residual deformation<br />
density distribution scale (numerals indicate the number<br />
<strong>of</strong> residual deformations over an area <strong>of</strong> 15x15 km): 1 – 1-3,<br />
2 – 3-5, 3 – 5-7, 4 >7; epicenters <strong>of</strong> 1542-2002 earthquakes,<br />
magnitude M: 5 - ≥5.1; 6 -4.1-5.0; 7 -3.1-4.0; 8 - ≤3. The<br />
disposition <strong>of</strong> the edge <strong>of</strong> active ice is shown by a dotted line<br />
(during the Younger Dryas) and continuous line (during the<br />
Older Dryas).<br />
historical earthquake took place in the Kandalaksha<br />
Gulf in 1627 with intensity 8 on the MSK-64 scale.<br />
It is possible to assume that the seismicity <strong>of</strong> the<br />
study region was, at that time, substantially higher<br />
than today.<br />
by active ice during the Older Dryas and by fast<br />
deglaciation <strong>of</strong> the territory occupied by active ice<br />
during the Younger Dryas. The general character <strong>of</strong><br />
the glacioisostatic uplift has not changed until now<br />
and the elevation continues though its speed was<br />
considerably reduced. Modern and historical earthquakes<br />
are mainly inherited. All these data suggest<br />
that the main reason for the seismicity <strong>of</strong> the region<br />
is stress resulting from the glacioisostatic uplift <strong>of</strong><br />
the Earth’s crust during the deglaciation and postglacial<br />
period.
<strong>Geological</strong> <strong>Survey</strong> <strong>of</strong> <strong>Finland</strong>, <strong>Special</strong> <strong>Paper</strong> <strong>46</strong><br />
<strong>Geological</strong> evidence <strong>of</strong> the seismicity in the Kola region during the Late Pleistocene and Holocene<br />
This research was supported by programme 16-2<br />
<strong>of</strong> the Presidium <strong>of</strong> the RAS, project 5.5 “Evolution<br />
<strong>of</strong> the relief and deposits <strong>of</strong> the Kola Region<br />
Alm, T. & Vorren, K.-D. 1990. Klima og vegetasion i Nord-<br />
Norge i de siste 22000 år. Polarfl okken 14, 109–115.<br />
Andersen, B. G. & Borns, H. W. 1994. The Ice Ace World.<br />
Scandinavian University press. 208 p.<br />
Lehman, S. J. & Keigwin, L. D. 1992. Sudden changes in<br />
North Atlantic circulation during the last deglaciation. Nature<br />
356, 757–762.<br />
Nikolaeva, S. B. 2001. Palaeoseismic dislocations <strong>of</strong> the northeastern<br />
part <strong>of</strong> the Baltic shield and their geological-tectonical<br />
position. Geomorphology 4, 66–74. (in Russian)<br />
Nikolaeva, S. B. 2006. Seismogenic Deformations in Early<br />
Holocene Sediments <strong>of</strong> the Pechenga River Terrace (Kola<br />
Peninsula). Doklady Earth Sciences 406: 1, 4–7.<br />
Snyder, J. A., Forman, S. L., Mode, W. N. & Tarasov, G. A.<br />
1997. Postglacial relative sea-level history: sediment and<br />
diatom records <strong>of</strong> emerged coastal lakes, north-central Kola<br />
Peninsula, Russia. Boreas 26, 329–3<strong>46</strong>.<br />
ACKNOWLEDGEMENTS<br />
REFERENCES<br />
in the Holocene” and by grant RFBR number 07-<br />
05-96906.<br />
Stewart, L. S., Sauber, J. & Rose, J. 2000. Glacio-seismotectonics:<br />
ice sheets, crustal deformation and seismicity. Quaternary<br />
Science Reviews 19, 1367–1389.<br />
Sutinen, R. 2005. Timing <strong>of</strong> early Holocene landslides in Kittilä,<br />
Finnish Lapland. In: Ojala, A. E. K. (ed.) Quaternary<br />
studies in the northern and Arctic regions <strong>of</strong> <strong>Finland</strong>. <strong>Geological</strong><br />
<strong>Survey</strong> <strong>of</strong> <strong>Finland</strong>, <strong>Special</strong> <strong>Paper</strong> 40, 53–58.<br />
Yevzerov, V. Y. 1998. Deglaciation <strong>of</strong> the Kola Peninsula and<br />
the Belomorian depression. In: Abstract <strong>of</strong> second Quaternary<br />
Environment <strong>of</strong> the Eurasian North (QUEEN) workshop,<br />
Saint Petersburg, 55.<br />
Yevzerov, V. Ya. & Nikolaeva, S. B. 1995. Cenozoic. In:<br />
Mitr<strong>of</strong>anov, F. P. (ed.) Geology <strong>of</strong> the Kola Peninsula (Baltic<br />
shield). Apatity, 107–115.<br />
133
134
Applied Quaternary research in the central part <strong>of</strong> glaciated terrain,<br />
edited by Peter Johansson and Pertti Sarala.<br />
<strong>Geological</strong> <strong>Survey</strong> <strong>of</strong> <strong>Finland</strong>, <strong>Special</strong> <strong>Paper</strong> <strong>46</strong>, 135–140, 2007.<br />
LITHOLOGICAL CONTRIBUTION TO HYDRAULIC PROPERTIES OF<br />
TILLS: INTER-SEASONAL DIELECTRIC ASSESSMENT<br />
by<br />
Raimo Sutinen 1 , Matti Piekkari 1 , Aki Tepsa 2 , Markku Virtanen 1 and Pekka Hänninen 3<br />
Sutinen, R., Piekkari, M., Tepsa, A., Virtanen, M. & Hänninen. P.<br />
2007. Lithological contribution to hydraulic properties <strong>of</strong> tills: interseasonal<br />
dielectric assessment. Applied Quaternary research in the<br />
central part <strong>of</strong> glaciated terrain. <strong>Geological</strong> <strong>Survey</strong> <strong>of</strong> <strong>Finland</strong>, <strong>Special</strong><br />
<strong>Paper</strong> <strong>46</strong>, 135–140, 5 <strong>fi</strong> gures.<br />
Composition, particle-size distribution and clay mineralogy <strong>of</strong> tills<br />
are associated with the lithology <strong>of</strong> source rock types and the mode <strong>of</strong><br />
deposition beneath continental ice sheets. The infl uence <strong>of</strong> lithological<br />
characteristics on hydraulic properties, particularly on the spatio-temporal<br />
variation <strong>of</strong> water content in tills, however, has remained obscure.<br />
Inter-seasonal monitoring <strong>of</strong> the dielectric properties <strong>of</strong> tills (εTILL) with<br />
varying composition in lithology and particle-size distribution was<br />
carried out from 1995 to 2003 in Finnish Lapland. Two sites were selected<br />
on the basis <strong>of</strong> similarity in climatic conditions, but dissimilarity<br />
in lithology (felsic granite gneiss-ma<strong>fi</strong> c chlorite-amphibole schist)<br />
and texture (sandy till-silty till), respectively. Inter-annual monitoring<br />
demonstrated that the variation in unfrozen soil water content <strong>of</strong> tills<br />
followed climatic events, but snowmelt was the major contributor to<br />
the intra-seasonal εTILL. The increase in εTILL was initiated by meltwater<br />
released from snowpack from two weeks to more than three weeks before<br />
the disappearance <strong>of</strong> snow in both cases. However, the response <strong>of</strong><br />
snowmelt to εTILL was clearly site and texture-speci<strong>fi</strong> c, such that maximum<br />
εTILL-peak for sandy till occurred several weeks before εTILL-peak <strong>of</strong><br />
silty till. The timing difference <strong>of</strong> a month was observed between the<br />
latest spring (1996) and earliest springs (2002, 2003). The intra- and<br />
inter-seasonal soil εTILL was signi<strong>fi</strong> cantly lower (F=810, p=0) in sandy<br />
till than that in silty till. Even the maximum εTILL <strong>of</strong> the sandy site was<br />
minor to minimum for the silty site. It was found that the mean interseasonal<br />
εTILL=7.0±1.36 applies to sandy till and εTILL=24.4±6.56 to silty<br />
till, respectively. We estimated (99% con<strong>fi</strong> dence) that the inter-seasonal<br />
mean <strong>of</strong> sandy till varies between 6.7
<strong>Geological</strong> <strong>Survey</strong> <strong>of</strong> <strong>Finland</strong>, <strong>Special</strong> <strong>Paper</strong> <strong>46</strong><br />
Raimo Sutinen, Matti Piekkari, Aki Tepsa, Markku Virtanen and Pekka Hänninen<br />
The vadose zone (<strong>fi</strong> eld saturated) hydraulic conductivity<br />
(K f) <strong>of</strong> tills is attributed to lithological<br />
features, such that high K f is typical in tills with<br />
a sandy matrix in regions <strong>of</strong> felsic granitoids or<br />
granite gneisses, while low K f is found typically in<br />
tills derived from ma<strong>fi</strong> c rocks <strong>of</strong> the greenstone belt<br />
in Finnish Lapland (Sutinen et al. 1998, Penttinen<br />
2000). A signi<strong>fi</strong> cant correlation has been found between<br />
the dielectric properties and soil volumetric<br />
water content (θv) <strong>of</strong> glacial drift materials (Sutinen<br />
1992). Also, a signi<strong>fi</strong> cant correlation has been found<br />
between dielectric values and log-K f for tills (Sutinen<br />
et al. 1998, Penttinen 2000). Thus, dielectric<br />
measurements and monitoring reveal differences in<br />
water regimes and hydraulic properties <strong>of</strong> tills derived<br />
from various lithologies.<br />
The soil θv is infl uenced by soil texture, structure<br />
and topographic curvature (Vachaud et al. 1985,<br />
Sutinen 1992, Hänninen 1997), but climatic factors<br />
primarily contribute to the temporal variation <strong>of</strong><br />
intra- and inter-seasonal θv (Solantie 1987). Similar<br />
Previous studies have indicated a signi<strong>fi</strong> cant correlation<br />
between dielectric properties and soil<br />
volumetric water content (θv) <strong>of</strong> glacial drift<br />
materials (r s =0.98, P
Fig. 2. Study sites<br />
Juolkusselkä (J) and<br />
Vaalolehto (V) in Finnish<br />
Lapland. LGB=Lapland<br />
greenstone belt, LG=<br />
Laplan granulite belt, TB=<br />
Tanaelv belt.<br />
69 N<br />
particle-size distribution in Finnish Lapland with<br />
inter-seasonal monitoring <strong>of</strong> dielectric properties.<br />
Two sites, Juolkusselkä (68°02’N and 26°26’E) and<br />
Vaalolehto (67°50’N and 26°41’E; see locations in<br />
Fig. 2), were selected for comparison on the basis<br />
<strong>of</strong> similarity in climatic conditions, but dissimilarity<br />
in lithology (felsic granite gneiss-ma<strong>fi</strong> c chloriteamphibole<br />
schist; see lithology in Lehtonen et al.<br />
(1998)) and texture (sandy till-silty till; Fig. 3), as<br />
well as forest composition (pine-spruce), respectively.<br />
According to Haavisto (1983), <strong>fi</strong> ne-grained<br />
tills (silty tills) contain more than 5% <strong>of</strong> clay fraction<br />
and more than 30% <strong>of</strong> <strong>fi</strong> nes (i.e. silt and clay<br />
fraction).<br />
To minimize sediment deformations during the<br />
monitoring, a permanent instrumentation <strong>of</strong> till<br />
sequences was applied. The design included transmission<br />
lines (parallel 15-cm-long steel probes<br />
with 6-cm-spacings) inserted horizontally into the<br />
till sequences (Sutinen et al. 1997). Recording <strong>of</strong><br />
the dielectric values conducted with time domain<br />
refl ectometer (TDR, Tektronix 1502B, Beaverton,<br />
OR, USA) on a weekly basis through 1995–2003.<br />
<strong>Geological</strong> <strong>Survey</strong> <strong>of</strong> <strong>Finland</strong>, <strong>Special</strong> <strong>Paper</strong> <strong>46</strong><br />
Lithological contribution to hydraulic properties <strong>of</strong> tills: inter-seasonal dielectric assessment<br />
L<br />
O P<br />
K M<br />
LGB<br />
27 E<br />
LG<br />
69 N<br />
67 N LGB 67 N<br />
J<br />
V<br />
S<br />
LG<br />
TB<br />
Fig. 3. Silty till (<strong>fi</strong> ne-fraction content 52%) at the Vaalolehto<br />
study site.<br />
137
<strong>Geological</strong> <strong>Survey</strong> <strong>of</strong> <strong>Finland</strong>, <strong>Special</strong> <strong>Paper</strong> <strong>46</strong><br />
Raimo Sutinen, Matti Piekkari, Aki Tepsa, Markku Virtanen and Pekka Hänninen<br />
Texture effect<br />
Inter-annual (period 1996–2003 shown in Figs. 4-5)<br />
monitoring demonstrated that variation in unfrozen<br />
soil water content <strong>of</strong> tills followed climatic events,<br />
but snowmelt was the major contributor to the intra-seasonal<br />
ε TIL . The increase in ε TIL was initiated<br />
by meltwater released from the snowpack over two<br />
weeks to more than three weeks before the snow<br />
disappearance in both cases. However, the response<br />
<strong>of</strong> snowmelt to the ε TIL was clearly site and texturespeci<strong>fi</strong><br />
c, such that the intra- and inter-seasonal soil<br />
ε TILL was signi<strong>fi</strong> cantly lower (F=810, p=0) in sandy<br />
till than in silty till. Even the maximum soil water<br />
content at Juolkusselkä site was minor to that <strong>of</strong> the<br />
minimum at the Vaalolehto site. It was found that<br />
mean inter-seasonal ε TIL =7.0±1.36 applies to sandy<br />
till and v=24.4±6.56 to silty till, respectively. We<br />
estimated (99% con<strong>fi</strong> dence) that the inter-seasonal<br />
mean <strong>of</strong> sandy till varies between 6.7< ε TIL
dielectric value<br />
dielectric value<br />
45<br />
40<br />
35<br />
30<br />
25<br />
20<br />
15<br />
10<br />
5<br />
0<br />
45<br />
40<br />
35<br />
30<br />
25<br />
20<br />
15<br />
10<br />
5<br />
0<br />
<strong>Geological</strong> <strong>Survey</strong> <strong>of</strong> <strong>Finland</strong>, <strong>Special</strong> <strong>Paper</strong> <strong>46</strong><br />
Lithological contribution to hydraulic properties <strong>of</strong> tills: inter-seasonal dielectric assessment<br />
Juolkusselkä<br />
0 30 60 90 120 150 180<br />
DOY<br />
210 240 270 300 330 360<br />
Vaalolehto<br />
0 30 60 90 120 150 180<br />
DOY<br />
210 240 270 300 330 360<br />
1996<br />
1999<br />
2000<br />
2001<br />
2002<br />
2003<br />
Fig. 4. Annual variation <strong>of</strong> the dielectric values <strong>of</strong> sandy till at the Juolkusselkä site presented<br />
separately for the years 1995-2003. Note difference between the onsets <strong>of</strong> water percolation through<br />
frozen soil (soil temperature
<strong>Geological</strong> <strong>Survey</strong> <strong>of</strong> <strong>Finland</strong>, <strong>Special</strong> <strong>Paper</strong> <strong>46</strong><br />
Raimo Sutinen, Matti Piekkari, Aki Tepsa, Markku Virtanen and Pekka Hänninen<br />
Boike, J., Roth, K. & Overduin, P. P. 1988. Thermal and hydrologic<br />
dynamics <strong>of</strong> the active layer at a continuous permafrost<br />
site (Taymyr Peninsula, Siberia). Water Resources<br />
Research 34:3, 355–363.<br />
Haavisto, M. 1983. Maaperäkartan käyttöopas 1:20 000,<br />
1:50 000. <strong>Geological</strong> <strong>Survey</strong> <strong>of</strong> <strong>Finland</strong>, Guide 10. 80 p.<br />
Hagberg, M. 2001. Electrical classi<strong>fi</strong> cation <strong>of</strong> glacial deposits<br />
<strong>of</strong> timberline tree species in western Finnish Lapland.<br />
M.Sc. Thesis, University <strong>of</strong> Oulu, <strong>Finland</strong>. 74 p.<br />
Hänninen, P. 1997. Dielectric coef<strong>fi</strong> cient surveying for overburden<br />
classi<strong>fi</strong> cation. <strong>Geological</strong> <strong>Survey</strong> <strong>of</strong> <strong>Finland</strong>, Bulletin<br />
396. 72 p.<br />
Hänninen, P. & Sutinen, R. 1994. Dielectric prediction <strong>of</strong><br />
landslide susceptibility: a model applied to recent sediment<br />
fl ow deposits. In: Oliveira, R. et al. (eds.) Proceedings.<br />
Seventh international congress International Association <strong>of</strong><br />
Engineering Geology, 5–9 September 1994, Lisboa, Portugal.<br />
Vol. 1: Developments in site investigation and in engineering<br />
geological mapping. Rotterdam: A. A. Balkema,<br />
137–144.<br />
Hinkel, K. M., Outcalt, S. I. & Taylor, A. E. 1997. Seasonal<br />
patterns <strong>of</strong> coupled fl ow in the active layer at three sites in<br />
northwest North America. Canadian Journal <strong>of</strong> Earth Sciences<br />
34, 667–678.<br />
Hinkel, K. M., Paetzold, F., Nelson, F. E. & Bockheim, J. G.<br />
2001. Patterns <strong>of</strong> soil temperature and moisture in the active<br />
layer and upper permafrost at Barrow, Alaska: 1993–1999.<br />
Global and Planetary Change 29, 293–309.<br />
Hyvönen, E., Pänttäjä, M., Sutinen, M.-L. & Sutinen, R.<br />
2003. Assessing site suitability for Scots pine using airborne<br />
and terrestrial gamma-ray measurements in Finnish Lapland.<br />
Canadian Journal <strong>of</strong> Forest Research 33, 796–806.<br />
Kane, D. L., Hinkel, K. M., Goering, D. J., Hinzman, L. D.<br />
& Outcalt, S. I. 2001. Non-conductive heat transfer associated<br />
with frozen soils. Global and Planetary Change 29,<br />
275–292.<br />
Lehtonen, M., Airo, M.-L., Eilu, P., Hanski, E., Kortelainen,<br />
V., Lanne, E., Manninen, T., Rastas, P., Räsänen, J. &<br />
Virransalo, P. 1998. Kittilän vihreäkivialueen geologia.<br />
Lapin vulkaniittiprojektin raportti. Summary: The statigraphy,<br />
petrology and geochemistry <strong>of</strong> the Kittilä Greenstone<br />
area, northern <strong>Finland</strong>. A report <strong>of</strong> the Lapland Volcanite<br />
Project. <strong>Geological</strong> <strong>Survey</strong> <strong>of</strong> <strong>Finland</strong>, Report <strong>of</strong> Investigations<br />
140. 144 p.<br />
140<br />
REFERENCES<br />
Leenders, E. E. & Woo, M.-K. 2002. Modeling a two-layer<br />
fl ow system at the subarctic, subalpine tree line during<br />
snowmelt. Water Resources Research 38: 10, 201–208.<br />
Penttinen, S. 2000. Electrical and hydraulic classi<strong>fi</strong> cation <strong>of</strong><br />
forest till soils in Central Lapland. <strong>Geological</strong> <strong>Survey</strong> <strong>of</strong><br />
<strong>Finland</strong>, Bulletin 398. 88 p.<br />
Ruther, A. 1999. Electromagnetic characteristics <strong>of</strong> forest till<br />
soils on Norway spruce timberline in Finnish Lapland.<br />
M.Sc. Thesis, University <strong>of</strong> Vienna, Austria. 55 p.<br />
Salmela, S., Sutinen, R. & Sepponen, P. 2001. Understorey<br />
vegetation as an indicator <strong>of</strong> water content in till soils in<br />
Finnish Lapland. Scandinavian Journal <strong>of</strong> Forest Research<br />
16, 331–341.<br />
Solantie, R. 1987. Seasonal water balance components in hydrological<br />
regionalization. Aqua Fennia 17:2, 133–145.<br />
Sutinen, R. 1992. Glacial deposits, their electrical properties<br />
and surveying by image interpretation and ground penetrating<br />
radar. <strong>Geological</strong> <strong>Survey</strong> <strong>of</strong> <strong>Finland</strong>, Bulletin 359. 123<br />
p.<br />
Sutinen R., Hänninen P., Mäkitalo K., Penttinen S. & Sutinen<br />
M.-L. 1997. Snowmelt saturation restricts Scots pine<br />
growth on <strong>fi</strong> ne-grained tills in Lapland. CRREL <strong>Special</strong><br />
Report 97–10, 507–512.<br />
Sutinen, R., Hyvönen, E., Hänninen, P., Mäkitalo, K., Penttinen,<br />
S. & Sutinen, M.-L. 1998. Classi<strong>fi</strong> cation <strong>of</strong> forest<br />
soils using dielectric and gamma-ray moisture detection.<br />
In: Saarikko, J. (ed.) Resource Technology ’98 Nordic: international<br />
symposium on advanced technology in environmental<br />
and natural resources, June 8–12, 1998, Rovaniemi,<br />
<strong>Finland</strong>. Finnish Forest Research Institute 31, 1–10.<br />
Sutinen, R., Teirilä, A., Pänttäjä, M. & Sutinen, M.-L. 2002.<br />
Distribution and diversity <strong>of</strong> tree species with respect to<br />
soil electrical characteristics in Finnish Lapland. Canadian<br />
Journal <strong>of</strong> Forest Research 32: 7, 1158–1170.<br />
Sutinen, R., Middleton, M., Hänninen, P., Vartiainen,<br />
S., Venäläinen, A. & Sutinen, M.-L. 2006. Dielectric<br />
constant time stability <strong>of</strong> glacial till at a clear-cut site. Geoderma<br />
141, 311–319.<br />
Vachaud, G., de Silans, A. P., Balabanis, B. & Vauclin, M.<br />
1985. Temporal stability <strong>of</strong> spatially measured soil water<br />
probability density function. Soil Science Society <strong>of</strong> America<br />
Journal 49, 822–828.
Applied Quaternary research in the central part <strong>of</strong> glaciated terrain,<br />
edited by Peter Johansson and Pertti Sarala.<br />
<strong>Geological</strong> <strong>Survey</strong> <strong>of</strong> <strong>Finland</strong>, <strong>Special</strong> <strong>Paper</strong> <strong>46</strong>, 141–1<strong>46</strong>, 2007.<br />
THE URBAN GEOLOGY OF TARTU, ESTONIA<br />
by<br />
Volli Kalm 1<br />
Kalm, V. 2007. The urban geology <strong>of</strong> Tartu, Estonia. Applied<br />
Quaternary research in the central part <strong>of</strong> glaciated terrain. <strong>Geological</strong><br />
<strong>Survey</strong> <strong>of</strong> <strong>Finland</strong>, <strong>Special</strong> <strong>Paper</strong> <strong>46</strong>, 141–1<strong>46</strong>, 3 <strong>fi</strong> gures.<br />
The territory <strong>of</strong> the City <strong>of</strong> Tartu is affected by different<br />
natural and human-induced urban geological phenomena, which<br />
have been studied since 2003. Subsidence <strong>of</strong> soils and buildings,<br />
strong fl uctuations in the groundwater level, contamination <strong>of</strong><br />
the cultural layer and soils and other undesirable processes are<br />
mostly restricted to the oldest city quarters, located on the fl oodplain<br />
<strong>of</strong> the Suur-Emajõgi river. The highest rate <strong>of</strong> subsidence<br />
<strong>of</strong> buildings located on the fl oodplain occurred at the time <strong>of</strong> the<br />
most intensive groundwater consumption from the Quaternary<br />
aquifer. Natural deposits <strong>of</strong> the city territory are covered by a 0.1-<br />
12 m thick (mainly 2-3 m) cultural layer that in the city centre is<br />
heavily contaminated with lead, zinc and copper.<br />
Key words (GeoRef Thesaurus, AGI): urban geology, ground<br />
water, drawdown, land subsidence, soil pollution, heavy metals,<br />
Tartu, Estonia.<br />
1 Institute <strong>of</strong> Geology, University <strong>of</strong> Tartu,<br />
Vanemuise <strong>46</strong>, EE-51014 Tartu, Estonia<br />
E-mail: volli.kalm@ut.ee<br />
141
<strong>Geological</strong> <strong>Survey</strong> <strong>of</strong> <strong>Finland</strong>, <strong>Special</strong> <strong>Paper</strong> <strong>46</strong><br />
Volli Kalm<br />
The City <strong>of</strong> Tartu is located in southeastern Estonia<br />
(58˚22´N, 26˚43´E) at the river <strong>of</strong> Suur-Emajõgi,<br />
where the river valley (fl oodplain 32-40 m a.s.l.)<br />
between the Devonian sandstone plateaus (50-80<br />
m a.s.l.) is the narrowest (Fig. 1). Tartu was <strong>fi</strong> rst<br />
mentioned in historical records in 1,030 AD, but<br />
archaeological <strong>fi</strong> nds prove that the <strong>fi</strong> rst settlements<br />
were present between 3-2 millenium BC (Tvauri<br />
2001). The City <strong>of</strong> Tartu is partly located on the<br />
Devonian sandstone plateau while its historical regions<br />
lay on s<strong>of</strong>t soils like alluvial, limnic, or bog<br />
sediments. The City <strong>of</strong> Tartu is facing a complex<br />
<strong>of</strong> urban geology problems related to subsidence <strong>of</strong><br />
soils and buildings, human-induced fl uctuations in<br />
the groundwater level and distribution <strong>of</strong> the polluted<br />
but archaeologically rich cultural layer, fl ooding,<br />
and slope processes. In 2003, the Tartu Urban<br />
Geology Project was initiated and an urban geology<br />
GIS-based databank includes information from ca<br />
1,850 boreholes. Some aspects <strong>of</strong> the ongoing research<br />
are published (Karro et al. 2004) or presented<br />
in BSc theses (Lokotar 2005, Nõges 2006). This article<br />
reports the last observations and interpretations<br />
related to the urban geological situation in the City<br />
<strong>of</strong> Tartu.<br />
The Tartu region was deglaciated ca 14.2 kyr BP,<br />
after the Otepää Stade and well before the Pandivere<br />
(Neva) Stade (Kalm 2006). Under the Holocene alluvial<br />
and bog deposits, late glacial varved clays<br />
are distributed in the river valley at an elevation up<br />
to 26-27 m a.s.l., which indicates that a high-level<br />
(>45-50 m) limnic body <strong>of</strong> water <strong>fi</strong> lled the whole<br />
valley. On the fl oodplain area, from top to down,<br />
there are more or less continuously present sedimentary<br />
units: a) anthropogenic deposits (cultural<br />
layer) – 0.1-12 m; b) lake- and spring marl – 0-3 m;<br />
142<br />
INTRODUCTION<br />
GEOLOGICAL BACKGROUND<br />
Fig. 1. Topography <strong>of</strong> the City <strong>of</strong> Tartu located at the middle<br />
reaches <strong>of</strong> the Suur-Emajõgi River, southeastern Estonia.<br />
c) peat and gyttja – 0-6 m; d) alluvium – 0-2.5 m;<br />
e) glaciolacustrine clayey silt and silt – 0-10 m; f)<br />
glaci<strong>of</strong>l uvial sand and gravel 0-30 m; g) till – 0-35<br />
m; h) Devonian sandstone. Most <strong>of</strong> the Holocene<br />
deposits (peat, gyttja, spring marl) are weak soils<br />
in terms <strong>of</strong> geotechnical properties. On the Devonian<br />
sandstone plateau, geotechnical conditions are<br />
good for construction (compressive strength <strong>of</strong> the<br />
sandstone = 6.95 MPa), even though the clayey till,<br />
which covers the sandstone, has a higher than average<br />
fl uidity (yield point 15.95%).
GROUNDWATER LEVEL FLUCTUATIONS AND SUBSIDENCE OF<br />
BUILDINGS<br />
Groundwater level fl uctuations were reconstructed<br />
for the old part <strong>of</strong> the city based on the data from<br />
114 drillholes made between 1963-2002 (Karro<br />
et al. 2004). The monitored area (fl oodplain) lies<br />
mostly between 32-40 m a.s.l., while the average<br />
water level in the Emajõgi River (in 1947-1995)<br />
next to the monitored area was 30.7 m a.s.l. In 1963,<br />
the Toomeoru water intake started to operate some<br />
400-800 m south-southeast <strong>of</strong> the city centre with<br />
<strong>fi</strong> ve 50-60 m deep wells. The amount <strong>of</strong> groundwater<br />
withdrawn from the Quaternary aquifer<br />
varied from 200 to 3,750 m 3 /d between 1963-2000<br />
(Fig. 2). Due to intensive consumption, the groundwater<br />
level in the water intake lowered 3.5 m<br />
by 1974-75 and the groundwater level in the old<br />
city area followed that trend (Karro et al. 2004). The<br />
lowering <strong>of</strong> the groundwater level lead to the decrease<br />
in pore pressure in unconsolidated soils and to land<br />
subsidence (Poland 1985, Chen et al. 2003), which<br />
in the Tartu old city area was the highest in 1973<br />
– average <strong>of</strong> 38 buildings = 4.87 mm/yr (Lokotar<br />
2005). A decrease in groundwater extraction started<br />
in 1976 and over the next 20 years, the groundwater<br />
level has steadily recovered in the old city area<br />
(Fig. 2). According to data from the last general<br />
levelling <strong>of</strong> buildings in 1993, the subsidence has<br />
decreased to a rate <strong>of</strong> 1.5-2 mm/yr (Lokotar 2005).<br />
Fig. 2. Average subsidence <strong>of</strong> buildings located on the fl oodplain <strong>of</strong> the Suur-Emajõgi River in relation to water extraction from<br />
the Toomeoru water intake and the level <strong>of</strong> groundwater in monitored wells.<br />
DECAY OF TIMBER IN THE CULTURAL LAYER<br />
Since the 13 th century, spruce and pine timber have<br />
been placed on peaty soils to support foundations <strong>of</strong><br />
buildings constructed on peaty soils. Today the timber<br />
pavements are ca 2-3 m below the surface under<br />
the cultural layer. Due to intensive water extraction<br />
and the groundwater level lowering described<br />
above, ancient timber pile foundations and rostferk<br />
became exposed to aeration. Soon the damage to<br />
timber piles by Cossonus parallelepipedus worms<br />
<strong>Geological</strong> <strong>Survey</strong> <strong>of</strong> <strong>Finland</strong>, <strong>Special</strong> <strong>Paper</strong> <strong>46</strong><br />
The urban geology <strong>of</strong> Tartu, Estonia<br />
was determined (Oll 1967) and 14 different species<br />
<strong>of</strong> fungi were detected from the wooden rostferk,<br />
which was situated above the groundwater level<br />
(Oll 1976). While the foundations <strong>of</strong> a few historical<br />
buildings have been reinforced since 1966, it has<br />
not been possible to estimate the contribution <strong>of</strong> the<br />
decay <strong>of</strong> timber into the rate <strong>of</strong> total subsidence <strong>of</strong><br />
the buildings.<br />
143
<strong>Geological</strong> <strong>Survey</strong> <strong>of</strong> <strong>Finland</strong>, <strong>Special</strong> <strong>Paper</strong> <strong>46</strong><br />
Volli Kalm<br />
Fig. 3. Heavy metals<br />
distribution in the section<br />
through cultural layer<br />
in the centre (corner <strong>of</strong><br />
Küüni and Vanemuise<br />
streets) <strong>of</strong> the City <strong>of</strong><br />
Tartu.<br />
144<br />
HEAVY METALS IN THE CULTURAL LAYER<br />
Chemical analyses <strong>of</strong> the samples from the cultural<br />
layer exposed in an excavation at the city centre revealed<br />
that the soil contamination from heavy metals<br />
is very high (Fig. 3). The highest concentrations<br />
<strong>of</strong> Pb were found below the layer <strong>of</strong> debris from<br />
the Second World War (WW2), although this probably<br />
represents the extensive use <strong>of</strong> leaded gas after<br />
WW2. The maximum estimated concentration <strong>of</strong> Pb<br />
(240 mg/kg; Nõges 2006) in the section is 14.6 times<br />
higher than the average amount <strong>of</strong> Pb in Estonian<br />
humic soils (16.4 mg/kg; Petersell et al. 1997). Zinc<br />
and Cu reach their maximums (150 mg/kg and 96<br />
mg/kg respectively) in the lower half <strong>of</strong> the cultural<br />
Undesirable urban geological phenomena – subsidence<br />
<strong>of</strong> buildings, groundwater level fl uctuations,<br />
soil pollution – are mostly restricted to the city<br />
quarters located on the fl oodplain area. Lowering <strong>of</strong><br />
the groundwater level in the fl oodplain deposits lead<br />
into soil compaction, decay <strong>of</strong> timber rafts under the<br />
foundations <strong>of</strong> buildings and subsidence <strong>of</strong> buildings.<br />
The highest rate <strong>of</strong> subsidence (4.9 mm/yr in<br />
CONCLUSIONS<br />
layer, some 1.8-2.6 m below the surface. Concentration<br />
values <strong>of</strong> Zn and Cu have a good correlation<br />
(r = 0.77 and 0.82 respectively) with the content <strong>of</strong><br />
Ca, supporting the conclusion that in Ca-rich soils<br />
Cu and Zn may be sorbed on the surface <strong>of</strong> CaCO 3<br />
(Dudley et al. 1991). Concentration <strong>of</strong> Cd in the cultural<br />
layer (average 0.13 mg/kg) remains below the<br />
average Cd content in Estonian humic soils (0.4 mg/<br />
kg; Petersell et al. 1997). In the peat deposits below<br />
the cultural layer, the concentration <strong>of</strong> heavy metals<br />
decreases rather strongly (Fig. 3) and remains close<br />
to the average values in Estonian soils.<br />
1973) was recorded at the time <strong>of</strong> the most intensive<br />
groundwater consumption from the Quaternary aquifer.<br />
Since 1974, the groundwater level has risen<br />
and the subsidence decreased to 1.5-2 mm/yr over<br />
a 20 year period. Initial analyses showed that the<br />
cultural layer in the centre <strong>of</strong> the city is heavily contaminated<br />
with Pb, Zn and Cu, but not with Cd.
Chen, C., Pei, S. & Jiao, J. 2003. Land subsidence caused by<br />
groundwater exploitation in Suzhou City, China. Hydrogeology<br />
Journal 11, 275–287.<br />
Dudley, L. M., McLean, J. E., Furst, T. H. & Jurinak, J. J.<br />
1991. Sorption <strong>of</strong> Cd and Cu from an acid mine waste extract<br />
by two calcareous soils: column studies. Soil Science<br />
151, 121–135.<br />
Kalm, V. 2006. Pleistocene chronostratigraphy in Estonia,<br />
southeastern sector <strong>of</strong> the Scandinavian Glaciation. Quaternary<br />
Science Reviews 25, 960–975.<br />
Karro, E., Kalm, V. & Eensaar, J. 2004. Human induced<br />
groundwater level fl uctuations in Quaternary deposits <strong>of</strong><br />
Tartu old city. XXIII Nordic Hydrological Conference,<br />
Tallinn, Estonia, 8–12 August 2004. Selected Articles,<br />
Vol. I, NHP Report No. 48, 336–341.<br />
Lokotar, A. 2005. Tartu vanalinna vajumiste ja pinnaste geotehniliste<br />
omaduste analüüs (translated: Analysis <strong>of</strong><br />
Ground Subsidence and Geotechnical Properties <strong>of</strong> Soils in<br />
Old Quarters <strong>of</strong> Tartu). BSsc Thesis, Institute <strong>of</strong> Geology,<br />
University <strong>of</strong> Tartu. 30 p.<br />
Nõges, L. 2006. Kultuurkihi koostis ja raskemetallide levik<br />
Tartu Kesklinnas (translated: Composition <strong>of</strong> Cultural Lay-<br />
REFERENCES<br />
<strong>Geological</strong> <strong>Survey</strong> <strong>of</strong> <strong>Finland</strong>, <strong>Special</strong> <strong>Paper</strong> <strong>46</strong><br />
The urban geology <strong>of</strong> Tartu, Estonia<br />
er and distribution <strong>of</strong> heavy metals in Cultural Layer in the<br />
Centre <strong>of</strong> Tartu). BSsc Thesis, Institute <strong>of</strong> Geology, University<br />
<strong>of</strong> Tartu. 51 p.<br />
Oll, N. 1967. Puidu säilivusest parvalustes ja vaiades (translated:<br />
Preservation <strong>of</strong> timber in pile foundations). Ehitusgeoloogia<br />
kogumik II, 89–95.<br />
Oll, N. 1976. Puidu säilivus TRÜ peahoone vundamendis<br />
(translated: State <strong>of</strong> preservation <strong>of</strong> timber in the pile foundation<br />
<strong>of</strong> the main building <strong>of</strong> Tartu State University). Ehitusgeoloogia<br />
kogumik III, 115–125.<br />
Petersell, V., Ressar, H., Carlsson, M., Mõttus, V., Enel, M.,<br />
Mardla, A. & Täht, K. 1997. The Geochemical Atlas <strong>of</strong><br />
the Humus Horizon <strong>of</strong> Estonian Soil. Explanatory text.<br />
Tallinn: <strong>Geological</strong> <strong>Survey</strong> <strong>of</strong> Estonia – Uppsala: <strong>Geological</strong><br />
<strong>Survey</strong> <strong>of</strong> Sweden. 75 p.<br />
Poland, J. F. (ed.) 1985. Guidebook to studies <strong>of</strong> land subsidence<br />
due to ground-water withdrawal. Studies and reports<br />
in hydrology 40. Paris: UNESCO.<br />
Tvauri, A. 2001. Muinas-Tartu. Uurimus Tartu muinaslinnuse<br />
ja asula asustusloost (translated: Prehistoric Tartu. A Study<br />
<strong>of</strong> the Settlement History <strong>of</strong> the Tartu Prehistoric Hillfort<br />
and Settlement). Muinasaja Teadus 10. 372 p.<br />
145
1<strong>46</strong>
Applied Quaternary research in the central part <strong>of</strong> glaciated terrain,<br />
edited by Peter Johansson and Pertti Sarala.<br />
<strong>Geological</strong> <strong>Survey</strong> <strong>of</strong> <strong>Finland</strong>, <strong>Special</strong> <strong>Paper</strong> <strong>46</strong>, 147–156, 2007.<br />
SEDIMENTOLOGICAL CHARACTERISTICS OF LATE WEICHSELIAN–<br />
HOLOCENE DEPOSITS OF THE SUURPELTO AREA IN ESPOO,<br />
SOUTHERN FINLAND<br />
by<br />
Antti E. K. Ojala and Jukka-Pekka Palmu 1<br />
Ojala. A. E. K. & Palmu, J.-P. 2007. Sedimentological characteristics<br />
<strong>of</strong> Late Weichselian–Holocene deposits <strong>of</strong> the Suurpelto<br />
area in Espoo, southern <strong>Finland</strong>. Applied Quaternary research in<br />
the central part <strong>of</strong> glaciated terrain. <strong>Geological</strong> <strong>Survey</strong> <strong>of</strong> <strong>Finland</strong>,<br />
<strong>Special</strong> <strong>Paper</strong> <strong>46</strong>, 147–156, 8 <strong>fi</strong> gures, 2 tables.<br />
Lithostratigraphic studies and analyses <strong>of</strong> the physical characteristics<br />
<strong>of</strong> sediments have provided a detailed picture <strong>of</strong> the<br />
<strong>fi</strong> ne-grained deposits in the Suurpelto area in Espoo, southern<br />
<strong>Finland</strong>. A key sediment section from drill-hole N5, which represents<br />
different depositional phases <strong>of</strong> the Baltic Sea Basin (BSB)<br />
history, was divided into 11 lithostratigraphic units according<br />
to their sediment structure and composition. The properties <strong>of</strong><br />
these units were carefully described. A 3D geological model <strong>of</strong><br />
these units in the Suurpelto area has been established, including<br />
cross-section pr<strong>of</strong>i les from northern and southern parts <strong>of</strong> the<br />
basin. The northern part <strong>of</strong> the Suurpelto basin contains a thinner<br />
sequence <strong>of</strong> massive and varved clays with coarser (silt, sand)<br />
mineral layers representing earlier phases <strong>of</strong> the BSB than the<br />
southern part <strong>of</strong> the basin. In the southern part <strong>of</strong> the basin these<br />
deposits have been covered by more organic and sulphide-rich<br />
sediments that represent later phases <strong>of</strong> the BSB. Three locations<br />
in the Suurpelto area have thicker than average (10.6 m) sequence<br />
<strong>of</strong> <strong>fi</strong> ne-grained deposits. The maximum thickness <strong>of</strong> <strong>fi</strong> ne-grained<br />
sediment in the Suurpelto area is >25 m in the SW corner.<br />
Key words (GeoRef Thesaurus, AGI): sediments, clay, lithostratigraphy,<br />
physical properties, thickness, Holocene, Pleistocene,<br />
Weichselian, Suurpelto, Espoo, <strong>Finland</strong>.<br />
1 <strong>Geological</strong> <strong>Survey</strong> <strong>of</strong> <strong>Finland</strong>, Betonimiehenkuja 4,<br />
FI-02150 Espoo, <strong>Finland</strong><br />
E-mail: antti.ojala@gtk.<strong>fi</strong> ,<br />
jukka-pekka.palmu@gtk.<strong>fi</strong><br />
147
<strong>Geological</strong> <strong>Survey</strong> <strong>of</strong> <strong>Finland</strong>, <strong>Special</strong> <strong>Paper</strong> <strong>46</strong><br />
Antti E. K. Ojala and Jukka-Pekka Palmu<br />
Reconstruction <strong>of</strong> the geological history <strong>of</strong> the Suurpelto<br />
area is an important task because the city<br />
<strong>of</strong> Espoo has recently begun land-use planning <strong>of</strong><br />
the area. The area has deposits <strong>of</strong> silt and clay up<br />
to 25 m thick. These <strong>fi</strong> ne-grained sediments in the<br />
Suurpelto area have accumulated since the Fennoscandian<br />
ice-sheet retreated from the area ca. 13,000<br />
years ago, during the early history <strong>of</strong> the Baltic<br />
Sea Basin (BSB) (e.g. Björck 1995, Saarnisto &<br />
Saarinen 2001). Based on geotechnical information<br />
it is known that the composition and geotechnical<br />
properties <strong>of</strong> the Suurpelto deposits vary both vertically<br />
and horizontally, making it a challenging site<br />
for construction. Therefore, the Suurpelto project<br />
was launched in 2005 in cooperation with the city <strong>of</strong><br />
Espoo, the <strong>Geological</strong> <strong>Survey</strong> <strong>of</strong> <strong>Finland</strong>, the University<br />
<strong>of</strong> Helsinki and Helsinki University <strong>of</strong> Technology,<br />
aiming to provide scienti<strong>fi</strong> c and technical<br />
information for land-use planning and ground engineering,<br />
particularly for tasks such as construction<br />
The Suurpelto area is about 1 km wide and 2 km<br />
long and located in Espoo, on the southern coast <strong>of</strong><br />
<strong>Finland</strong>, about 10 km west <strong>of</strong> Helsinki city centre<br />
(Figs. 1 and 2). Nowadays the Suurpelto area is<br />
situated 4 km from the coastline, lying between 5<br />
and 10 metres above sea level (a.s.l.), and has a current<br />
land uplift rate <strong>of</strong> 2 mm yr -1 (Kakkuri 1991).<br />
It is surrounded in all directions by a rolling relief<br />
<strong>of</strong> bedrock topography with relative altitude differences<br />
<strong>of</strong> about 50 m. The bedrock is an ancient<br />
peneplain <strong>of</strong> crystalline amphibolites, gneisses and<br />
granites that slopes towards the south with a very<br />
low gradient (Laitala 1991). Quaternary deposits up<br />
to 30 m thick have <strong>fi</strong> lled bedrock fracture zones and<br />
depressions during glacial and post-glacial times.<br />
The basal Quaternary deposits consist <strong>of</strong> a thin till<br />
cover overlain by a glaci<strong>of</strong>l uvial sand deposit <strong>of</strong><br />
approximately 2 m in thickness in the Suurpelto area.<br />
Upon these lies a section <strong>of</strong> <strong>fi</strong> ne-grained sediments,<br />
the primary target <strong>of</strong> the present investigation, that<br />
was formed during the retreat <strong>of</strong> the continental<br />
Fennoscandian ice-sheet from the area and during<br />
different phases <strong>of</strong> the BSB deposition.<br />
148<br />
INTRODUCTION<br />
STUDY SITE<br />
suitability and stabilization. Geophysics, geochemistry,<br />
geotechnical engineering and sedimentological<br />
methods have been applied in the Suurpelto project<br />
(Ojala et al. 2006, Palmu et al. 2006). One <strong>of</strong> the<br />
purposes <strong>of</strong> the project is to compare and combine<br />
results gained with different investigation methods,<br />
and in the longer term, to develop new methods or<br />
method combinations that could be ef<strong>fi</strong> ciently and<br />
economically applied to similar areas.<br />
This paper presents results from the sedimentological<br />
part <strong>of</strong> the Suurpelto project. It includes the<br />
methods <strong>of</strong> logging several physical properties <strong>of</strong><br />
<strong>fi</strong> ne-grained sediment deposits and a highly detailed<br />
characterization <strong>of</strong> sediment lithostratigraphy. The<br />
primary objectives were to identify the main sedimentary<br />
units <strong>of</strong> the Suurpelto deposits, to characterize<br />
their composition and structure, and to construct<br />
a 3D geological model <strong>of</strong> the arrangement <strong>of</strong><br />
these different units in the Suurpelto area.<br />
The geological history <strong>of</strong> the Suurpelto area has<br />
been closely connected with the BSB deposition<br />
during Late Weichselian and Holocene. Following<br />
deglaciation (ca. 13,000 yrs ago), transgressive waters<br />
<strong>of</strong> the Baltic Ice Lake reached their maximum<br />
altitude <strong>of</strong> 120 m a.s.l. in the Espoo area. Subsequently,<br />
the lake suddenly drained westwards to<br />
the Atlantic and the water table lowered by 26 m at<br />
around 11,600 years ago (Eronen 1990, Saarnisto<br />
& Saarinen 2001). The emergence <strong>of</strong> the Suurpelto<br />
area proceeded during the Yoldia Sea phase, with the<br />
highest sea level <strong>of</strong> about 80 m a.s.l. in Espoo area<br />
(Eronen 1990). It was followed by Ancylus Lake<br />
phase (ca. 10,700-9,000 years ago) and Litorina Sea<br />
phase (9,000-) <strong>of</strong> the BSB history. Exposure <strong>of</strong> the<br />
Suurpelto study area from underneath the regressive<br />
Litorina Sea waters began around 3,000 years<br />
ago (Hyvärinen 1999). An isolation threshold <strong>of</strong> the<br />
Suurpelto basin is situated in the SE corner, nowadays<br />
named the Lukupuro ditch, at an altitude <strong>of</strong><br />
6 m (Fig. 2). The Suurpelto area became isolated<br />
from the Litorina Sea <strong>of</strong> the BSB around 2,000 years<br />
ago (Hyvärinen 1999) and then gradually dried up.
<strong>Geological</strong> <strong>Survey</strong> <strong>of</strong> <strong>Finland</strong>, <strong>Special</strong> <strong>Paper</strong> <strong>46</strong><br />
Sedimentological characteristics <strong>of</strong> Late-Weichselian–Holocene deposits <strong>of</strong> the Suurpelto area in Espoo, southern <strong>Finland</strong><br />
Fig. 1. Location and Quaternary deposits <strong>of</strong> the Suurpelto area.<br />
Digital elevation model and basemap © National Land <strong>Survey</strong><br />
<strong>of</strong> <strong>Finland</strong>, permit No. 13/MYY/07.<br />
It is important to note that during deglaciation<br />
and the different phases <strong>of</strong> the BSB the sedimentary<br />
environment in the Suurpelto area varied signi<strong>fi</strong> -<br />
cantly due to several reasons. The primary variables<br />
were the discharge intensity <strong>of</strong> melt-water from<br />
the retreating Fennoscandian ice-sheet, the relative<br />
Fig. 2. Shoreline displacement in southern <strong>Finland</strong> during<br />
the last 9000 years according to Hyvärinen (1999). The study<br />
site, Suurpelto, is marked with a blue circle. Digital elevation<br />
model and basemap © National Land <strong>Survey</strong> <strong>of</strong> <strong>Finland</strong>,<br />
permit No. 13/MYY/07.<br />
water depth (sea level rise vs. glacioeustacy), the<br />
water salinity (i.e. fresh water/brackish water), and<br />
the intensity <strong>of</strong> primary productivity due to climate<br />
change and nutrient availability. Therefore, the composition<br />
and structure <strong>of</strong> the Suurpelto <strong>fi</strong> ne-grained<br />
deposits has varied through time and space.<br />
149
<strong>Geological</strong> <strong>Survey</strong> <strong>of</strong> <strong>Finland</strong>, <strong>Special</strong> <strong>Paper</strong> <strong>46</strong><br />
Antti E. K. Ojala and Jukka-Pekka Palmu<br />
Drilling and lithostratigraphic logging<br />
The results <strong>of</strong> this study are based on three sources<br />
<strong>of</strong> information (Fig. 3). Firstly, six drill-holes (N1-<br />
N6) that were taken with a piston-type lake sediment<br />
corer (Putkinen & Saarelainen 1998) modi<strong>fi</strong> ed for the<br />
purpose <strong>of</strong> retrieving continuous sections <strong>of</strong> clayey<br />
deposits into ca. 1-metre-long plastic tubes (sample<br />
tube inner diameter <strong>of</strong> 45 mm). Core samples were<br />
taken in 2005-2006. Secondly, 26 coring locations<br />
logged with a small (diameter 50 mm, length 500<br />
mm) Russian peat corer operated with a series <strong>of</strong> 1metre-long<br />
steel rods in 2006. Thirdly, results from<br />
311 Swedish weight-sounding tests carried out by<br />
the city <strong>of</strong> Espoo between 1968 and 2006. The last<br />
two information sources were used to characterize<br />
the sediment lithostratigraphy and thickness <strong>of</strong> <strong>fi</strong> negrained<br />
deposits in the Suurpelto area, whereas the<br />
150<br />
MATERIALS AND METHODS<br />
piston core samples were analysed in the laboratory<br />
to determine the physical and chemical properties<br />
<strong>of</strong> the sediment.<br />
Sediment lithostratigraphy and physical<br />
analyses<br />
The sample tubes <strong>of</strong> piston cores N1-N6 were<br />
opened in the sediment laboratory by splitting<br />
them lengthwise to enable sediment description<br />
and analyses. Sections <strong>of</strong> up to 21 m long, the<br />
longest being drill-hole N5, were described in<br />
detail according to the classi<strong>fi</strong> cation <strong>of</strong> Troels-<br />
Smith (Troels-Smith 1955). Magnetic susceptibility<br />
(MS) was then measured at 2 and 1 cm resolution<br />
using a Bartington MS2C loop sensor and MS2E1<br />
surface scanning sensor, respectively. MS measures<br />
the concentration and grain-size <strong>of</strong> magnetic minerals<br />
in deposits, and can also be used in<br />
correlation between parallel cores (e.g.<br />
Sandgren & Snowball 2001). Water<br />
content (WC per dry weight) and loss<br />
on ignition (LOI) were then determined<br />
at ca. 10 cm resolution by drying the<br />
samples overnight (105 ºC) and burning<br />
in a furnace (550 ºC) for 2 hours. Dry<br />
density was determined according to<br />
the formula by Håkanson and Jansson<br />
(1983). Additional mineral magnetic<br />
parameters, namely anhysteretic remanent<br />
magnetization (ARM), saturation<br />
isothermal remanent magnetization<br />
(SIRM), the S-parameter (determined as<br />
IRM - 100 mT /IRM + 1000 mT ) and their ratios,<br />
were applied at ca. 10 cm resolution to<br />
investigate variations in the quality and<br />
concentration <strong>of</strong> magnetic minerals (e.g.<br />
Sandgren & Snowball 2001).<br />
Fig. 3. Locations <strong>of</strong> drill-holes N1-N6 (red<br />
dots), stratigraphic survey points (green<br />
triangles) and Swedish weight-sounding tests<br />
(purple dots) used in the present study. Digital<br />
elevation model and basemap © National Land<br />
<strong>Survey</strong> <strong>of</strong> <strong>Finland</strong>, permit No. 13/MYY/07.
<strong>Geological</strong> <strong>Survey</strong> <strong>of</strong> <strong>Finland</strong>, <strong>Special</strong> <strong>Paper</strong> <strong>46</strong><br />
Sedimentological characteristics <strong>of</strong> Late-Weichselian–Holocene deposits <strong>of</strong> the Suurpelto area in Espoo, southern <strong>Finland</strong><br />
Sediment lithostratigraphy and physical<br />
properties<br />
One example <strong>of</strong> the sediment lithostratigraphy in<br />
the Suurpelto area from drill-hole N5 is illustrated<br />
in Fig. 4. Being one <strong>of</strong> the earliest places in <strong>Finland</strong><br />
exposed from beneath the continental ice-sheet, the<br />
thickest sections <strong>of</strong> the Suurpelto <strong>fi</strong> ne-grained sediment<br />
deposits show very nicely the lithostratigraphic<br />
sequence <strong>of</strong> BSB history. Based on sedimento-<br />
RESULTS AND DISCUSSION<br />
logical analysis, 11 sedimentary units differing in<br />
composition and structure were identi<strong>fi</strong> ed from<br />
the 21-metres-long section <strong>of</strong> drill-hole N5. These<br />
represent deposits ranging from clays deposited in<br />
Baltic Ice Lake to the dried up lake/swamp gyttja<br />
and peat from the late depositional phase <strong>of</strong> the basin<br />
(Fig. 4). Their Troels-Smith classi<strong>fi</strong> cation details<br />
are presented in Table 1.<br />
Fig. 4. Sediment stratigraphy <strong>of</strong> Suurpelto drill-hole N5 with physical properties <strong>of</strong> water content, loss on ignition (LOI), dry<br />
density, magnetic susceptibility and SIRM/ARM ratio. The 21-metres-long sediment sequence has been divided into 11 units<br />
according to its sediment structure and composition. Troels-Smith classi<strong>fi</strong> cation codes <strong>of</strong> these units are presented in Table 1.<br />
151
<strong>Geological</strong> <strong>Survey</strong> <strong>of</strong> <strong>Finland</strong>, <strong>Special</strong> <strong>Paper</strong> <strong>46</strong><br />
Antti E. K. Ojala and Jukka-Pekka Palmu<br />
The lowermost units 1 and 2 represent deposits<br />
sedimented in Baltic Ice Lake and are mainly<br />
composed <strong>of</strong> varved clays (see e.g. Sauramo 1923)<br />
with coarser 1-20 mm thick sub-layers <strong>of</strong> silt and<br />
sand, and occasional drop-stones. These units have<br />
a very low LOI (< 2%) and high MS and dry density<br />
values <strong>of</strong> up to 80 SI ×10 -5 and 1.4 g cm -3 , respectively.<br />
Their deposition represents the period when<br />
the Fennoscandian ice-sheet retreated from the<br />
area. The varved structure refl ects the annual cycle<br />
<strong>of</strong> sedimentation (e.g. Sauramo 1923). As a rule <strong>of</strong><br />
thumb, the coarsest layers and thickest varves are<br />
found in the lower part <strong>of</strong> Baltic Ice Lake deposits<br />
when the ice was closest to the study area. The<br />
varved structure was also controlled by the intensity<br />
<strong>of</strong> spring and summer melt-water discharge from<br />
the ice-sheet.<br />
Unit 3 probably represents deposits sedimented<br />
in Yoldia Sea when the Baltic basin was temporarily<br />
connected to the Atlantic, allowing saline waters to<br />
spread into the ancient BSB. It starts with a massive<br />
greyish 30 cm thick layer <strong>of</strong> clay that is very different<br />
from the underlying reddish-coloured Baltic<br />
Ice Lake varved clays. This layer is easily identi<strong>fi</strong> ed<br />
from the MS curve with anomalously high values<br />
and possibly indicates the rapid sea level fall that<br />
ended the Baltic Ice Lake phase at around 11,600<br />
years ago. In general, unit 3 is characterized by a stable<br />
LOI and WC, and as discussed by Gardemeister<br />
(1975), sediments deposited in Yoldia Sea phase<br />
are typically very rich in clayey (< 0.002 mm Ø)<br />
mineral matter with a content <strong>of</strong> up to 80%. A high<br />
clayey contents was observed in here in geotechnical<br />
investigations (Ojala & Tanska 2006). Unit 3<br />
contains sections with layered sediment structures<br />
that are partly disturbed.<br />
Units 4 to 7 include <strong>fi</strong> ne-grained sediment deposits<br />
that accumulated during the Ancylus Lake phase<br />
<strong>of</strong> BSB history. At that time the Baltic basin was<br />
a freshwater lake that was <strong>fi</strong> rst transgressive with<br />
a rising and then regressive with a lowering water<br />
level (Björck 1995). The boundary between units<br />
3 and 4 is very distinctive. Unit 4 consists <strong>of</strong> massive<br />
sulphide-bearing clay that begins with sulphide<br />
grains <strong>of</strong> up to 4 mm in diameter frequently occurring<br />
within clay-rich deposits. The quantity <strong>of</strong> these<br />
grains declines upwards in this unit and there are<br />
only scattered remains in the overlying unit 5. Unit<br />
5 consist <strong>of</strong> greenish grey clay containing 2-5 mm<br />
thick sub-layers <strong>of</strong> silt and sand, possibly related<br />
to Ancylus Lake water level fl uctuations. Units 6<br />
and 7 again contain sulphide as laminae, but not as<br />
high in content as in unit 4. The physical characteristics<br />
<strong>of</strong> the sediment indicate that units 4-7 have a<br />
152<br />
Table 1. Troels-Smith classi<strong>fi</strong> cation codes (Troels-Smith 1955)<br />
for the Suurpelto sedimentary units.<br />
Unit Troels-Smith description<br />
11 nig. 2, strfc. 0, elas. 0, sicc. 1<br />
colour: brown<br />
struc: massive clay gyttja<br />
comp: As 3, Ld 1<br />
10 nig. 2, strfc. 1, elas. 0, sicc. 1<br />
colour: dark brown<br />
struc: sulphide laminated gyttja clay<br />
comp: As 3, Ld 1, sulf +<br />
9 nig. 3, strfc. 3, elas. 0, sicc. 1<br />
colour: black/grey<br />
struc: sulphide striped gyttja clay<br />
comp: As 3, Ld 1, sulf +<br />
8 nig. 4, strfc. 1, elas. 0, sicc. 1<br />
colour: black<br />
struc: sulphide clay<br />
comp: As 3, Ld1 sulf ++<br />
7 nig. 2, strfc. 0, elas. 0, sicc. 1<br />
colour: dark grey<br />
struc: clay with sand laminae<br />
comp: As 4, Gmin+, sulf+<br />
6 nig. 2, strfc. 1, elas. 0, sicc. 1<br />
struc: sulphide laminated clay<br />
comp: As 4, sulf+<br />
5 nig. 2, strfc. 0, elas. 0, sicc. 1<br />
colour: grey<br />
struc: massive clay with sand laminae<br />
comp: As 4, Gmin+<br />
4 nig. 2, strfc. 0, elas. 0, sicc. 1<br />
colour: dark grey<br />
struc: massive clay with suplhide grains<br />
comp: As 4, sulf+<br />
3 nig. 1, strfc. 2, elas. 0, sicc. 1<br />
colour: grey<br />
struc: partly laminated clay<br />
comp: As 4<br />
2 nig. 1, strfc. 2, elas. 1, sicc. 1<br />
colour: reddish grey<br />
struc: partly laminated clay<br />
comp: As 4, Ag+<br />
1 nig. 1, strfc. 4, elas. 0, sicc. 1<br />
colour: grey<br />
struc: silt/sand laminated clay<br />
comp: As 4, Ag+, Gmin+<br />
lower LOI and WC than the under- and overlying<br />
deposits, which according to Gardemeister (1975)<br />
is very typical for Lake Ancylus sediments. The<br />
deposits sedimented in Lake Ancylus phase is also<br />
very well distinguished in the magnetic mineralogy,<br />
particularly in susceptibility and SIRM/ARM ratio<br />
plots (Fig. 4). This section has a greater magnetite<br />
concentration and/or decreased grain-sizes.<br />
Units 8 to 10 represent the Litorina Sea phase <strong>of</strong><br />
BSB history. These units have a substantially higher<br />
WC and LOI than the underlying BSB phases.<br />
WC and LOI increase upwards in the Litorina Sea
<strong>Geological</strong> <strong>Survey</strong> <strong>of</strong> <strong>Finland</strong>, <strong>Special</strong> <strong>Paper</strong> <strong>46</strong><br />
Sedimentological characteristics <strong>of</strong> Late-Weichselian–Holocene deposits <strong>of</strong> the Suurpelto area in Espoo, southern <strong>Finland</strong><br />
deposit from 10 to 20% and 5 to 12%, respectively.<br />
In addition, susceptibility rapidly decreases and<br />
then remains very low (< 5 SI 10 -5 ) and stable. Unit<br />
8 is very rich in sulphide and has a distinctive lower<br />
boundary with the underlying unit 7. The blackcoloured<br />
sulphide layer is more than a metre thick<br />
and then grades upwards into sulphide-laminated<br />
gyttja clay/clay gyttja in unit 9. Unit 10 consists <strong>of</strong><br />
massive clay gyttja that represents a period prior<br />
to the isolation <strong>of</strong> the Suurpelto area. By 3,000 BP<br />
the Suurpelto area had become a sheltered gulf <strong>of</strong><br />
the BSB, probably with a fairly calm sedimentation<br />
environment and a water depth <strong>of</strong> about 10 metres<br />
(see Fig. 2). The area is surrounded by a rolling relief<br />
<strong>of</strong> bedrock topography (with an altitude <strong>of</strong> 30<br />
to 50 m a.s.l.) in all directions, and has therefore<br />
been well sheltered from the wind and major wave<br />
activity. It is likely that a lake existed in the Suurpelto<br />
area after isolation from the Litorina Sea at<br />
around 2,000 years ago, which then gradually dried<br />
up. Organic gyttja deposits in the upper part <strong>of</strong> the<br />
section (unit 11) were deposited during this period.<br />
Its lower boundary is gradual, and it is therefore<br />
impossible to identify the exact isolation horizon in<br />
the sediment lithostratigraphy. Above unit 11 lies<br />
a ca. 1-metre-thick section that is under constant<br />
change due to soil formation and agricultural activity.<br />
Fig. 5. Magnetic information, in this case SIRM vs. S-parameter,<br />
can be applied to identify different sedimentological<br />
units according to their quality, concentration and the grainsize<br />
<strong>of</strong> magnetic minerals. Here, the deposition <strong>of</strong> different<br />
stages <strong>of</strong> geological history <strong>of</strong> the Suurpelto basin appear<br />
from the far right (Baltic Ice Lake deposits) towards the far<br />
left (Lake phase deposits). For parameters see Sandgren and<br />
Snowball (2001).<br />
The above-described sediment lithostratigraphical<br />
division is well represented in the SIRM vs.<br />
S-parameter plot <strong>of</strong> the sediment magnetic properties<br />
(Fig. 5). The characteristics <strong>of</strong> this <strong>fi</strong> gure mainly<br />
refl ect fl uctuations in magnetite grain-size and concentration,<br />
seemingly allowing a clear distinction<br />
<strong>of</strong> the deposition <strong>of</strong> the different sedimentation<br />
environments in the Suurpelto basin.<br />
Sediment distribution in the Suurpelto area<br />
The same physical units that represent different<br />
phases <strong>of</strong> BSB history in drill-hole N5 (Fig. 4)<br />
are found almost throughout the Suurpelto area.<br />
However, due to variations in basin topography,<br />
water depth and the location <strong>of</strong> the isolation threshold,<br />
their distribution and thickness vary in the area.<br />
In addition, changes in wave activity and water<br />
currents during and prior to isolation have caused<br />
substantial erosion and redeposition <strong>of</strong> material in<br />
the Suurpelto basin. One <strong>of</strong> the primary aims <strong>of</strong><br />
this project was to establish a 3D geological model<br />
<strong>of</strong> the sedimentological units within the Suurpelto<br />
basin. We aimed to improve our general understanding<br />
<strong>of</strong> these <strong>fi</strong> ne-grained deposits in order to<br />
be able to better compare their geological properties<br />
with engineering properties in different parts <strong>of</strong> the<br />
Suurpelto area.<br />
Fig. 6 illustrates the thickness and distribution <strong>of</strong><br />
different section type <strong>of</strong> deposits <strong>of</strong> the <strong>fi</strong> ne-grained<br />
sediments, grouped as Topsoil, deposits <strong>of</strong> the Lake<br />
phase (unit 11), deposits <strong>of</strong> the Litorina Sea (units<br />
10, 9. 8), deposits <strong>of</strong> the Ancylus Lake (units 7, 6,<br />
5, 4), deposits <strong>of</strong> the Yoldia Sea (unit 3) and deposits<br />
<strong>of</strong> the Baltic Ice Lake (units 2, 1) in the Suurpelto<br />
area. These sections have been combined in<br />
Fig. 7, which characterizes the overall thickness<br />
variability <strong>of</strong> <strong>fi</strong> ne-grained sediments in the Suurpelto<br />
area. From top to bottom, the thickness <strong>of</strong> the topsoil<br />
in the Suurpelto area is less than a metre thick,<br />
but mostly 60 to 80 cm. The composition <strong>of</strong> this<br />
topsoil varies between sites but is generally either<br />
organic peat or gyttja, or agricultural soil that is under<br />
constant change.<br />
The deposits <strong>of</strong> the Lake phase are mostly distributed<br />
in the lowermost parts <strong>of</strong> the Suurpelto<br />
area in the south, i.e. places where the ancient lake<br />
or swamp was located after isolation. The thickest<br />
Lake phase sections, up to 4 m in thickness, are in<br />
the SW sector <strong>of</strong> the basin. Likewise, Litorina Sea<br />
deposits are thickest in the SW part <strong>of</strong> the Suurpelto<br />
area, being up to 8 m thick. This is important<br />
because the lower part <strong>of</strong> Litorina Sea deposits is<br />
richest in sulphide, which may affect construction<br />
suitability and stabilization. As seen in Fig. 8, the<br />
153
<strong>Geological</strong> <strong>Survey</strong> <strong>of</strong> <strong>Finland</strong>, <strong>Special</strong> <strong>Paper</strong> <strong>46</strong><br />
Antti E. K. Ojala and Jukka-Pekka Palmu<br />
sulphide-rich horizon lie at a depth <strong>of</strong> about 10 and<br />
7 m below the sediment surface (i.e. 4 and 1 metres<br />
below the present sea level) in the SW and SE<br />
depressions, respectively. There is only a very thin<br />
or nonexistent layer <strong>of</strong> organic sediments (from the<br />
Lake phase and Litorina Sea phase) in the northern<br />
part <strong>of</strong> the Suurpelto basin. The fringes and south<br />
side <strong>of</strong> the exposed bedrock in the middle <strong>of</strong> the<br />
southern Suurpelto basin also lack organic deposits.<br />
These areas lie at a higher elevation and/or have<br />
been sensitive to erosion during the isolation <strong>of</strong><br />
the Suurpelto area. It is likely that eroded material<br />
has been redeposited into basin depressions, thus<br />
increasing their rate <strong>of</strong> accumulation.<br />
154<br />
Sediment <strong>of</strong> the Lake Ancylus generally follow<br />
the same pattern <strong>of</strong> distribution as the more organic<br />
overlying sediments. The thickest sections, up to<br />
6 m thick, are found in the southern part <strong>of</strong> the<br />
Suurpelto area. These sections also contain sulphide<br />
clays that lie on average 3-4 m below the Litorina<br />
Sea sulphides. The summed sediment volume <strong>of</strong><br />
units 7, 6 and 5 is <strong>of</strong> a similar magnitude to that <strong>of</strong><br />
the summed units 10, 9 and 8 (Table 2).<br />
Deposits <strong>of</strong> the lowermost three units (units 1, 2<br />
and 3) are then more widely distributed throughout<br />
the Suurpelto area. In particular, varved and massive<br />
clays <strong>of</strong> Baltic Ice Lake form a thick lowermost<br />
section <strong>of</strong> the <strong>fi</strong> ne-grained deposits <strong>of</strong> Suur-<br />
Fig. 6. Thickness and distribution <strong>of</strong> sediments in the Suurpelto area deposited in different Baltic Sea phases.<br />
Note that the most organic deposits (from the Lake and Litorina Sea phases) are located in the southern part <strong>of</strong><br />
the basin.
<strong>Geological</strong> <strong>Survey</strong> <strong>of</strong> <strong>Finland</strong>, <strong>Special</strong> <strong>Paper</strong> <strong>46</strong><br />
Sedimentological characteristics <strong>of</strong> Late-Weichselian–Holocene deposits <strong>of</strong> the Suurpelto area in Espoo, southern <strong>Finland</strong><br />
pelto that extends all around the basin, including the<br />
fringe areas. Deposits <strong>of</strong> varved and massive clayey<br />
lie directly below the topsoil in the fringe areas <strong>of</strong><br />
the Suurpelto basin. Their volume is about twice as<br />
great as that <strong>of</strong> other BSB phases and the deposits<br />
are mostly evenly distributed.<br />
The pattern <strong>of</strong> total thickness <strong>of</strong> <strong>fi</strong> ne-grained<br />
sediment deposits (Fig. 7) correlates rather well<br />
with the thicknesses <strong>of</strong> the uppermost 4 or 5<br />
sedimentary units. There are three main basins in<br />
the Suurpelto area that have thicker than average<br />
(10.6 m) sections <strong>of</strong> <strong>fi</strong> ne-grained deposits. These<br />
basins follow bedrock fracture zones. The <strong>fi</strong> rst is<br />
located in the SW part <strong>of</strong> the Suurpelto basin. It<br />
is about 200 m wide and 800 m long with a maximum<br />
sediment thickness <strong>of</strong> > 25 m, and is the main<br />
sedimentary basin that has effectively accumulated<br />
primary and secondary material from erosion. The<br />
second basin in the SE part <strong>of</strong> the Suurpelto area is<br />
also elongated in a SE-NW direction. It has a maximum<br />
sediment thickness <strong>of</strong> 22 m. The third basin<br />
is located in the NE part Suurpelto with up to 15 m<br />
thick sections <strong>of</strong> <strong>fi</strong> ne-grained sediments.<br />
Fig. 8. Cross-sectional pr<strong>of</strong>i les from the Suurpelto area (see Figure 7 for the location <strong>of</strong> these pr<strong>of</strong>i les). They indicate that there<br />
is considerable variation in the thickness <strong>of</strong> <strong>fi</strong> ne-grained deposits in the Suurpelto are in terms <strong>of</strong> the overall thickness and the<br />
thickness <strong>of</strong> different units.<br />
Table 2. Sediment volumes and<br />
positive surface areas <strong>of</strong> different<br />
phases <strong>of</strong> the BSB in the Suurpelto<br />
area.<br />
Fig. 7. The overall thickness <strong>of</strong> <strong>fi</strong> ne-grained deposits<br />
in the Suurpelto area according to the presently<br />
studied locations (see Fig. 3). Red lines indicate the<br />
cross-section <strong>of</strong> pr<strong>of</strong>i le lines 1 and 2 presented in<br />
Fig. 8.<br />
Stratigraphic unit Volume (milj. m 3 ) Area (ha)<br />
Deposits <strong>of</strong> “Top soil” 0.81 125<br />
Deposits <strong>of</strong> Lake phase 1.2 102<br />
Deposits <strong>of</strong> Litorina Sea 2 116<br />
Deposits <strong>of</strong> Ancylus Lake 2.5 118<br />
Deposits <strong>of</strong> Yoldia Sea 2.2 123<br />
Deposits <strong>of</strong> Baltic Ice Lake 4.7 126<br />
155
In summary, the northern part <strong>of</strong> the Suurpelto<br />
area has a thinner sequence <strong>of</strong> <strong>fi</strong> ne-grained deposits.<br />
There are mainly massive clays with a varved<br />
structure and coarser (silt, sand) mineral layers that<br />
represent earlier periods in BSB history, namely<br />
the Baltic Ice Lake and Yoldia Sea phases. In the<br />
southern part <strong>of</strong> the Suurpelto area these Baltic Ice<br />
Lake and Yoldia Sea deposits have been covered<br />
The authors are grateful to the Suurpelto project<br />
partners, particularly to the city <strong>of</strong> Espoo for providing<br />
geotechnical information on the study area<br />
Björck, S. 1995. A review <strong>of</strong> the history <strong>of</strong> the Baltic Sea, 13.0–<br />
8.0 ka BP. Quaternary International 27, 19–40.<br />
Eronen, M. 1990. Evolution <strong>of</strong> the Baltic Sea. In: Alalammi,<br />
P. (ed.) Atlas <strong>of</strong> <strong>Finland</strong>, Folio 123–126: Geology. National<br />
Board <strong>of</strong> <strong>Survey</strong>, Geographical Society <strong>of</strong> <strong>Finland</strong>. 29 p.<br />
Gardemeister, R. 1975. On the engineering-geological properties<br />
<strong>of</strong> <strong>fi</strong> ne-grained sediments in <strong>Finland</strong>. Technical Research<br />
Centre <strong>of</strong> <strong>Finland</strong>, Building technology and community<br />
development. Publications 9. 91 p.<br />
Hyvärinen, H. 1999. Shore displacement and Stone Age dwelling<br />
sites near Helsinki, southern coast <strong>of</strong> <strong>Finland</strong>. In: Huurre,<br />
M. (ed.) Dig it all: papers dedicated to Ari Siiriäinen.<br />
Helsinki: Finnish Antiquarian Society: Archaeological Society<br />
<strong>of</strong> <strong>Finland</strong>, 79–89.<br />
Håkanson, L. & Jansson, M. 1983. Principles <strong>of</strong> lake sedimentology.<br />
Berlin: Springer-Verlag. 316 p.<br />
Kakkuri, J. 1991. Planeetta Maa. Vaasa: Vaasa Oy. 184 p.<br />
Laitala, M. 1991. Pre-Quaternary rocks <strong>of</strong> the Helsinki mapsheet<br />
area. <strong>Geological</strong> Map <strong>of</strong> <strong>Finland</strong> 1: 100 000, Explanation<br />
to the Maps <strong>of</strong> Pre-Quaternary Rocks, Sheet 2034.<br />
<strong>Geological</strong> <strong>Survey</strong> <strong>of</strong> <strong>Finland</strong>. 47 p.<br />
Ojala, A. E. K. & Tanska, H. 2006. Suurpelto – Syntyja syviä.<br />
Geotekniikan Päivät 23.11.2006, <strong>Finland</strong>ia-talo, Helsinki.<br />
Suomen Geoteknillinen yhdistys, 79–84.<br />
Ojala, A. E. K., Vanhala, H., Palmu, J.-P., Ikävalko, O. &<br />
Lintinen, P. 2006. Combining geophysical, sedimentological<br />
and geotechnical information to characterize geologi-<br />
156<br />
ACKNOWLEDGEMENTS<br />
REFERENCES<br />
by more organic and sulphide-containing deposits<br />
representing later phases <strong>of</strong> the BSB and an ancient<br />
isolated Suurpelto lake phase. The southern part<br />
is also characterized by thicker sequences <strong>of</strong> <strong>fi</strong> negrained<br />
material, partly from primary accumulation<br />
and partly from erosion and the redeposition <strong>of</strong><br />
secondary material.<br />
and drilling assistance. We also thank the two reviewers<br />
for their valuable comments which helped<br />
to improve the quality <strong>of</strong> the manuscript.<br />
cal history <strong>of</strong> Suurpelto contruction site in Espoo, southern<br />
<strong>Finland</strong>. 5th European Congress on Regional Geoscienti<strong>fi</strong> c<br />
Cartography and Information Systems, Barcelona, Spain,<br />
13–16 June 2006. Abstract volume.<br />
Palmu, J.-P., Ojala, A. E. K., Ikävalko, O. & Vanhala, H.<br />
2006. 3D modelling <strong>of</strong> construction suitability in Espoo,<br />
<strong>Finland</strong>. The 10th International Congress <strong>of</strong> the IAEG, Nottingham,<br />
United Kingdom, 6–10 September 2006. Abstract<br />
volume, 358.<br />
Putkinen, S. & Saarelainen, J. 1998. Kullenbergin näytteenottimen<br />
uusi kevennetty malli (A lighter model <strong>of</strong> Kullenberg’s<br />
sampler). Geologi 50, 22–23.<br />
Saarnisto, M. & Saarinen, T. 2001. Deglaciation chronology<br />
<strong>of</strong> the Scandinavian Ice Sheet from the Lake Onega Basin<br />
to the Salpausselkä End Moraines. Global and Planetary<br />
Change 31, 387–405.<br />
Sandgren, P. & Snowball, I. 2001. Application <strong>of</strong> mineral<br />
magnetic techniques to paleolimnology. In: Last, W. M.<br />
& Smol, J. P. (eds.) Developments in Paleoenvironmental<br />
Research. Tracking Environmental Change Using Lake<br />
Sediments, Volume 2: Physical and Geochemical Methods.<br />
Dordrecht: Kluwer Academic Publisher, 217–237.<br />
Sauramo, M. 1923. Studies on Quaternary varve sediments in<br />
southern <strong>Finland</strong>. Bulletin Commission Géologique <strong>Finland</strong>e<br />
60. 164 p.<br />
Troels-Smith, J. 1955. Characterisation <strong>of</strong> unconsolidated sediments.<br />
<strong>Geological</strong> <strong>Survey</strong> <strong>of</strong> Denmark, ser IV, 3. 73 p.
Applied Quaternary research in the central part <strong>of</strong> glaciated terrain,<br />
edited by Peter Johansson and Pertti Sarala.<br />
<strong>Geological</strong> <strong>Survey</strong> <strong>of</strong> <strong>Finland</strong>, <strong>Special</strong> <strong>Paper</strong> <strong>46</strong>, 157–161, 2007.<br />
MORPHOTECTONIC INVESTIGATIONS OF THE ANTARCTIC<br />
by<br />
Alexander N. Lastochkin1 1, 2<br />
and Alexandra Y. Krotova-Putintseva<br />
Lastochkin, A. N. & Krotova-Putintseva A. Y. 2007. Morphotectonic<br />
investigations <strong>of</strong> the Antarctic. Applied Quaternary research<br />
in the central part <strong>of</strong> glaciated terrain. <strong>Geological</strong> <strong>Survey</strong><br />
<strong>of</strong> <strong>Finland</strong>, <strong>Special</strong> <strong>Paper</strong> <strong>46</strong>, 157–161, 3 <strong>fi</strong> gures.<br />
New data on the subglacial-submarine relief structure <strong>of</strong> the<br />
Antarctic were obtained during geomorphologic investigations<br />
on the basis <strong>of</strong> the morphodynamic concept and system-morphologic<br />
principle. General geomorphologic investigations were<br />
followed by special morphodynamic investigations, including<br />
morphotectonic interpretations <strong>of</strong> general geomorphologic and<br />
morphometric maps as well as available geological and geophysical<br />
data. As a result, a morphotectonic map <strong>of</strong> the Antarctic<br />
is presented.<br />
Key words (GeoRef Thesaurus, AGI): geomorphology, tectonics,<br />
morphostructures, tectonic maps, Antarctica.<br />
1 Saint-Petersburg State University V. O. 10th line,<br />
33, 199178, Saint-Petersburg, Russia<br />
2 A. P. Karpinsky Russin <strong>Geological</strong> Research<br />
Institute (VSEGEI) Sredny pr., 74, 199106,<br />
Saint-Petersburg, Russia<br />
E-mail: avacha2001@rambler.ru<br />
157
<strong>Geological</strong> <strong>Survey</strong> <strong>of</strong> <strong>Finland</strong>, <strong>Special</strong> <strong>Paper</strong> <strong>46</strong><br />
Alexander N. Lastochkin and Alexandra Y. Krotova-Putintseva<br />
Hypsobathymetric data (Lythe et al. 2000) and the<br />
morphodynamic concept with its system-morphologic<br />
principle (Lastochkin 1991), applied to the<br />
subglacial-submarine surface <strong>of</strong> the Antarctic have<br />
provided new notions about the morphotectonics <strong>of</strong><br />
the Antarctic.<br />
We assumed that the lifetime <strong>of</strong> ice cover – 25-35<br />
million years (Losev 1982) is commensurable with<br />
158<br />
INTRODUCTION<br />
the neotectonic period <strong>of</strong> Earth crust evolution. In<br />
general, neotectonic movements de<strong>fi</strong> ned the height<br />
and depth amplitude <strong>of</strong> modern relief, and morphology<br />
and contrast <strong>of</strong> its forms. The latter were<br />
preserved from lithodynamic processes and are the<br />
most objective indicators <strong>of</strong> concurrent tectonic<br />
movements.<br />
PRINCIPLES OF MORPHOTECTONIC ZONING OF THE ANTARCTIC<br />
A morphotectonic map (Figs. 1, 2, 3) is the result <strong>of</strong><br />
morphotectonic interpretations <strong>of</strong> subglacial-sub-<br />
marine relief orography. The morphotectonic map<br />
shows morphotectonic regions (morphotectonic<br />
Fig. 1. Morphotectonic map <strong>of</strong> the Antarctic (authors: Lastochkin A. N., Krotova-Putintseva A. Y.)
Fig. 2. Legend <strong>of</strong> the morphotectonic map <strong>of</strong> the Antarctic (morphostructures).<br />
Fig. 3. Legend <strong>of</strong> the morphotectonic map <strong>of</strong> the Antarctic<br />
(morphotectonic regions).<br />
<strong>Geological</strong> <strong>Survey</strong> <strong>of</strong> <strong>Finland</strong>, <strong>Special</strong> <strong>Paper</strong> <strong>46</strong><br />
Morphotectonic investigations <strong>of</strong> the Antarctic<br />
159
<strong>Geological</strong> <strong>Survey</strong> <strong>of</strong> <strong>Finland</strong>, <strong>Special</strong> <strong>Paper</strong> <strong>46</strong><br />
Alexander N. Lastochkin and Alexandra Y. Krotova-Putintseva<br />
zoning) and areal, linear and point morphostructures.<br />
Areal morphostructure is considered to be a<br />
three-dimensional morphogeodynamic formation<br />
– a part <strong>of</strong> the Earth’s surface and the corresponding<br />
block <strong>of</strong> the Earth’s crust, which as a whole undergoes<br />
tectonic and/or isostatic movements <strong>of</strong> certain<br />
intensity and direction. Linear morphostructures<br />
(lineaments) imply expression <strong>of</strong> disjunctive dislocations<br />
in the subglacial-submarine relief <strong>of</strong> the<br />
Antarctic. Lineaments con<strong>fi</strong> ne and intersect with<br />
areal morphostructures. Point morphostructures<br />
include active and dormant volcanoes revealed on<br />
geological and geophysical data (Gonzalez-Ferran<br />
1982). Contour morphostructures are concentric<br />
and radial morphostructures <strong>of</strong> a central type and<br />
are the result <strong>of</strong> structural-coordinate net analysis<br />
(Lastochkin 1991).<br />
The criteria for detachment, contouring and<br />
determination <strong>of</strong> morphotectonic regions and areal<br />
morphostructures are their exposure in orography,<br />
spatial relations with linear morphostructures that<br />
con<strong>fi</strong> ne them, and relationship to contours from<br />
structural-morphometric maps (Lastochkin 2006):<br />
maps <strong>of</strong> polyapexial and polybasis surfaces <strong>of</strong><br />
the Antarctic; maps <strong>of</strong> the differences between<br />
polyapexial and polybasis surfaces; maps <strong>of</strong> the differences<br />
between polyapexial and subglacial-submarine<br />
surface; and maps <strong>of</strong> the differences between<br />
subglacial-submarine and polybasis surfaces.<br />
Morphotectonic formations can be characterized<br />
by 2 components: a) geological notion <strong>of</strong> mineralogical<br />
composition and b) geomorphologic data on<br />
their external form and borders as well as the data<br />
on trend and intensity <strong>of</strong> shift in the neotectonic period.<br />
For lack <strong>of</strong> data on the Antarctic, geological<br />
notions <strong>of</strong> mapped morphostructures’ mineralogy<br />
include only the information about which tectonic<br />
This research presents the <strong>fi</strong> rst detailed description<br />
<strong>of</strong> the morphotectonic plan <strong>of</strong> the Antarctic (<strong>fi</strong> rst<br />
scheme <strong>of</strong> neotectonics dates back in 1970s). Inves-<br />
We thank Polar Marine <strong>Geological</strong> Research Expedition<br />
for the provided geophysical data. The authors<br />
160<br />
CONCLUSIONS<br />
ACKNOWLEDGEMENTS<br />
region (that underwent one or another tendency <strong>of</strong><br />
its evolution during the neotectonic period) they<br />
belong to.<br />
A combination <strong>of</strong> tectonic (Grikurov et al. 2003),<br />
structural – minerogenetic, geomorphologic zoning<br />
and orographic mapping <strong>of</strong> the Antarctic as well<br />
as notions on morphotectonics (U<strong>fi</strong> mtsev 2002)<br />
and Mesozoic tectonics (Bogolepov 1967) allowed<br />
for the de<strong>fi</strong> nition <strong>of</strong> morphotectonic regions (biggest<br />
forms <strong>of</strong> subglacial – submarine surface <strong>of</strong> the<br />
Antarctic caused by neotectonic movements): areas<br />
<strong>of</strong> continental row (epiplatform orogens, piedmont<br />
plains, platform plains, subsidence plains on the<br />
block-folded basement), <strong>of</strong> geosynclinal-folded row<br />
(epigeosynclinal orogens and volcanic belt, epigeosynclinal<br />
shelves, slopes <strong>of</strong> transitional zones from<br />
continent to ocean), passive type continental margins<br />
(shelves, continental bench and continental slope),<br />
and oceanic rows (oceanic basins, middle-oceanic<br />
and block-volcanic ridges). Morphotectonic regions<br />
are presented by well-distinguished categories and<br />
by transitional units that occupy an intermediate<br />
position between <strong>fi</strong> rst ones. They are, for example,<br />
piedmont plains separating orogens from platform<br />
plains on a continent. Continental benches include<br />
transitional areas between continental regions and<br />
continental slope. Shelf regions are characterized<br />
into 2 different types <strong>of</strong> shelves: 1) shelves <strong>of</strong> continental<br />
platform and Mesozoic-Cenozoic sedimentary<br />
basins and 2) shelves <strong>of</strong> a geosynclinal-folded<br />
type.<br />
A continental row consists <strong>of</strong> the ancient east<br />
Antarctic craton regions; epiplatform orogens and<br />
subsidence plains on the block-folded basement <strong>of</strong><br />
the Transantarctic province, which are transitional<br />
to the Paci<strong>fi</strong> c geosynclinal-folded province.<br />
tigation results provide the basis for future studies<br />
on tectonics, lithodynamics and glaciodynamics.<br />
thank colleges from VSEGEI and Saint Petersburg<br />
State University for assistance.
Bogolepov, K. V. 1967. Mesozoic tectonics <strong>of</strong> Siberia. Moscow:<br />
Nauka. (in Russian)<br />
Gonzalez-Ferran, O. 1982. The Antarctic Cenozoic volcanic<br />
provinces and their implication in plate tectonic processes.<br />
In: Craddock, C. (ed.) Antarctic Geoscience. Wisconsin:<br />
The University <strong>of</strong> Wisconsin Press, 687–694.<br />
Grikurov, G. E., Leitchenkov, G. L., Kamenev, Y. N., Mihalskiy,<br />
Y. V., Golinskiy, A. V., Masolov, V. N. & Lajba, A.<br />
A. 2003. Tectonic zoning <strong>of</strong> the Antarctic and its minerogeny.<br />
The Arctic and the Antarctic, Bulletin 2 (36), 16–47.<br />
(in Russian)<br />
REFERENCES<br />
<strong>Geological</strong> <strong>Survey</strong> <strong>of</strong> <strong>Finland</strong>, <strong>Special</strong> <strong>Paper</strong> <strong>46</strong><br />
Morphotectonic investigations <strong>of</strong> the Antarctic<br />
Lastochkin, A. N. 1991. Relief <strong>of</strong> earth surface. Leningrad. (in<br />
Russian)<br />
Lastochkin, A. N. 2006. Subglacial geomorphology <strong>of</strong> the Antarctic.<br />
Vol. I. The general geomorphologic investigations <strong>of</strong><br />
Antarctic. Saint-Petersburg, in press. (in Russian)<br />
Losev, K. S. 1982. The Antarctic ice cover. Moscow. (in Russian)<br />
Lythe, M. B., Vaughan, D. G. & the BEDMAP Consortium<br />
2000. BEDMAP – bed topography <strong>of</strong> the Antarctic,<br />
1:10 000 000 scale map. BAS (Misc) 9. Cambridge: British<br />
Antarctic <strong>Survey</strong>.<br />
U<strong>fi</strong> mtsev, G. F. 2002. Morphotectonics <strong>of</strong> Eurasia. Moscow.<br />
(in Russian)<br />
161
www.gtk.<br />
info@gtk.<br />
e Peribaltic Group is an INQUA (International Union<br />
for Quaternary Research) research group, bringing together<br />
Quaternary researchers from countries around the Baltic<br />
Sea. e 2006 meeting <strong>of</strong> the working group took place from<br />
11th to 15th September in <strong>Finland</strong>, at the Oulanka research<br />
station in Kuusamo. Researchers came together to discuss<br />
and share the latest research results about climate changes<br />
during the Weichselian Ice Age, the movement <strong>of</strong> glaciers, the<br />
morphological features they formed and the development <strong>of</strong><br />
the vegetation. Totally 48 lectures were given. is publication<br />
contains the peer reviewed papers <strong>of</strong> 21 lectures.<br />
ISBN 978-952-217-021-7 (PDF)<br />
ISBN 978-952-217-006-4 (paperback)<br />
ISSN 0782-8535<br />
,!7IJ5C2-bhaage!