Prediction and Determination of Undrained Shear Strength of Soft ...
Prediction and Determination of Undrained Shear Strength of Soft ...
Prediction and Determination of Undrained Shear Strength of Soft ...

Create successful ePaper yourself
Turn your PDF publications into a flip-book with our unique Google optimized e-Paper software.
MA. jamal, T. Raihan, A. jimjali, AX Azmi, J. Azmi <strong>and</strong> J. jamilah<br />
4<br />
o<br />
2<br />
4<br />
6<br />
8<br />
GWT Y<br />
Stiff clay +roots+silt<br />
Fill<br />
• •<br />
•<br />
••<br />
Stiff clay+roots<br />
S<strong>of</strong>t clay+roots •<br />
••<br />
•••<br />
S<strong>of</strong>t clay + -- •<br />
traces <strong>of</strong> roots<br />
•<br />
• • ---- '---'<br />
S<strong>of</strong>t clay ----•<br />
S<strong>of</strong>t clay+fine s<strong>and</strong><br />
•<br />
•<br />
••<br />
Fine s<strong>and</strong><br />
10 o 50% 100%<br />
PL LL<br />
....:..----<br />
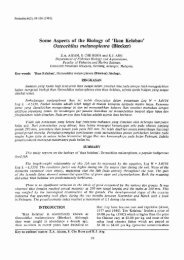
Fig 2: Borehol£ pr<strong>of</strong>ile<br />
• moisture content<br />
Results <strong>of</strong> the Atterberg Limit tests are shown in Table 1. Plastic limit was<br />
in the range <strong>of</strong> 30-45% with average value <strong>of</strong> 36%. Liquid limit ranges between<br />
75-95% with an average value <strong>of</strong> 86%. The water content was mostly found to<br />
TABLE 1<br />
Results <strong>of</strong> some basic soil tests<br />
Depth Moisture Liquid Limit Plastic Limit Specific Gravity<br />
(m) Contents (%) (%) (%) <strong>of</strong> Solid Solids<br />
4.20 77 75 30 2.51<br />
5.26 78 84 41 2.50<br />
6.20 88 94 36 2.50<br />
7.05 90 84 35 2.57<br />
8.07 84 82 33 2.54<br />
9.07 92 95 35 2.62<br />
10.05 92 93 36 2.62<br />
11.05 97 90 39 2.62<br />
12.07 84 86 45 2.70<br />
13.07 74 80 30 2.55<br />
114 PertanikaJ. Sci. & Technol. Vol. 5 0.1,1997<br />
•
<strong>Prediction</strong> <strong>and</strong> <strong>Determination</strong> <strong>of</strong> <strong>Undrained</strong> <strong>Shear</strong> <strong>Strength</strong> <strong>of</strong> S<strong>of</strong>t Clay<br />
TABLE 2<br />
Comparison <strong>of</strong> basic properties <strong>of</strong> different clays<br />
Clay w LL PL PI<br />
(%) (%) (%) (%)<br />
Klang 66-107 75-95 30-45 41-60<br />
Singapore 50-83 50-90 18-22 30-50<br />
Bangkok 68 65 24 41<br />
Boston 38.42 45-55 23-24 19-31<br />
London 32 95 30 65<br />
Weald 55-85 20-49 365-46<br />
orway 27-40 25-36 17-20 18-24<br />
Leda 28-50 20-45 18-24 5-20<br />
James Bay 22-38 26-38 14..18 5-18<br />
PL - Plastic limit w = Water Content<br />
LL - Liquid limit PI = Plastic Index<br />
Unit weight<br />
kN/m 3<br />
13.8-15.1<br />
12.7-18.6<br />
12.7-14.7<br />
15.7<br />
16.7-19.6<br />
17.7-19.6<br />
be almost equal to its liquid limit. This leads to a liquidity index <strong>of</strong> unity <strong>and</strong><br />
therefore indicates the possibility that the soil is normally consolidated.<br />
The coordinates <strong>of</strong> the plasticity index <strong>and</strong> liquid limit are mainly<br />
concentrates at the upper end along the A-line <strong>of</strong> the Cassagr<strong>and</strong>e Chart.<br />
Therefore, the clay may be classified as a highly plastic clay, CH or high<br />
plastic organic clay, OH. Using the AASHTO system, Klang clay can be<br />
grouped under A-7-5.<br />
The specific gravity values <strong>of</strong> the soil are not consistent due to the existence<br />
<strong>of</strong> line s<strong>and</strong>, roots <strong>and</strong> old wood pieces in some parts. These values are also<br />
shown in Table 1. The average unit weight <strong>of</strong> the soil is about 14.35 kN/m 3 .<br />
Comparisons <strong>of</strong> the index properties with other clays such as London clay,<br />
Norwegian clay <strong>and</strong> Boston Blue clay are given in Table 2. It can be observed<br />
that Klang clay values are higher than those <strong>of</strong> the other clays.<br />
DSS Apparatus<br />
Direct simple shear apparatus available in UKM is <strong>of</strong> type NGI (Norwegian<br />
Geotechnical Institute), Model H-12. In this apparatus, the soil sample is<br />
sheared by introducing lateral stress to the top part <strong>of</strong> the sample while the<br />
bottom remains unmoved. Constant volume tests are performed using an<br />
automatic sample height. The primary feature <strong>of</strong> this apparatus is the use <strong>of</strong><br />
a rubber membrane reinforced by wires. This membrane restrains the changes<br />
in its perimeter in order to ensure uniform distribution <strong>of</strong> stress <strong>and</strong> strain in<br />
the sample.<br />
The simple shear test gives a better uniform stress-strain relationship compared<br />
to the direct shear test. In addition, the direct shear test creates problems in<br />
interpretation <strong>of</strong> test results due to the rotation <strong>of</strong> principal stresses. Further<br />
details <strong>of</strong> this apparatus may be found in Geonor (1968) <strong>and</strong> Azmi (1991).<br />
PertanikaJ. Sci. & Techno!' Vo!. 5 No.1, 1997 115
M.A. jamal, T. Raihan, A. jimjali, A.K. Azmi, J. Azmi <strong>and</strong> J. jamilah<br />
As various kinds <strong>of</strong> construction lead to the application <strong>of</strong> different loading<br />
conditions to the soil, several laboratory tests were developed to reproduce or<br />
simulate the loading conditions in the laboratory. The strength measured<br />
using DSS apparatus represents the average mobilized strength for embankment<br />
stability <strong>of</strong> s<strong>of</strong>t clay (Trak et al. 1980), s<strong>of</strong>t ground beneath spread footings<br />
(Kinner <strong>and</strong> Ladd 1973), <strong>and</strong> shaft resistance along pile foundation (R<strong>and</strong>olf<br />
<strong>and</strong> Wroth 1981). Based on the Su <strong>of</strong> 50 different s<strong>of</strong>t clays, Mayne (1985)<br />
observed that the DSS test gave values between that <strong>of</strong> triaxial compression <strong>and</strong><br />
triaxial extension tests.<br />
<strong>Prediction</strong> <strong>of</strong> s. using SHANSEP Procedure<br />
The SHANSEP method was first introduced by Ladd <strong>and</strong> Foott (1974). It is a<br />
procedure that can be used for design purposes <strong>and</strong> for examining stability <strong>of</strong><br />
s<strong>of</strong>t clay that shows a normalized behaviour. A soil parameter is normalized by<br />
reducing it to a dimensionless number. Here, a normalized parameter is<br />
obtained by dividing Su to the in situ effective stress o".e or to effective confining<br />
pressUl;e (j've <strong>of</strong> the test. In this method, stress history, which is represented by<br />
the overconsolidation ratio, OCR, is believed to have a great influence on the<br />
strength <strong>of</strong> soil. This technique requires a plot <strong>of</strong> normalized Su versus OCR.<br />
OCR at any depth can be predicted using a high quality oedometer test. The<br />
past maximum consolidation pressure, o·yma>. can be computed from an<br />
oedometer test, which gives OCR values at any depth. This can be used to<br />
predict Su for that particular depth using a plot <strong>of</strong> normalized Su versus OCR.<br />
The SHANSEP method can be obtained using different equipment such as<br />
triaxial apparatus, shear box apparatus <strong>and</strong> DSS apparatus<br />
A study was conducted to obtain a plot <strong>of</strong> normalized Su versus OCR for s<strong>of</strong>t<br />
marine clay in Klang in order to facilitate design <strong>and</strong> construction. Fig. 3 shows<br />
the normalized Su versus OCR plot for s<strong>of</strong>t clay for Klang clay using the DSS<br />
apparatus. The values for other commonly reported clays are also plotted in<br />
the figure. It can be seen that the Klang clay plot follows the same pattern as<br />
the other plots. The equation for this curve can be written as follows.<br />
Su I cr'vc (CKoUDSS) = 0.259xOCRo. 78<br />
The plot is used to estimate Su at any particular depth if OCR from the<br />
oedometer test at the same depth is available. For this calculation, the OCR was<br />
obtained from the work <strong>of</strong>JamilahJaadil (1991). Su at different depths is shown<br />
in Table 3. A sample calculation is demonstrated below.<br />
Sample Calculation<br />
At the depth <strong>of</strong> 4.94 m, O'YO <strong>and</strong> (j've are 22.4 kN/m 2 <strong>and</strong> 61 kN/m 2 ,<br />
respectively. So OCR is 2.7. Therefore,<br />
116<br />
Su / "., = 0 259 x 2 7°·78 = 056<br />
U va' . .<br />
Su = 0.56 x 22.4kN / m 2 = 12.6 kN / m 2<br />
PertanikaJ. Sci. & Techno!. Vo!. 5 No.1, 1997<br />
(1)
M.A. Jamal, T. Raihan, A. Jimjali, A.K. Azmi, J. Azmi <strong>and</strong> J. Jamilah<br />
<strong>Determination</strong> <strong>of</strong> Su using Critical State Model<br />
Even though the use <strong>of</strong> critical state soil mechanics, CSSM, is not so popular in<br />
engineering design practice, it serves as a powerful tool in underst<strong>and</strong>ing the<br />
behaviour <strong>of</strong> soils. Most other subjects deal with deformation <strong>and</strong> strength<br />
properties separately, but in CSSM they are interdependent.<br />
A deformation parameter, A will be later proven crucial in predicting the<br />
undrained shear strength pr<strong>of</strong>ile <strong>of</strong> a particular deposit. The aim <strong>of</strong> this<br />
section is to utilize the critical state concept to estimate undrained shear<br />
strength for any degree <strong>of</strong> overconsolidation ratio based only on two soil<br />
parameters (Mayne 1980). These parameters are the effective friction angle '<br />
<strong>and</strong> the parameter A.<br />
As explained earlier, the undrained strength ratio s/ cr'vo is a function <strong>of</strong><br />
OCR. Since clay layers are usually slightly or heavily consolidated or at least<br />
have an overconsolidated crust, research on the relationship between these two<br />
parameters has been an area <strong>of</strong> interest (e.g. Ladd <strong>and</strong> Edgers 1972). The<br />
relationship in equation (1) could also be conveniently presented as<br />
su / cr' vo = (su / cr' vo )nc xOCR m<br />
where, nc denotes normally consolidated <strong>and</strong> m is the linear slope <strong>of</strong><br />
su Icr'vo vs GCRon a log-log plot.<br />
Wroth (1984) derived a similar expression for an isotropically consolidated<br />
undrained compression triaxial test, CI C, <strong>and</strong> concluded that the undrained<br />
strength ratio is proportional to the overconsolidation ratio with exponent A.<br />
This parameter was also termed a parameter relating swelling with compression<br />
(Sch<strong>of</strong>ield <strong>and</strong> Wroth 1968) <strong>and</strong> the critical state pore pressure parameter<br />
(Mayne 1980). It is usually determined from isotropic consolidation test in the<br />
trixial cell <strong>and</strong> is defined as<br />
A = (A-K) / A = I-KIA<br />
where<br />
A = slope <strong>of</strong> isotropic consolidation line from V vs In p' plot<br />
<strong>and</strong><br />
K = slope <strong>of</strong> isotropic swelling line from v vs In p' plot.<br />
Another method to determine A <strong>and</strong> K is from the oedometer test. It has<br />
been concluded that both one-dimensional consolidation <strong>and</strong> swelling lines<br />
have slopes close to A <strong>and</strong> K, respectively (Atkinson <strong>and</strong> Bransby 1978).<br />
Therefore, the above equation can be rewritten as<br />
A = l-C,IC c<br />
where<br />
C = swelling index from oedometer test<br />
c: = compression index from oedometer test<br />
118<br />
PertanikaJ. Sci. & Techno\. Vo\. 5 No.1, 1997<br />
(2)
<strong>Prediction</strong> <strong>and</strong> <strong>Determination</strong> <strong>of</strong> <strong>Undrained</strong> <strong>Shear</strong> <strong>Strength</strong> <strong>of</strong> S<strong>of</strong>t Clay<br />
It should be noted that the current practice is to plot the void ratio against loglO<br />
cr' to determine C <strong>and</strong> C. Therefore a factor <strong>of</strong> 2.303 should be divided to<br />
vc C S<br />
convert these parameters to "J.... <strong>and</strong> K.<br />
Mayne (1980) compared m from strength tests <strong>and</strong> Adetermined from onedimensional<br />
consolidation tests <strong>and</strong> concluded that differences between these<br />
two parameters are due to the difficulty in determining C.. Furthermore, the<br />
slope C, is usually not linear.<br />
Based on the critical state concept, Sch<strong>of</strong>ield <strong>and</strong> Wroth (1968) arrived at<br />
a simple expression for the undrained strength ratio for a normally consolidated<br />
clay:<br />
since<br />
M = (6 sin ')/(3-sin ')<br />
therefore,<br />
(s I(cr') = (3 sin «j>' exp(-"J....» 1 (3 - sin ')<br />
tI \'0 nc<br />
The value ' can be obtained from several type <strong>of</strong> tests such as the triaxial,<br />
direct. shear box or direct simple shear test. Different tests produce different<br />
values <strong>of</strong> '. The most suitable value <strong>of</strong> ' to be used in the CSSM concept is<br />
from CIUC test at critical state.<br />
The preceding discussion gives sufficient information to predict the shear<br />
strength pr<strong>of</strong>ile from a series <strong>of</strong> conventional oedometer tests <strong>and</strong> the value <strong>of</strong><br />
' from any tests without actually studying the relationship between OCR <strong>and</strong><br />
suo This is useful for small projects where extensive testing programmes such as<br />
SHANSEP method are not economically feasible. For the purpose <strong>of</strong>clarification,<br />
a sample calculation <strong>of</strong> Su for the test borehole is given below. Table 4 gives Su<br />
pr<strong>of</strong>ile from eight sets <strong>of</strong> consolidation information.<br />
TABLE 4<br />
s u from critical state model<br />
Depth cr' cr' OCR C \'lllax c Cs A. (sjcr'v)nc su/cr',u su<br />
(m) (kPa) '" (kPa) (kPa)<br />
1.14 5.2 132 22.5 0.795 0.099 0.88 0.19 3.25 16.8<br />
2.94 13.3 64 4.8 1.041 0.171 0.84 0.20 0.74 9.8<br />
3.93 17.8 41 2.3 0.900 10.177 0.81 0.20 0.40 7.1<br />
4.94 22.4 61 2.7 1.065 0.237 0.78 0.21 0.46 10.3<br />
5.94 27.0 32 1.2 0.864 0.255 0.70 0.23 0.26 6.9<br />
6.94 31.5 27 0.9 0.912 0.267 0.71 0.23 0.20 6.4<br />
7.94 36.0 40 1.1 0.759 0.213 0.72 0.22 0.24 8.7<br />
8.94 40.6 54 1.3 0.828 0.186 0.78 0.21 0.26 10.7<br />
PertanikaJ. Sci. & Techno!. Vo!. 5 10.1,1997 119<br />
(3)
<strong>Prediction</strong> <strong>and</strong> <strong>Determination</strong> <strong>of</strong> <strong>Undrained</strong> <strong>Shear</strong> <strong>Strength</strong> <strong>of</strong> S<strong>of</strong>t Clay<br />
bring it back to the former stress in the field before shearing is applied. Two<br />
practices are usually chosen to select the reconsolidation pressure (Jamiolkowski<br />
1979). One is to reconsolidate the specimen under K conditions, at existing<br />
o<br />
in situ effective stresses a,-.o <strong>and</strong> a'hO= Koa'vo (Bjerrum 1973) before shearing<br />
starts. The other practice is to reconsolidate the specimen under K conditions<br />
o<br />
at pressure well beyond existing in situ stresses for the case <strong>of</strong> effective<br />
normally consolidated deposits, <strong>and</strong> well beyond maximum past vertical<br />
consolidation stress, a'vmax when dealing with overconsolidated deposits (Ladd<br />
et al. 1977). As with SHANSEP, this method can be done using different<br />
apparatus where consolidation is possible, such as triaxial apparatus, shear<br />
box apparatus <strong>and</strong> DSS apparatus. Unlike SHANSEP, SU is measured directly<br />
from the test.<br />
In this study, samples taken at three different depths at Bukit Raja site in<br />
Klang are reconsolidated under K condition, to a'vo value, before the<br />
o<br />
application <strong>of</strong> shear stress. However, it is quite difficult to get an accurate<br />
(a'va due to problems related to friction in the apparatus (Azmi 1991). Table<br />
5 shows s values obtained from this method. It can be seen that the s value<br />
u u<br />
is high at the top <strong>of</strong> the borehole, decreasing to certain depth <strong>and</strong> increasing<br />
again.<br />
TABLE 5<br />
s" from recompression method<br />
Sample Depth cr' vo cr' ,max cr' ve su<br />
umber (m) (kPa) (kPa) (kPa) (kPa)<br />
Ul4A1 5.6 25.4 40.2 29.4 9.9<br />
U16A1 6.4 29.1 33.3 29.1 9.1<br />
Ul8A1 7.4 33.6 32.3 34.8 11.3<br />
Field <strong>and</strong> Laboratory Vane <strong>Shear</strong><br />
Field vane test (FVT), is a very popular in situ test due to its cost <strong>and</strong> simplicity.<br />
It has been widely used in most parts <strong>of</strong> the world since its introduction in 1950.<br />
As noted by Ladd et al. (1977), among the deficiencies <strong>of</strong> the vane test is its<br />
interpretation, which is based on the assumption <strong>of</strong> full mobilization <strong>of</strong> the<br />
strength along a cylindrical failure surface. However, x-ray pictures taken<br />
during a laboratory vane test on a cemented sensitive clay showed no evidence<br />
<strong>of</strong> a shear surface at peak strength. Therefore, it was suggested that FVT should<br />
be considered as a "strength index" test requiring empirical correlations to give<br />
suitable values for design.<br />
In this study Su is measured in situ using a field vane <strong>of</strong> Geonor type <strong>and</strong><br />
in the laboratory using a laboratory vane <strong>of</strong> ELE type. The strain rate used to<br />
perform the tests were 12 mm/min <strong>and</strong> 10 mm/min for field <strong>and</strong> laboratory,<br />
respectively. These values were then corrected according to the procedure<br />
suggested by Bjerrum (1973). It is assumed that the strength is uniform with<br />
depth <strong>and</strong> plasticity index is an interpolated value.<br />
PertanikaJ Sci. & Techno!. Vo!. 5 No.1, 1997 121
M.A. Jamal, T. Raihan, A. Jimjali, A.K. Azmi, J. Azmi <strong>and</strong> J. Jamilah<br />
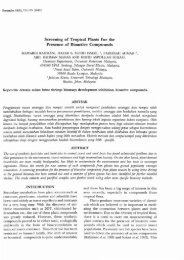
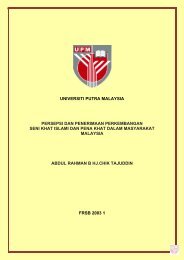
<strong>Undrained</strong> shear strength Su, kPa<br />
o 10 20 30<br />
o<br />
2<br />
3<br />
- 4<br />
E-.c 5<br />
-a.<br />
Q)<br />
0<br />
6<br />
7<br />
8<br />
9<br />
10<br />
-<br />
-<br />
-<br />
- c<br />
- C<br />
- c<br />
c<br />
0<br />
"<br />
c<br />
c<br />
"<br />
"<br />
"<br />
• Lndiatllbed foeltt<br />
• Rtrnoukled fiHl<br />
" Lndiatllbed lab<br />
o Corrected fiHl<br />
Corrected Ieb<br />
Fig. 4: Actual <strong>and</strong> corrected values <strong>of</strong> vane shear lest<br />
Fig. 4 gives the actual, corected <strong>and</strong> remolded Su from field <strong>and</strong> laboratory<br />
vane with depth. It is noted that the corrected value is about 80% lower than<br />
the actual value. The sensitivity was found to be between 2 <strong>and</strong> 6.<br />
DISCUSSION AND CONCLUSIONS<br />
The SHANSEP method <strong>and</strong> critical state approach used to estimate the Su<br />
provide comparable results to the Su from the field, <strong>and</strong> laboratory vane <strong>and</strong><br />
the compression method values. In Fig. 5, the undrained shear strength from<br />
SHANSEP method, critical state concept, recompression method, <strong>and</strong> field<br />
<strong>and</strong> laboratory vane methods are plotted together. It is noted that both<br />
SHANSEP <strong>and</strong> critical state approach give a close prediction <strong>of</strong> Su to one<br />
another although the latter seems to show a more conservative prediction. Su<br />
values obtained by the recompression method at three depths are comparable<br />
with the Su values obtained by SHANSEP <strong>and</strong> critical state methods. For<br />
example, at a depth <strong>of</strong> 6 m, Su from recompression method, SHANSEP, <strong>and</strong><br />
critical state is 10, 8.5 <strong>and</strong> 7 kPa, respectively. The vane test, however, gives<br />
the highest u' Mter performing corrections, Su values seem to come closer to<br />
values from the other methods.<br />
122<br />
PertanikaJ. Sci. & Technol. Vol. 5 No.1, 1997
<strong>Prediction</strong> <strong>and</strong> <strong>Determination</strong> <strong>of</strong> <strong>Undrained</strong> <strong>Shear</strong> <strong>Strength</strong> <strong>of</strong> S<strong>of</strong>t Clay<br />
jAMIOLKOWSKJ, M., C.C. LAno, J.T. GERMAJN <strong>and</strong> R. LANCEILOTTA. 1985. New developments<br />
in field <strong>and</strong> laboratory testing <strong>of</strong> soils, Proceedings 11th ICSMFE, San Francisco, Vol.1,<br />
p 57-153.<br />
KINNER, E. <strong>and</strong> C.C. Ladd. 1973. <strong>Undrained</strong> bearing capacity <strong>of</strong> footings on clay,<br />
Proceedings 8th ICSMFE, Moscow, Vol. 1 p. 209-215.<br />
LAno, C.C. <strong>and</strong> L. EOGERS. 1972. Consolidated undrained direct simple shear tests on<br />
saturated clays. Research Report R72-82, o. 284 Cambridge: Dept. <strong>of</strong> Civil &<br />
Engin., Massachussettes Institute <strong>of</strong> Technology.<br />
LAno, C.C. <strong>and</strong> R. FOOTT. 1974. ew design procedure for stability <strong>of</strong> s<strong>of</strong>t clays. J. Ceotech.<br />
Engg. ASCE 100 (7): 763-786.<br />
LAno, C.C., R. FOOTT, K. ISHIHARA, F. SCHLOSSER <strong>and</strong> H.G. POULOS. 1977 Stress deformation<br />
<strong>and</strong> strength characteristics, Proceedings 9th ICSMFE, Tokyo, Vol. 2, .p 421-494.<br />
MAHILAH BIBI BINTI MOHAMAD RAFEK 1971. Klang-Langat Delta, Selangor, West Malaysia:<br />
Quaternary sediments, clay minerals <strong>and</strong> foraminera..Unpublished B.Sc.(Hons)<br />
thesis, Universiti Malaya, Kuala Lumpur.<br />
MAYNE, P.W. 1980. Cam-elay predicitions <strong>of</strong> undrained strength. J. Ceotech. Engg. Div.<br />
ASCE 106(GTll): 1219-1242.<br />
MAYNE, P.W. 1985. A review <strong>of</strong> undrained strength in direct simple shear. Soils <strong>and</strong><br />
Foundations, JSSMFE 25(3): 64-72.<br />
MOHO. RAIHAN TAHA,jIMjALI AHMED,jAMILAHjAADIL, AzMI ABU KAssIM <strong>and</strong>jAMAL MOHO. AMIN.<br />
1990. Kelakuan pengukuhan lempung lembut Klang. Kolokium ke-3 Fakulti<br />
Kejuruteraan, UKM.<br />
RANOOPH, M. <strong>and</strong> c.P. WROTH. 1981. Application <strong>of</strong> the failure state in undrained simple<br />
shear. Geotechnique 31(1): 143-157.<br />
SCHOFIELD, A. . <strong>and</strong> C.P WROTH. 1968. Critical State Soil Mechanics. London: McGraw Hill.<br />
TRAK, B. et al. 1980. A new approach to stability analysis on sensitive clays. Canadian<br />
Ceotechnical Journal 17(4): 526-544.<br />
WROTH, C.P 1984. The interpretation <strong>of</strong> in situ soil tests, Ceotechnique 34(4): 449-489.<br />
su<br />
0','0<br />
0"1:<br />
$'<br />
A<br />
A-<br />
C,<br />
C,<br />
K<br />
M<br />
OCR<br />
DSS<br />
NOTATIONS<br />
undrained shear strength<br />
effective overbuden pressure (in situ)<br />
effective confining pressure (lab)<br />
effective friction angle<br />
plastic volumetric strain ratio<br />
slope <strong>of</strong> the isotropic consolidation line in n - In p' plot<br />
swelling index from oedometer test<br />
compression index from oedometer test<br />
slope <strong>of</strong> the isotropic swelling line in V - In p' plot<br />
slope <strong>of</strong> the critical state line in q - p' plot<br />
overconsolidation ratio (s' (m",/s' (.)<br />
direct simple shear<br />
PertanikaJ. Sci. & Techno!. Vo!. 5 0.1,1997 125
SHANSEP<br />
126<br />
CSSM<br />
MA Jamal, T. Raihan, A. Jimjali, A.K. Azmi, J. Azmi <strong>and</strong> J. jamilah<br />
sU'ess history <strong>and</strong> normalized soil engineering<br />
parameters<br />
critical Slate soil mechanics<br />
PertanikaJ. Sci. & Techno!. Vo!. 5 No.1, 1997