1998 1999 - Nationalarchives.gov.uk
1998 1999 - Nationalarchives.gov.uk
1998 1999 - Nationalarchives.gov.uk

Create successful ePaper yourself
Turn your PDF publications into a flip-book with our unique Google optimized e-Paper software.
Issue 18/99 12 October <strong>1999</strong><br />
Recorded Crime Statistics<br />
England and Wales, April <strong>1998</strong> to March <strong>1999</strong><br />
By David Povey and Julian Prime<br />
Recorded crime is counted and classified according to Home Office rules. A new set of rules was<br />
introduced in April <strong>1998</strong>, and the main changes are described in Annex A of this bulletin. All the<br />
commentary on April <strong>1998</strong> to March <strong>1999</strong> levels in this bulletin use these new rules. However, all the trends<br />
between this period and previous years have been calculated using the old rules (except where stated).<br />
MAIN POINTS<br />
In the twelve months to March <strong>1999</strong>, 84<br />
per cent of offences recorded by the<br />
police were against property; 12 per cent<br />
were violent crimes. (Figure 1 below)<br />
Offences of violence against the person<br />
showed a 10 per cent fall; however sexual<br />
offences rose by 2 per cent and robberies<br />
increased by 6 per cent. (Paragraphs 3(c-e))<br />
Both theft of vehicles and theft from<br />
vehicles fell by 2 per cent. (Paragraph 2(e))<br />
Domestic burglary fell by 6 per cent, with<br />
non-domestic burglary falling by 2 per<br />
cent. (Paragraph 2(c))<br />
29 per cent of all crimes, including two<br />
thirds of violent crimes, were cleared up<br />
during <strong>1998</strong>/99. (Paragraphs 5(c-d))<br />
Half of all detected crimes were cleared<br />
up using a charge or summons, whilst<br />
less than one in twelve were cleared up<br />
by interviewing a convicted prisoner.<br />
(Paragraphs 5(j) and 5(l))<br />
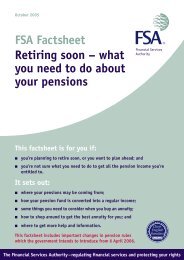
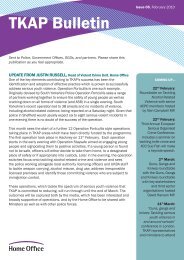
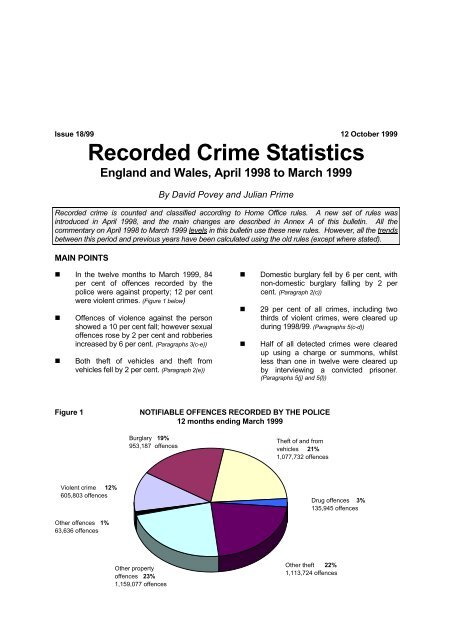
Figure 1 NOTIFIABLE OFFENCES RECORDED BY THE POLICE<br />
12 months ending March <strong>1999</strong><br />
Violent crime 12%<br />
605,803 offences<br />
Other offences 1%<br />
63,636 offences<br />
Burglary 19%<br />
953,187 offences<br />
Other property<br />
offences 23%<br />
1,159,077 offences<br />
Theft of and from<br />
vehicles 21%<br />
1,077,732 offences<br />
Drug offences 3%<br />
135,945 offences<br />
Other theft 22%<br />
1,113,724 offences
1. RECORDED CRIME (TABLES A, 1; FIGURES 1, 2)<br />
Table A Notifiable offences recorded by the police by offence<br />
England and Wales Number of offences and percentages<br />
Offence group<br />
12 months ending<br />
March <strong>1998</strong> March <strong>1999</strong> March <strong>1999</strong><br />
Old rules (1) New rules (1)<br />
2<br />
Underlying trend (2)<br />
Number Percentage<br />
Violence against the person 256,070 230,756 502,793 -25,314 (+12,424) -9.9% (+5.1%)<br />
Sexual offences 34,151 34,915 36,174 +764 (+2,031) +2.2% (+6.3%)<br />
Robbery 62,652 66,172 66,836 +3,520 (-9,614) +5.6% (-13.3%)<br />
Total violent crime 352,873 331,843 605,803 -21,030 (+4,841) -6.0% (+1.4%)<br />
Burglary 988,432 951,878 953,187 -36,554 (-138,595) -3.7% (-12.3%)<br />
Total theft & handling stolen goods 2,144,973 2,126,718 2,191,456 -18,255 (-178,726) -0.9% (-7.7%)<br />
Theft of and from vehicles 1,096,022 1,071,828 1,077,732 -24,194 (-149,030) -2.2% (-12.0%)<br />
Fraud and forgery 136,232 173,728 279,505 +37,496 (+257) +27.5% (+0.2%)<br />
Criminal damage 861,846 834,370 879,572 -27,476 (-76,889) -3.2% (-8.2%)<br />
Total property crime 4,131,483 4,086,694 4,303,720 -44,789 (-393,953) -1.1% (-8.7%)<br />
Drug offences 23,336 21,306 135,945 -2,030 (+685) -8.7% (+3.0%)<br />
Other notifiable offences 37,645 41,974 63,636 +4,329 (+3,086) +11.5% (+8.9%)<br />
Total all offences 4,545,337 4,481,817 5,109,104 -63,520 (-385,341) -1.4% (-7.8%)<br />
(1) ‘Old rules’ denotes the number of crimes that would have been recorded using the coverage and rules in use until 31 March<br />
<strong>1998</strong>. ‘New rules’ denotes crimes recorded using the expanded offence coverage and revised counting rules which came into<br />
effect on 1 April <strong>1998</strong>.<br />
(2) Underlying trend is calculated using the old rule crime figures. Trends for the previous 12 months are shown in brackets.<br />
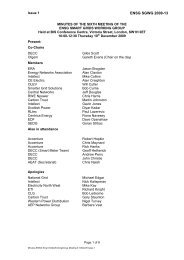
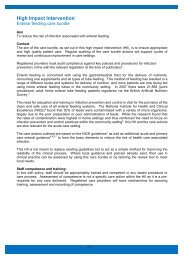
Figure 2 NOTIFIABLE OFFENCES RECORDED BY THE POLICE<br />
Percentage change<br />
25<br />
20<br />
15<br />
10<br />
5<br />
0<br />
-5<br />
-10<br />
-15<br />
-6<br />
9<br />
Underlying trend from the previous year (rounded)<br />
All notifiable offences<br />
18<br />
15<br />
4<br />
-4<br />
1989 1990 1991 1992 1993 1994 1995 1996 1997 <strong>1998</strong> <strong>1999</strong><br />
Percentage change<br />
25<br />
20<br />
15<br />
10<br />
5<br />
0<br />
-5<br />
-10<br />
-15<br />
-10<br />
7<br />
23<br />
20<br />
-5<br />
12 months ending March<br />
Burglary<br />
9<br />
-4<br />
1989 1990 1991 1992 1993 1994 1995 1996 1997 <strong>1998</strong> <strong>1999</strong><br />
-7<br />
12 months ending March<br />
-0.1<br />
-0.2<br />
-9<br />
-4<br />
-8<br />
-12<br />
-4<br />
-1<br />
Percentage change<br />
25<br />
20<br />
15<br />
10<br />
5<br />
0<br />
-5<br />
-10<br />
-15<br />
7<br />
9<br />
4<br />
Violent crime<br />
8<br />
6<br />
4<br />
1989 1990 1991 1992 1993 1994 1995 1996 1997 <strong>1998</strong> <strong>1999</strong><br />
Percentage change<br />
25<br />
20<br />
15<br />
10<br />
5<br />
0<br />
-5<br />
-10<br />
-15<br />
-8<br />
12 months ending March<br />
Theft of and from vehicles<br />
10<br />
24<br />
14<br />
3<br />
-5<br />
1989 1990 1991 1992 1993 1994 1995 1996 1997 <strong>1998</strong> <strong>1999</strong><br />
1<br />
-9<br />
5<br />
-1<br />
12 months ending March<br />
9<br />
-6<br />
1<br />
-12<br />
-6<br />
-2
(a) A number of changes to the way that the police count and record crimes took<br />
effect on 1 April <strong>1998</strong>. Full details of these changes, together with their effect on the<br />
notifiable offence categories, are given in Annex A. Where trends are discussed in<br />
this bulletin, we have calculated the underlying trend where the effect of the counting<br />
rule and coverage changes has been removed (i.e. comparisons are made on the ‘old<br />
rules’ basis).<br />
(b) The collective term “Recorded Crime” refers to notifiable offences recorded by<br />
the police (see also note 1 on page 24). These offences cover a wide range of<br />
crimes, from homicides to minor thefts and damage. It is essential that when different<br />
offences are combined, the seriousness of the component crimes is borne in mind.<br />
(c) In the twelve months ending March <strong>1999</strong>, a total of 5.1 million offences were<br />
recorded by the police in England and Wales. The trend in recorded offences shows<br />
a 1.4 per cent reduction compared to the previous twelve months, and this represents<br />
the sixth consecutive fall in the financial year figures.<br />
(d) The majority of crimes were property offences (burglary, theft, fraud and<br />
forgery, criminal damage). These offences accounted for 4.3 million or 84 per cent of<br />
all recorded crime, and include 1,078,000 thefts of and from vehicles and 473,000<br />
domestic burglaries.<br />
(e) Violent crimes (violence against the person, sexual offences and robbery)<br />
accounted for 12 per cent (605,800) of all offences recorded during this period. Of the<br />
502,800 offences of violence against the person, 151,500 were common assaults,<br />
which are now covered by the new counting rules.<br />
(f) Of the remaining 199,600 other notifiable offences, 135,900 were drug related,<br />
18,600 were public order offences, and 9,300 involved perverting the course of justice.<br />
2. PROPERTY OFFENCES (TABLES A, 3, 6; FIGURES 1, 2, 3)<br />
(a) The number of property offences fell by 1.1 per cent, with 4.3 million offences<br />
recorded during <strong>1998</strong>/99. This is the sixth consecutive financial year decrease in<br />
property offences, which have fallen from a record number of 5.3 million during<br />
1992/93.<br />
(b) There were decreases in many offence groups within property crime; however<br />
fraud and forgery, arson, and the theft from the person groups showed large<br />
increases.<br />
3
(c) Burglary offences make up 22 per cent of all recorded property crimes. During<br />
<strong>1998</strong>/99 domestic burglaries fell by 5.7 per cent (473,400 offences were recorded),<br />
with non-domestic burglaries falling by 1.6 per cent to 479,800 offences. Despite falls<br />
during the past six years, the total number of burglaries recorded is still 19 per cent<br />
higher than ten years ago.<br />
(d) Thefts made up 51 per cent of all recorded property crimes. During <strong>1998</strong>/99<br />
recorded thefts fell by 0.9 per cent to 2,191,500 thefts - the sixth consecutive financial<br />
year fall. However, theft offences are still 12 per cent higher than ten years ago.<br />
(e) Within the theft offence group, thefts of and from vehicles decreased by 2.2 per<br />
cent to 1,077,700 thefts. Thefts from vehicles decreased by 2.1 per cent to 685,900<br />
while thefts of vehicles fell by 2.4 per cent to 391,800. Although this is the sixth<br />
consecutive decrease in thefts of and from vehicles there were still 10 per cent more<br />
such crimes recorded than 10 years ago. In addition since April <strong>1998</strong>, 48,000<br />
offences of vehicle interference and tampering and 354,700 offences of criminal<br />
damage to a motor vehicle were recorded. The inclusion of the interference and<br />
tampering offence category may have indirectly reduced the number of attempted<br />
vehicle thefts recorded by some police force areas, owing to the difficulty of<br />
distinguishing crimes of vehicle interference from attempted thefts.<br />
(f) Offences of thefts from the person rose by 8.9 per cent to 63,100 during<br />
<strong>1998</strong>/99 –more than reversing the small fall recorded during the previous year. Thefts<br />
from shops increased by 2.9 per cent to 282,000. Thefts of pedal cycles decreased for<br />
the seventh financial year running – the 10.6 per cent fall reduced the total to 128,600<br />
offences.<br />
(g) Fraud and forgery offences rose by 27.5 per cent. This is after the exclusion of<br />
the effect of the new counting rules, which now allows the recording of unreported<br />
cheque and credit card fraud offences that are discovered by the police in subsequent<br />
investigation. In some forces the change in counting rules has coincided with a review<br />
of recording practices for cheque and credit card fraud offences. These reviews have<br />
resulted in more reported offences being recorded, thus causing increases in recorded<br />
offences that are not directly attributable to the new rules.<br />
(h) There were 879,600 criminal damage offences recorded in <strong>1998</strong>/99, a fall of<br />
3.2 per cent on the previous year. This total contained 47,300 arson offences and<br />
3,300 threats to commit criminal damage. Forty-three per cent of the remaining<br />
criminal damage was against vehicles, 27 per cent against dwellings, 19 per cent<br />
against other buildings, and 11 per cent against other “objects” such as bus shelters<br />
and post boxes.<br />
4
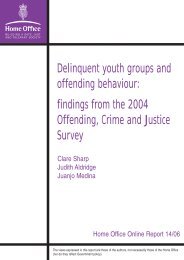
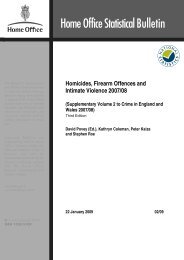
Figure 3 UNDERLYING TREND IN NOTIFIABLE OFFENCES<br />
Twelve months ending March <strong>1999</strong> compared to previous twelve months<br />
All offences<br />
Theft from vehicle<br />
Theft of vehicle<br />
Theft from shop<br />
Theft from person<br />
Theft of pedal cycle<br />
Other theft & handling<br />
Burglary in dwelling<br />
Burglary other<br />
Criminal damage<br />
Fraud and forgery<br />
Violence against the person<br />
Sexual offences<br />
Robbery<br />
Drug offences<br />
Other offences<br />
-15 -10 -5 0 5 10 15 20 25 30<br />
Percentage change<br />
3. VIOLENT CRIME (TABLES A, 1, 3, 6; FIGURES 1, 2, 3, 4)<br />
(a) A total of 605,800 violent offences were recorded by the police during <strong>1998</strong>/99,<br />
a trend reduction of 6.0 per cent on the total recorded in <strong>1998</strong>/99. This follows rises of<br />
8.9 per cent and 1.4 per cent in the previous two years.<br />
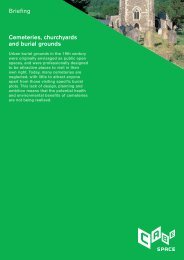
(b) The most common violent crime category was violence against the person,<br />
which accounted for 83 per cent of all recorded violent crime. Robberies comprised<br />
11 per cent of violent offences, whilst the remaining 6 per cent were sexual offences.<br />
Homicide offences (which comprise murder, manslaughter and infanticide) accounted<br />
for 0.1 per cent of all violent crime.<br />
(c) There were 502,800 offences of violence against the person recorded during<br />
<strong>1998</strong>/99. More serious offences of violence, i.e. those which are life threatening,<br />
numbered 27,000; within this category there were 750 homicides, 2 deaths more than<br />
during the previous year. 475,700 less serious offences of violence were recorded;<br />
nearly one-third of these offences were the newly notifiable offence of common<br />
assault. Over 79,500 offences of harassment were recorded. The underlying trend for<br />
all violence against the person offences shows a 9.9 per cent fall since 1997/98.<br />
5
However the underlying trend may overstate the reduction. This is because the trend<br />
figure has been calculated by eliminating the effect of the counting rule changes,<br />
which we have assumed to be the introduction of common assault and assault on a<br />
constable into the coverage in April <strong>1998</strong>. This has not been totally correct, as the<br />
recording of some assaults involving minor injuries ‘switched’ from other wounding to<br />
common assault in April <strong>1998</strong> as a result of a change in Home Office guidance.<br />
Figure 4 OFFENCES OF VIOLENCE<br />
Twelve months ending March <strong>1999</strong><br />
Less serious offences of<br />
violence 79%<br />
475,746 offences<br />
(d) The number of sexual offences recorded in <strong>1998</strong>/99 increased by 2.2 per cent,<br />
which is similar to the average increase during the last ten years. The increase during<br />
<strong>1998</strong>/99 included a 9.4 per cent rise in offences of rape with a female victim, and a<br />
33.9 per cent rise in male rape. The number of recorded rapes has risen by 144 per<br />
cent in the last ten years, which is thought to be partly due to an increase in the rate of<br />
reporting and recording of these offences.<br />
(e) Robbery offences increased by 5.6 per cent to 66,800. This follows a 13.3 per<br />
cent fall during the previous year. Over the last ten years, the number of robberies<br />
has more than doubled. Robberies of business property accounted for 16 per cent of<br />
the total, with the remainder being robberies of personal property – mainly muggings.<br />
6<br />
Sexual offences 6%<br />
36,174 offences<br />
Robbery 11%<br />
66,836 offences<br />
Homicide and other more<br />
serious offences of<br />
violence 4%<br />
27,047 offences
4. POLICE FORCE AREAS (TABLES 2, 3, 4, 5; FIGURES 5, 6)<br />
(a) Twenty nine of the forty three police forces in England and Wales had an<br />
underlying reduction between 1997/98 and <strong>1998</strong>/99 in the total number of crimes<br />
recorded; during the previous financial year 41 force areas recorded fewer crimes.<br />
(b) Metropolitan forces (see note 4) recorded 0.8 per cent more crimes in<br />
<strong>1998</strong>/99 than in 1997/98 whilst the non-metropolitan forces recorded 3.1 per cent<br />
fewer crimes. Ten years ago, approximately the same number of crimes were<br />
recorded in metropolitan areas as in non-metropolitan areas. However, since<br />
1988/89 the proportion of crime recorded by metropolitan forces has fallen to 45.4<br />
per cent of the total. This follows increases in total recorded crime over the ten year<br />
period of 11.4 per cent in metropolitan areas and 31.4 per cent in non-metropolitan<br />
areas. There has been a small shift in resident population from metropolitan to nonmetropolitan<br />
areas, but this has been insufficient to explain the larger falls in crime.<br />
(c) Of the metropolitan forces, four showed underlying trend falls. The largest fall<br />
was 1.4 per cent in Northumbria, and is the only force to have recorded seven<br />
consecutive financial year falls. The City of London force showed the largest<br />
increase; however the 17.5 per cent rise in this force was dwarfed by the underlying<br />
1.3 per cent fall in the surrounding Metropolitan Police District.<br />
(d) Changes in non-metropolitan areas ranged from a decrease of 10 per cent in<br />
Lancashire, to an increase of 5 per cent in Thames Valley. Nine non-metropolitan<br />
forces recorded decreases of over 5 per cent.<br />
(e) The number of offences recorded in each police force area per 100,000<br />
resident population is shown in Table 2. The forces with the highest recorded crime<br />
rates are mainly the metropolitan police force areas and other forces which include<br />
large conurbations; the lowest rates are mainly in rural areas.<br />
(f) The highest rate was in Humberside with 14,800 offences per 100,000<br />
population, followed by Greater Manchester (14,100), Nottinghamshire (13,100) and<br />
West Yorkshire (13,000). In contrast, the lowest rates were in Dyfed-Powys (5,100),<br />
Surrey (5,400) and Hertfordshire (5,700).<br />
(g) Some of the differences between police force areas in the rates of recorded<br />
crime may be due to extraneous factors. These factors include the victims of crimes<br />
recorded in a police force area not living in that area (particularly so in metropolitan<br />
areas), together with differing reporting rates of offences to the police and recording<br />
practices within police force areas.<br />
7
Figure 5 NOTIFIABLE OFFENCES RECORDED BY THE POLICE<br />
Underlying trend between the twelve months ending<br />
March <strong>1999</strong> and the previous twelve months by police force area<br />
More than 2% increase<br />
0 to 2% increase<br />
0 to 2% decrease<br />
Between 2% and 4% decrease<br />
More than 4% decrease<br />
Dyfed-Powys<br />
Devon and Cornwall<br />
North Wales<br />
South Wales<br />
Cumbria<br />
Merseyside<br />
Gwent<br />
Lancashire<br />
Cheshire<br />
Avon and Somerset<br />
Northumbria<br />
Dorset<br />
8<br />
Durham<br />
Greater Manchester<br />
West Mercia<br />
North Yorkshire<br />
West Yorkshire<br />
Staffordshire<br />
Gloucestershire<br />
Derbyshire<br />
Cleveland<br />
South Yorkshire<br />
West Midlands<br />
Warwickshire<br />
Wiltshire<br />
Nottinghamshire<br />
Leicestershire<br />
Hampshire<br />
Humberside<br />
Lincolnshire<br />
Northamptonshire<br />
Thames Valley<br />
Cambridgeshire<br />
Bedfordshire<br />
Hertfordshire<br />
Essex<br />
Metropolitan and City<br />
Surrey<br />
Sussex<br />
Norfolk<br />
Suffolk<br />
Kent
Figure 6 NOTIFIABLE OFFENCES IN METROPOLITAN AND<br />
3,500,000<br />
3,000,000<br />
2,500,000<br />
2,000,000<br />
1,500,000<br />
1,000,000<br />
500,000<br />
0<br />
NON-METROPOLITAN POLICE FORCE AREAS<br />
Metropolitan<br />
forces<br />
Non-Metropolitan<br />
forces<br />
1989 1990 1991 1992 1993 1994 1995 1996 1997 <strong>1998</strong> <strong>1999</strong><br />
12 months ending March<br />
5. OFFENCES CLEARED UP (TABLES B, 5, 6; FIGURE 7)<br />
(a) The introduction of the new counting rules and offence coverage on 1 April<br />
<strong>1998</strong> had a knock-on effect on the number of crimes detected by the police during the<br />
year. A number of the newly notifiable offences, such as drug possession, common<br />
assault, and dangerous driving have relatively high clear-up rates which have<br />
increased the overall clear-up rate. However, all offences of criminal damage are now<br />
included within the clear-up rate; previously offences where the damage was valued<br />
at £20 or under were excluded. This will have reduced the overall clear-up rate.<br />
(b) It has not been possible to obtain accurate figures for <strong>1998</strong>/99 clear-ups on the<br />
old rules basis. Therefore, all trend comparisons in this section do not exclude the<br />
effects of the new counting rules.<br />
(c) The proportion of offences cleared up during <strong>1998</strong>/99 – at 29 per cent – was 1<br />
percentage point higher than during 1997/98. The total number of offences cleared up<br />
at 1,492,300 was 240,600 higher than during the previous financial year.<br />
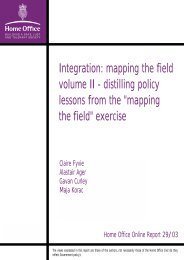
(d) A high proportion of violent crimes are cleared up. Overall, 66 per cent of<br />
violent crime was cleared up during <strong>1998</strong>/99; however this is a reduction of 3<br />
percentage points since 1997/98. Within this total figure, offences of violence against<br />
the person and sexual offences had clear-up rates of 71 and 68 per cent respectively.<br />
The rate for robbery was 23 per cent.<br />
9
Figure 7 CLEAR-UP RATES BY TYPE OF OFFENCE, <strong>1998</strong>/99<br />
Homicide<br />
Violence against the person<br />
Sexual offences<br />
Robbery<br />
Burglary<br />
Theft of and from vehicles<br />
Total theft<br />
Fraud and forgery<br />
Criminal damage<br />
All offences<br />
0 10 20 30 40 50 60 70 80 90 100<br />
(e) Within violence against the person, 95 per cent of homicides and 89 per cent of<br />
attempted murders were cleared up during <strong>1998</strong>/99. The clear-up rate for rape<br />
offences – at 64 per cent – was the lowest rate since 1986.<br />
(f) Offences for which a low proportion were cleared up include theft from a person<br />
(9 per cent), pedal cycle theft and vehicle interference/tampering (8 per cent). Other<br />
offences for which less than one in five were cleared up were non-residential burglary,<br />
theft of a vehicle, theft from a vehicle, other theft, arson, and criminal damage.<br />
Together these offences comprise over three-fifths of all recorded crimes.<br />
(g) Clear-up rates varied widely among forces, from 22 per cent in the Metropolitan<br />
Police District and Humberside to 69 per cent in Dyfed-Powys. However, comparisons<br />
may reflect differences in the types of offences between areas and variations in<br />
recording practice.<br />
(h) There are several methods of clearing up a crime (see table 5); these can be<br />
divided into two main groups, “primary clear-ups” and “secondary clear-ups”. A full<br />
explanation of the definitions used is given in note 5 on page 24. In <strong>1998</strong>/99 26 per<br />
cent of recorded crimes were cleared up by primary means, representing 90 per cent<br />
of all clear-ups, compared with 84 per cent during 1997/98.<br />
10
Table B Notifiable offences recorded (1) and offences cleared up (2)<br />
England and Wales Number of offences and percentages<br />
Year Number<br />
recorded<br />
11<br />
Cleared up<br />
Number Percentage<br />
Total Primary Secondary Total Primary Secondary<br />
1994/95 4,929,209 1,297,272 1,015,870 281,402 26% 21% 6%<br />
1995/96 4,921,597 1,291,466 1,020,248 271,218 26% 21% 6%<br />
1996/97 4,760,144 1,292,316 1,052,281 240,035 27% 22% 5%<br />
1997/98 4,428,758 1,251,707 1,054,033 197,674 28% 24% 4%<br />
<strong>1998</strong>/99 5,109,104 1,492,265 1,347,772 144,493 29% 26% 3%<br />
(1) Excluding criminal damage of £20 and under prior to <strong>1998</strong>/99.<br />
(2) See note 5 on page 24.<br />
(i) In thirty-one forces over 85 per cent of clear-ups were by primary means. By<br />
contrast there were two forces in which secondary clear-ups made up over onequarter<br />
of all clear-ups (South Yorkshire and South Wales).<br />
(j) Looking at the method of clear-up in more detail, the most common was a<br />
charge or summons; a total of 755,800 offences – more than one half of all those<br />
detected - were cleared up in this way. In seven forces one fifth or more of all<br />
offences were cleared up using a charge or summons, although six forces cleared up<br />
less than one in eight offences by this method.<br />
(k) Five per cent of notifiable offences were cleared up by means of a caution,<br />
although Dyfed-Powys cleared up 15 per cent this way.<br />
(l) Three per cent of all offences were cleared up by secondary means, within<br />
which the most common method was by interview of convicted prisoners. Although<br />
nationally just two per cent of crimes were cleared up in this way, there was<br />
considerable variation amongst forces. This is largely as a result of differing force<br />
policies on using this method.
Table 1 Notifiable offences recorded by the police by offence<br />
England and Wales<br />
Offence group April 1994 April 1995 April 1996 April 1997<br />
to to to to<br />
March 1995 March 1996 March 1997 March <strong>1998</strong><br />
Number of offences<br />
March <strong>1999</strong><br />
Old rules (1) New rules (1)<br />
Violence against the person 212,134 219,291 243,646 256,070 230,756 502,793<br />
Sexual offences 31,177 29,887 32,120 34,151 34,915 36,174<br />
Robbery 60,431 70,497 72,266 62,652 66,172 66,836<br />
Total violent crime 303,742 319,675 348,032 352,873 331,843 605,803<br />
Burglary<br />
Burglary in a dwelling 661,194 638,631 581,985 501,593 472,960 473,352<br />
Burglary other than in a dwelling 575,791 595,843 545,042 486,839 478,918 479,835<br />
Total burglary 1,236,985 1,234,474 1,127,027 988,432 951,878 953,187<br />
Theft & handling of stolen goods<br />
Theft from the person 52,309 60,347 59,352 57,894 63,054 63,118<br />
Theft of pedal cycle 172,324 168,482 147,160 140,031 125,178 128,558<br />
Theft from shops 269,652 282,452 278,050 273,509 281,457 281,972<br />
Theft from vehicle 827,196 817,229 778,269 695,498 680,937 685,921<br />
Theft of motor vehicle 524,094 513,927 466,783 400,524 390,891 391,811<br />
Theft of & from vehicles 1,351,290 1,331,156 1,245,052 1,096,022 1,071,828 1,077,732<br />
Vehicle interference and tampering N / A N / A N / A N / A N / A 48,011<br />
Other theft & handling stolen goods 662,386 623,867 594,085 577,517 585,201 592,065<br />
Total theft & handling stolen goods 2,507,961 2,466,304 2,323,699 2,144,973 2,126,718 2,191,456<br />
Fraud and forgery 140,180 134,394 135,975 136,232 173,728 279,505<br />
Criminal damage 909,359 932,719 938,735 861,846 834,370 879,572<br />
Drug offences 19,172 21,659 22,651 23,336 21,306 135,945<br />
Other notifiable offences 28,984 30,082 34,559 37,645 41,974 63,636<br />
Total all offences 5,146,383 5,139,307 4,930,678 4,545,337 4,481,817 5,109,104<br />
Violence against the person 1.3 3.4 11.1 5.1 -9.9<br />
Sexual offences -3.7 -4.1 7.5 6.3 2.2<br />
Robbery 3.7 16.7 2.5 -13.3 5.6<br />
Total violent crime 1.2 5.2 8.9 1.4 -6.0<br />
Burglary<br />
Burglary in a dwelling -6.6 -3.4 -8.9 -13.8 -5.7<br />
Burglary other than in a dwelling -7.5 3.5 -8.5 -10.7 -1.6<br />
Total burglary -7.0 -0.2 -8.7 -12.3 -3.7<br />
Theft & handling of stolen goods<br />
Percentage change from corresponding period in previous year<br />
Theft from the person 6.5 15.4 -1.6 -2.5 8.9<br />
Theft of pedal cycle -6.5 -2.2 -12.7 -4.8 -10.6<br />
Theft from shops -1.1 4.7 -1.6 -1.6 2.9<br />
Theft from vehicle -8.3 -1.5 -4.8 -10.6 -2.1<br />
Theft of motor vehicle -10.2 -1.2 -9.2 -14.2 -2.4<br />
Theft of & from vehicles -9.0 -1.9 -6.5 -12.0 -2.2<br />
Other theft & handling stolen goods -5.7 -5.8 -4.8 -2.8 1.3<br />
Total theft & handling stolen goods -6.9 -1.7 -5.8 -7.7 -0.9<br />
Fraud and forgery -11.6 -4.1 1.2 0.2 27.5<br />
Criminal damage -0.3 2.6 0.6 -8.2 -3.2<br />
Drug offences 23.1 13.0 4.6 3.0 -8.7<br />
Other notifiable offences 5.8 3.8 14.9 8.9 11.5<br />
Total all offences -5.4 -0.1 -4.1 -7.8 -1.4<br />
(1) 'Old rules' denotes the number of crimes that would have been recorded using the coverage and rules in use until 31 March <strong>1998</strong>.<br />
'New rules' denotes crimes recorded using the expanded offence coverage and revised counting rules which came into effect on 1 April <strong>1998</strong>.<br />
12<br />
April <strong>1998</strong><br />
to
Table 2 Notifiable offences recorded by the police by police force area<br />
England and Wales Number of offences, percentages and rate per 100,000 population<br />
Police force area April 1997 April <strong>1998</strong><br />
Underlying trend (2)<br />
Offences per 100,000<br />
to to<br />
population; April <strong>1998</strong><br />
March <strong>1998</strong> March <strong>1999</strong><br />
Number Percentage to March <strong>1999</strong><br />
Old rules (1) New rules (1) New rules (1)<br />
Avon and Somerset 144,556 131,955 150,089 -12,601 -8.7 10,153<br />
Bedfordshire 45,250 43,947 49,076 -1,303 -2.9 8,886<br />
Cambridgeshire 58,864 59,678 67,256 814 1.4 9,443<br />
Cheshire 60,716 59,414 65,119 -1,302 -2.1 6,631<br />
Cleveland 63,634 63,726 67,030 92 0.1 12,059<br />
Cumbria 35,777 35,171 40,202 -606 -1.7 8,169<br />
Derbyshire 74,436 74,047 84,459 -389 -0.5 8,748<br />
Devon and Cornwall 92,800 88,484 110,644 -4,316 -4.7 7,132<br />
Dorset 43,536 43,903 52,755 367 0.8 7,673<br />
Durham 47,311 44,178 50,413 -3,133 -6.6 8,287<br />
Essex 89,380 87,147 95,797 -2,233 -2.5 6,290<br />
Gloucestershire 46,044 44,000 48,206 -2,044 -4.4 8,619<br />
Greater Manchester 315,000 336,172 362,450 21,172 6.7 14,093<br />
Hampshire 121,042 115,008 128,253 -6,034 -5.0 7,277<br />
Hertfordshire 49,426 46,255 49,309 -3,171 -6.4 5,657<br />
Humberside 123,722 119,290 130,691 -4,432 -3.6 14,772<br />
Kent 118,892 110,244 129,340 -8,648 -7.3 8,259<br />
Lancashire 116,947 105,161 118,117 -11,786 -10.1 8,288<br />
Leicestershire 81,183 81,714 93,397 531 0.7 10,053<br />
Lincolnshire 41,792 39,718 46,670 -2,074 -5.0 7,535<br />
London, City of (3) 5,137 6,035 7,144 898 17.5 N/A<br />
Merseyside 125,312 130,606 140,874 5,294 4.2 9,967<br />
Metropolitan Police (3) 778,279 767,880 934,254 -10,399 -1.3 12,354<br />
Norfolk 52,580 51,167 57,129 -1,413 -2.7 7,296<br />
Northamptonshire 53,645 55,842 65,466 2,197 4.1 10,727<br />
Northumbria 134,457 132,588 151,298 -1,869 -1.4 10,579<br />
North Yorkshire 50,297 48,372 55,309 -1,925 -3.8 7,498<br />
Nottinghamshire 125,097 123,680 135,255 -1,417 -1.1 13,104<br />
South Yorkshire 125,907 124,427 133,059 -1,480 -1.2 10,200<br />
Staffordshire 89,820 84,495 91,919 -5,325 -5.9 8,669<br />
Suffolk 35,262 34,280 39,908 -982 -2.8 5,987<br />
Surrey 38,015 36,376 42,467 -1,639 -4.3 5,414<br />
Sussex 110,320 111,468 130,402 1,148 1.0 8,767<br />
Thames Valley 154,014 161,646 176,477 7,632 5.0 8,461<br />
Warwickshire 35,604 35,659 38,485 55 0.2 7,642<br />
West Mercia 75,330 69,451 81,782 -5,879 -7.8 7,261<br />
West Midlands 277,970 276,512 314,611 -1,458 -0.5 11,959<br />
West Yorkshire 242,646 246,438 273,809 3,792 1.6 12,976<br />
Wiltshire 32,831 32,984 38,189 153 0.5 6,372<br />
Dyfed-Powys 17,994 17,858 24,588 -136 -0.8 5,145<br />
Gwent 47,043 47,381 58,738 338 0.7 10,547<br />
North Wales 38,658 36,570 43,848 -2,088 -5.4 6,684<br />
South Wales 128,811 120,890 134,820 -7,921 -6.1 10,906<br />
Total met-forces 2,004,708 2,020,658 2,317,499 15,950 0.8 12,146<br />
Total non-met forces 2,540,629 2,461,159 2,791,605 -79,470 -3.1 8,426<br />
Total 4,545,337 4,481,817 5,109,104 -63,520 -1.4 9,785<br />
(1) 'Old rules' denotes the number of crimes that would have been recorded using the coverage and rules in use until 31 March <strong>1998</strong>.<br />
'New rules' denotes crimes recorded using the expanded offence coverage and revised counting rules which came into effect on 1 April <strong>1998</strong>.<br />
(2) Underlying trend is calculated using the old rule counting figures.<br />
(3) Offences per 100,000 population for City of London and Metropolitian Police are combined.<br />
13
Table 3 Notifiable offences by police force area and offence - 12 months ending March <strong>1999</strong><br />
England and Wales Number of offences<br />
Police force area Total Violence Sexual Robbery Burglary Theft Fraud Criminal Drug Other Vehicle<br />
against offences and and damage offences offences crime (1)<br />
person<br />
the handling forgery<br />
Avon and Somerset 150,089 12,333 821 1,831 29,194 72,069 9,950 20,605 2,145 1,141 48,403<br />
Bedfordshire 49,076 4,794 344 530 7,129 22,581 4,114 7,893 1,141 550 15,407<br />
Cambridgeshire 67,256 5,345 431 437 12,759 31,953 2,389 11,925 1,166 851 19,861<br />
Cheshire 65,119 6,601 625 397 13,125 26,925 2,146 11,596 2,470 1,234 17,304<br />
Cleveland 67,030 2,960 369 908 16,526 31,755 2,261 10,681 1,120 450 19,395<br />
Cumbria 40,202 5,582 200 119 5,812 16,504 1,388 8,405 1,621 571 10,587<br />
Derbyshire 84,459 8,509 556 504 16,720 36,742 4,200 14,316 1,689 1,223 25,117<br />
Devon and Cornwall 110,644 11,758 876 462 17,808 49,787 7,064 17,722 3,873 1,294 32,585<br />
Dorset 52,755 2,806 314 205 9,202 23,993 6,334 8,303 1,102 496 16,294<br />
Durham 50,413 4,955 243 172 10,135 20,323 1,311 11,122 1,388 764 15,201<br />
Essex 95,797 8,043 877 523 14,997 44,368 4,366 18,834 2,312 1,477 29,772<br />
Gloucestershire 48,206 3,230 344 273 10,111 23,468 2,527 6,570 1,152 531 11,388<br />
Greater Manchester 362,450 35,841 2,142 7,632 79,179 145,090 15,830 67,052 5,439 4,245 115,690<br />
Hampshire 128,253 12,599 1,066 588 19,822 57,492 5,130 25,100 4,195 2,261 35,800<br />
Hertfordshire 49,309 3,313 321 250 8,353 22,935 2,312 10,177 1,197 451 18,765<br />
Humberside 130,691 9,365 743 839 34,169 57,889 3,582 21,486 1,639 979 36,642<br />
Kent 129,340 12,409 924 712 22,978 57,314 5,687 23,049 3,891 2,376 39,307<br />
Lancashire 118,117 10,328 879 982 24,229 49,952 4,448 21,363 4,117 1,819 33,291<br />
Leicestershire 93,397 9,984 764 967 17,218 38,408 7,227 15,143 1,433 2,253 26,022<br />
Lincolnshire 46,670 4,239 393 149 10,257 19,328 2,723 7,728 1,229 624 10,847<br />
London, City of 7,144 510 31 29 520 4,263 862 297 504 128 615<br />
Merseyside 140,874 12,208 1,019 2,484 26,498 59,044 4,884 27,465 5,620 1,652 40,733<br />
Metropolitan Police 934,254 131,549 8,102 26,330 123,861 383,665 80,541 136,870 32,152 11,184 229,472<br />
Norfolk 57,129 5,461 508 220 10,154 25,690 2,488 10,393 1,534 681 14,981<br />
Northamptonshire 65,466 5,246 306 443 12,162 28,994 4,425 11,771 1,285 834 21,080<br />
Northumbria 151,298 12,477 943 1,347 31,625 62,314 4,991 31,634 3,934 2,033 45,162<br />
North Yorkshire 55,309 4,827 297 170 11,237 25,608 2,563 8,372 1,560 675 14,255<br />
Nottinghamshire 135,255 12,051 949 1,312 28,792 59,864 4,736 23,953 2,004 1,594 37,790<br />
South Yorkshire 133,059 6,577 654 979 34,370 57,251 3,951 24,198 3,983 1,096 42,896<br />
Staffordshire 91,919 10,113 566 509 20,391 37,917 3,830 15,668 1,915 1,010 26,283<br />
Suffolk 39,908 3,820 405 140 6,241 17,097 2,099 7,898 1,581 627 9,468<br />
Surrey 42,467 4,164 579 171 6,922 17,911 2,994 7,576 1,557 593 10,957<br />
Sussex 130,402 14,763 911 939 20,934 57,601 7,790 23,828 2,235 1,401 37,429<br />
Thames Valley 176,477 10,784 879 1,327 30,735 89,616 11,778 26,006 3,838 1,514 61,025<br />
Warwickshire 38,485 2,063 194 170 8,064 17,655 2,401 6,888 683 367 12,677<br />
West Mercia 81,782 6,995 618 351 14,631 36,420 3,961 15,346 2,393 1,067 23,499<br />
West Midlands 314,611 31,019 1,985 7,315 70,624 125,962 15,675 50,390 7,180 4,461 94,870<br />
West Yorkshire 273,809 16,683 1,774 3,072 67,633 115,328 10,608 49,239 6,720 2,752 87,722<br />
Wiltshire 38,189 4,390 404 195 6,129 16,805 1,933 6,644 1,199 490 9,480<br />
Dyfed-Powys 24,588 4,680 317 42 2,615 7,702 1,402 4,497 2,483 850 4,327<br />
Gwent 58,738 11,355 452 173 8,416 20,727 2,395 11,690 2,447 1,083 15,217<br />
North Wales 43,848 4,703 334 127 7,226 17,431 1,869 9,652 1,885 621 11,548<br />
South Wales 134,820 11,361 715 511 23,684 57,715 6,340 30,227 2,934 1,333 51,303<br />
England and Wales 5,109,104 502,793 36,174 66,836 953,187 2,191,456 279,505 879,572 135,945 63,636 1,480,467<br />
(1) Vehicle crime includes theft of a vehicle, theft from a vehicle, aggravated vehicle taking, vehicle interference and tampering<br />
and criminal damage to a vehicle.<br />
14
Table 4 Notifiable offences recorded by the police: clear-up rate (1) by police force area<br />
England and Wales Percentages<br />
Police force area April 1994 April 1995 April 1996 April 1997 April <strong>1998</strong><br />
to to to to to<br />
March 1995 March 1996 March 1997 March <strong>1998</strong> March <strong>1999</strong><br />
Avon and Somerset 21 23 26 26 24<br />
Bedfordshire 22 24 35 35 33<br />
Cambridgeshire 23 20 25 28 29<br />
Cheshire 31 33 34 34 37<br />
Cleveland 20 25 25 23 23<br />
Cumbria 39 38 35 41 44<br />
Derbyshire 22 20 23 26 31<br />
Devon and Cornwall 28 28 30 34 36<br />
Dorset 30 28 26 30 31<br />
Durham 31 30 30 30 33<br />
Essex 38 33 27 28 29<br />
Gloucestershire 25 26 22 26 31<br />
Greater Manchester 34 19 18 20 25<br />
Hampshire 27 28 29 30 35<br />
Hertfordshire 24 30 29 33 34<br />
Humberside 18 19 21 21 22<br />
Kent 28 28 31 31 34<br />
Lancashire 35 35 33 29 34<br />
Leicestershire 31 29 31 34 34<br />
Lincolnshire 31 42 44 46 40<br />
London, City of 27 23 26 28 33<br />
Merseyside 29 28 29 31 31<br />
Metropolitan Police 24 26 25 25 22<br />
Norfolk 32 31 34 36 37<br />
Northamptonshire 30 30 35 35 33<br />
Northumbria 23 23 25 26 30<br />
North Yorkshire 24 24 26 26 33<br />
Nottinghamshire 25 25 29 26 25<br />
South Yorkshire 24 23 23 32 32<br />
Staffordshire 31 33 34 34 32<br />
Suffolk 35 34 33 39 41<br />
Surrey 31 31 28 35 40<br />
Sussex 25 29 28 26 25<br />
Thames Valley 23 23 25 25 25<br />
Warwickshire 24 25 24 29 26<br />
West Mercia 29 27 28 27 34<br />
West Midlands 25 23 24 25 28<br />
West Yorkshire 21 21 25 27 27<br />
Wiltshire 35 31 30 32 38<br />
England 26 26 27 28 28<br />
Dyfed-Powys 54 57 58 62 69<br />
Gwent 50 49 51 51 55<br />
North Wales 38 34 33 36 43<br />
South Wales 26 31 34 36 39<br />
Wales 34 36 39 41 46<br />
England and Wales 26 26 27 28 29<br />
(1) Excluding offences of 'other criminal damage' of value £20 and under, prior to March <strong>1998</strong>.<br />
15
Table 5 Notifiable offences recorded by the police: percentage cleared up by method of clear-up<br />
England and Wales <strong>1998</strong>/99 Percentages<br />
Police force area Total offences Percentage<br />
cleared up of offences Method of clear-up<br />
cleared up<br />
Charge Caution TIC Other Primary TIC (not Interview<br />
or (previously means previously of<br />
summons recorded) (1) recorded) convicted<br />
prisoner<br />
Avon and Somerset 36,698 24 10 3 3 7 23 1 1<br />
Bedfordshire 16,386 33 13 6 3 7 29 0 4<br />
Cambridgeshire 19,236 29 13 3 2 5 23 0 5<br />
Cheshire 24,052 37 26 4 2 3 35 1 1<br />
Cleveland 15,109 23 15 4 2 1 22 1 0<br />
Cumbria 17,666 44 23 6 2 10 41 1 2<br />
Derbyshire 26,172 31 14 7 1 3 25 1 5<br />
Devon and Cornwall 40,263 36 15 6 2 10 33 0 3<br />
Dorset 16,193 31 13 3 6 4 26 0 5<br />
Durham 16,831 33 21 3 2 5 30 1 3<br />
Essex 27,542 29 15 5 2 4 26 1 2<br />
Gloucestershire 14,879 31 14 5 4 3 26 1 4<br />
Greater Manchester 89,080 25 14 4 1 5 24 0 0<br />
Hampshire 45,138 35 20 6 2 6 33 0 1<br />
Hertfordshire 16,840 34 15 5 3 5 28 1 5<br />
Humberside 29,383 22 12 3 1 5 21 0 1<br />
Kent 44,213 34 16 6 2 7 31 1 2<br />
Lancashire 40,309 34 21 5 2 3 30 1 3<br />
Leicestershire 32,003 34 16 4 4 8 31 1 2<br />
Lincolnshire 18,761 40 19 4 2 9 33 1 6<br />
London, City of 2,384 33 19 10 1 3 32 0 1<br />
Merseyside 43,368 31 18 4 2 3 28 1 2<br />
Metropolitan Police 204,152 22 10 4 1 6 21 0 0<br />
Norfolk 20,895 37 19 5 2 4 30 1 6<br />
Northamptonshire 21,793 33 15 4 3 7 30 1 3<br />
Northumbria 44,796 30 17 6 4 2 29 0 0<br />
North Yorkshire 17,976 33 20 4 2 4 29 1 3<br />
Nottinghamshire 33,974 25 14 4 2 1 21 1 3<br />
South Yorkshire 42,786 32 16 5 1 1 23 0 8<br />
Staffordshire 29,245 32 17 4 2 5 28 1 3<br />
Suffolk 16,470 41 17 7 2 9 35 0 6<br />
Surrey 16,850 40 15 9 2 7 32 0 7<br />
Sussex 32,995 25 10 4 1 8 24 0 1<br />
Thames Valley 43,465 25 11 4 1 4 20 1 4<br />
Warwickshire 10,013 26 12 5 1 4 23 1 2<br />
West Mercia 27,607 34 17 6 1 4 29 1 4<br />
West Midlands 89,214 28 15 5 4 3 27 1 0<br />
West Yorkshire 73,196 27 16 3 4 2 25 0 2<br />
Wiltshire 14,337 38 19 7 1 7 34 1 3<br />
Dyfed-Powys 16,890 69 38 15 2 7 62 1 5<br />
Gwent 32,085 55 25 10 2 10 48 1 6<br />
North Wales 18,956 43 22 8 1 5 36 1 6<br />
South Wales 52,064 39 18 3 3 3 27 0 11<br />
England and Wales 1,492,265 29 15 5 2 5 26 1 2<br />
(1) See note 5 on page 24.<br />
16
Table 6 Notifiable offences recorded by the police by offence<br />
England and Wales Number of offences and percentages<br />
April 1997<br />
April <strong>1998</strong> Underlying trend (2)<br />
Clearups <strong>1998</strong>/99<br />
Offence to<br />
to<br />
March <strong>1998</strong> March <strong>1999</strong><br />
Number Percentage Number Clearup<br />
Old rules (1) New rules (1) change rate<br />
1 Murder<br />
4.1 Manslaughter Homicide 748 750 750 2 0.3 710 94.7<br />
4.2 Infanticide<br />
2 Attempted murder 661 676 676 15 2.3 599 88.6<br />
3 Threat or conspiracy to murder 9,661 11,112 11,212 1,451 15.0 7,777 69.4<br />
4.3 Child destruction 6 9 9 3 50.0 16 177.8<br />
4.4 Causing death by dangerous driving<br />
4.6 Causing death by careless driving when 325 348 349 23 7.1 339 97.1<br />
under the influence of drink or drugs<br />
37.1 Causing death by aggravated vehicle taking 18 30 30 12 66.7 20 66.7<br />
5 Wounding or other act endangering life 12,833 13,960 14,006 1,127 8.8 10,258 73.2<br />
6 Endangering railway passenger 7 15 15 8 114.3 11 73.3<br />
More serious offences 24,259 26,900 27,047 2,641 10.9 19,730 72.9<br />
7 Endangering life at sea 0 0 0 0 0.0 0 0.0<br />
8A Other wounding 196,739 139,692 71.0<br />
8B Possession of Weapons 231,360 203,313 23,635 -28,047 -12.1 22,307 94.4<br />
8C Harassment 79,534 64,929 81.6<br />
11 Cruelty to or neglect of children N / A N / A 2,300 N / A N / A 1,962 85.3<br />
12 Abandoning a child under the age of two years 54 41 42 -13 -24.1 32 76.2<br />
13 Child abduction 391 490 502 99 25.3 268 53.4<br />
14 Procuring illegal abortion 0 2 2 2 200.0 2 100.0<br />
15 Concealment of birth 6 10 10 4 66.7 7 70.0<br />
104 Assault on a constable N / A N / A 21,510 N / A N / A 20,847 96.9<br />
105 Common Assault N / A N / A 151,472 N / A N / A 88,125 58.2<br />
Less serious offences 231,811 203,856 475,746 -27,955 -12.1 338,171 71.1<br />
Total violence against the person 256,070 230,756 502,793 -25,314 -9.9 357,901 71.2<br />
16 Buggery 657 567 566 -90 -13.7 503 88.9<br />
17 Indecent assault on a male 3,885 3,672 3,683 -213 -5.5 3,092 84.0<br />
18 Gross indecency between males 483 353 354 -130 -26.9 326 92.1<br />
19A Rape of a female 6,523 7,139 7,132 616 9.4 4,543 63.7<br />
19B Rape of a male 375 502 504 127 33.9 340 67.5<br />
20 Indecent assault on a female 18,979 19,463 19,524 484 2.6 12,169 62.3<br />
21 Unlawful sexual intercourse with a girl under 13 156 153 153 -3 -1.9 126 82.4<br />
22 Unlawful sexual intercourse with a girl under 16 1,084 1,133 1,135 49 4.5 937 82.6<br />
23 Incest 189 139 139 -50 -26.5 113 81.3<br />
24 Procuration 142 155 215 13 9.2 204 94.9<br />
25 Abduction 258 242 240 -16 -6.2 87 36.3<br />
26 Bigamy 106 126 129 20 18.9 70 54.3<br />
27 Soliciting or importuning by a man N / A N / A 1,107 N / A N / A 1,021 92.2<br />
74 Gross indecency with a child 1,314 1,271 1,293 -43 -3.3 1,022 79.0<br />
Total sexual offences 34,151 34,915 36,174 764 2.2 24,553 67.9<br />
34A Robbery of business property 62,652 66,172 10,698 3,520 5.6 3,714 34.7<br />
34B Robbery of personal property 56,138 11,403 20.3<br />
Total robbery 62,652 66,172 66,836 3,520 5.6 15,117 22.6<br />
Total violent crime 352,873 331,843 605,803 -21,030 -6.0 397,571 65.6<br />
17
Table 6 Notifiable offences recorded by the police by offence (continued)<br />
England and Wales Number of offences and percentages<br />
April 1997<br />
April <strong>1998</strong> Underlying trend (2)<br />
Clearups <strong>1998</strong>/99<br />
Offence to<br />
to<br />
March <strong>1998</strong> March <strong>1999</strong><br />
Old rules (1) New rules (1)<br />
Number Percentage<br />
change<br />
Number Clearup<br />
rate<br />
28 Burglary in a dwelling 498,578 470,005 470,468 -28,573 -5.7 103,145 21.9<br />
29 Aggravated burglary in a dwelling 3,015 2,955 2,884 -60 -2.0 1,468 50.9<br />
30 Burglary in a building other than a dwelling 486,408 478,508 479,425 -7,900 -1.6 78,141 16.3<br />
31 Aggravated burglary in building other than<br />
a dwelling 431 410 410 -21 -4.9 162 39.5<br />
Total burglary 988,432 951,878 953,187 -36,554 -3.7 182,916 19.2<br />
37.2 Aggravated vehicle taking 8,143 9,811 10,098 1,668 20.5 5,526 54.7<br />
39 Theft from the person of another 57,894 63,054 63,118 5,160 8.9 5,403 8.6<br />
40 Theft in a dwelling other than from automatic<br />
machine or meter 38,765 44,199 44,378 5,434 14.0 14,654 33.0<br />
41 Theft by an employee 17,476 17,872 17,900 396 2.3 12,761 71.3<br />
42 Theft or unauthorised taking of mail 3,692 4,919 4,931 1,227 33.2 724 14.7<br />
43 Abstracting electricity 2,978 2,454 2,454 -524 -17.6 2,125 86.6<br />
44 Theft of pedal cycle 140,031 125,178 128,558 -14,853 -10.6 10,189 7.9<br />
45 Theft from vehicle 695,498 680,937 685,921 -14,561 -2.1 69,571 10.1<br />
46 Theft from shops 273,509 281,457 281,972 7,948 2.9 202,031 71.6<br />
47 Theft from automatic machine or meter 12,662 15,211 15,343 2,549 20.1 2,987 19.5<br />
48 Theft or unauthorised taking of motor vehicle 392,381 381,080 381,713 -11,301 -2.9 65,931 17.3<br />
49 Other theft or unauthorised taking 469,592 472,869 479,312 3,277 0.7 58,077 12.1<br />
54 Handling stolen goods 32,352 27,677 27,747 -4,675 -14.5 26,930 97.1<br />
126 Vehicle interference and tampering N / A N / A 48,011 N / A N / A 3,845 8.0<br />
Total theft and handling stolen goods 2,144,973 2,126,718 2,191,456 -18,255 -0.9 480,754 21.9<br />
51 Fraud by company director 15 39 159 24 160.0 144 90.6<br />
52 False accounting 1,711 1,203 1,304 -508 -29.7 1,119 85.8<br />
53A Cheque and credit card fraud 142,311 44,233 31.1<br />
126,790 165,221 38,431 30.3<br />
53B Other frauds 122,076 44,998 36.9<br />
55 Bankruptcy and insolvency offences N / A N / A 23 N / A N / A 10 43.5<br />
60 Forgery or use of false drug prescription 799 838 842 39 4.9 647 76.8<br />
61 Other forgery 6,917 6,427 6,762 -490 -7.1 5,096 75.4<br />
814 Vehicle/driver document fraud N / A N / A 6,028 N / A N / A 5,414 89.8<br />
Total fraud and forgery 136,232 173,728 279,505 37,496 27.5 101,661 36.4<br />
56 Arson 32,051 39,636 47,274 7,585 23.7 4,757 10.1<br />
58A Criminal damage to a dwelling 221,065 43,862 19.8<br />
58B Criminal damage to a building other<br />
than a dwelling 827,104 792,275 157,955 -34,829 -4.2 27,535 17.4<br />
58C Criminal damage to a vehicle 354,724 42,431 12.0<br />
58D Other criminal damage 95,221 27,537 28.9<br />
59 Threat etc, to commit criminal damage 2,691 2,459 3,333 -232 -8.6 2,318 69.5<br />
Total criminal damage 861,846 834,370 879,572 -27,476 -3.2 148,440 16.9<br />
18
Table 6 Notifiable offences recorded by the police by offence (continued)<br />
England and Wales Number of offences and percentages<br />
Offence April 1997<br />
April <strong>1998</strong><br />
Underlying trend (2)<br />
Clearups <strong>1998</strong>/99<br />
to<br />
to<br />
March <strong>1998</strong> March <strong>1999</strong><br />
Number Percentage Number Clearup<br />
Old rules (1) New rules (1) change rate<br />
92A Trafficking in controlled drugs 23,336 21,306 21,788 -2,030 -8.7 21,514 98.7<br />
92B Possession of controlled drugs N / A N / A 112,576 N / A N / A 108,391 96.3<br />
92C Other drug offences N / A N / A 1,581 N / A N / A 1,546 97.8<br />
Total drug offences 23,336 21,306 135,945 -2,030 -8.7 131,451 96.7<br />
33 Going equipped for stealing, etc 6,006 5,852 5,866 -154 -2.6 5,550 94.6<br />
35 Blackmail 927 1,036 1,039 109 11.8 589 56.7<br />
36 Kidnapping 1,652 2,046 2,049 394 23.8 1,406 68.6<br />
62 High treason and other offences against<br />
Treason Acts 0 0 0 0 0.0 0 0.0<br />
63 Treason felony 0 0 0 0 0.0 0 0.0<br />
64 Riot 6 3 2 -3 -50.0 3 150.0<br />
65 Violent disorder 2,113 2,460 2,500 347 16.4 2,235 89.4<br />
66 Other offence against the state or public order 16,736 17,334 18,638 598 3.6 16,394 88.0<br />
67 Perjury 348 314 329 -34 -9.8 271 82.4<br />
68 Libel 3 3 3 0 0.0 7 233.3<br />
75 Betting, gaming, lotteries N / A N / A 48 N / A N / A 46 95.8<br />
76 Aiding suicide 12 8 8 -4 -33.3 7 87.5<br />
78 Immigration offences N / A N / A 505 N / A N / A 492 97.4<br />
79 Perverting the course of justice 7,108 9,216 9,265 2,108 29.7 8,329 89.9<br />
80 Absconding from lawful custody 1,372 1,294 1,301 -78 -5.7 1,261 96.9<br />
81 Firearms Act offences N / A N / A 3,325 N / A N / A 3,087 92.8<br />
82 Customs and Revenue offences N / A N / A 119 N / A N / A 98 82.4<br />
83 Bail offences N / A N / A 66 N / A N / A 63 95.5<br />
84 Trade Descriptions etc. N / A N / A 263 N / A N / A 256 97.3<br />
85 Health and Safety offences N / A N / A 7 N / A N / A 4 57.1<br />
86 Obscene publications, etc. N / A N / A 603 N / A N / A 541 89.7<br />
87 Protection from eviction N / A N / A 68 N / A N / A 17 25.0<br />
89 Adulteration of food N / A N / A 69 N / A N / A 54 78.3<br />
90 Knives Act 1997 offences N / A N / A 99 N / A N / A 93 93.9<br />
91 Public health offences N / A N / A 9 N / A N / A 4 44.4<br />
94 Planning laws N / A N / A 2 N / A N / A 0 0.0<br />
99 Other offences 1,362 2,408 2,537 1,046 76.8 1,871 73.7<br />
139 Indecent exposure N / A N / A 10,327 N / A N / A 2,664 25.8<br />
802 Dangerous driving N / A N / A 4,589 N / A N / A 4,130 90.0<br />
Total other offences 37,645 41,974 63,636 4,329 11.5 49,472 77.7<br />
Total notifiable offences 4,545,337 4,481,817 5,109,104 -63,520 -1.4 1,492,265 29.2<br />
(1) 'Old rules' denotes the number of crimes that would have been recorded using the coverage and rules in use until 31 March <strong>1998</strong>.<br />
'New rules' denotes crimes recorded using the expanded offence coverage and revised counting rules which came into effect on 1 April <strong>1998</strong>.<br />
(2) Underlying trend is calculated using the old rule counting figures.<br />
19
ANNEX A<br />
Assessment of the impact of the counting rule and coverage changes.<br />
(1) The recorded crime figures in this publication are based on statistical returns<br />
provided by the 43 police forces in England and Wales. The data are compiled<br />
using rules for coverage, classification and counting issued by the Home Office. The<br />
rules maintain consistency between police force areas for recording some of the<br />
more complex and potentially difficult offences, such as multiple, continuous and<br />
repeated offences. Periodically, the Home Office rules and police recording<br />
practices are reviewed to ensure consistency and to determine whether updates are<br />
necessary. The latest changes took effect on 1 April <strong>1998</strong>.<br />
(2) Under the new counting rules, the statistics wherever possible measure one<br />
crime per victim; this will greatly improve the comparability between notifiable<br />
offence figures and victim surveys, such as the British Crime Survey. The main<br />
impact of the rule changes is on offences contained within the fraud and criminal<br />
damage groups. The reasoning behind this assessment is that under the previous<br />
rules:<br />
• an offence relating to the fraudulent use of a credit card would only be<br />
recorded by the police if the victim reported the misuse to the police; any<br />
misuses that the police discovered during an investigation that had not been<br />
reported to them would not be recorded. With the new rules any fraudulent<br />
uses would be recorded.<br />
• criminal damage of a very minor nature (valued at £20 or under) was not<br />
counted for detection performance purposes, and it is likely that some of<br />
these offences would not have been recorded. With the new rules all criminal<br />
damage should be recorded irrespective of value.<br />
(3) Under the new coverage rules, the notifiable offence umbrella has been<br />
widened to include all indictable and triable-either-way offences, together with a few<br />
summary offences which are very closely linked to these offences. All the new offence<br />
headings can be seen in table 6 of this bulletin. Those which have made a substantial<br />
impact on the total number of crimes recorded include:<br />
20
• within violence against the person : cruelty to or neglect of children, assault on a<br />
constable, and common assault. A number of forces previously recorded some<br />
common assault crimes as wounding, in line with guidance issued by the<br />
Association of Chief Police Officers.<br />
• within sexual offences : soliciting or importuning by a man.<br />
• within theft and handing : vehicle interference and tampering.<br />
• within fraud and forgery : vehicle and driver document fraud.<br />
• within drug offences : possession of controlled drugs, and other (non-trafficking)<br />
drug offences.<br />
• within other offences : indecent exposure, dangerous driving, Firearms Act<br />
offences, and obscene publication offences.<br />
(4) An assessment has been made of the overall impact of changing the rules<br />
and coverage. The assessment has been made using two methods. Eighteen<br />
police force areas undertook the Home Office preferred method of a full double<br />
counting exercise – i.e. they counted all crimes recorded during <strong>1998</strong>/99 using both<br />
the old counting rules and coverage, as well as using the new rules. The remaining<br />
forces undertook an exercise designed by the Home Office Research, Development<br />
and Statistics Directorate to sample a proportion of the offences where the forces<br />
felt that the new rules would have the greatest impact on them. 95% confidence<br />
levels for the effect of the changes have been calculated for the forces who<br />
completed the sampling exercise; this assessment is not applicable for the forces<br />
which double counted.<br />
(5) It has not been possible to assess some recording practice changes within<br />
individual police force areas. For instance a number of forces previously recorded<br />
very minor injury assaults as woundings; these will now be recorded as common<br />
assault, and will thus reduce the wounding category. This is also the case for vehicle<br />
interference – some attempted vehicle thefts may now be recorded as vehicle<br />
interference, when previously they would have been included within the theft of a<br />
vehicle category.<br />
(6) The new rules had different effects on each police force area and on each<br />
offence group. The reasoning behind this is the differing composition of the offence<br />
groups within each police force area, together with differing interpretations of the<br />
previous rules.<br />
21
(7) The overall effect on the main offence groups is shown below in table A1,<br />
with the effect on each force area shown in table A2.<br />
Table A1 Effect of counting rule and offence coverage changes, by offence group<br />
England and Wales Percentage effect and 95% confidence intervals.<br />
Offence group<br />
Effect of new counting rules<br />
and offence coverage by<br />
offence group<br />
22<br />
Percentage point accuracy<br />
(95% confidence level)<br />
Violence against the person + 118% +/- 2.1%<br />
Sexual offences + 4% +/- 0.0%<br />
Robbery + 1% +/- 0.1%<br />
Burglary + 0.1% +/- 0.1%<br />
All theft & handling + 3% +/- 0.7%<br />
(inc. theft of and from vehicles) + 1% +/- 0.6%<br />
Fraud and forgery + 61% +/- 1.8%<br />
Criminal damage + 5% +/- 1.1%<br />
Drug offences + 538% +/- 0.0%<br />
Other offences + 52% +/- 0.0%<br />
All offences + 14.0% +/- 0.7%
Table A2 Effect of counting rule and offence coverage changes, by police force area<br />
England and Wales Percentage effect and 95% confidence intervals.<br />
Police force area<br />
Effect of new counting rules<br />
and offence coverage by<br />
police force area<br />
23<br />
Percentage point accuracy<br />
(95% confidence level)<br />
Avon and Somerset + 13.7% Nil<br />
Bedfordshire + 11.7% Nil<br />
Cambridgeshire + 12.7% +/- 1.9%<br />
Cheshire + 9.6% Nil<br />
Cleveland + 5.2% Nil<br />
Cumbria + 14.3% +/- 1.1%<br />
Derbyshire + 14.1% +/- 0.8%<br />
Devon and Cornwall + 25.0% +/- 2.3%<br />
Dorset + 20.2% Nil<br />
Durham + 14.1% +/- 2.1%<br />
Essex + 9.9% Nil<br />
Gloucestershire + 9.6% +/- 2.3%<br />
Greater Manchester + 7.8% Nil<br />
Hampshire + 11.5% Nil<br />
Hertfordshire + 6.6% +/- 1.3%<br />
Humberside + 9.6% Nil<br />
Kent + 17.3% +/- 1.9%<br />
Lancashire + 12.3% +/- 0.6%<br />
Leicestershire + 14.3% +/- 1.8%<br />
Lincolnshire + 17.5% +/- 3.1%<br />
London City of + 18.4% Nil<br />
Merseyside + 7.9% +/- 0.4%<br />
Metropolitan Police + 21.7% Nil<br />
Norfolk + 11.7% +/- 1.1%<br />
Northamptonshire + 17.2% Nil<br />
Northumbria + 14.1% +/- 1.3%<br />
North Yorkshire + 14.3% +/- 0.8%<br />
Nottinghamshire + 9.4% Nil<br />
South Yorkshire + 6.9% Nil<br />
Staffordshire + 8.8% +/- 1.1%<br />
Suffolk + 16.4% +/- 3.4%<br />
Surrey + 16.7% +/- 2.9%<br />
Sussex + 17.0% +/- 1.7%<br />
Thames Valley + 9.2% +/- 1.7%<br />
Warwickshire + 7.9% Nil<br />
West Mercia + 17.8% +/- 2.0%<br />
West Midlands + 13.8% +/- 1.8%<br />
West Yorkshire + 11.1% Nil<br />
Wiltshire + 15.8% +/- 2.3%<br />
Dyfed-Powys + 37.7% +/- 3.4%<br />
Gwent + 24.0% +/- 2.8%<br />
North Wales + 19.9% Nil<br />
South Wales + 11.5% Nil<br />
All police force areas + 14.0% +/- 0.7%<br />
“Nil” denotes that the police force double counted all crimes during <strong>1998</strong>/99 and therefore is not<br />
subject to sampling error.
NOTES<br />
1. The recorded crime statistics contain details of notifiable offences which are<br />
recorded by the police. The coverage and more details of the series of notifiable<br />
offences can be found in Chapter 2 (which gives figures for 1987-1997) and<br />
Appendices 2 and 3 of “Criminal statistics, England and Wales, 1997” (Cm 4162). On<br />
1 April <strong>1998</strong>, the coverage of notifiable offences was expanded to include all indictable<br />
offences, all triable-either-way offences, and closely associated summary offences.<br />
The guidance rules issued by the Home Office to the police on how to count crime<br />
were also revised on that date. Further details of the changes, and the way in which<br />
they have affected the notifiable offence series, are shown in Annex A.<br />
2. A large proportion of crime is unrecorded, as many offences are not reported to<br />
the police. The propensity of the public to report offences to the police changes over<br />
time, and is related to various factors. These include actions of the insurance industry,<br />
which in some cases:<br />
- require offences to be reported to the police before claims are considered;<br />
- relate householders’ premiums to the level of previous claims.<br />
More details on the level of reporting can be found in reports of the British Crime<br />
Survey. Results from the <strong>1998</strong> BCS are reported in The <strong>1998</strong> British Crime Survey<br />
by Catriona Mirrlees-Black, Tracey Budd, Sarah Partridge, and Pat Mayhew, (Home<br />
Office Statistical Bulletin issue 21/98), which is available from the address shown in<br />
paragraph 7 below.<br />
3. Crimes that can be compared between the British Crime Survey and recorded<br />
crime are burglary, thefts of and from vehicles, theft of a pedal cycle, theft from the<br />
person, criminal damage, wounding and robbery.<br />
4. The metropolitan police force areas are taken to be the Metropolitan Police<br />
District, City of London, West Midlands, Merseyside, Greater Manchester, West<br />
Yorkshire, South Yorkshire and Northumbria.<br />
5. The definition adopted by the Audit Commission for primary and secondary<br />
clear-ups has been used. The term “primary clear-up” refers to offences deemed to<br />
be cleared up by a charge, summons or caution, taken into consideration (where the<br />
crime was previously recorded) and other methods. “Secondary clear-ups” include<br />
offences taken into consideration (where the crime was not previously recorded), and<br />
24
those which involve attributing an offence to someone already charged or convicted of<br />
another offence.<br />
6. This bulletin has been prepared by the members of the Recorded Crime<br />
section which forms part of the Crime and Criminal Justice Unit in the Home Office<br />
Research, Development and Statistics Directorate. The Crime and Criminal Justice<br />
Unit would like to acknowledge with thanks the assistance of the police force statistics<br />
officers and the Home Office Data Collection Unit in providing and collating the<br />
statistics. If you have any enquiries about the figures in this bulletin, or wish to request<br />
further analysis of the data (for which there may be a charge), you should contact<br />
David Povey or any member of his section. The address is:<br />
Crime and Criminal Justice Unit,<br />
Research, Development and Statistics Directorate,<br />
Home Office,<br />
Room 843, 50 Queen Anne’s Gate,<br />
London, SW1H 9AT.<br />
telephone: 020 7273 2711.<br />
7. Additional copies of this bulletin, together with other Research, Development<br />
and Statistics Directorate publications, can be obtained by contacting:<br />
RDS Information and Publications Group,<br />
Home Office,<br />
Room 201, 50 Queen Anne’s Gate,<br />
London, SW1H 9AT.<br />
telephone: 020 7273 2084.<br />
e-mail: rds.ho@gtnet.<strong>gov</strong>.<strong>uk</strong><br />
Many RDS publications are also downloadable from our website at:<br />
http://www.homeoffice.<strong>gov</strong>.<strong>uk</strong>/rds/publf.htm<br />
25
8. Press enquiries should be made to:<br />
Home Office Press Office,<br />
Communication Directorate,<br />
50 Queen Anne’s Gate,<br />
London, SW1H 9AT.<br />
telephone: 020 7273 4600<br />
9. The next edition of the notifiable offence bulletin, containing data for the twelve<br />
months ending September <strong>1999</strong>, will be published on 11 January 2000.<br />
26
RESEARCH DEVELOPMENT AND STATISTICS DIRECTORATE<br />
MISSION STATEMENT<br />
<strong>1999</strong><br />
RDS is part of the Home Office. The Home Office’s purpose is to build a safe, just<br />
and tolerant society in which the rights and responsibilities of individuals, families<br />
and communities are properly balanced and the protection and security of the public<br />
are maintained.<br />
RDS is also a part of the Government Statistical Service (GSS). One of the GSS<br />
aims is to inform Parliament and the citizen about the state of the nation and provide<br />
a window on the work and performance of <strong>gov</strong>ernment, allowing the impact of<br />
<strong>gov</strong>ernment policies and actions to be assessed.<br />
Therefore -<br />
Research Development and Statistics Directorate exists to improve policy<br />
making, decision taking and practice in support of the Home Office purpose<br />
and aims, to provide the public and Parliament with information necessary for<br />
informed debate and to publish information for future use.<br />
27
HOME OFFICE STATISTICAL BULLETINS ISSUED IN THE PAST YEAR<br />
ISSUE DATE TITLE<br />
18/98 17.09.98 Cautions, Court Proceedings and Sentencing, England and Wales<br />
1997.<br />
19/98 25.09.98 Statistics of Mentally Disordered Offenders in England and Wales<br />
1997.<br />
20/98 24.09.98 Police Complaints and Discipline, England and Wales, April 1997<br />
to March <strong>1998</strong>.<br />
21/98 13.10.98 The <strong>1998</strong> British Crime Survey.<br />
22/98 13.10.98 Notifiable Offences, England and Wales, April 1997 to March <strong>1998</strong>.<br />
23/98 22.10.98 Liquor Licensing – Children’s Certificates, England and Wales,<br />
July 1997 – June <strong>1998</strong>.<br />
24/98 29.10.98 Control of Immigration: Statistics, United Kingdom, First Half <strong>1998</strong>.<br />
25/98 03.11.98 Fire Statistics, United Kingdom 1997.<br />
26/98 19.11.98 Firearm Certificate Statistics, England and Wales 1997.<br />
27/98 10.12.98 Liquor Licensing, England and Wales, July 1997 – June <strong>1998</strong>.<br />
1/99 20.01.99 Projections of Long Term Trends in the Prison Population to 2006.<br />
2/99 22.01.99 Operations of Certain Police Powers under PACE, England and<br />
Wales, 1997/8.<br />
3/99 04.03.99 Statistics on the Operation of Prevention of Terrorism Legislation,<br />
Great Britain <strong>1998</strong>.<br />
4/99 11.03.99 Burglary of Domestic Dwellings: Findings from the British Crime<br />
Survey.<br />
5/99 19.04.99 Reconvictions of offenders sentenced or discharged from prison in<br />
1994, England and Wales.<br />
6/99 20.04.99 Persons granted British Citizenship, United Kingdom <strong>1998</strong>.<br />
7/99 22.04.99 Statistics of Deaths Reported to Coroners: England and Wales <strong>1998</strong>.<br />
8/99 29.04.99 Drug Seizure and Offender Statistics, United Kingdom 1997.<br />
9/99 25.05.99 Fire Statistics, Estimates, United Kingdom <strong>1998</strong>.<br />
10/99 27.05.99 Asylum Statistics, United Kingdom <strong>1998</strong>.<br />
11/99 27.05.99 Control of Immigration: Statistics, United Kingdom, Second Half and<br />
Year <strong>1998</strong>.<br />
12/99 28.05.99 Motoring Offences, England and Wales 1997.<br />
13/99 28.07.99 Review of Comparative Costs and Performance of Privately and<br />
Publicly Operated Prisons 1997-98.<br />
14/99 26.08.99 Police Service Personnel, England and Wales, as 31 March <strong>1999</strong>.<br />
15/99 08.09.99 Fire Statistics, United Kingdom <strong>1998</strong>.<br />
16/99 09.09.99 Breath Test Statistics, England and Wales <strong>1998</strong>.<br />
17/99 17.09.99 Police Complaints and Discipline, England and Wales, April <strong>1998</strong><br />
to March <strong>1999</strong>.<br />
Copies of these bulletins are available from: Research, Development and Statistics Directorate,<br />
Information and Publications Group, Room 201, Home Office,<br />
50 Queen Anne’s Gate, London, SW1H 9AT. Tel. 020 7273 2084<br />
Or by Internet email rds.ho@gtnet.<strong>gov</strong>.<strong>uk</strong><br />
RDS Internet site http://www.homeoffice.<strong>gov</strong>.<strong>uk</strong>/rds/index.htm<br />
28