the best probability model for the exacta
the best probability model for the exacta
the best probability model for the exacta

You also want an ePaper? Increase the reach of your titles
YUMPU automatically turns print PDFs into web optimized ePapers that Google loves.
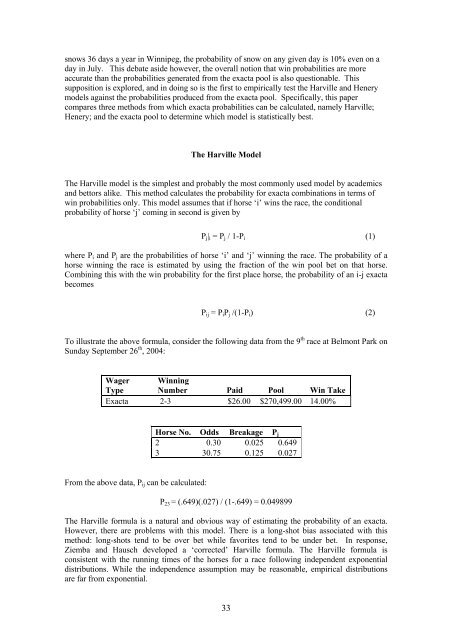
snows 36 days a year in Winnipeg, <strong>the</strong> <strong>probability</strong> of snow on any given day is 10% even on a<br />
day in July. This debate aside however, <strong>the</strong> overall notion that win probabilities are more<br />
accurate than <strong>the</strong> probabilities generated from <strong>the</strong> <strong>exacta</strong> pool is also questionable. This<br />
supposition is explored, and in doing so is <strong>the</strong> first to empirically test <strong>the</strong> Harville and Henery<br />
<strong>model</strong>s against <strong>the</strong> probabilities produced from <strong>the</strong> <strong>exacta</strong> pool. Specifically, this paper<br />
compares three methods from which <strong>exacta</strong> probabilities can be calculated, namely Harville;<br />
Henery; and <strong>the</strong> <strong>exacta</strong> pool to determine which <strong>model</strong> is statistically <strong>best</strong>.<br />
The Harville Model<br />
The Harville <strong>model</strong> is <strong>the</strong> simplest and probably <strong>the</strong> most commonly used <strong>model</strong> by academics<br />
and bettors alike. This method calculates <strong>the</strong> <strong>probability</strong> <strong>for</strong> <strong>exacta</strong> combinations in terms of<br />
win probabilities only. This <strong>model</strong> assumes that if horse ‘i’ wins <strong>the</strong> race, <strong>the</strong> conditional<br />
<strong>probability</strong> of horse ‘j’ coming in second is given by<br />
Pj|i = Pj / 1-Pi (1)<br />
where Pi and Pj are <strong>the</strong> probabilities of horse ‘i’ and ‘j’ winning <strong>the</strong> race. The <strong>probability</strong> of a<br />
horse winning <strong>the</strong> race is estimated by using <strong>the</strong> fraction of <strong>the</strong> win pool bet on that horse.<br />
Combining this with <strong>the</strong> win <strong>probability</strong> <strong>for</strong> <strong>the</strong> first place horse, <strong>the</strong> <strong>probability</strong> of an i-j <strong>exacta</strong><br />
becomes<br />
Pij = PiPj /(1-Pi) (2)<br />
To illustrate <strong>the</strong> above <strong>for</strong>mula, consider <strong>the</strong> following data from <strong>the</strong> 9 th race at Belmont Park on<br />
Sunday September 26 th , 2004:<br />
Wager Winning<br />
Type Number Paid Pool Win Take<br />
Exacta 2-3 $26.00 $270,499.00 14.00%<br />
From <strong>the</strong> above data, Pij can be calculated:<br />
Horse No. Odds Breakage Pj<br />
2 0.30 0.025 0.649<br />
3 30.75 0.125 0.027<br />
P23 = (.649)(.027) / (1-.649) = 0.049899<br />
The Harville <strong>for</strong>mula is a natural and obvious way of estimating <strong>the</strong> <strong>probability</strong> of an <strong>exacta</strong>.<br />
However, <strong>the</strong>re are problems with this <strong>model</strong>. There is a long-shot bias associated with this<br />
method: long-shots tend to be over bet while favorites tend to be under bet. In response,<br />
Ziemba and Hausch developed a ‘corrected’ Harville <strong>for</strong>mula. The Harville <strong>for</strong>mula is<br />
consistent with <strong>the</strong> running times of <strong>the</strong> horses <strong>for</strong> a race following independent exponential<br />
distributions. While <strong>the</strong> independence assumption may be reasonable, empirical distributions<br />
are far from exponential.<br />
33