local agenda 21 local plan for sustainable development of bistriþa ...
local agenda 21 local plan for sustainable development of bistriþa ...
local agenda 21 local plan for sustainable development of bistriþa ...

You also want an ePaper? Increase the reach of your titles
YUMPU automatically turns print PDFs into web optimized ePapers that Google loves.
BISTRITA<br />
59<br />
III. Social capital<br />
III.1 POPULATION STRUCTURE AND DYNAMICS<br />
According to the data supplied by the County Department <strong>for</strong> Statistics Bistrita-Nasaud, the population <strong>of</strong> Bistrita<br />
municipality on 1 January 2004 was 82,689, a fall compared with the data from the census in 1992, when the<br />
population was 87,710 inhabitants. A natural negative growth in the population <strong>of</strong> 0.94% was recorded. The main<br />
demographic indicators <strong>for</strong> Bistrita municipality are:<br />
92,2%<br />
7,8%<br />
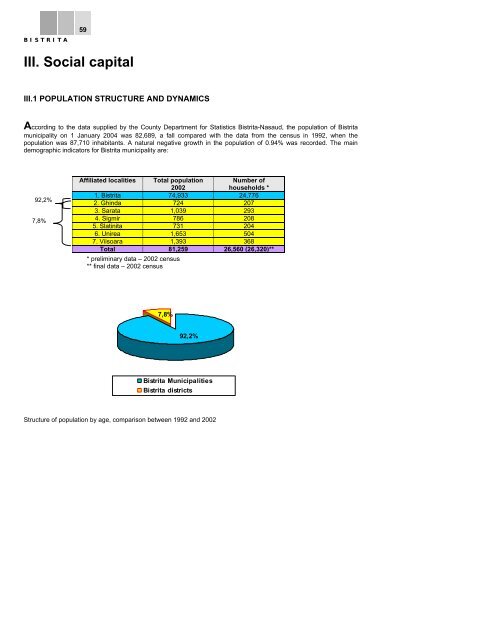
Affiliated <strong>local</strong>ities Total population Number <strong>of</strong><br />
2002<br />
households *<br />
1. Bistrita 74,933 24,776<br />
2. Ghinda 724 207<br />
3. Sarata 1,039 293<br />
4. Sigmir 786 208<br />
5. Slatinita 731 204<br />
6. Unirea 1,653 504<br />
7. Viisoara 1,393 368<br />
Total 81,259 26,560 (26,320)**<br />
* preliminary data – 2002 census<br />
** final data – 2002 census<br />
7,8%<br />
92,2%<br />
Bistrita Municipalities<br />
Bistrita districts<br />
Structure <strong>of</strong> population by age, comparison between 1992 and 2002