Create successful ePaper yourself
Turn your PDF publications into a flip-book with our unique Google optimized e-Paper software.
Performance<br />
at a glance<br />
I GAAP consolidated figures<br />
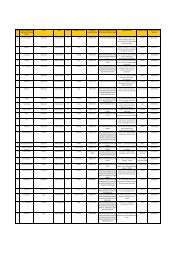
Particulars Units<br />
2005 2006<br />
Financial Year Ended March 31,<br />
2007 2008 2009<br />
2010<br />
Total customer base 000’s 11,842 20,926 39,013 64,268 96,649 130,686<br />
Mobile services 000’s 10,984 19,579 37,141 61,985 93,923 127,619<br />
Telemedia services<br />
Based on statement of operations<br />
000’s 857 1,347 1,871 2,283 2,726 3,067<br />
Revenue Rs mn 81,558 116,641 184,202 270,122 373,521 418,295<br />
EBITDA Rs mn 30,658 41,636 74,407 114,018 152,858 168,473<br />
Cash profit from operations Rs mn 28,219 40,006 73,037 111,535 135,769 174,728<br />
Earnings before tax Rs mn 15,832 23,455 46,784 73,115 85,910 108,954<br />
Profit after tax<br />
Based on balance sheet<br />
Rs mn 12,116 20,279 40,621 63,954 78,590 91,631<br />
Stockholders' equity Rs mn 53,200 73,624 114,884 217,244 291,279 398,789<br />
Net debt Rs mn 41,171 41,738 42,867 40,886 84,022 25,474<br />
Capital employed<br />
Key ratios<br />
Rs mn 94,371 115,362 157,750 258,130 375,301 424,264<br />
EBITDA margin % 37.59 35.70 40.39 42.21 40.92 40.28<br />
Net profit margin % 14.86 17.39 22.05 23.68 21.04 21.91<br />
Return on stockholders' equity % 23.68 31.98 43.10 38.51 30.91 26.56<br />
Return on capital employed % 15.67 21.48 31.57 33.29 30.69 21.66<br />
Net debt to EBITDA Times 1.34 1.00 0.58 0.36 0.55 0.15<br />
Interest coverage ratio Times 9.65 17.45 26.47 29.51 30.38 26.46<br />
Book value per equity share * Rs 14.35 19.44 30.30 57.23 76.72 105.01<br />
Net debt to stockholders' equity Times 0.77 0.57 0.37 0.19 0.29 0.06<br />
Earnings per share (basic) * Rs<br />
3.26 5.39 10.72 17.12 20.70 24.13<br />
*During the financial year 2009-10, the Company has sub-divided (share split) its 1 equity share of Rs 10 each into 2 equity shares of Rs 5 each. Thus, previous year’s figures have been restated accordingly<br />
Customer base (Nos. '000)<br />
857<br />
10,984<br />
11,842<br />
14.86<br />
1,347<br />
19,579<br />
20,926<br />
1,871<br />
37,141<br />
39,013<br />
2,283<br />
61,985<br />
64,268<br />
2004-05 2005-06 2006-07 2007-08 2008-09 2009-10<br />
Telemedia services Mobile services Total customer base<br />
Profit (Rs mn) & Profit margin (%)<br />
12,116<br />
17.39<br />
20,279<br />
40,621<br />
2,726<br />
93,923<br />
96,649<br />
3,067<br />
127,619<br />
130,686<br />
2004-05 2005-06 2006-07 2007-08 2008-09 2009-10<br />
Profit after tax Net profit margin<br />
63,954<br />
22.05 23.68 21.04<br />
78,590<br />
21.91<br />
91,631<br />
81,558<br />
30,658<br />
Earnings (Rs mn)<br />
Shareholders' return (Rs)<br />
3.26<br />
116,641<br />
41,636<br />
2004-05 2005-06 2006-07 2007-08 2008-09 2009-10<br />
Revenue EBITDA<br />
5.39<br />
184,202<br />
74,407<br />
10.72<br />
2004-05 2005-06 2006-07 2007-08 2008-09 2009-10<br />
Earnings per share (basic)<br />
270,122<br />
114,018<br />
17.12<br />
373,521<br />
152,858<br />
20.70<br />
418,295<br />
168,473<br />
24.13