Create successful ePaper yourself
Turn your PDF publications into a flip-book with our unique Google optimized e-Paper software.
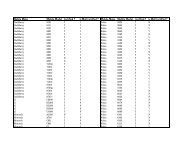
Particulars<br />
A. Cash flow from operating activities:<br />
(Rs '000)<br />
For the year ended For the year ended<br />
March 31, 2010 March 31, 2009<br />
Net profit before tax 108,954,366 85,910,130<br />
Adjustments for:<br />
Depreciation 61,994,095 46,727,692<br />
Interest Expense and other Finance Charges 6,365,408 5,030,519<br />
Interest Income (1,655,282) (1,858,591)<br />
(Profit)/Loss on Sale of Assets (Net) 430,075 25,735<br />
(Profit)/Loss on sale of Investments (1,891,323) (2,592,369)<br />
Amortisation of ESOP Expenditure 1,446,352 894,878<br />
Lease Equalisation / FCCB Premium 1,378,418 1,161,147<br />
Amortisation of Goodwill 850,280 800,355<br />
Provision for Deferred Bonus/ Long Term Service Award 239,969 582,841<br />
Licence fee Amortisation 1,253,358 1,217,408<br />
Bad Debts/Advances Written off 729,936 815,967<br />
Provision for Bad and Doubtful Debts/Advances<br />
(Net of write back) 2,766,675 3,002,326<br />
Liabilities / Provisions no longer required written back (528,124) (577,057)<br />
Provision for Gratuity and Leave Encashment 311,215 362,092<br />
Provision for Inventory for obsolete/Damaged stock 1,109,753 519,726<br />
Unrealized Foreign Exchange (gain)/loss (8,509,232) 15,393,148<br />
Provision for Warranty 1,230 (4,470)<br />
Loss from swap arrangements 87,713 65,433<br />
Provision for Wealth Tax (Net) 496 540<br />
Operating profit before working capital changes 175,335,378 157,477,450<br />
Adjustments for changes in working capital :<br />
- (Increase)/ Decrease in Sundry Debtors (5,650,072) (4,817,031)<br />
- (Increase)/ Decrease in Other Receivables 13,444,470 (24,816,570)<br />
- (Increase)/ Decrease in Inventory 260,764 (340,107)<br />
- Increase/ (Decrease) in Trade and Other Payables (5,497,375) 22,450,023<br />
Cash generated from operations 177,893,165 149,953,765<br />
Taxes (Paid)/Received (23,328,650) (12,838,132)<br />
Net cash from operating activities 154,564,515 137,115,633<br />
B. Cash flow from investing activities:<br />
Purchase of fixed assets (125,077,287) (168,589,591)<br />
Proceeds from Sale of fixed assets 6,216,850 1,868,859<br />
Proceeds from Sale of Investments 358,118,406 420,787,078<br />
Purchase of Investments (384,314,092) (393,572,466)<br />
Dilution in Equity of Subsidiary Company - 1,186,499<br />
Interest Received 2,116,272 1,362,657<br />
Purchase of Fixed Deposits (with maturity more than three months) (17,436,582) (14,915,238)<br />
Proceeds from Maturity of Fixed Deposits<br />
(with maturity more than three months) 27,301,700 300,027<br />
Acquisition/ Subscription/Investment in Subsidiaries/ Associate (13,956,352) (181,518)<br />
Net cash (used) in investing activities (147,031,085) (151,753,693)