Annual Report 2012 - Verein der Kohlenimporteure eV
Annual Report 2012 - Verein der Kohlenimporteure eV
Annual Report 2012 - Verein der Kohlenimporteure eV

You also want an ePaper? Increase the reach of your titles
YUMPU automatically turns print PDFs into web optimized ePapers that Google loves.
ANNUAL REPORT<br />
<strong>2012</strong><br />
Facts and Trends 2011/<strong>2012</strong>
2 Import Coal Market at a Glance<br />
World<br />
2009 2010 2011 1)<br />
Hard Coal Production Mill. t 6,100 6,720 6,960<br />
Hard Coal World Trade Mill. t 916 1,053 1,042<br />
thereof Hard Coal Seaborne Mill. t 859 963 978<br />
Hard Coal Cross-Bor<strong>der</strong> Trade Mill. t 57 90 64<br />
Coke Production Mill. t 540 593 644<br />
Coke World Trade Mill. t 14 21 21<br />
European Union (27)<br />
Hard Coal Production Mill. t 135 133 130<br />
Hard Coal Imports/Cross-Bor<strong>der</strong> Trade Mill. t 189 182 198<br />
Coke Imports Mill. t 8 8 8<br />
Germany<br />
Hard Coal Consumption Mill. t 58.0 66.0 63.1<br />
Hard Coal Production Mill. t 13.8 12.9 12.1<br />
Total Imports Mill. t 39.4 45.2 48.4<br />
thereof Hard Coal Imports Mill. t 36.5 41.0 44.2<br />
Coke Imports Mill. t 2.9 4.1 4.2<br />
Import Coal Use 2) Mill. t 41.8 50.4 49.5<br />
thereof Power Plants Mill. t 31.0 34.4 33.6<br />
Iron and Steel Industry Mill. t 10.0 14.7 14.5<br />
Heating Market Mill. t 0.9 1.3 1.5<br />
Prices (annual averages)<br />
Steam Coal Marker Price CIF NWE US$/TCE 82 107 143<br />
Cross-Bor<strong>der</strong> Price Steam Coal €/TCE 79 85 107<br />
CO 2 Certificate Price €/TCO 2 13 14 14<br />
Exchange Rate €/US$ 0.72 0.75 0.72<br />
1) Some figures provisional<br />
2) Total import and use of import coal differ owing to inventory movements<br />
Disclaimer<br />
Whilst care has been taken in the production of this review, no liability can be accepted for any loss incurred in any<br />
way whatsoever by any person who may seek to rely on the information contained herein.
An Introductory Word –<br />
The Contribution of Hard Coal to the Energy Turnaround<br />
Last year, Germany began a new chapter in energy policies. The objective is for the greatest part of<br />
energy provision to come from renewable sources by 2050. If achieved, 80% of the demand for electrical<br />
power in Germany will be covered by renewable energy. Moreover, the disaster in Fukushima has<br />
caused Germany to reevaluate the role of nuclear energy with the consequence that, step by step, all of<br />
the nuclear power plants will be shut down by 2022.<br />
But the restructuring of our energy system will take decades, and the energy supply must at all times be<br />
secure, affordable and environmentally friendly. The guiding model for energy policies within the framework<br />
of the energy turnaround should be the strengthening of the competition among the primary energy<br />
sources while allowing hard coal to take its appropriate place as a swing supplier and the guarantor of<br />
a supply of power and heat which is secure, stabilises the grid, is good value for money and, thanks to<br />
high degrees of efficiency, environmentally friendly as well. The construction and mo<strong>der</strong>nisation of the<br />
(reserve) power plants to cover the base load should not be “bought” with subsidies (capacity markets).<br />
Instead, attention should be given to the evolvement of the electricity markets, e.g. an expansion of the<br />
balancing energy markets based on free market principles as a means of compensating the fluctuating<br />
feed-in of power from renewable sources by utilising hard coal-fired power plants.<br />
Hamburg, May <strong>2012</strong><br />
Dr. Wolfgang Cieslik<br />
– President –<br />
Dr. Erich Schmitz<br />
– Managing Director –<br />
3
CONTENTS<br />
Prospects for the World Coal Market<br />
World Trade .................................................................6<br />
Steam Coal Market ......................................................8<br />
Coking Coal Market ....................................................9<br />
Trade with Low-calorific Coal ..................................10<br />
New Price Indices for Steam Coalle .........................11<br />
Coking Coal Index .....................................................11<br />
General Global Economic Conditions<br />
Economic Growth......................................................11<br />
World Population .......................................................12<br />
World Energy Outlook 2035 ......................................14<br />
World Energy Consumption ......................................14<br />
Hard Coal Output ......................................................18<br />
Coal Reserves ............................................................20<br />
Hard Coal World Market ...........................................20<br />
Steam Coal Market ....................................................22<br />
Coking Coal Market ..................................................25<br />
Freight Rates ..............................................................28<br />
Raw Material and Energy Policies ............................29<br />
CO 2 -Emissions ...........................................................30<br />
OECD Environmental Outlook .................................30<br />
European Union<br />
Economic Growth......................................................32<br />
Energy Consumption .................................................33<br />
Greenhouse Gas Emissions .......................................33<br />
Hard Coal Market ......................................................35<br />
Energy Policies ..........................................................39<br />
EU Energy Road Map 2050.......................................39<br />
CCS Technology ........................................................41<br />
European Energy Efficiency Package .......................42<br />
EU Emissions Trade ..................................................42<br />
Germany<br />
Economic Growth..................................................... 44<br />
Primary Energy Consumption ..................................45<br />
Energy Productivity/Power Generation ....................45<br />
Hard Coal Market ......................................................46<br />
Steel Production .........................................................54<br />
Energy and CO 2 Prices ..............................................54<br />
CO 2 Emissions Trade .................................................55<br />
Energy Turnaround and New Coal-fired Power Plants 61<br />
Renewable Energies / EEG Surcharge ......................65<br />
CCS Bill Draft ...........................................................67<br />
Country <strong>Report</strong>s<br />
Australia ....................................................................68<br />
Indonesia ....................................................................73<br />
Russia / Ukraine / Kazakhstan ..................................76<br />
USA ............................................................................79<br />
Colombia ....................................................................82<br />
Republic of South Africa / Mozambique ..................86<br />
Canada .......................................................................91<br />
Vietnam......................................................................93<br />
People’s Republic of China .......................................94<br />
Mongolia ..................................................................101<br />
Poland ......................................................................102<br />
Czech Republic ........................................................104<br />
Venezuela .................................................................105<br />
Overview in Tables ................................................106<br />
Glossary ..................................................................136<br />
Institutions/Links ..................................................137<br />
Members of VDKi ..................................................139<br />
Board of Directors VDKi ......................................143<br />
Disclaimer (on page 2)<br />
5
6 PROSPECTS FOR THE WORLD<br />
COAL MARKET<br />
Continuing Upward Trend as Outlook for the<br />
World Coal Trade?<br />
The forecasts for world economic developments for<br />
2011 present a heterogeneous picture. According to<br />
the <strong>Annual</strong> Assessment 2011/<strong>2012</strong> from the German<br />
Council of Economic Experts concerning general economic<br />
development, the world economy is currently in<br />
the third phase of a financial and economic crisis now<br />
in its fifth year (real estate crisis 2007 in the United<br />
States and the bankruptcy of the US investment bank<br />
Lehman Brothers in September 2008). This was a serious<br />
threat, first for the world financial system and later<br />
for the world economy. The actions taken by the national<br />
governments in the industrialised and threshold<br />
countries such as the stabilisation of the banks and the<br />
stimulus programmes for the economy led to a rapid<br />
economic recovery. But it came at a price. National<br />
debt in the industrialised countries expanded to massive<br />
proportions, in part at a level beyond what was<br />
bearable in the long term. In 2011 – and this will probably<br />
continue in <strong>2012</strong> – economic developments were<br />
dominated by a vicious circle of national debts and<br />
bank crises.<br />
The expansion of the bail-out programme, the European<br />
Financial Stability Facility (EFSF), adopted on<br />
29 September 2011 and the maximisation of the lending<br />
capacity of the EFSF secured a significant contribution<br />
to stabilisation of the European monetary<br />
union. Since government bonds have traditionally<br />
been viewed as a secure fundamental element of the financial<br />
system, the distrust in the creditworthiness of<br />
public issues which has been growing for months has<br />
led to a loss of confidence in European banks, which<br />
in turn has had a negative impact on the appraisal of<br />
the solvency of the member states. Stability has been<br />
threatened by the possibility of a systemic crisis.<br />
Neither the ambitious consolidation programmes in<br />
the problem countries nor the bail-out programmes<br />
agreed during the last 18 months have been able to stop<br />
fundamentally the downward spiral of this vicious circle.<br />
The same is true for the extensive bond purchases<br />
effected by the European Central Bank (ECB).<br />
The OECD also sees the threat of a “major recession”<br />
in the weak economy and shaky financial system. According<br />
to the Handelsblatt of 22/05/<strong>2012</strong>, on the other<br />
hand, the OECD sees indications of positive development<br />
in the German economy. The OECD Economic<br />
Outlook foresees growth of about 2% in Germany in<br />
2013.<br />
The Pacific region is once again providing the stimulus<br />
for growth dynamics, although with diminished force.<br />
All in all, worldwide growth of 3.6% is expected,<br />
weaker than in 2011. Japan will be an exception here;<br />
following the terrible effects of the nuclear disaster,<br />
the country went into recession, but growth of 2.8% is<br />
now expected for <strong>2012</strong>.
Gross Domestic Product* )<br />
2010<br />
%<br />
2011 1)<br />
%<br />
<strong>2012</strong> 2)<br />
%<br />
World 4.1 3.9 3.5<br />
USA 3.8 1.7 2.7<br />
Japan 1.7 - 0.7 2.8<br />
Euroland 1.5 1.5 - 0.2<br />
Asia (excl. Japan) 6.2 7.4 7.1<br />
China 9.0 9.2 8.6<br />
OECD 2.7 1.9 1.6<br />
Non-OECD 6.0 6.2 5.7<br />
* ) Change with respect to previous year 1) Provisional 2) Forecast<br />
HT-P1 Source: DB CIP Research of 23/03/<strong>2012</strong> OECD;<br />
Clarkson Research Services April <strong>2012</strong><br />
World trade with the most important dry bulk goods<br />
experienced an upswing similar to 2010, posting<br />
growth of 193 million tons. This was essentially<br />
thanks to the strong rise in coal and iron ore imports<br />
to China and India.<br />
Most Important Bulk Goods in Million Tons<br />
Natural<br />
Resources<br />
Steel Industry<br />
2010<br />
Mill. t<br />
2011 1)<br />
Mill. t<br />
<strong>2012</strong> 2)<br />
Mill. t<br />
Difference<br />
2010/2011<br />
%<br />
Iron Ore 992 1,052 1,092 6.0<br />
Coking Coal 236 223 229 - 5.5<br />
Scrap 110 114 117 3.6<br />
Coke 13 13 14 0<br />
Pig Iron 13 13 14 0<br />
Steel Products 261 279 291 6.9<br />
Total 1,625 1,694 1,757 4.2<br />
Steam Coal 663 721 753 8.7<br />
Grain 312 343 349 9.9<br />
Total 2,600 2,758 2,845 6.0<br />
1) Provisional 2) Forecast, own calculations<br />
HT-P2 Source: Clarkson 04/2011<br />
Moreover, the increase in world trade is above all dependent<br />
on the stability of demand in the Pacific region<br />
as a whole. The growth rate in the non-OECD region<br />
from 2010 to 2011 at more than 6% in comparison with<br />
the previous year came close to the growth rates of past<br />
years. However, growth is forecast to be more modest<br />
in <strong>2012</strong>.<br />
Capacities of the Bulk Carrier Fleet<br />
Forecast Based on Or<strong>der</strong> Books and Delivery Dates<br />
2009 2010 2011<br />
<strong>2012</strong><br />
Planned additional<br />
construction<br />
m dwt m dwt m dwt m dwt<br />
Capesize 170 210 248 52<br />
Panamax 121 136 155 37<br />
Handymax 92 109 127 21<br />
Handysize 76 82 84 12<br />
Total 459 537 614 122<br />
HT-P3 Source: Clarkson 05/<strong>2012</strong><br />
The growth in bulk goods carrier capacities in 2011<br />
of about 77 million DWT was almost as great as in<br />
2010. A substantial growth rate is also expected for<br />
<strong>2012</strong>. To this extent, there is more than adequate capacity<br />
in bulk goods carriers available, even if growth<br />
in bulk goods traffic is greater than expected in <strong>2012</strong>.<br />
In view of this fundamental data, freight rates will undoubtedly<br />
remain un<strong>der</strong> significant pressure and any<br />
upward movement would be a surprise.<br />
World Coal Market Back on the Road to Expansion?<br />
The unexpectedly good state of world coal trade<br />
in 2011 could be a good basis for further growth in<br />
<strong>2012</strong>. Both the steel industry, which continues to have<br />
well-filled or<strong>der</strong> books worldwide, and the unabated<br />
demand for steam coal in the Pacific region will presumably<br />
stabilise demand.<br />
7
8 Steam Coal Market with Good Outlook for Growth<br />
in <strong>2012</strong>?<br />
IEA Medium-Term Coal Market <strong>Report</strong> up to 2016<br />
Announced<br />
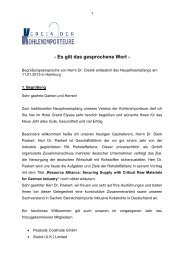
Development of Overseas Trade – Hard Coal –<br />
by Import Region by 2015 in mn MT<br />
mn MT<br />
1400<br />
1200<br />
1000<br />
800<br />
600<br />
400<br />
200<br />
0<br />
1990 2000 2011 2015<br />
Europe/North America<br />
Figure 1 Analysis of different sources<br />
Asia is still driving the forecasts for worldwide power<br />
demand upwards. Everyone is in agreement on this<br />
point. Since coal is used primarily for power genera-<br />
Demand for Coal<br />
Total<br />
Demand for Coal 2009–2016<br />
tion and this is in turn closely tied to economic growth,<br />
the IEA assumes that any change in economic growth<br />
has a direct effect on coal consumption.<br />
In the opinion of the IEA, worldwide demand for<br />
coal will rise steadily and will reach the mark of<br />
6,184 million TCE in 2016, corresponding to an increase<br />
of 18% in comparison with consumption of<br />
5,225 million TCE in 2010. However, the rate of this<br />
growth will slow down from an annual rate of 5.3%<br />
between 2005 and 2010 to a rate of 2.8% p.a. between<br />
2010 and 2016. The lion’s share of this growth will<br />
be in the non-OECD countries, whereby China alone<br />
will be the source of more than 60% of this future<br />
worldwide growth in the non-OECD countries.<br />
Growth in the OECD will stagnate at 0.2% p.a. Coal<br />
consumption in the USA will even decline, but this<br />
drop will be more than compensated by growth<br />
rates in Europe (+0.5% p.a.) and OECD Asia Pacific<br />
(+0.7% p.a.).<br />
2009 2010* <strong>2012</strong> 2014 2016<br />
Growth Rate<br />
per Year<br />
Mill. TCE Mill. TCE Mill. TCE Mill. TCE Mill. TCE %<br />
OECD 1,473 1,562 1,570 1,565 1,576 0.2<br />
America 745 787 751 752 775 - 0.3<br />
Europe 400 419 449 441 432 0.5<br />
Pacific 328 355 371 372 370 0.7<br />
Non-OECD 3,241 3,664 4,063 4,362 4,608 3.9<br />
China 2,187 2,517 2,787 2,988 3,123 3.7<br />
India 406 434 491 543 610 5.9<br />
Africa 151 152 166 170 179 2.8<br />
CIS 237 282 294 302 299 1.0<br />
Other / Asia 152 209 241 273 308 6.7<br />
Miscellaneous 107 70 84 87 88 3.8<br />
Total 4,714 5,225 5,634 5,927 6,184 2.8<br />
HT-P4 Source: IEA Medium-Term Coal Market <strong>Report</strong> 2011 * preliminary
At the end of Q1, the following has been determined<br />
for <strong>2012</strong>:<br />
Demand<br />
The demand for electrical power continues to grow on<br />
the Asian market, but no longer as rapidly as in 2011.<br />
Nevertheless: China imported 13 million tons of coal<br />
more in Q1 <strong>2012</strong> than in 2011, corresponding to average<br />
import of 10 million tons per month = 120 million<br />
tons per year.<br />
Continued urbanisation and industrialisation are still<br />
driving the Chinese and Indian demand for coal. India<br />
imported 3–4 million tons of coal more than in the<br />
same period of 2011. Japan, Korea and Taiwan also increased<br />
their imports comparatively speaking.<br />
Europe currently has large surpluses. On the other<br />
hand, declining domestic production in Germany,<br />
Spain and Poland must be replaced, so it may be<br />
possible to maintain the level of 2011. However, the<br />
mild winter and the continuing growth in the feed-in<br />
of power from renewable energy sources could put a<br />
damper on the demand for coal.<br />
Supply<br />
The Pacific suppliers – above all Indonesia – are<br />
continuing to increase their supplies. In the Atlantic<br />
region, Colombia and Russia in particular have announced<br />
increases in output while South Africa and<br />
Australia are currently stagnating. Current prices will<br />
cause Poland’s seaborne exports to remain at a very<br />
low level. Indonesia will presumably be able to gain<br />
market shares on the Atlantic market at the expense<br />
of South Africa, Poland or Australia. Indonesian coal<br />
mines have low production costs, a competitive advantage<br />
in view of current prices. Colombia and the USA<br />
could increase their exports to Europe. The penetration<br />
in the availability of the very cheap shale gas have<br />
caused an overproduction of coal in the USA especially;<br />
as a consequence, mines have started to close, and<br />
the demand for coal will decline significantly.<br />
The low world market prices have not improved the<br />
competitive position of the USA as a swing supplier.<br />
According to IHS McCloskey, DES ARA prices of<br />
US$88 for physical delivery in July <strong>2012</strong> contrasted<br />
to production costs between US$60 and US$93 for<br />
Appalachian coal. Costs of US$22 to US$33 for the<br />
transport to the East Coast must be added to this figure<br />
so that FOB American East Coast costs of between<br />
US$82 and US$126 result. If sea transport costs (Capesize)<br />
of around US$10 are assumed, this price level<br />
means that American mines are operating at a loss.<br />
However, they are almost forced to export their output<br />
because, according to the EIA, about 171 million short<br />
tons of coal are currently stocked, an increase of 17.5%<br />
in comparison with 2011. They continue to be potential<br />
exporters who will probably increase their export<br />
volumes to Europe in <strong>2012</strong> owing to the lack of sales<br />
opportunities in the States. Exports from the USA to<br />
Europe in Q1 <strong>2012</strong> rose by 1 million tons; volume from<br />
Colombia increased by 3 million tons, and even Russia<br />
exported an additional 1 million tons.<br />
Coking Coal Market – Are Signs More “Bullish”<br />
or “Bearish”?<br />
Demand<br />
Crude steel production in China in 2011 rose by 66<br />
million tons in comparison with 2010 to a total of<br />
684 million tons. Moreover, government authorities<br />
have not issued any permits for capacity expansions<br />
to Chinese mines since 2010, so any additional<br />
9
10 consumption can be covered only by increasing imports.<br />
According to data from Xinhua Infolink, 12.2<br />
million tons of coking coal were imported in Q1 <strong>2012</strong>;<br />
this would mean 48 to 50 million tons when extrapolated<br />
over the course of the entire year. There are imports<br />
of 44.66 million tons.<br />
World pig iron production in Q1 <strong>2012</strong>, extrapolated for<br />
the entire year, declined by 1.1%; in the USA, however,<br />
it rose by 1.7% and in Asia as a whole it was 0.1% higher<br />
than in 2011. The trend indicates a stabilisation and consolidation<br />
at the level of the previous year. The German<br />
Steel Fe<strong>der</strong>ation expects crude steel production in the<br />
amount of 44 million tons in Germany, almost the same<br />
production level as in 2011.<br />
Prices for coking coal have declined steadily. In Q1<br />
<strong>2012</strong>, the quarterly prices for HCC FOB Queensland<br />
ranged between US$220 and US$230 per ton in comparison<br />
with US$230 to US$240 per ton in Q4 2011.<br />
Quarterly contract agreements of US$200 to US$210<br />
per ton have been reported for Q2 <strong>2012</strong>. Should the<br />
economy in China and India, especially steel production<br />
for the construction sector, improve and be accompanied<br />
by continued restrictions on output as a consequence<br />
of weather conditions, the prices could start to<br />
rise in Q3 and Q4 <strong>2012</strong>.<br />
Supply<br />
In addition to the traditional supply sources, increased<br />
deliveries from the new projects in Mozambique, Indonesia,<br />
Mongolia and Russia could occur in <strong>2012</strong> and<br />
expand the possible range. The high price level in 2011<br />
is also likely to encourage the expansion of coking coal<br />
mine operations around the globe. New coking coal projects<br />
are being investigated in Indonesia and Colombia.<br />
Australia, the USA and Canada continue to be the ma-<br />
jor suppliers to the global market. They will presumably<br />
be able to continue the increase in production and<br />
exports in <strong>2012</strong> and the following years.<br />
Growing Trade in Off-Specification Coal and New<br />
Indices/Products<br />
The quality levels of steam coal, and in part of coking<br />
coal as well, have worsened in recent years. More<br />
and more steam coal with calorific values substantially<br />
below the benchmark of 6,000 kcal is being traded,<br />
especially on world markets. This development is being<br />
driven by market conditions, namely, the steadily<br />
growing demand in Asia from Korea, China and India,<br />
where steam coal with high ash content and low calorific<br />
values (so-called off-specification coal) is being<br />
imported and used for power production. But the calorific<br />
values and other parameters of the mined coal are<br />
declining on the Atlantic market, e.g. South Africa and<br />
Colombia, as well.<br />
This has prompted the internet-based (coal) trading<br />
platform GlobalCOAL to offer new standardised coal<br />
trading agreements (Standard Coal Trading Agreement<br />
= SCoTA) to its members and market players in a<br />
series of steps. Adapting to the growing imports of Colombian<br />
coal to Europe, the minimum calorific value<br />
of 6,000 kcal/kg was reduced to 5,750 kcal/kg and the<br />
maximum values for water and ash content for Colombian<br />
and USA coal were raised in 2011. Two new trading<br />
agreements were introduced in <strong>2012</strong>:<br />
• Steam coal trading agreement “Newcastle” for 5,500<br />
kcal/kg (NAR) and higher ash content (max. 23%) as<br />
a supplement to the previous agreements (calorific<br />
value 6,000 kcal/kg [NAR], max. ash content 14%)<br />
• Steam coal trading agreement “Richards Bay 3” for
lower calorific value (5,500 kcal/kg), water content<br />
of 14% and max. ash content of 23% as supplement<br />
to Richards Bay 1 and 2 agreements for calorific<br />
value of 6,000 kcal/kg<br />
New indices for steam coal were introduced in 2011<br />
and <strong>2012</strong>, joining the previous indices API#2, API#4<br />
and API#6:<br />
• McCloskey, 5,500 NAR FOB marker with ash content<br />
between 19% and 24% FOB port Newcastle,<br />
Australia<br />
• McCloskey Indonesian sub-bituminous FOB marker<br />
• McCloskey/Xinhua Infolink CFR China Index<br />
• API#5: Argus/McCloskey Australia 5,500 kcal/kg<br />
FOB Newcastle<br />
• API#8: Argus/McCloskeyXinhua 5,500 kcal/kg<br />
CFR South China<br />
For coking coal, the index<br />
• API#C1 was introduced in May <strong>2012</strong> for Australian<br />
coking coal (prime hard coking coal) exported<br />
on the spot market from various ports on Australia’s<br />
east coast.<br />
The methodologies used in calculating the various<br />
indices can be viewed and downloaded on the<br />
websites of the international price-reporting companies<br />
(www.argusmedia.com/methodology;<br />
www.mccloskey.com).<br />
Introduction of First Coking Coal Index<br />
The transition from annual contracts to a short-term<br />
pricing mechanism initiated by BHP Billiton paved<br />
the way for development of an index for coking coal.<br />
This development could be the first step towards the<br />
creation of a liquid market and the appearance of a<br />
<strong>der</strong>ivative market. Extensive consultations un<strong>der</strong> the<br />
auspices of the American consulting company Doyle<br />
Trading Consultants LLC preceded the launch of the<br />
following three coking coal indices:<br />
• The Coking Coal Queensland Index (CCQ) representing<br />
the short-term physical spot market price<br />
FOB port Queensland for premium coking coal<br />
(HCC).<br />
• The Coking Coal Hampton Roads Index, Low Vol.<br />
(CCH-LOW), representing the short-term spot market<br />
price FOB port Hampton Roads, Virginia, USA,<br />
for low-volatile premium coking coal.<br />
• The Coking Coal Hampton Roads Index, High Vol.<br />
(CCH-HIGH), representing the short-term spot market<br />
price FOB port Hampton Roads, Virginia, USA,<br />
for high-volatile premium coking coal.<br />
GENERAL GLOBAL ECO-<br />
NOMIC CONDITIONS<br />
In 2011, economic development following the earthquake<br />
and nuclear disaster in Japan, the progress<br />
during the climate policy discussions in Durban, the<br />
economic development of China and the USA and<br />
the measures to solve the debt crisis, especially in the<br />
11
12 Southern European euro countries, were of special interest<br />
for the energy and coal industry worldwide.<br />
World Production and World Trade on a Stable<br />
Course<br />
According to estimates from the OECD, the countries<br />
of the OECD region in particular did not record the<br />
above-average increase rates of 2010. However, in<br />
2011 industrial production rose by 2.4% and gross<br />
domestic product of the OECD countries as a whole<br />
increased by about 1.9%. Rise in the world’s gross national<br />
product is estimated at 3.9%.<br />
A slight decline worldwide is expected for <strong>2012</strong>. The<br />
problems of national debt and in the financial and real<br />
estate sectors have not been remedied by any means,<br />
while unemployment and national debt are on the rise,<br />
above all in the OECD zone. Only robust development<br />
of the threshold countries in Asia and in parts of<br />
South America could have a positive effect. A contrary<br />
impact is felt from the political unrest in the MENA<br />
countries Syria and Bahrain and from the escalation of<br />
the conflicts related to Iran’s nuclear programme; the<br />
latter once again led to a high oil price at the beginning<br />
of <strong>2012</strong>, which could have a depressive effect on<br />
the economy.<br />
World Production<br />
(Industry)<br />
Growth Rates in % of the World Economy<br />
2008 2009 2010 2011 1) 1) 2) <strong>2012</strong><br />
3.0 - 1.1 3.0 13 2.4<br />
GDP 2.9 - 0.5 5.0 3.9 3.5<br />
1) Estimated<br />
2) Figures for <strong>2012</strong> available only partly – for OECD only<br />
HT-W1 Source: Clarkson Research Service 4/<strong>2012</strong><br />
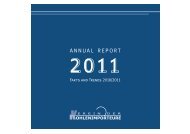
World Population Increasing to 8.1 Billion in 2025<br />
and 9.6 Billion in 2050<br />
The greatest driving force for the expanding world<br />
economy and the global consumption of energy leading<br />
to the rise in CO 2 emissions continues to be the<br />
increasing size of the world’s population. It is growing<br />
above all in the non-OECD countries. On the average,<br />
the world population is increasing by 1% or 70–80 million<br />
people annually. Nor is this growth being slowed<br />
by the economic crisis because it is taking place in the<br />
poorest countries of the world. An average growth rate<br />
of 0.2% is expected in Europe for the period 2010–<br />
2015. As of the turn of the year 2011/<strong>2012</strong>, world population<br />
was 7 billion.<br />
Bn. 10<br />
8<br />
6<br />
4<br />
2<br />
0<br />
Development of World Population<br />
4.5<br />
5.3<br />
7.0<br />
8.1<br />
9.6<br />
72% 76% 82% 84% 86%<br />
28% 24% 18% 16% 14%<br />
1980 1990 2011 2025 2050<br />
Industrial countries Developing countries<br />
Figure 2 Source: German Foundation for World Population<br />
The population in the non-OECD countries alone will<br />
increase by almost 1.7 billion to 7.2 billion people in<br />
the period from 2008 to 2035, i.e. over the span of only<br />
27 years. But energy consumption is growing even<br />
faster than the world population because specific per<br />
capita consumption is increasing as well as the population.<br />
In addition to the increased use of devices which
consume energy, the steady shift from rural to urban<br />
populations around the world is causing a further rise<br />
in energy consumption.<br />
Threshold and developing countries must close an<br />
enormous gap in energy consumption if their standard<br />
of living is to be raised even approximately to that of<br />
the industrialised countries. The IEA estimates that<br />
1.4 billion people – 20% of the world population – do<br />
not have access to electricity and 2.7 billion people –<br />
about 40% of the world population – still use traditional<br />
biomass (wood) for cooking and coal briquettes<br />
for heating.<br />
These figures make it clear why threshold and developing<br />
countries are currently unable to join the European<br />
industrialised countries in realising the latter’s ideas<br />
for saving energy and reducing greenhouse gas emissions.<br />
Satisfying the basic needs of their citizens for<br />
food, water, mobility and access to electric power for<br />
the improvement of living standards even to a modest<br />
level remains their top priority.<br />
Energy Consumption Declines Slightly –<br />
Coal Consumption Falls<br />
Primary Energy Consumption – Most Important Energy Sources –<br />
2000<br />
Billion TCE<br />
2009<br />
Billion TCE<br />
Initial estimations indicate that worldwide energy consumption<br />
in 2011 (16.3 billion TCE) remained slightly<br />
below the level of 2010 (16.9 billion TCE). This development<br />
is a consequence of the global economic stagnation<br />
which has impacted the OECD region above all.<br />
The Pacific region continues to be an area of economic<br />
growth. Less oil was consumed worldwide. The EU<br />
27 countries, the CIS countries and the USA as well<br />
reduced slightly their consumption of primary energy.<br />
Oil consumption is estimated to have fallen by 3.5%,<br />
natural gas consumption by 0.4%. Hard coal consumption,<br />
in contrast, grew by 2.1% globally in 2011. The<br />
greatest growth of more than 215 million TCE was<br />
posted by nuclear energy, undoubtedly a consequence<br />
of the expansion of the nuclear energy programme in<br />
China.<br />
Coal (hard coal and lignite) reached a world market<br />
share (excluding renewable energies) of just un<strong>der</strong><br />
32% in 2011 and has continued to be the fastest-growing<br />
primary energy source for several years.<br />
2010<br />
Billion TCE<br />
2011<br />
Billion TCE<br />
2010/2011<br />
Change in %<br />
Coal 3.120 4.900 5.080 5.180 2.1<br />
Natural Gas 3.180 3.700 4.083 4.070 - 0.4<br />
Petroleum 5.110 5.400 5.754 5.550 - 3.5<br />
Nuclear Energy 0.840 0.900 0.900 1.110 23.0<br />
Hydroelectric Power 0.882 1.000 1.100 0.370 - 34.0<br />
Total 13.132 15.900 16.917 16.280 - 2.7<br />
HT-W2 Source: BP, own estimate for 2011<br />
13
14 World Energy Outlook 2011 – Forecast of<br />
Worldwide Development to 2035<br />
The 2011 issue of the World Energy Outlook (WEO)<br />
from the International Energy Agency summarises<br />
the latest data and political developments of the past<br />
year; well-founded analyses and conclusions regarding<br />
the global energy markets today and projections up<br />
to 2035 are <strong>der</strong>ived from this information. The WEO<br />
also contains a number of scenarios showing the latest<br />
projections for energy demand and supply.<br />
The IEA focuses in particular on subjects currently<br />
significant for the energy economy, e.g.:<br />
• The significance of coal as an engine driving economic<br />
growth in a world in which emissions (should<br />
or must) be limited;<br />
• The possible consequences of delays in investments<br />
in the gas and oil business in the Middle East and in<br />
North Africa;<br />
• How the so-called ”lock-in effect“ of the current<br />
supply sources with high CO 2 could make realisation<br />
of the climate goal of 2° C more expensive and more<br />
difficult;<br />
• Scope and nature of the investments required to provide<br />
access to mo<strong>der</strong>n energy services previously<br />
unavailable to the billions of people living in poverty.<br />
The World Energy Outlook examines the threats<br />
and opportunities for the worldwide energy system<br />
on the basis of a strict, quantitative analysis of energy<br />
and climate trends. This analysis encompasses<br />
three global scenarios and a number of case studies.<br />
The primary scenario of this Outlook is the “Scenario<br />
of the New Energy Policy Framework” (NPS) in<br />
which it is assumed that the political commitments<br />
recently pledged by governments will be carefully<br />
implemented, even though there are not any concrete<br />
measures for their support at this time. The comparison<br />
with the results of the “Scenario of the Current<br />
Energy Policy Framework” in which it is assumed that<br />
no further political actions will be taken beyond the<br />
status of the middle of 2011 clearly shows the value of<br />
these commitments and plans. The comparison with<br />
the “450 Scenario” is also informative; starting from<br />
the international goal to limit the long-term rise in<br />
mean global temperature in comparison with the preindustrial<br />
level to 2° C, it calculates a reverse path for<br />
achieving this goal. The great difference in the results<br />
of these three scenarios clearly illustrates the decisive<br />
role which will fall to governments for the definition<br />
of the goals and the implementation of the political actions<br />
required to provide for our future energy needs.<br />
World Energy Consumption Will Rise by<br />
One-Third by 2035<br />
Despite the uncertain outlook regarding short-term<br />
economic growth, there is a major increase in energy<br />
consumption of one-third between 2010 and 2035 in<br />
the NPS. Assuming growth of 1.7 billion in the world<br />
population and average annual economic growth<br />
of 3.5%, the demand for energy services and mobillity<br />
will continue to increase. Even if the short-time<br />
growth in global GDP is lower than assumed in the<br />
WEO 2011, this will have no more than slight impact<br />
on the long-term trends.<br />
The dynamics of the energy markets are being determined<br />
more and more by countries outside of<br />
the OECD. In the period from 2010 to 2035, 90% of<br />
population growth, 70% of the increase in economic
performance and 90% of the growth in energy consumption<br />
will take place in non-OECD countries.<br />
China is cementing its position as the world’s largest<br />
energy consumer. In 2035, it will consume almost 70%<br />
more energy than the USA, the second-largest energy<br />
consumer, whereby the per capita energy consumption<br />
in China will still be less than half that of the USA.<br />
Energy consumption in India, Indonesia, Brazil and<br />
the Middle East will increase even more rapidly than<br />
in China.<br />
Investments of $38 trillion (in 2010 dollars) will<br />
have to be made worldwide in the energy supply infrastructure<br />
in the time from 2011 to 2035. Almost<br />
two-thirds of the total investments will go to countries<br />
outside of the OECD. Almost $20 trillion will be required<br />
for the oil and gas sector together because the<br />
need for investment in the upstream sector and the related<br />
costs will increase in the middle to long term.<br />
The greater part of the remaining investments needs<br />
will be for the electric industry and more than 40%<br />
of these funds will be required for transmission and<br />
distribution grids.<br />
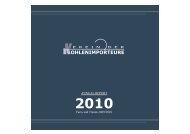
World Energy Consumption 2010 – 2035<br />
- most important energy sources<br />
Projection<br />
18<br />
14<br />
10<br />
6<br />
2<br />
IEA 2011, NPS/New Policies Scenario<br />
Other Renewables<br />
Biomass<br />
Hydro Nuclear<br />
Energy<br />
Natural Gas<br />
Coal<br />
1980 1990 2000 2010 2020 2030 2035<br />
Figure 3 Source: German Mineral Resources Agency<br />
Oil<br />
Demand for Fossil Fuels Rising<br />
The age of fossil fuels is far from being over, but<br />
their dominant position has been weakened. The<br />
demand for all fossil fuels is rising, although the share<br />
of fossil fuels in worldwide primary energy consumption<br />
will fall slightly from 81% in 2010 to 75% in 2035.<br />
Natural gas is the only fossil fuel for which the share<br />
in the world energy mix will increase in the time until<br />
2035. In the electric power industry, half of the new<br />
power plant capacities installed to cover growing demand<br />
will be based on renewable energy technologies,<br />
above all hydroelectric and wind power.<br />
Opportunities for Realisation of the 2° C Goal<br />
Becoming More Restricted<br />
In the opinion of the IEA, we cannot afford to wait<br />
any longer to initiate additional measures combating<br />
climate change if the long-term goal of limiting the<br />
rise in mean global temperature to 2° C on which the<br />
450 Scenario is based is to be achieved at reasonable<br />
cost. The NPS corresponds to a development of CO 2<br />
emissions which will presumably lead to a long-term<br />
increase in mean temperature of more than 3.5° C.<br />
Four-fifths of the total CO 2 emissions permitted for<br />
energy generation un<strong>der</strong> the so-called 450 ppm Plants<br />
Scenario until 2035 are already set, coming as they<br />
will from power plants, buildings, factories etc. already<br />
in operation. If no significant new actions are<br />
taken by 2017, the IEA believes that the infrastructure<br />
generating or consuming energy which will have been<br />
created by then will already be sufficient to produce<br />
the total quantity of CO 2 emissions permitted un<strong>der</strong><br />
the 450 ppm Scenario until 2035 and there would be<br />
15
16 no more free capacities for additional power plants,<br />
factories or other infrastructures unless they were<br />
completely free of CO 2 . Waiting any longer to un<strong>der</strong>take<br />
the required measures would be the equivalent of<br />
“penny wise, pound foolish”; for every dollar which<br />
is not invested in the electric power industry by 2020,<br />
an additional 4.3 dollars will have to be invested after<br />
2020 to balance out the higher emissions which will<br />
result.<br />
Coal the Number One Energy Source for Electricity<br />
Generation<br />
During the past decade, almost half of the increase<br />
in worldwide energy demand was covered by coal.<br />
Within the current energy policy framework, the use<br />
of coal would increase by another 65% by 2035, which<br />
would mean that coal would replace oil as the most<br />
important energy source in the worldwide energy mix.<br />
According to the scenario of the new energy policy<br />
framework, global coal consumption will continue to<br />
rise over the next ten years, but will ultimately stabilise<br />
at a level 25% above that of 2009. If the 450 ppm Scenario<br />
is to be realised, coal consumption must reach<br />
its high point significantly earlier than 2020 and then<br />
decline. The range in the variation of the projection results<br />
for coal consumption in 2035 is almost as great as<br />
total worldwide coal consumption in 2009. The effects<br />
of decisions in energy policies and technology for the<br />
global climate are consequently enormous.<br />
China’s coal consumption comprises almost half<br />
of worldwide demand, and the five-year plan for<br />
2011–2015, which is supposed to reduce the energy<br />
and CO 2 intensity of the Chinese economy, will have<br />
a decisive impact on the world coal markets. China’s<br />
new role as net importer since 2009 has led to rising<br />
prices and to new investments in the exporting countries,<br />
including Australia, Indonesia, Russia and Mongolia.<br />
In the NPS, the focus of coal trade will shift further<br />
from the Atlantic to the Pacific region. However,<br />
there is tremendous uncertainty concerning the scope<br />
and direction of the international trade flows, above<br />
all after 2020. A relatively minor change in domestic<br />
demand or the domestic supply in China could cause<br />
the country to become once again a net exporter which<br />
would compete with the countries which are today investing<br />
in the supply capacities so that they can supply<br />
the Chinese market. India’s coal consumption, for instance,<br />
doubles in the NPS; India would move past the<br />
USA as the world’s second-largest coal consumer and<br />
become the largest coal importer in the 2020s.<br />
The long-term outlook for the coal industry could<br />
be substantially improved by forcing expansion of<br />
more efficient coal-fired power plant technologies<br />
and the technologies for separation and storage of<br />
CO 2 (CCS). But there are major obstacles hin<strong>der</strong>ing<br />
this expansion. If the average degree of efficiency<br />
for all coal-fired power plants in 2035 were 5% higher<br />
than that assumed in the Scenario of the New Policy<br />
Framework, such an acceleration in the discontinuation<br />
of the use of the least efficient combustion technologies<br />
would lower CO 2 emissions in the electric<br />
power sector by 8% and reduce the local air pollution.<br />
While the selection of more efficient technologies for<br />
the construction of new coal-fired power plants would<br />
incur only slight additional costs, increasing the degree<br />
of efficiency of existing power plants would involve<br />
significantly higher expenditures. CCS technologies<br />
play a role in the NPS towards the end of the time<br />
period of the projection. But these technologies play<br />
a decisive role for the reduction of emissions in the
World Coal Demand According to Region Until 2035 Based on the “New Policies Scenario” – IEA<br />
450 ppm Scenario in that almost one-fifth of the additional<br />
emission reductions required would be realised<br />
through their application. If CCS technologies are not<br />
implemented on a broad scale in the 2020s, the other<br />
technologies featuring low CO 2 would have to reduce<br />
emissions to a level which would be in conformity<br />
with the world climate targets, and this would be an<br />
extraordinarily difficult task.<br />
Energy for All Does Not Cost the World<br />
According to estimates by the IEA, there were<br />
1980 2009 2015 2020 2025 2030 2035 2009-2035 1)<br />
Mill. t<br />
TCE<br />
Mill. t<br />
TCE<br />
Mill. t<br />
TCE<br />
OECD 1,385 1,403 1,462 1,421 1,358 1,281 1,197 - 0.6<br />
America 673 810 856 833 799 750 697 - 0.6<br />
USA 640 757 794 769 740 699 652 - 0.6<br />
Europe 609 249 218 192 169 146 118 - 2.8<br />
Asia Oceania 103 343 388 396 390 386 382 0.4<br />
Japan 74 338 382 391 384 381 377 0.4<br />
Non-OECD 1,195 3,525 4,172 4,412 4,505 4,575 4,662 1.1<br />
Eastern Europe/Eur asia 517 276 310 304 303 301 299 0.3<br />
Russia n/a 136 164 166 171 169 168 0.8<br />
Asia 573 2,775 3,548 3,812 3,921 4,037 4,184 1.6<br />
China 446 2,179 2,749 2,863 2,839 2,823 2,820 1.0<br />
India 75 399 519 619 701 778 883 3.1<br />
Indonesia 0 44 67 87 107 127 146 4.8<br />
Middle East 2 2 2 3 3 3 3 1.9<br />
Africa 74 151 170 179 184 185 180 0.7<br />
South Africa 68 141 152 158 161 162 160 0.5<br />
Latin America 14 26 37 41 46 49 46 2.3<br />
Brazil 8 16 24 23 23 21 20 1.0<br />
World 2,560 4,705 5,634 5,833 5,863 5,856 5,859 0.8<br />
European Union n/a 381 371 326 282 233 200 - 2.5<br />
1) Average annual growth rate<br />
HT-W3 Source: IEA, WEO 2011<br />
Mill. t<br />
TCE<br />
Mill. t<br />
TCE<br />
Mill. t<br />
TCE<br />
Mill. t<br />
TCE<br />
worldwide investments in 2009 of about $9 billion<br />
to provide people with first-time access to mo<strong>der</strong>n<br />
energy services, but it will be necessary to invest<br />
more than five times as much every year – $48 billion<br />
– if everyone in the world is to have access to energy<br />
in 2030. The UN Secretary-General has declared<br />
the realisation of energy access for everyone by 2030<br />
to be a key objective. At this time, 1.3 billion people<br />
do not have electric power, and 2.7 billion people are<br />
still dependent on traditional forms of biomass use for<br />
cooking. The investments needed in this area amount<br />
to about 3% of the total investment requirements in<br />
%<br />
17
18<br />
the energy sector up to 2030. If the investments are<br />
not increased appropriately, the situation in 2030 will<br />
probably not be significantly different from that today<br />
and could even worsen in sub-Sahara Africa. Some of<br />
the political measures intended to help the poorest segments<br />
of the population which are now in place are<br />
shooting wide of the mark. Only 8% of the subsidies<br />
for the consumption of fossil fuels reached the poorest<br />
20% of the population in 2010.<br />
The issue of energy access is attracting increasingly<br />
great international attention. The United Nations has<br />
declared <strong>2012</strong> the “International Year of Sustainable<br />
Energy for All”, and the world summit Rio+20 offers<br />
an important opportunity to take action. More funds<br />
from many different sources and in various forms are<br />
required to assure access to mo<strong>der</strong>n energy services<br />
for everyone, employing solutions appropriate to the<br />
special challenges, risks and opportunities for financial<br />
returns of the various projects.<br />
For the first time, the IEA has taken into account energy<br />
policy commitments and plans for the limitation<br />
of greenhouse gas emissions and improvement of the<br />
security of energy supply in its outlook for supply and<br />
demand in the WEO.<br />
World Energy Consumption 2011<br />
-most important energy sources-<br />
Gas<br />
25%<br />
Nuclear Energy 7%<br />
Oil<br />
34%<br />
Figure 4 Source: Own calculations<br />
Hydro 2%<br />
Coal<br />
32%<br />
Total: 16.3 bn TCE<br />
Hard Coal Production Rises to Almost 7 Billion<br />
Tons (6 Billion Tons TCE)<br />
World hard coal production continued to rise in 2011<br />
and grew by about 240 million tons to approximately<br />
6.96 billion tons. Total production breaks down into<br />
about 6.050 billion tons of steam coal and about 0.9<br />
billion tons of coking coal.<br />
Global Hard Coal Production<br />
mn MT<br />
8,000<br />
7,000<br />
6,720<br />
6,960<br />
6,000<br />
5,000<br />
900<br />
910<br />
4,000<br />
3,500 3,600<br />
3,000<br />
2,000<br />
2,800<br />
500<br />
570 480<br />
1,000<br />
2,300 2,930 3,120 5,820 6,050<br />
0<br />
1980 1990 2000 2010 2011<br />
Steam coal Coking coal<br />
Figure 5 Source: IEA, 2011 preliminary, own estimation<br />
Since 1990, i.e. in the last 21 years, world hard coal<br />
production has doubled from 3.5 billion tons to 7 billion<br />
tons. The major force behind this development is<br />
to be found in China, where production in 2011 alone<br />
was increased by 0.24 billion tons.<br />
But other countries have also increased production<br />
significantly. The bulk of the worldwide growth in<br />
production clearly comes from Asia, as the developments<br />
of recent years show:
Hard Coal Production of Important Countries<br />
in the Pacific Region in Million t<br />
Producing countries 2009 2010 2011<br />
China 2,910 3,410 3,650<br />
India 532 537 554<br />
Australia 344 355 348<br />
Indonesia 280 295 318<br />
Vietnam 43 50 49<br />
Total 4,109 4,647 4,919<br />
HT-W4 Source: IEA, 2011 provisional<br />
The decline in hard coal production from Australia is a<br />
consequence of the torrential rainfall and the flooding<br />
in Queensland.<br />
Besides the countries shown above, substantial quantities<br />
of coal are being mined in the Asian region,<br />
namely in Mongolia. Outside of the Asian boom zone,<br />
developments in hard coal output varied.<br />
The table below shows the trend expected by the IEA<br />
in millions of TCE of coal output. A comparison of<br />
IEA projections and reality from the past reveal that<br />
forecasts for the growth of coal production have always<br />
been too low.<br />
World Coal Production/Output According to Region Until 2035<br />
Based on the “New Policies Scenario” – IEA<br />
1980 2009 2015 2020 2025 2030 2035 2009-2035 1)<br />
Mill. t<br />
TCE<br />
Mill. t<br />
TCE<br />
Mill. t<br />
TCE<br />
OECD 1,385 1,403 1,462 1,421 1,358 1,281 1,197 - 0.6<br />
America 673 810 856 833 799 750 697 - 0.6<br />
USA 640 757 794 769 740 699 652 - 0.6<br />
Europe 609 249 218 192 169 146 118 - 2.8<br />
Asia Oceania 103 343 388 396 390 386 382 0.4<br />
Australia 74 338 382 391 384 381 377 0.4<br />
Non-OECD 1,195 3,525 4,172 4,412 4,505 4,575 4,662 1.1<br />
Eastern Erope/Eurasia 519 364 407 408 406 393 382 0.2<br />
Russia n/a 219 258 262 267 257 248 0.5<br />
Asia 568 2,873 3,423 3,634 3,725 3,805 3,903 1.2<br />
China 444 2,197 2,563 2,675 2,691 2,710 2,739 0.9<br />
India 77 349 399 441 488 537 589 2.0<br />
Indonesia 0 238 338 380 406 415 429 2.3<br />
Middle East 1 1 1 1 1 1 1 0.8<br />
Africa 100 207 238 254 251 255 256 0.8<br />
South Africa 95 202 218 224 216 216 214 0.2<br />
Latin America 8 80 103 115 122 121 120 1.6<br />
Colombia 4 68 90 101 109 107 107 1.8<br />
World 2,579 4,928 5,634 5,833 5,863 5,856 5,859 0.7<br />
European Union n/a 238 201 171 142 117 89 - 3.7<br />
HT-W5 Source: IEA, WEO 2011 1) Average values of annual growth rate<br />
Mill. t<br />
TCE<br />
Mill. t<br />
TCE<br />
Mill. t<br />
TCE<br />
Mill. t<br />
TCE<br />
%<br />
19
20 The 10 Largest Coal Producers in the World<br />
Company<br />
2009<br />
Mill. t<br />
2010<br />
Mill. t<br />
2011*<br />
Mill. t<br />
Coal India 431 431 436<br />
Peabody 1) 244 246 268<br />
Shenhua 210 225 282<br />
Arch 1) 125 163 157<br />
China Coal 125 123 160<br />
BHPB 104 103 104<br />
Anglo 95 107 103<br />
SUEK 91 90 92<br />
Xstrata 85 80 85<br />
Rio Tinto 132 91 49<br />
1) Own production and purchases<br />
HT-W6 Source: The McCloskey Group 2011, own projections,*<br />
<strong>Annual</strong> <strong>Report</strong>s<br />
Reserves and Output of Hard Coal<br />
According to Region<br />
Reserves As of<br />
End 2010<br />
Output 2010<br />
Region Billion t % Mill. t %<br />
Europe 18 2.5 139 2.2<br />
CIS 123 17.0 429 6.8<br />
Africa 30 4.1 259 4.1<br />
North America 232 31.9 987 15.6<br />
South America 9 1.2 78 1.2<br />
PR China 181 24.9 3,115 49.1<br />
India 75 10.3 538 8.5<br />
Indonesia / Vietnam 12 1.7 372 5.9<br />
Australia / New Zealand 45 6.2 360 5.7<br />
Miscellaneous 3 0.2 64 1.0<br />
Total 728 100 6,341 100<br />
HT-W7 Source: German Fe<strong>der</strong>al Institute for Geosciences and<br />
Natural Resources, brief study “Reserves, Resources and<br />
Availability of Natural Energy Resources 2011”<br />
Coal reserves currently have a statistical reach of<br />
about 115 years based on an output of about 6.3 billion<br />
tons (base 2010). Hard coal represents a share<br />
of about 46% of the total reserves of approximately<br />
1,342 billion TCE in fossil energy sources and nuclear<br />
fuel; in terms of the resources of 19,416 billion<br />
TCE, the volume of 14,551 billion TCE means its<br />
share reaches 75%.<br />
Hard Coal World Market Rises, Seaborne Trade<br />
Grows<br />
The world market for hard coal grew by a total of 238<br />
million tons (3.4%) in 2011. The strong rise in 2010 as<br />
a result of the recovery from the world economic crisis<br />
no longer had any effect.<br />
World trade in coal developed as shown below:<br />
World Coal Trade<br />
2009 2010 2011<br />
Change<br />
2010/2011<br />
Mill. t Mill. t Mill. t Mill. t %<br />
Seaborne Trade 859 963 978 + 15 + 1.5<br />
Cross-Bor<strong>der</strong> Trade 57 90 64 - 26 - 36.7<br />
Total 916 1,053 1,042 - 11 - 1.7<br />
HT-W8<br />
The world market for hard coal was once again a stable<br />
pillar in 2011. There was a decline of 11 million tons in<br />
coking coal exports for seaborne trade because of the<br />
flooding in Queensland. The steam coal market, on the<br />
other hand, grew slightly; cross-bor<strong>der</strong> trade dropped<br />
strongly by 33 million tons and reached only 57 million<br />
tons.<br />
The following development was observed in the segments<br />
steam coal and coking coal for seaborne trade:
Seaborne World Trade in Coal<br />
2009 2010 2011 Change 2010/2011<br />
Mill. t Mill. t Mill. t Mill. t %<br />
Steam Coal 658 713 739 + 26 + 3.7<br />
Coking Coal 201 250 239 - 11 - 5.4<br />
Total 859 963 978 + 15 + 1.6<br />
HT-W9<br />
The share of the world trade in the production has risen<br />
slightly since 2000. However, most of the coal output<br />
is consumed in the country where it is produced.<br />
Hard Coal<br />
World Output<br />
World Trade<br />
World Output / Seaborne World Trade<br />
Share of World Trade in<br />
Production<br />
HT-W10<br />
2010<br />
Mill. t<br />
6,720<br />
963<br />
2011<br />
Mill. t<br />
6,958<br />
978<br />
14.3% 14.1%<br />
Growth<br />
Mill. t<br />
+ 238<br />
+ 15<br />
The seaborne trade volume breaks down into a coking<br />
coal market and a steam coal market. The steam<br />
coal market in turn comprises Pacific and Atlantic<br />
partial markets, which are characterised by differing<br />
supplier structures. The exchange volume between the<br />
partial markets in 2011 came to about 10% (about 73<br />
million tons) of the steam coal market. About 16% of<br />
the global steam coal production was transported to<br />
the consumers via seaborne trade. The coking coal<br />
market, in contrast, is a uniform world market due to<br />
the low number of supplier countries on the one hand<br />
and, on the other hand, the worldwide distribution of<br />
demand. About 26% of worldwide production in 2011,<br />
a significantly greater share than for steam coal, went<br />
to overseas trade.<br />
Differences in development were observed on the partial<br />
markets of coal world trade. The following comments<br />
refer only to the seaborne hard coal trade.<br />
Main Trade Flows in Seaborne Hard Coal-Trade, 2011 (in mn MT)<br />
Seaborne trade: 978 mn Mt Incl. 739 mn Mt steam coal<br />
239 mn Mt coking coal<br />
Figure 6 Source: VDKI, Hamburg <strong>2012</strong><br />
Global hard coal production: 6.9 mn Bnt<br />
21
22 The largest import countries are all found in the Southeast<br />
Asia region. China became the largest importer<br />
in 2011 (183 million tons), overtaking Japan, which<br />
was previously the largest importer (175 million tons).<br />
They are followed by South Korea and India. The largest<br />
coal importers in Europe are Germany, Great Britain<br />
and Italy.<br />
The 10 Largest Hard Coal Import Countries 1<br />
2009<br />
Mill. t<br />
2010<br />
Mill. t<br />
2011<br />
Mill. t<br />
China 127 166 183<br />
Japan 162 184 175<br />
South Korea 103 111 129<br />
India 59 86 114<br />
Taiwan 59 64 67<br />
Germany 40 40 44<br />
Great Britain 37 26 32<br />
Italy 20 22 24<br />
Spain 25 13 16<br />
USA 21 15 11<br />
Total 653 727 795<br />
Share of World Trade 76% 75% 81%<br />
EU 27 189 182 198<br />
Share of World Trade 21% 19% 20%<br />
1) Some figures provisional, seaborne quantities<br />
HT-W11<br />
Growth on Steam Coal Market Still Restrained<br />
Atlantic Region<br />
The Atlantic region includes the eastern seaboards of<br />
North, Central and South America, Europe, including<br />
the countries bor<strong>der</strong>ing the Mediterranean, and the<br />
northern and western coasts of Africa.<br />
Following the recovery from the world economic crisis,<br />
the demand for coal in the Atlantic region began<br />
to rise again. Demand in 2011 increased by 46 million<br />
tons (27%) to 218 million tons. In contrast, demand on<br />
the Pacific market declined by 20 million tons (3.7%).<br />
Colombia was able to export very little to China. The<br />
Atlantic market has a market share of just un<strong>der</strong> 30%<br />
of the total market.<br />
Pacific Region<br />
The Pacific region did not grow any further, and the<br />
demand on the world market for coal for the generation<br />
of electric power fell slightly by 20 million tons to<br />
521 million tons. Nevertheless, almost all of the Asian<br />
economies increased their procurements. The market<br />
can be expected to remain at this level or continue to<br />
grow strongly over the next few years, driven above<br />
all by demand from China and India. The year 2011 in<br />
the Pacific region was marked in particular by the continuing<br />
increase in steam coal imports to China and<br />
India. Australia was able to increase its exports (+2<br />
million tons) of steam coal, which was less affected by<br />
the adverse weather conditions. Indonesia, on the other<br />
hand, is stagnating and has even declined slightly.<br />
Russia was also able to cover China’s additional needs<br />
thanks to its Far East ports. Without this “special upswing”<br />
from China, the price level on the steam coal<br />
market would possibly have decreased much more<br />
sharply. The Pacific market has a market share of 70%.
Indonesia 11<br />
Venezuela 4<br />
Poland/Other 14<br />
Russia 61<br />
Australia 7<br />
USA 22<br />
Figure 7 Sources: different sources, several analysis, own estimations<br />
Overseas Trade Steam Coal 2011 in mn MT<br />
Structure of Supply<br />
South Africa 23<br />
Colombia 76<br />
Russia 32<br />
Indonesia 259<br />
Vietnam 17<br />
Other 19<br />
Atlantic 2011: 218 mn MT Pacific 2011: 521 mn MT<br />
Exchange Volume Between Pacific and Atlantic<br />
Markets<br />
Indonesia and Australia in particular supplied about<br />
19 million tons to the Atlantic market in 2011, a share<br />
of about 9.5% of the supplies to this region. Of the<br />
Australia 141<br />
South Africa 43<br />
China 10<br />
Atlantic suppliers, South Africa, Canada and the USA<br />
supplied about 54 million tons, 10 million tons less<br />
than in 2010, corresponding to 10% of demand, to the<br />
Pacific market. Total exchange volume came to 73 million<br />
tons (previous year 79 million tons).<br />
Steam Coal Market: Quantities Exchange Between Atlantic and Pacific Market<br />
Atlantic Market: 218 mn MT Pacific Market : 521 mn MT<br />
Demand 218 mn MT<br />
EU-25<br />
East-Europe<br />
Mediterranean area<br />
North-, Central- and<br />
South America<br />
199 mn MT<br />
19 mn MT<br />
Figure 8 Source: VDKi, Hamburg<br />
Supply 253 mn MT<br />
Colombia<br />
South Africa<br />
Russia<br />
Poland<br />
Venezuela<br />
USA<br />
etc.<br />
Market Structure<br />
Supply 486 mn MT<br />
Australia<br />
Indonesia<br />
China<br />
Russia<br />
Vietnam<br />
South Africa<br />
467 mn MT<br />
54 mn MT<br />
Demand 521 mn MT<br />
Japan<br />
South Korea<br />
Taiwan<br />
India<br />
China<br />
etc.<br />
23
24 South Africa in particular sold deliveries to India<br />
above all, but other countries were also customers. Indonesian<br />
exports to the Atlantic region, on the other<br />
hand, declined further.<br />
Steam Coal Prices Remain at High Level – Pacific<br />
Market Sets the Price<br />
Prices<br />
While in the Atlantic region the need for steam coal<br />
from the world market, above all in Europe, continued<br />
to grow, the Pacific steam coal market did not exhibit<br />
any growth. The bottom line of this development was<br />
that prices remained stable during the early months of<br />
2011. During the second half of the year, the effects of<br />
a slight stagnation of the economy were felt in Asia as<br />
well, especially in China, immediately putting pressure<br />
on coal prices.<br />
But there were also substantial differences in the FOB<br />
prices of the Atlantic and Pacific suppliers.<br />
Development of FOB Prices in US$/t of Important<br />
Supplier Countries<br />
01/01/2011 31/12/2011 01/04/<strong>2012</strong><br />
Atlantic Suppliers:<br />
Richards Bay<br />
Bolivar<br />
Poland<br />
Russia (Baltic)<br />
Pacific Suppliers:<br />
Newcastle<br />
Quinhuangdao<br />
Kalimantan<br />
Russia<br />
129<br />
110<br />
110<br />
120<br />
132<br />
131<br />
117<br />
113<br />
HT-W12 Source: Own evaluation<br />
107<br />
93<br />
97<br />
101<br />
113<br />
149<br />
98<br />
108<br />
There was a range at the beginning of April <strong>2012</strong><br />
from US$77/ton to US$148/ton.<br />
104<br />
77<br />
82<br />
90<br />
106<br />
148<br />
96<br />
103<br />
Whereas the Atlantic suppliers Colombia, USA, Russia<br />
(Baltic) and Poland had to offer lower prices to sell<br />
their tonnage, the Far East suppliers, above all Australia<br />
and Russia (Pacific), were able to charge significantly<br />
higher prices, a consequence of the continuing<br />
high demand from China and India.<br />
Since South Africa was able to find customers in India<br />
and the Far East for a large part of its production, it<br />
was able to maintain prices here as well at a higher<br />
level than its competitors who were dependent on the<br />
Atlantic market.<br />
Over the course of 2011, the CIF ARA prices (spot)<br />
declined to about US$111/ton. This development has<br />
continued in <strong>2012</strong>. In April <strong>2012</strong>, the average price<br />
was US$96/ton. The growing strength of the US dollar<br />
cushioned the price decline for the euro countries.<br />
The demand for steam coal in the Atlantic region has<br />
remained restrained in <strong>2012</strong>. So the further course of<br />
price developments for steam coal will be largely dependent<br />
on the development of the Pacific region, specifically<br />
on the needs of China and India. China above<br />
all, being a swing customer, has an enormous impact.<br />
Development of FOB Steam Coal Prices<br />
South Africa/Colombia spot in USD/t (6000 kcal/kg)<br />
US$/t<br />
150.00<br />
100.00<br />
50.00<br />
1/11<br />
2<br />
3<br />
4<br />
5<br />
6<br />
7<br />
8<br />
9<br />
10<br />
11<br />
12<br />
1/12<br />
2<br />
3<br />
4<br />
FOB South Africa FOB Colombia<br />
Figure 9 Source: Analysis of various sources
Steam Coal Prices<br />
Prices for steam coal are being set more and more on<br />
coal exchanges, especially in Europe, whereby capital<br />
investors are playing an increasingly important role.<br />
The number of participants in the exchanges is rising.<br />
The latest published exchange quotations are frequently<br />
used as benchmarks for contract conclusions.<br />
The methods used to determine the price indexes are<br />
published and are comprehensible. But there is often a<br />
lack of clarity concerning how many price quotations,<br />
participants etc. are concretely surveyed to determine<br />
an index. The internet-based platform Global Coal is<br />
significantly more transparent in this respect.<br />
In the meantime, there are a number of indices (above<br />
all from McCloskey, Platts, Energy Publishing) for<br />
various regions and types of coal, e.g.<br />
• NW Europe Steam Coal Marker (US$/t)<br />
• Asian Steam Coal Marker (US$/t)<br />
• Indonesian Sub-bit Marker (US$/t)<br />
• Anthracite Index – Mapi 1<br />
• API#2, CIF ARA<br />
• API#4, FOB Richards Bay<br />
• API#6, Fob Newcastle<br />
• McCloskey, swaps Indonesian sub-bit<br />
and others. It has been highly disturbing that recently<br />
the index API#4 has frequently and for longer periods<br />
of time been higher than API#2. This gives rise<br />
to the question whether API#4 is still a suitable index<br />
for coal contracts for the Atlantic market because it is<br />
decisively determined by demand in Asia.<br />
The volume of paper trade has risen substantially since<br />
2000 and in 2010 amounted to 3.5 times the amount of<br />
the total physical steam coal trade. But a substantial<br />
decline was noted in 2011. Since the major focus of<br />
the paper trade at about 70% is in the Atlantic region,<br />
this explains the continued high share of API#2 and<br />
the strong decline of the API#4, which is less relevant<br />
for the Atlantic basin.<br />
Derivative Steam Coal Trade Volume 2000-2011<br />
(seaborne) in mn MT<br />
3,500<br />
3,000<br />
2,500<br />
2,000<br />
1,500<br />
1,000<br />
500<br />
0 2000 2001 2002 2003 2004 2005 2006 2007 2008 2009 2010 2011<br />
Figure 10 Source: Perret Associates<br />
FOB<br />
NEWC<br />
total<br />
API 4<br />
total<br />
API 2<br />
total<br />
Besides the steam coal quotations, exchanges for trading<br />
emission certificates have become established in<br />
the European region.<br />
Strong Rise in Demand for Coking Coal<br />
Worldwide crude steel production in 2011 reached the<br />
level of 1,527 million tons, a new record. In comparison<br />
with 2010, production increased by about 7% (97<br />
million tons). Production rose in the OECD countries<br />
as well as in China. Crude steel production in North<br />
America was 6% higher than in 2010; the increase in<br />
Europe was about 2%.<br />
25
26 Crude Steel Production Growth Trend<br />
30.0%<br />
20.0%<br />
10.0%<br />
0.0%<br />
-10.0%<br />
-20.0%<br />
-30.0%<br />
24,9%<br />
18,7%<br />
16,7%<br />
13,00%<br />
20,00%<br />
15,00%<br />
9,0%<br />
6,8%<br />
8,0%<br />
4,7%<br />
2,3%<br />
0,3%<br />
-1,4%<br />
2005 2006 2007-3,4% 2008-3,6% 2009<br />
9,30% 8,9%<br />
6,8%<br />
5,1%<br />
2010 2011<br />
-8,30%<br />
China<br />
Figure 11 Source: World Steel Association<br />
-21,10%<br />
World World without China<br />
The pig iron production decisive for the consumption<br />
of coking coal, PCI coal and coke rose by 53 million<br />
tons from 1,035 million tons in 2010 to 1,083 million<br />
tons in 2011.<br />
Crude Steel and Pig Iron Production in the World<br />
2009<br />
Mill. t<br />
2010<br />
Mill. t<br />
2011<br />
Mill. t<br />
Increase<br />
2010/2011<br />
Mill. t<br />
Crude Steel 1,220 1,429 1,527 98<br />
Pig Iron 898 1,035 1,083 48<br />
Share of Pig Iron in<br />
Crude Steel<br />
HT-W13<br />
73.6% 72.4% 70.9% - 1.5%<br />
Due to China’s rise in world market share of steel production<br />
from 44% in 2010 to 46% in 2011, its share of<br />
world pig iron production in total steel production also<br />
increased.<br />
Crude Steel and Pig Iron Production in China<br />
2009<br />
Mill. t<br />
2010<br />
Mill. t<br />
2011<br />
Mill. t<br />
Increase<br />
2010/2011<br />
Mill. t<br />
Crude Steel 568 627 697 70<br />
Pig Iron 544 590 683 93<br />
Share of Pig Iron<br />
in Crude Steel<br />
HT-W14<br />
95.8% 94% 98% 4%<br />
The world’s largest steel producers developed as<br />
shown below in 2011:<br />
The 10 Largest Steel Producers in the World<br />
Country<br />
2009<br />
Mill. t<br />
2010<br />
Mill. t<br />
2011<br />
Mill. t<br />
China 577.1 638.7 695.5<br />
Japan 87.5 109.6 107.6<br />
USA 58.2 80.5 86.2<br />
Russia 60.0 68.3 72.2<br />
India 63.5 66.9 68.7<br />
South Korea 48.6 58.9 68.5<br />
Germany 32.7 43.8 44.3<br />
Ukraine 29.9 33.4 35.3<br />
Brazil 26.5 32.9 35.2<br />
Turkey 25.3 29.1 34.1<br />
Total World 1,009.3 1,162.1 1,247.6<br />
HT-W15 Source: World Steel Association<br />
Almost all countries were able to increase steel production<br />
in 2011.<br />
The strong growth in crude steel production worldwide<br />
absorbed large quantities of coking coal from the<br />
world market. Limitations caused by weather conditions<br />
at the beginning of 2011, especially in Australia,<br />
initially caused a shortage in supply, but the USA was<br />
able to compensate most of this.
Market Share Coking Coal World Market<br />
2009 2010 2011<br />
Mill. t % Share Mill. t % Share Mill. t % Share<br />
Australia 134 67 159 63 133 56<br />
China<br />
1 1 2 1 5 2<br />
USA<br />
32 16 48 19 60 25<br />
Canada 21 10 27 11 26 11<br />
Russia<br />
5 2 7 3 8 3<br />
Miscellaneous 8 4 7 3 7 3<br />
Total<br />
HT-W16<br />
201 100 250 100 239 100<br />
The supplier structure has not changed significantly;<br />
however, Australia’s market share declined to 56% as<br />
a consequence of the loss of output caused by adverse<br />
weather. The USA, on the other hand, was able to improve<br />
its market share from 19% to 25%.<br />
Coke production worldwide increased by 8.5% from<br />
593 million tons to 644 million tons. China, far and<br />
away the largest coke producer, once again reduced its<br />
export to about 33 million tons. China’s production of<br />
428 million tons comprises 66% of world production,<br />
and it increased coke output by 44 million tons in 2011.<br />
Europe produced 43 million tons of coke, a little less<br />
than in 2010 (-0.6%). In comparison with production,<br />
the world trade market for coke is relatively small.<br />
Only about 3%–4% of the total production is normally<br />
traded maritime and across the green bor<strong>der</strong>.<br />
Coke World Market<br />
2009<br />
Mill. t<br />
2010<br />
Mill. t<br />
2011*<br />
Mill. t<br />
Total World Market 14 21 21*<br />
% of World Coke Production 3% 3% 3%<br />
* provisiona<br />
HT-W17 Source: Own calculations<br />
Prices Rose Sharply in 2011<br />
The sharp rise in coking coal prices during the boom<br />
years 2007/2008 was followed by a drop in the benchmark<br />
prices for hard coking coal from US$ 300/ton<br />
FOB to US$125–US$130/ton FOB in 2010. As a consequence<br />
of the flooding in Queensland and the curtailing<br />
of supplies which resulted, prices shot up from<br />
US$225/ton to US$330/ton in Q2 and Q3 before falling<br />
back to US$ 225/ton in Q4 2011 because of diminishing<br />
demand.<br />
Change in Contract/Quarterly<br />
Prices for Metallurgical Coal US$/t FOB Australia<br />
Contract<br />
Prices<br />
Hard Coking<br />
Coal<br />
Semi-soft<br />
Coking Coal<br />
PCI<br />
Q1 2010<br />
190<br />
140 150<br />
Q2 2010<br />
200<br />
167 170<br />
Q3 2010<br />
225<br />
171 180<br />
Q4 2010<br />
209<br />
143 149<br />
Q1 2011<br />
225<br />
181 180<br />
Q2 2011<br />
330<br />
259 275<br />
Q3 2011<br />
315<br />
212 230<br />
Q4 2011<br />
285<br />
182 208<br />
Q1 <strong>2012</strong><br />
235<br />
179 171<br />
Q2 <strong>2012</strong><br />
210<br />
148 153<br />
HT-W18 Source: Macquarie Research Commodities<br />
During the first two quarters of <strong>2012</strong>, the slightly falling<br />
worldwide demand continued to hold down prices.<br />
The quarterly contract conclusions fell to US$235 in<br />
Q1 and to US$206–US$210 in Q2 <strong>2012</strong>. Spot prices<br />
were generally about US$10 to US$20 below the quarterly<br />
contract prices.<br />
As a consequence of the return of the torrential rainfall<br />
in Australia and the continuing strike, the price<br />
level could rise in Q3 and Q4 <strong>2012</strong>, provided that demand,<br />
especially in Asia, does not decline because of<br />
the economy.<br />
27
28 Due to a lack of quality parameters suitable for an<br />
exchange, prices for coking coal have previously not<br />
been determined on the coal exchange. Until recently,<br />
they were traditionally set by means of direct agreement<br />
between producers and consumers.<br />
But this practice is now changing. The major coking<br />
coal producers have switched to quarterly pricing.<br />
Simultaneously, the first attempts to establish coking<br />
coal indices have begun. As a result, spot market elements<br />
are having greater impact on pricing. American<br />
coking coal producers continue to offer annual prices,<br />
while BHP Billiton has changed over to monthly<br />
prices.<br />
US$/t<br />
580<br />
560<br />
540<br />
520<br />
500<br />
480<br />
460<br />
440<br />
Coke Export Prices FOB China (12-12,5 % Ash)<br />
1/11<br />
2<br />
3<br />
4<br />
5<br />
6<br />
7<br />
8<br />
9<br />
10<br />
11<br />
12<br />
1/12<br />
2<br />
3<br />
4<br />
Coke 12-12.5 % Ash<br />
Figure 12 Source: China Coal <strong>Report</strong> and other<br />
Coke prices ex China were very high, remaining consistently<br />
at US$500/ton (incl. 40% export duty) in<br />
2011. ARA prices were substantially lower and fell to<br />
US$320 to US$330 at the turn of the year.<br />
Freight Rates – No Change from Very Low Level<br />
After a brief recovery in the autumn, the Baltic Exchange<br />
Dry Index fell dramatically once again at the<br />
end of last year and dropped to 647 points, its lowest<br />
point since 1986, at the beginning of February <strong>2012</strong>; in<br />
comparison, it was quoted at more than 3,800 points<br />
in May 2010.<br />
This is above all a consequence of the surplus capacity<br />
in ships. In the meantime, the overcapacity has<br />
reached such a high level that cargo volumes would<br />
not be able to utilize full capacity even if economic<br />
growth were robust. The collapse is especially significant<br />
for Capesize ships. Yet the fleet of large ships continues<br />
to expand steadily. Vale, for instance, has the<br />
largest fleet of these giants:16 ships of its own and 15<br />
time charter ships of 400,000 DWT each.<br />
<br />
<br />
<br />
<br />
<br />
<br />
<br />
<br />
<br />
<br />
<br />
<br />
Freight Rates (Capesize) of Hard Coal<br />
(spot)to the ARA ports<br />
<br />
<br />
<br />
Jan. <br />
July <br />
Jan. <br />
July <br />
Jan. <br />
July <br />
Jan. <br />
July <br />
Jan. <br />
July <br />
Jan. <br />
July <br />
Jan. <br />
July <br />
Jan. <br />
July <br />
Jan. <br />
July <br />
Jan. <br />
July <br />
Jan. <br />
<br />
Figure 13 Sorce: Source Frachtcontor Junge<br />
The fleet and capacity increase of all bulk carriers rose<br />
by 77 million tons (14.5%) to 614 million tons. Almost<br />
half of the newly delivered vessels are Capesize ships.<br />
Last year, the Capesize fleet rose by an average of 16.1<br />
ships (3.1 million tons) every month.<br />
According to Clarkson Research, net increase (new<br />
ships less decommissioning) for 2011 amounted to 196<br />
Capesize ships of 37.9 million tons and 216 Panamax<br />
ships of 18.4 million tons. Clarkson Research expects
delivery of new ships at a high level to continue in<br />
<strong>2012</strong> – 267 Capesize ships and an astonishing 487<br />
Panamax vessels. However, these figures do not take<br />
into account cancellations, postponements of deliveries<br />
or accelerated decommissioning rates. The latter<br />
is dependent above all on the scrap price; at the end of<br />
last year, it was falling, but began to rise again when<br />
the new year started.<br />
The high bunker prices, which moved in tandem with<br />
increasing crude oil prices, forced many shipping<br />
companies into a corner. The prices in Rotterdam<br />
were 37% higher in the year-on-year comparison and<br />
in 2011 reached the mark of US$620, the record level<br />
so far. Nevertheless, the freight rates will undoubtedly<br />
remain at extremely low levels and fluctuate in a corridor<br />
between US$9 and US$12 per ton for the benchmark<br />
route South Africa-ARA.<br />
Development of CIF-Prices (Steam Coal)<br />
Figure 14 Source: McCloskey<br />
6000 kcal/kg<br />
US Dollar Exchange Rate<br />
The US dollar exchange rate, a major component of the<br />
international energy and raw material business, was<br />
subject to volatile fluctuation.<br />
Until the middle of 2011, the US dollar was weak, but<br />
began to gain in strength over the course of the year. It<br />
gained even further at the end of 2011 and in the initial<br />
months of <strong>2012</strong>.<br />
Raw Materials and Energy Policy – Tendencies<br />
Toward Renationalisation<br />
Owing to the strongly increasing demand for energy<br />
and natural resources around the world, more and<br />
more countries are beginning to see the marketing of<br />
their primary energy deposits as a strategic task. This<br />
observation is not restricted to the petroleum and natural<br />
gas industry; the same trend can be seen for rare<br />
earths and, more recently, for coal as well.<br />
Although the established structures are largely of a<br />
private business nature, a tendency for governments<br />
to exercise influence can be seen in countries such as<br />
Venezuela, Indonesia, South Africa, Mongolia and<br />
Vietnam. In view of the still huge worldwide coal reserves,<br />
massive change is not to be expected for the<br />
moment. In the long term, however, the self-interest<br />
of individual countries could cause their attention to<br />
turn more and more to coal production and impact the<br />
international coal market.<br />
29
30 In free market economies, however, the increased efforts<br />
to consolidate the companies and position them<br />
for sustained profitability takes the place of a national<br />
interest. As a whole, supply security, especially in the<br />
Pacific region, for the economic development of the<br />
threshold and developing countries of the area is steadily<br />
gaining in importance. China and India are especially<br />
active in pursuing specific energy procurement<br />
and raw material policies and are making investments<br />
to secure their access to reserves around the world.<br />
They will certainly continue to implement these policies<br />
in <strong>2012</strong> as well. A number of Chinese and Indian<br />
companies are seeking to acquire mines abroad, especially<br />
in Australia and Indonesia.<br />
CO 2 Emissions Worldwide Reach Record Levels in<br />
2011<br />
In its most recent World Energy Outlook, BP predicts<br />
that fossil energy sources such as petroleum, natural<br />
gas and coal will continue to cover up to 64% of the<br />
world’s energy requirements for the next 20 years,<br />
which will increase by 40% by 2030. The consumption<br />
of steam coal in the global energy mix increased to<br />
29.6% in 2010, the highest level since 1970. Despite the<br />
political support for the expansion of renewable energy<br />
sources (their contribution to total energy growth to<br />
2030 is targeted to rise from 5% to 18%), the emissions<br />
of carbon dioxide from energy generation will reach<br />
27% and be higher than today. According to the International<br />
Energy Agency IEA, more carbon dioxide<br />
was emitted in 2011 than ever before. CO 2 emissions<br />
came to 30.6 gigatons, corresponding to an increase<br />
of 5% in comparison with the previous record mark of<br />
29.3 gigatons from the year 2008.<br />
PwC believes that the global steel boom also played<br />
a role in driving carbon dioxide emissions upwards,<br />
counteracting climate protection measures. Worldwide<br />
steel production will presumably rise by 4% annually<br />
until 2025, eventually reaching the mark of almost<br />
2.56 million tons. If the CO 2 emissions of the industry<br />
are to be maintained at the current level despite the increase<br />
in demand and production, PwC calculates that<br />
the German best value (currently 1.4 tons of CO 2 per<br />
ton of crude steel) would have to be matched worldwide<br />
and reduced by another 36%. But an increase in<br />
efficiency of this magnitude is consi<strong>der</strong>ed unrealistic.<br />
Europe’s energy consumption has only a slight impact<br />
on the planet’s climate. A reduction of the EU 27 quantity<br />
by 60%, for example, equalling 2.3 billion tons by<br />
2035, would have the effect of reducing the global situation<br />
by a mere 8%, compensating for the CO 2 world<br />
growth rates of only a few years and thus postponing<br />
further climatic warming by only a few years while<br />
burdening the citizens of the EU with enormous costs.<br />
OECD Environmental Outlook to 2050: Call for<br />
Holistic Measures<br />
The OECD’s Environmental Outlook to 2050 asks:<br />
“What will the next four decades bring?” Based on<br />
model calculations prepared jointly by the OECD and<br />
the Netherlands Environmental Assessment Agency<br />
(PBL), this publication peers into the future up to the<br />
year 2050 and seeks to project the possible impact of<br />
demographic and economic trends on the environment<br />
in the event that no ambitious measures are un<strong>der</strong>taken<br />
to assure a more responsible management of natural<br />
resources. It concludes by examining some of the<br />
measures which could be implemented to bring about a
positive transformation. Are the basic resources of our<br />
planet adequate to cover the steadily growing demand<br />
for energy, food, water and other natural resources<br />
while at the same time absorbing the flood of waste we<br />
produce? Or will the growth process bring itself to a<br />
halt? How can we reconcile ecological, economic and<br />
social goals with one another? And how can we protect<br />
the environment while improving the livelihoods and<br />
living conditions of the poor of this world?<br />
The OECD Environmental Outlook is concerned with<br />
four broad themes: climate transformation, biological<br />
diversity, water and the effects of environmental<br />
pollution on human health. These four decisive ecological<br />
challenges were identified as problems of the<br />
greatest urgency in the previous publication, Environmental<br />
Outlook to 2030 (OECD, 2008). The new Environmental<br />
Outlook concludes that the prospects today<br />
are even more worrying than in the previous issue and<br />
that – holistic – measures must urgently be initiated<br />
if the high costs and serious consequences which will<br />
arise in the event of inactivity are to be avoided.<br />
In view of the presumed quadrupling of the volume<br />
of the world economy, energy consumption will be<br />
about 80% higher in 2050 than it is today unless new<br />
political action is taken. Moreover, we cannot expect<br />
any significant changes in the worldwide energy mix<br />
in comparison with today if nothing is done. The share<br />
of fossil fuels would still be about 85% while renewable<br />
energy sources, including biofuels, would make<br />
up no more than just over 10%; the rest of our energy<br />
requirements would have to be covered by nuclear<br />
power.<br />
The development to be expected in case new political<br />
action is not taken and simultaneously the current<br />
socio-economic trends continue is the basic scenario<br />
of this report. In this basic scenario, the burdens on<br />
the environment caused by population growth and the<br />
rise in living standards will increase so rapidly that the<br />
progress achieved from combating environmental pollution<br />
and increasing efficiency in the use of resources<br />
will not be possible to compensate.<br />
If more ambitious measures are not initiated, the developments<br />
described below must be expected by 2050.<br />
There will inevitably be serious climate changes leading<br />
to destabilisation because the worldwide greenhouse<br />
gas emissions, according to the projections, will<br />
increase by 50%, primarily because of a 70% rise in<br />
CO 2 emissions from the production of energy. Global<br />
mean warming in comparison with the pre-industrial<br />
level would reach 3° to 6° C by the end of the century,<br />
well above the internationally agreed target of 2° C.<br />
There is a large gap between this 2° C target and the<br />
commitments to emissions reductions from the industrialised<br />
and developing countries found in the agreements<br />
of Cancún. Even if these commitments are met,<br />
the results will not be sufficient to limit global mean<br />
warming to 2° C unless very fast and expensive emission<br />
reduction measures are carried out after 2020.<br />
31
32 EUROPEAN UNION<br />
Recovery of Economic Growth in 2011 Varied<br />
The economic situation remains fragile. Although<br />
growth in GDP increased, the rates among the EU<br />
countries varied greatly, depending on the specific<br />
conditions in each country and its policies, and growth<br />
was slower than in the previous year.<br />
Economic Growth EU 27 in Per Cent<br />
Member States 2009 2010 2011 <strong>2012</strong> (F)<br />
Countries Euro Zone (EU 17) - 4.1 1.8 1.5 - 0.3<br />
EU 15 - 4.3 2.0 1.4 0.5<br />
EU 27 - 4.2 2.0 1.5 0.0<br />
HT-EU1 Source: Eurostat, Bundestag Document 803/11, p. 26<br />
(F = Forecast)<br />
The lea<strong>der</strong>s in growth of GDP in terms of relative<br />
percentage change from 2010 included Estonia (8%),<br />
Lithuania (6.1%), Sweden and Poland (4% each) and<br />
Germany (3%). In contrast, growth in Greece (-5.5%)<br />
and Portugal (-1.9%) was negative.<br />
In its latest estimate, the EU Commission does not expect<br />
any growth of GDP in the EU in <strong>2012</strong>. The entire<br />
region is on the threshold of a recession – some of the<br />
member states are already in the middle of one because<br />
of their rigorous programmes to cut costs.<br />
The negative spiral between the banking sector and<br />
the market for government bonds is the most important<br />
factor increasing the stress level of the current crisis.<br />
It has exacerbated investors’ doubts about the ability<br />
of the countries and banks to service their debts. The<br />
consequence is a rise in the cost of taking out loans for<br />
both countries and financial institutes to a level which,<br />
in the long run, is untenable. Politicians have found it<br />
necessary to strengthen the banking sector and simultaneously<br />
to provide a convincing, strong parachute<br />
for banks and countries in an effort to break through<br />
this vicious circle. A healthy financial system and a<br />
robust banking sector are of decisive importance for<br />
the support of the recovery and for the financing of<br />
long-term growth.<br />
Although the budget deficit declined in both the euro<br />
zone (from 6.2% to 4.1%) and in the EU 27 (from 6.5%<br />
to 4.5%) in comparison with 2010, government debt<br />
rose in both areas. Measured against GDP, government<br />
debt rose from 85.3% (end of 2010) to 87.2% (end<br />
of 2011) in the euro zone and from 80.0% to 82.5% in<br />
the EU 27. The lowest budget deficits were posted in<br />
Finland (-0.5%), Luxembourg (-0.6%) and Germany<br />
(-1.0%), the highest in Ireland (-13.1%), Greece (-9.1%)<br />
and Spain (-8.5%).<br />
This will not improve the employment situation. Unemployment<br />
in the EU in 2011 came to about 9.7% and<br />
will rise to 9.8% in <strong>2012</strong>. In view of the current programmes<br />
to cut costs, the manoeuvring room for fiscal<br />
incentives is very limited, a fact which will undoubtedly<br />
exacerbate the situation in some of the countries.<br />
Young people un<strong>der</strong> the age of 25 are hit especially<br />
hard; unemployment for this group across the EU rose<br />
to more than 20% and to more than 40% in some of the<br />
member states.<br />
Information from Eurostat 2011 indicates that inflation<br />
in the EU will average around 3%. But conditions<br />
in the various countries differ greatly. Hungary has the<br />
highest inflation rate (5.6%), Sweden the lowest (0.7%).<br />
On the average for the year, inflation in Germany was<br />
2.5%. Inflation of 2.6% in the euro zone and 2.8% in<br />
the EU 27 is forecast for <strong>2012</strong>.
All of these predictions, however, are subject to uncertainty<br />
and risks. Such factors include the unrest in<br />
Syria and Bahrain as well as the ongoing conflict with<br />
Iran regarding the allegedly weapons-grade plutonium<br />
from the nuclear power plants there; within Europe,<br />
tensions remain high on the markets for government<br />
bonds in conjunction with the extremely high debt in<br />
Ireland, Greece, Portugal and Spain.<br />
Overall Energy Consumption on the Decline<br />
Economic stagnation over the course of 2011 also<br />
meant that primary energy consumption in many of<br />
the EU countries did not rise. Moreover, the structure<br />
of power generation will continue to change at the expense<br />
of fossil energy sources. Their share of the generation<br />
mix between 2000 and today has fallen from<br />
54% to about 50%. Coal fell by 13% while the share of<br />
coal<br />
28%<br />
natural gas in the energy mix increased by 60% over<br />
the same period. Provisional assessments indicate that<br />
primary energy consumption will have un<strong>der</strong>gone<br />
very little change in comparison with 2010.<br />
Presumed Increase of 2.4% in Greenhouse Gas<br />
Emissions in 2010<br />
Despite the observed rise of 2.4% in the emission of<br />
greenhouse gases in 2010 indicated by the initial estimates<br />
of the European Environment Agency (EEA),<br />
the European Union is still well on course to achieve<br />
the targets for the reduction of emissions set forth in<br />
the Kyoto Protocol. The rise in 2010 was preceded by<br />
a decline of 7% in 2009, primarily a consequence of<br />
the economic recession and the growing generation of<br />
renewable energy.<br />
Share of Coal in Primary Energy Consumption World and EU-27 2010<br />
other<br />
1%<br />
oil<br />
32%<br />
hydro<br />
2% nuclear<br />
6%<br />
combustible<br />
renewables &<br />
waste<br />
10%<br />
World: 12002 Mtoe EU-27 1732.9 Mtoe 1 (14.4%)<br />
1) Mtoe = Mtoe = million tonnes of oil equivalent<br />
gas<br />
21%<br />
Figure 15 Source: BP Statistical Review of World Energy 2011; own calculations<br />
coal<br />
16%<br />
oil<br />
38%<br />
hydro<br />
5%<br />
gas<br />
25%<br />
nuclear<br />
12%<br />
RES<br />
4%<br />
33
34 The most important results:<br />
• Initial estimates for 2010 – more recent data are not<br />
available – indicate that greenhouse gas emissions in<br />
the EU rose by 2.4% in comparison with 2009 (margin<br />
of error ±0.3%). This was a consequence of the<br />
renewed strength of the economy in many countries<br />
as well as of the exceptionally cold winter with its<br />
concomitant greater demand for heating. However,<br />
the increase was less extreme than originally feared<br />
owing to accelerated switch from coal to natural gas<br />
and the continued strong growth in energy generation<br />
from renewable sources.<br />
• In the EU 15 states, the emissions were 10.7% below<br />
those of the base year (usually 1990), substantially<br />
better than the Community-wide goal of a reduction<br />
by 8%. The countries which have not been able<br />
to achieve their goals (Austria, Italy, Luxembourg)<br />
should initiate additional measures to secure compliance,<br />
either by additional reduction or emissions and<br />
increased utilisation of the flexible mechanisms provided<br />
by the Kyoto Protocol.<br />
• The member states of the EEA and participating<br />
countries which do not belong to the EU and have<br />
ratified a Kyoto target proceeded on schedule until<br />
the end of 2009 (with the exception of Liechtenstein<br />
and Switzerland). The latter country has now decided<br />
to make greater use of the flexible mechanisms in<br />
the future to meet its target.<br />
• Actions in sectors which do not fall un<strong>der</strong> the EU<br />
emissions trade such as transport, private households<br />
or waste disposal are especially important for achieving<br />
the national goals for 2020 as set forth in the EU<br />
climate and energy package adopted in 2009.<br />
• The EEA’s trend analysis shows that the greenhouse<br />
gas emissions in the last two decades have been<br />
strongly influenced by economic development.<br />
The greenhouse gas emissions of the EU companies<br />
participating in the EU Emissions Trading System<br />
(EU ETS) declined by 8% between 2008 and 2010.<br />
Figures for 2011 are not yet available.<br />
Success in reducing CO 2 within the EU 15 varies<br />
widely in other respects. While the industrial heavyweights<br />
in the EU – Germany, Great Britain and<br />
France – exceed their goals, some of the countries still<br />
fall short of their targets. In the countries were economic<br />
growth is lowest because of the high level of<br />
national debt, CO 2 emissions will presumably decline<br />
further in comparison with 2010.<br />
EU 15 CO 2 Emissions 1990–2010 (Forecast)<br />
Base Year 1990<br />
Million t CO 2<br />
Equivalent<br />
EU Target<br />
2008–<strong>2012</strong> to<br />
Base Year (%)<br />
Change<br />
1990–2010<br />
in %<br />
EU 15 4,227.2 - 8.0 - 10.7<br />
Germany 1,253.3 - 21.0 - 23.5<br />
United Kingdom 746.0 - 12.5 - 24.8<br />
Denmark 69.0 - 21.0 - 9.3<br />
Luxembourg 12.7 - 28.0 - 4.4<br />
Belgium 146.8 - 7.5 - 7.8<br />
Austria 78.0 - 13.0 + 9.0<br />
Finland 76.8 0.0 + 5.8<br />
France 546.7 0.0 - 6.8<br />
Greece 107.0 + 25.0 + 15.3<br />
Ireland 53.4 + 13.0 + 10.5<br />
Italy 508.0 - 6.5 - 4.8<br />
Netherlands 212.5 - 6.0 - 0.2<br />
Portugal 57.9 + 27.0 + 25.9<br />
Spain 286.8 + 15.0 + 26.0<br />
Sweden 72.3 + 4.0 - 11.1<br />
HT-EU2 Source: European Environment Agency (EEA)
If the Eastern European countries, which posted a decline<br />
in emissions owing to the collapse of their industry,<br />
are included, the EU nevertheless made progress<br />
in the reduction of emissions in comparison with 2009.<br />
In 2010, greenhouse gas emissions of the EU 27 were<br />
15%, those of the EU 15 almost 11% below the value<br />
of 1990, coming close to the reduction target of 20%<br />
by 2020.<br />
Hard Coal Market (EU 27) Still Declining<br />
There were reductions in the output of European hard<br />
coal production almost everywhere in 2011.<br />
Bulgaria + 0.3 million tons to total 2 million tons<br />
Germany - 1.1 million tons to total 13 million tons<br />
Great Britain + 0.1 million tons to total 18 million tons<br />
Poland - 0.9 million tons to total 76 million tons<br />
Spain - 2.2 million tons to total 7 million tons<br />
Czech Republic - 0.4 million tons to total 11 million tons<br />
Romania + 0.0 million tons to total 2 million tons<br />
Hard Coal Output in the EU<br />
2009 2010 2011<br />
Mill. t<br />
(t=t)<br />
Mill. t<br />
(t=t)<br />
Mill. t<br />
(t=t)<br />
Germany 15 14 13<br />
Spain 9 9 7<br />
Great Britain 18 18 18<br />
Poland 78 77 76<br />
Czech Republic 11 12 11<br />
Romania 2 2 2<br />
Bulgaria 2 2 2<br />
Total 135 134 129<br />
HT-EU3<br />
The bottom line in the EU was total output of 129 million<br />
tons, a decline of 4.2 million tons. Poland continues<br />
to lead the list of countries producing hard coal.<br />
Further declines in output are to be expected in Germany,<br />
Poland and Spain in the next few years pursuant<br />
to the decision adopted by the EU Commission on<br />
13/12/2010.<br />
Hard Coal and Lignite Volume in the EU<br />
2009<br />
Mill. t (t=t)<br />
2010<br />
Mill. t (t=t)<br />
2011 1)<br />
Mill. t (t=t)<br />
EU 27 Hard Coal Output 135 134 129<br />
EU 27 Coal Imports<br />
Cross-Bor<strong>der</strong> Trade<br />
189 181 198<br />
EU 27 Coke Imports<br />
Cross-Bor<strong>der</strong> Trade<br />
8 8 8<br />
Hard Coal Volume 325 323 335<br />
EU 27 Lignite 407 397 426<br />
Total Coal Volume 732 720 761<br />
1) Provisional figures<br />
HT-EU4<br />
Business in the steel industry was stable for the most<br />
part, and the pig iron and crude steel production of the<br />
mills supported the sale of coal. Lignite production<br />
and consumption increased at a faster rate. Production<br />
rose by 28.8 million tons and consumption by 30.5<br />
million tons.<br />
35
36<br />
The hard coal consumption of 315 million tons in the<br />
EU breaks down among the following sectors:<br />
Distribution of Hard Coal Consumption in the EU<br />
2009 2010 2011 1)<br />
Mill. t % Mill. t % Mill. t %<br />
Power Plants 245 65 230 71 210 67<br />
Steel Mills/<br />
Coking Plants<br />
88 23 60 18 70 22<br />
Heating Market 44 12 36 11 35 11<br />
Total 377 100 323 100 315 100<br />
HT-EU5 1) Estimate<br />
The structure of the hard coal imports changed further<br />
in 2011. Declining exports to the EU from Indonesia,<br />
Poland and South Africa were compensated by greater<br />
supplies from the USA, Colombia and Russia.<br />
50.0<br />
45.0<br />
40.0<br />
35.0<br />
30.0<br />
25.0<br />
20.0<br />
15.0<br />
10.0<br />
5.0<br />
0.0<br />
Figure 16 Sources: EUROSTAT, statistics of importing countries<br />
The primary energy source mix in power generation<br />
has shifted further in the direction of renewable energies.<br />
Wind and other renewable energy sources were<br />
able to increase their share by 2% while nuclear energy<br />
and oil declined by 1%.<br />
New wind farms were constructed in 2011 as shown<br />
below, based on information from the EWEA (The European<br />
Wind Energy Association):<br />
• 9,616 MW wind power capacities were newly installed<br />
(2010: 9,648 MW).<br />
• Wind power comprised a total of 21.4% of all newly<br />
constructed electric power capacities in 2011.<br />
• Electric power capacities generated from renewable<br />
energy sources (RES) rose by 10.5% to 93,957 MW.<br />
• More RES facilities were constructed in 2011 than<br />
ever before – an increase of 3.9%.<br />
Hard Coal Imports of EU-27 from Third Countries in mn MT<br />
n Coking coal<br />
n Steam coal<br />
n Total coal imports<br />
3,8 4,0 3,3 2,4 4,5 7,0 15,3 43,6 0,6 1,5 1,9 24,0 11,7 15,1 3,6 1,2 3,4 0,5 15,3 2,7 31,7
EU 27 Share in Wind Power Plants installed in Europe by end of 2011 (cumulative) of Altogether 9,616 MW<br />
Figure 17 Source: Wind Stats 2011<br />
The distribution of the newly constructed wind power<br />
capacities among the EU countries varies widely.<br />
37
38<br />
1<br />
5<br />
10<br />
6<br />
23<br />
14<br />
15<br />
26<br />
In Europe, nuclear power (27%) along with coal (25%),<br />
natural gas (24%), oil (2.0%) and mainly large hydroelectric<br />
plants (about 11%) generate about 90% of the<br />
electric power (2009) and represent 84% of power<br />
plant capacities.<br />
Adequate and Flexible Infrastructure<br />
EU 27 Capacities of Power Plants and Balanced Changes 2000-2011<br />
896 Gigawatt<br />
2011 in % Capacity EU-27<br />
n Other<br />
n Solar<br />
n Wind<br />
n Oil<br />
n Gas<br />
n Nuclear<br />
n Hydro<br />
n Coal<br />
Figure 18 Source: EWEA, Wind in power 2011, DEBRIV<br />
The infrastructure for Europe is being steadily expanded<br />
as import volumes rise. The railway lines between<br />
the interior and the ARA ports have also been<br />
improved. The harbour at Rotterdam is un<strong>der</strong>going<br />
massive expansion at the moment (Maasvlakte II), a<br />
part of which will be reserved for energy imports. The<br />
dredging work on the Scheldt in Antwerp was completed<br />
at the end of 2010 so that ships with a draught of<br />
up to 13.1 meters can now use the port.<br />
n Gas<br />
n Wind<br />
n Hydro<br />
n Other<br />
n Solar<br />
n Nuclear<br />
n Coal<br />
n Oil<br />
Balanced Changes (MW) from 2000-2011<br />
116000<br />
84000<br />
4300<br />
6500<br />
47000<br />
-14000<br />
-10000<br />
-14000<br />
9718<br />
9616<br />
*aditions: 2147 MW – disposals 840 MW<br />
Coal Handling in Northwest European Ports<br />
in Million Tons<br />
Ports 2009 2010 2011<br />
Hamburg 5.2 5.3 5.8<br />
Bremen 1.4 1.8 1.6<br />
Wilhelmshaven 2.2 1.8 1.9<br />
Amsterdam 18.0 18.8 19.9<br />
Rotterdam 24.8 24.1 26.7<br />
Zeeland Seaports 3.9 4.0 4.5<br />
Antwerp 6.1 5.1 5.4<br />
Ghent 2.6 4.2 3.1<br />
Dunkirk 6.1 6.5 7.6<br />
Le Havre 2.2 2.1 1.3<br />
Total 72.5 73.7 77.8<br />
HT-EU6 Source: Port of Rotterdam<br />
In the first half of 2011, 12,000 trains completed 50%<br />
more trips than in 2010 along the rail freight route<br />
“Betuwe Line” from Rotterdam to the European hinterland.<br />
16 trains transported coal or ore along this<br />
route every day in Q2 2011.<br />
615<br />
1373<br />
21000<br />
-6253<br />
1307*<br />
-447
EU Energy Policies<br />
EU Energy Road Map 2050<br />
The European Commission presented the document<br />
“Energy 2020 – Strategies for a Competitive, Sustainable<br />
and Secure Energy” on 10/11/2010. In this document,<br />
the Commission described the fundamental<br />
principles of future energy policies up to the year 2020<br />
and beyond (cf. VDKi <strong>Annual</strong> <strong>Report</strong> 2011, pp. 35 et<br />
seqq.). Based on this concept, legislative measures<br />
with substantial relevance for energy supplies in the<br />
EU were adopted in 2011. One of these is the Energy<br />
Road Map 2050 of the EU Commission; its objective<br />
is to assure a secure and competitive energy sector low<br />
in CO 2 . If the target of “reducing emissions by more<br />
than 80% by 2050” adopted by the heads of government<br />
is to be achieved, energy production in Europe<br />
would have to be almost completely free of CO 2 . The<br />
Energy Road Map 2050 describes how this will supposedly<br />
be possible without endangering energy supply<br />
and competitiveness. Beginning with the analysis<br />
of a number of scenarios, it describes the effects of<br />
an energy system without any CO 2 and the political<br />
framework required to bring this about. The member<br />
states are supposed to use this as a foundation for the<br />
required decisions concerning energy policies so that<br />
they can create a stable business environment for private<br />
investors, especially up to 2030.<br />
The analysis is based on scenario examples which<br />
have been worked up to include various combinations<br />
of the four major methods for decarbonisation (energy<br />
efficiency, renewable energies, nuclear energy and<br />
CCS (CO 2 separation and storage)).<br />
A number of elements which the Commission believes<br />
would have a positive impact in all four cases and are<br />
consequently supposed to be decisive for some of the<br />
key results shown below are depicted in the Energy<br />
Road Map 2050:<br />
• The decarbonisation of the energy system is consi<strong>der</strong>ed<br />
to be technically and economically feasible.<br />
The emission reduction target could be met using<br />
all of the decarbonisation scenarios, whereby the<br />
scenarios in the long term could cost less than the<br />
current political activities.<br />
• Energy efficiency and renewable energies are<br />
critical elements. Regardless of the energy mix selected<br />
in each case, improved energy efficiency and<br />
a significantly higher share of renewable energies<br />
will be necessary to achieve the CO 2 targets in 2050.<br />
The scenarios also illustrate that electric power will<br />
have to play a greater role than in the past. Natural<br />
gas, oil, coal and nuclear energy are included in varying<br />
ratios in all of the scenarios, enabling member<br />
states to exercise flexibly options related to their energy<br />
mix, provided that a well-networked European<br />
domestic market can be realised quickly.<br />
• Early investments in CO 2 reduction measures<br />
would cost less. Investment decisions related to<br />
the infrastructure which will be required by 2030<br />
must be made now because the infrastructure put<br />
into place 30 to 40 years ago must be replaced. Immediate<br />
action could prevent costly modifications in<br />
twenty years and faster growth of CO 2. . In any case,<br />
the EU energy turnaround demands a more mo<strong>der</strong>n<br />
and significantly more flexible infrastructure such<br />
as cross-bor<strong>der</strong> connection lines, “intelligent” power<br />
grids and mo<strong>der</strong>n technologies low in CO 2 for the<br />
production, transmission and storage of energy.<br />
39
40 • Putting a stop to the rising price. Investments today<br />
would pave the road to the best possible prices<br />
in the future. Prices for electric power will presumably<br />
rise until 2030, but they would possibly begin<br />
to decline after this point because of lower costs for<br />
provision, cost-cutting measures and improved technologies.<br />
The costs would be balanced by the high<br />
volume of long-term investments in the European<br />
economy, the related local jobs and the decreased<br />
dependency on imports. Decarbonisation would be<br />
achieved in all of the scenarios without any great<br />
differences in terms of cost or consequences for the<br />
secure supply.<br />
• Advantages of size are necessary. A European approach<br />
rather than parallel national systems would<br />
be possible at lower cost and improved security of<br />
supply. This would include a common energy market<br />
which will presumably be completely in place<br />
by 2014.<br />
The European Commission announced the overall<br />
decarbonisation road map for the entire economy in<br />
March 2011. It contains analyses of all sectors: electric<br />
power generation, transport, housing sector, industry<br />
and agriculture. Moreover, the Commission has<br />
worked up road maps specific to each sector; the Energy<br />
Road Map 2050 is the last of these and covers the<br />
entire energy sector.<br />
Will CCS Become Mandatory All Across Europe?<br />
In the opinion of EU Commissioner Günther Oettinger,<br />
the separation and storage of CO 2 (CCS: carbon<br />
capture and storage) will be absolutely essential if an<br />
energy sector virtually free of carbon dioxide is to be<br />
achieved. The EU Commission is currently examining<br />
whether and, if so, at what point in time CCS should<br />
be made mandatory for new as well as for old power<br />
plants.<br />
The EU directive concerning CO 2 storage requires<br />
member states only to regulate the conditions for geological<br />
CO 2 storage. In other words, they can decide<br />
themselves, in accordance with the subsidiarity principle,<br />
whether they want to prohibit storage within their<br />
territorial bor<strong>der</strong>s or to give priority to a different use<br />
of un<strong>der</strong>ground facilities (for gas storage, for example).<br />
The Commission’s strategy in the past has been to<br />
support a technological breakthrough by steering the<br />
CO 2 price via the emission trade. But CO 2 prices are<br />
currently so low that a number of representatives from<br />
the industry and the European Parliament have called<br />
for intervention in the market and a possible reduction<br />
of the certificates. In the UK, on the other hand, there<br />
are proposals to guarantee a lower threshold for the<br />
CO 2 price for financing technologies for the reduction<br />
of CO 2 such as CCS by introducing a minimum price.<br />
The subsidisation of CCS technology could also possibly<br />
be a means of putting an end to Poland’s blocking<br />
tactics for EU climate targets. Poland generates most<br />
of its electricity in coal-fired power plants. But there<br />
is a clear decision by the European Council to reduce<br />
CO 2 emissions by at least 80% by 2050. This is a binding<br />
political decision. There is also a binding target for<br />
reduction of CO 2 for 2020 as well. The Commission<br />
has submitted a proposal for the energy sector in the<br />
Energy Road Map 2050.
CCS Technology: EU Subsidisation for<br />
CCS Pipeline as Well<br />
In October 2011, the European Commission presented<br />
its “Infrastructure Package”, which includes proposals<br />
for the financing of the planned infrastructure measures.<br />
In the opinion of the EU Commission, the expansion<br />
of the long-distance gas pipelines and power grids<br />
is the key to the achievement of European climate and<br />
energy targets. All in all, about €200 billion will be required<br />
for the construction of gas pipelines and power<br />
grids over the next ten years until 2022. In comparison<br />
with the period from 2000 to 2010, this corresponds to<br />
an increase in investments in the gas sector of about<br />
30% and in the power sector of about 100%. But as<br />
far as can be seen at the moment, it must be assumed<br />
that these investments will not be realised or will not<br />
be realised in due time. The reasons cited for this are<br />
the sluggishness in the issue of permits and the lack of<br />
profitability of some of the investments.<br />
The Commission intends to respond by selecting a<br />
series of projects of “common interest”. One of these<br />
will be a CO 2 pipeline across national bor<strong>der</strong>s. A simplified,<br />
faster and more transparent approval process<br />
will apply here and EU funds will be made available.<br />
EU funds of €9.1 billion have been appropriated for the<br />
energy infrastructure in the form of subsidies, projectrelated<br />
bonds or collateral for the period from 2014 to<br />
2020. A number of requirements have been established<br />
for the projects to be selected for support.<br />
They must be economically, socially and ecologically<br />
acceptable and involve at least two member states.<br />
Moreover, they should enhance supply security, enable<br />
market integration, promote competition, guarantee<br />
the flexibility of the system and the transmission of<br />
energy generated from renewable sources to the consumption<br />
centres and secure storage locations.<br />
The initial selection will be handled by a regional<br />
group at regional level; the final decision will be made<br />
by the Commission on the basis of a pan-EU list of<br />
projects of common interest. The first list will be chosen<br />
on 13 July 2013 and later updated every two years.<br />
Projects on this list would in any case be entitled to request<br />
the faster approval procedure as well as apply for<br />
financial grants. However, this financial support will<br />
be consi<strong>der</strong>ed only for projects which verifiably cannot<br />
pay for themselves.<br />
If subsidisation is granted, the EU will finance up to<br />
50% of the costs for studies and work and, un<strong>der</strong> exceptional<br />
circumstances, up to 80% for projects which<br />
are decisive for securing supplies regionally or across<br />
the EU, require innovative solutions and lead to crossover<br />
synergies. Possible financing instruments include<br />
stock instruments (e.g. investment funds) and risksharing<br />
instruments (e.g. loans, bank guarantees and<br />
project-related bonds).<br />
41
42 The European Energy Efficiency Package<br />
The European Commission presented the draft of a directive<br />
for energy efficiency in mid-2011. At this time,<br />
it noted that current conditions indicate that the EU<br />
will presumably not be able to meet the climate protection<br />
target of increasing energy efficiency by 20%<br />
by 2020. The catalogue of measures is highly complex<br />
and goes too far for some market players. Others do<br />
not believe that the measures go far enough because<br />
the directive does not include any “substantial incentives<br />
for conserving energy”.<br />
The EU Commission’s proposal for the directive provides<br />
that energy suppliers would be obligated to persuade<br />
their customers to improve energy efficiency<br />
by means of optimisations such as replacement of old<br />
heater boilers or insulation of their homes. Industry<br />
should pay more attention to opportunities for conserving<br />
energy. Large companies would have to be audited<br />
with respect to energy efficiency every 3 years.<br />
Government offices should buy energy-efficient buildings,<br />
products and services and renovate 3% of all public<br />
buildings annually. In addition, the introduction of<br />
a feed-in priority aims to encourage the cogeneration<br />
of heat and power. There are also proposals for<br />
the expansion of smart grid, smart meter and energy<br />
services.<br />
The directive draft has been criticised in some parts<br />
in Germany especially. The Ministry of Economics in<br />
particular expressed opposition to the EU’s plans to<br />
force utility companies to reduce energy consumed by<br />
their customers by 1.5% annually.<br />
The EU still has seven years to achieve the goal of reducing<br />
primary energy consumption by 20% in comparison<br />
with 2005. If all of the member states continue<br />
to act as in the past, the EU Commission believes that<br />
only 10% will be achieved.<br />
Curtailing of the Auction Quantities in EU Emissions<br />
Trade for the 3rd Trading Period (Set-Aside)<br />
At the beginning of <strong>2012</strong>, the Committee for Industry,<br />
Research and Energy (ITRE) of the European Parliament<br />
voted on a series of proposed amendments for<br />
the planned energy efficiency directive. One of the<br />
proposed amendments provides that the EU Commission<br />
can reduce the quantity of emission entitlements<br />
(EUAs) offered at auction so that harmful effects of<br />
increased energy efficiency on EU emissions trade can<br />
be avoided.<br />
The starting point here is Article 19 of the planned directive<br />
which places numerous demands on the member<br />
states as well as on the Commission for supervising<br />
the execution of the directive – including the quite<br />
vague demand in the original draft of the directive that<br />
the Commission must “also” monitor the effects of the<br />
energy efficiency directive on emissions trade.<br />
This demand has been made significantly more concrete<br />
in the proposed amendment to Article 19 adopted<br />
by the Industry Committee. For one, the Commission<br />
must, upon entry into force of the energy efficiency<br />
directive at the latest, submit a report to the European<br />
Parliament and Council in which the effects of the<br />
directive on investment incentives for low-CO 2 technologies<br />
as well as the risk of “carbon leakage”, i.e. the<br />
relocation of production with high CO 2 emissions in<br />
response to the additional pressure of stricter requirements<br />
for energy efficiency, are examined.
For another – and this is related to the heatedly discussed<br />
“set-aside” – the proposed amendment of Article<br />
19 gives the Commission the opportunity to modify<br />
the regulations for the auctioning of EUAs set forth<br />
in the emissions trade directive before the start of the<br />
third trading phase and so “to initiate suitable measures”.<br />
The proposed amendment expressly emphasises<br />
that such measures can also include the withholding of<br />
“the necessary quantity of entitlements”.<br />
As expected, by making this decision the Industry<br />
Committee distanced itself from the proposed amendments<br />
accepted by the Environment Committee in<br />
which highly concrete quantities were specified for<br />
withholding from the market. According to the first<br />
proposal, the issue volume was supposed to be reduced<br />
by 1.4 billion certificates; the second proposal foresaw<br />
the annual reduction at 2.25% instead of the previous<br />
1.74%. Both of these proposals have presumably now<br />
been consigned to the dustbin.<br />
On the other hand, however, the Industry Committee<br />
has concretised the Commission’s original directive<br />
draft significantly in three points:<br />
1. The Commission alone will decide about the necessity<br />
and the type of the measures;<br />
2. The measures will be implemented by modifying<br />
the rules for the auction. A curtailing of the total<br />
volume of certificates must be achieved completely<br />
by reducing the number of certificates auctioned;<br />
3. The modification of the auction rules permits less<br />
comprehensive measures such as a postponement of<br />
auctions, but in addition, the possibility of a final<br />
withholding of the volume of emissions certificates<br />
to be decided is expressly mentioned. A permanent<br />
reduction in the volume of EUAs being issued would<br />
be possible according to this interpretation.<br />
Now the Parliament and EU governments must discuss<br />
the directive.<br />
Steel Fe<strong>der</strong>ation Calls for Moratorium in Emissions<br />
Trade<br />
The German Steel Fe<strong>der</strong>ation has called on the EU<br />
Commission to pause in its climate protection efforts<br />
and to sort out the various instruments before going<br />
any further. “Europe would be well served by a moratorium,”<br />
said the president of the Steel Fe<strong>der</strong>ation. The<br />
reason given is that the EU Commission has not been<br />
able to iron out successfully the initial design problems<br />
found in the European emissions trading system.<br />
Instead, the system has been made worse by the application<br />
of new, inadequate corrections.<br />
43
44 GERMANY<br />
Germany in an Uncertain Environment – Recovery<br />
Weakening<br />
European economic policies are facing fateful challenges.<br />
In the euro zone, the debt crisis originally confined<br />
to Greece has spread to a much wi<strong>der</strong> area and<br />
has developed into a crisis of confidence. The lack of<br />
trust in politicians in many different areas and scepticism<br />
about their willingness to tackle the problems<br />
whole-heartedly and rigorously have complicated the<br />
issues even further. The necessary consolidation of the<br />
national budgets was faced in many countries with the<br />
dilemma that the restrictive financial policies required<br />
for this purpose can weaken the economy. Now the<br />
monetary union is in a vicious circle of national debt<br />
and banking crises.<br />
Despite this general backdrop, the economic development<br />
in Germany in 2011 proved to be unusually robust.<br />
The growth in gross domestic product in 2011<br />
will presumably post a mark of 3.0%, according to the<br />
forecasts of the Council of Economic Experts (cf. German<br />
Bundestag Document 17/7710), but will weaken<br />
noticeably to 0.9% in <strong>2012</strong>. The development of the labour<br />
market is especially heartening. In 2011, average<br />
unemployment for the year was just un<strong>der</strong> 3.0 million,<br />
the lowest level in a decade. Estimates indicate the figure<br />
will continue to decline to 2.9 million in <strong>2012</strong>.<br />
However, the forecasts are subject to significant risks<br />
which are difficult to quantify.<br />
Selected Key Data for Overall<br />
Economic Development in Germany 1)<br />
Change from Previous Year in %<br />
<strong>2012</strong><br />
2010 2011<br />
Outlook<br />
Gross Domestic Product (price-adjusted) 3.7 3.0 0.9<br />
Labour Force (domestically) 0.5 1.3 n/a<br />
Unemployment in % 2) 7.7 7.1 6.9<br />
Usage of GDP Price-adjusted<br />
Private Households and Non-profit<br />
Private Organisations 0.6 1.1 0.9<br />
Equipment 10.5 8.8 3.1<br />
Buildings 2.2 5.2 1.5<br />
Domestic Demand 2.4 2.4 1.3<br />
Exports 13.7 7.8 3.2<br />
Imports 11.7 7.1 4.2<br />
Trade Balance (GDP Growth Contribution) 3) 1.5 0.7 - 0.3<br />
1) 2010 results updated, 2011 provisional results<br />
2) In relation to total labour force<br />
3) Contribution to growth rate of GDP<br />
HT-D1 Source: Forecast from the <strong>Annual</strong> Assessment 2011/12<br />
of the German Council of Economic Experts assessing the general<br />
economic conditions, Bundestag Document 17/7710.<br />
The Council of Economic Experts believes that German<br />
economic policies will continue to be challenged<br />
to a high degree in <strong>2012</strong>. The issue at stake is nothing<br />
less than the assumption of responsibility for Europe.<br />
The stability of the monetary union must be secured,<br />
and key reforms of the financial market architecture<br />
not yet implemented must be driven forward without<br />
hesitation. Germany must act as the engine for groundbreaking<br />
strategies in Europe. Germany’s role in actively<br />
shaping European economic policies must not<br />
be restricted solely to the handling of the euro crisis<br />
and the reform of the financial market architecture.<br />
The field of energy policies is just as important. The<br />
signposts set in energy policies in 2011, however, lack<br />
a convincing embedding of the national energy concept<br />
in a European context.
Sharp Decline in Energy Consumption Because of<br />
Weather Conditions<br />
According to provisional calculations of the Arbeitsgemeinschaft<br />
Energiebilanzen (AGEB), primary energy<br />
consumption in Germany declined by 5.3% in 2011,<br />
corresponding to a reduction of 25.4 million TCE to<br />
456 million TCE. Primary energy consumption in<br />
Germany in 2011 posted its lowest mark since 1990.<br />
The sharp decline was decisively affected above all by<br />
the weather conditions which were significantly mil<strong>der</strong><br />
than in the previous year, in turn reducing the demand<br />
for heating in all sectors. This more than compensated<br />
for the effects of the general economic performance<br />
which raised the level of consumption.<br />
The production index in manufacturing changed once<br />
again in a positive direction in 2011, but was not as<br />
robust as in 2010:<br />
• Metal products + 7.5%<br />
• Basic chemicals + 1.3%<br />
Production continued to rise strongly in industries<br />
which did not have such high energy demands:<br />
• Machine construction + 13%<br />
• Motor vehicle construction + 13%<br />
• Electrotechnology + 7%<br />
• Manufacturing in total + 8.7%<br />
If the impact of the low temperatures on the changes<br />
in primary energy consumption is consi<strong>der</strong>ed and temperatures<br />
corresponding to the mean over a period of<br />
many years are assumed, the AGEB indicates that primary<br />
energy consumption, assuming that none of the<br />
other conditions change, would have declined by<br />
only 1.0% instead of 5.3%. The effect of the temperature<br />
varies according to energy source. Above all, it<br />
affects the consumption of natural gas and petroleum,<br />
which provide a large share of the heating market (depending<br />
on outside temperatures).<br />
The energy policy decisions adopted by the German<br />
government in 2010 and 2011 for the subsidisation of<br />
renewable energies and the shut-down of nuclear power<br />
plants initially affect the primary energy balance of<br />
2011 in the form of a slight shift in the market shares.<br />
The most important energy source in 2011 continued<br />
to be oil (share 34%). It was followed by natural gas,<br />
which lost almost 2% of its share, falling to 20.4%.<br />
Hard coal and lignite, on the other hand, increased<br />
their contribution to the energy mix to 12.6% and<br />
11.7%, respectively. The most striking changes were<br />
in nuclear energy (its share of consumption fell from<br />
almost 11% in 2010 to 8.8% in 2011) and in renewable<br />
energies (increased their contribution to the primary<br />
energy consumption from 9.7% in 2010 to 10.9% in<br />
2011). Other energy sources (including the balance of<br />
electricity exchange) contributed less than 2% to coverage<br />
of energy demand.<br />
Energy Productivity Rises Enormously Owing to<br />
Statistical Effect<br />
As total economic performance rose by 3.0%, energy<br />
productivity in the German economy, measured<br />
against original values, virtually leaped upward by<br />
8.8%. Adjusted for the effects of temperature, the<br />
posted rise of about 4.0% was still unusually large.<br />
45
46 According to the AGEB, however, another statistical<br />
effect in addition to the impact of temperature must<br />
be consi<strong>der</strong>ed in the evaluation of this development;<br />
it is a consequence of the fact that, in accordance with<br />
international conventions, the so-called degree of effectiveness<br />
method is applied to the balancing of energy<br />
sources without calorific values. Since nuclear<br />
energy does not have any natural calorific values, the<br />
degree of effectiveness of these plants is set at 33% in<br />
accordance with the method. Applying the same logic<br />
to renewable energies (water, wind, photovoltaics)<br />
and the electricity exchange balance with other countries,<br />
a degree of effectiveness of 100% is assumed for<br />
these sources. Compared to the so-called substitution<br />
method previously used, this means that a higher primary<br />
energy consumption is attributed to nuclear<br />
energy while a lower primary energy consumption<br />
is attributed to the above-mentioned renewable energies<br />
and the electricity exchange balance. So the<br />
greatest possible statistical savings effect results if the<br />
production of power by nuclear power plants is completely<br />
replaced by renewable energies and/or power<br />
imports.<br />
Consequently, the replacement of power generated by<br />
nuclear plants leads to an increase in the total economic<br />
energy efficiency simply due to the methodology.<br />
This imputed increase occurs because less primary<br />
energy is utilised arithmetically for every unit of economic<br />
performance. The power intensity – calculated<br />
as the ratio of power generation and economic performance<br />
– remains unchanged.<br />
Taking these factors into account shows that primary<br />
energy consumption in 2011 would not have fallen by<br />
5.3%, but by only 3.8%; adjusted for temperature, the<br />
decline would not have been 3.8%, but a mere 0.1%.<br />
In this case, primary energy consumption would<br />
have remained unchanged for all practical purposes.<br />
Energy Productivity<br />
2010 2011<br />
Difference<br />
in %<br />
Gross Domestic Product (€bn) 2,369 2,440 3.0<br />
Primary Energy Consumption<br />
in Petajoules (Adjusted for<br />
Temperature and Inventories)<br />
13,915 13,701 - 1.5<br />
Energy Productivity (in €/GJ) 168 183 8.8<br />
HT-D2 Source: AGEB, provisional information<br />
The inclusion of the statistical effect has a direct impact<br />
on the assessment of the total economic energy<br />
productivity, i.e. the ratio of gross domestic product<br />
adjusted for prices to the level of primary energy consumption.<br />
The rise in energy productivity, measured<br />
against the original values, would be 7.0% (instead of<br />
8.8%); based on values adjusted for temperature, the<br />
progress in productivity declines from 4.0% to barely<br />
more than 3%. Still, this is far better than the average<br />
of past years.<br />
Hard Coal Almost at Previous Year’s Level; Thirdlargest<br />
Contribution to Supply<br />
Hard coal consumption, which in the previous year<br />
posted the strongest growth of all primary energy<br />
sources, declined slightly in 2011 by 0.7% to 57.5 million<br />
TCE (corresponding to 1,685 PJ) according to<br />
provisional calculations. This means virtual stabilisation<br />
at the level of the previous year. Consumption<br />
remained substantially higher than the “low point of<br />
the century” posted in the crisis year 2009 (50.1 million<br />
TCE). However, it once again fell well short of the<br />
consumption level of the years before the crisis (61.4
million TCE in 2008 and 68.8 million TCE in 2007).<br />
Nevertheless, hard coal made the third-largest supply<br />
contribution to the energy mix, a share of 12.6% in primary<br />
energy consumption in 2011, following oil and<br />
natural gas as in the past, but ahead of the contributions<br />
made by lignite and renewable energies.<br />
While the consumption of coking coal and coke in<br />
Germany’s steel industry increased in 2011 by 4.3% to<br />
17.1 million TCE as a consequence of the economic performance,<br />
the use of steam coal, which comprises more<br />
than two-thirds of the total consumption of hard coal in<br />
Germany, fell by 2.5% to 39.0 million TCE. There was a<br />
slight decline from 1.5 million TCE to 1.4 million TCE<br />
on the heating market.<br />
In contrast, lignite rose by 3.3% to 53.3 million TCE.<br />
It covered just un<strong>der</strong> 12% of the total domestic energy<br />
demand.<br />
Following the moratorium in March <strong>2012</strong>, electricity<br />
generation from nuclear plants reduced its contribution<br />
to primary energy consumption by 23% to 40.2<br />
million TCE. This decline will continue in the coming<br />
years because of the decision made for political reasons<br />
to shut down permanently the 7 (8) nuclear power plants<br />
which were initially shut down only temporarily.<br />
Renewable energies contributed about 50 million TCE<br />
to the energy balance, an increase of almost 11%. Of the<br />
renewable energy sources for power generation, there<br />
were very strong increases in comparison with 2010<br />
in photovoltaics (+63%) and wind energy (+23%). But<br />
biomass also had a large increase. Less electricity was<br />
generated by hydroelectric plants, on the other hand<br />
(7%). As in the past, biomass continues to dominate<br />
power generation (a share of 56% in 2011) as well as for<br />
all other forms of use (just un<strong>der</strong> 61%). Wind energy<br />
is in second place and has a share of 20.4% of power<br />
generation and 11.5% of total domestic energy demand.<br />
The generation of power using photovoltaics has in the<br />
meantime reached the magnitude of the contribution<br />
from hydroelectric power. Solar thermal energy and<br />
geothermal energy continue to be of subordinate importance<br />
among renewable energies.<br />
The increase in the use of renewable energy sources is<br />
the declared goal of environment and climate protection<br />
policies in other member states and in the European<br />
Union (EU) as a whole, not only in Germany. Directive<br />
2009/28/EC of the European Parliament and of the<br />
Council on the promotion of the use of energy from renewable<br />
sources (of 23 April 2009) provides as a binding<br />
goal for the EU overall the increase in the share of<br />
renewable sources for energy consumption to 20% by<br />
2020 and in the transport sector the achievement of a<br />
share of renewable energy sources of at least 10%.<br />
The EU directive sets down national target values differentiated<br />
according to the various member states. In<br />
Germany, the share of renewable energy sources in the<br />
gross energy consumption is supposed to be increased<br />
to 18% by 2020. Besides this target, the German government<br />
is striving to increase the share of renewable<br />
energies in power consumption to 35% by 2020.<br />
The approximately 1,452 PJ or 50 million TCE from renewable<br />
energy sources were utilised as shown below:<br />
• About 819 PJ (56%) or 27.9 million TCE in power<br />
generation<br />
• About 512 PJ (35%) or 17.5 million TCE in heating<br />
• About 121 PJ (8%) or 4.1 million TCE in fuel production<br />
47
48 Primary Energy Consumption in Germany 2010 and 2011 1)<br />
Energy Source<br />
2010<br />
Mill. TCE<br />
2011<br />
Mill. TCE<br />
Change 2010/2011<br />
Mill. TCE %<br />
2010<br />
Share in %<br />
2011<br />
Share in %<br />
Petroleum 160.0 155.2 - 4.8 - 3.0 33.2 34.0<br />
Natural Gas 107.1 93.3 - 13.8 - 12.9 22.2 20.4<br />
Hard Coal 57.9 57.5 - 0.4 - 0.7 12.0 12.6<br />
Lignite 51.6 53.3 1.7 3.3 10.7 11.7<br />
Nuclear Energy 52.3 40.2 - 12.1 - 23.2 10.9 8.8<br />
Renewable Energies 46.6 49.6 3.0 6.3 9.7 10.9<br />
Miscellaneous 8.5 8.1 - 0.4 - 5.5 1.8 1.8<br />
Electricity Exchange Balance - 2.2 - 2.2 1.5 --- - 0.5 - 0.2<br />
Total 481.8 456.4 - 25.4 - 5.3 100.0 100.0<br />
1) All of the figures are provisional<br />
HT-D3 Source: AGEB<br />
Electric Power Generation Falls by 2.2%<br />
Gross electric power generation in Germany fell by<br />
about 14 TWh (2.2%) from around 629 TWh in 2010<br />
to 615 TWh in 2011. The primary reason was the shutdown<br />
of eight nuclear power plants during the moratorium<br />
in the first quarter of 2011. German consumption<br />
fell slightly by about 2 TWh so that the decline in power<br />
generation was compensated by the increased generation<br />
from renewable energy sources and a major reduction<br />
of the export surplus of 17 TWh to only 6 TWh.<br />
The Energy Mix of the Gross Power Generation<br />
Energy Source<br />
2009<br />
TWh<br />
2010<br />
TWh<br />
2011<br />
TWh<br />
Difference<br />
2010/2011 %<br />
Lignite<br />
145.6 145.9 153.0<br />
4.9<br />
Nuclear Energy 134.9 140.6 108.8 - 25.3<br />
Hard Coal<br />
107.9 117.4 114.5<br />
- 2.2<br />
Natural Gas<br />
78.8 86.8 84.0<br />
- 3.2<br />
Petroleum<br />
9.6 8.4 7.0 - 16.3<br />
Renewable Energies 94.1 102.8 122.0<br />
18.7<br />
Miscellaneous 21.5 26.7 26.0<br />
- 2.7<br />
Total<br />
HT-D4 Source: AGEB<br />
592.4 628.6 615.3 - 2.2<br />
The cross-bor<strong>der</strong> electric power trading volume<br />
(total of imports and exports) came to about 106 TWh<br />
(17%) of the gross power generation in 2011. Although<br />
power export fell by almost 4 TWh, import increased<br />
by almost 8 TWh. Virtually all of the energy sources,<br />
with the exception of lignite and renewable energies,<br />
posted a decline. In comparison with 2010, the greatest<br />
increase in absolute terms was found in power generation<br />
from renewable sources at almost 19%, while the<br />
greatest decline (-23%) was seen in nuclear energy for<br />
the reasons mentioned above.<br />
Installed output in wind energy rose in 2011 by 2,086<br />
MW to 29,060 MW, 895 MW from newly constructed<br />
facilities and 238 MW from repowering. A total of<br />
22,297 wind power units were in operation. Production<br />
rose correspondingly from 38 TWh to 46.5 TWh<br />
(+22%). Wind power plants supplied about 1,650 fullload<br />
hours in 2011, 18.8% of their annual capacity. This<br />
was mainly a consequence of the good wind conditions<br />
in 2011 in comparison with the mean over many years,<br />
clearly indicating that this form of power generation is<br />
hardly capable of making a secure contribution to the<br />
coverage of demand.
Power Generation from Renewable Energy Sources<br />
Energy Source<br />
2009*<br />
TWh<br />
2010*<br />
TWh<br />
2011*<br />
TWh<br />
Hydroelectric Power 19.1 19.7 19.5<br />
Wind Power 38.6 36.5 46.5<br />
Biomass 25.5 28.5 31.3<br />
Waste** 4.4 4.8 5.0<br />
Photovoltaics 6.6 12.0 19.0<br />
Geothermal Energy 0.7 0.8 0.02<br />
Total 94.9 102.3 121.3<br />
* Provisional figures, in part estimated<br />
** Renewable share, incl. biogas<br />
HT-D5 Source: AGEB, BDEW, BWE<br />
Moreover, it can be seen over and over that wind and<br />
solar capacities are being expanded where the highest<br />
subsidies are available and not where the best wind or<br />
sunshine conditions prevail. The use of biomass, including<br />
biogas, for power generation increased by 2.8<br />
TWh; although its combustion produces CO 2 , it is assessed<br />
and plannable as CO 2 -neutral.<br />
Photovoltaics, which is subsidised most heavily per<br />
kWh, posted the greatest increase percentage-wise<br />
(+58%). Despite the high sums in the billions which<br />
are paid for the feed-in of this power, its share in gross<br />
power generation is only 2.3%.<br />
Owing to the irregular generation of wind energy, part<br />
of the wind power is diverted more and more often to<br />
the Netherlands and Poland, subject to the payment of<br />
high premiums. In other words, German taxpayers are<br />
subsidising the power consumption and climate protection<br />
of neighbouring countries who, at the same time,<br />
take some of the burden off of their CO 2 balance. The<br />
premiums increase additionally the EEG (Renewable<br />
Energy Act) allocation for electric power consumers.<br />
Hard Coal Market in 2011 Almost at the Level of<br />
2010 – Hard Coal Imports Increase Again<br />
Hard coal consumption posted far and away the strongest<br />
increase with respect to all other primary energy<br />
sources in the year before last. It was not possible to<br />
repeat this sensational increase in 2011, but it was possible<br />
to hold the position more or less. The primary energy<br />
consumption of hard coal fell by 0.4 million TCE<br />
from 57.9 million TCE in 2010 to 57.5 million TCE in<br />
2011, a decline in hard coal consumption last year of<br />
only 0.7%. The levels before the crisis of 61.4 million<br />
TCE in 2008 and 68.8 million TCE in 2007 have still<br />
not been reached again. Imported coal again proved its<br />
ability to serve as a flexible “swing supplier.”<br />
Hard coal consumption in million TCE was covered<br />
as shown below:<br />
Cover of Hard Coal Consumption in Germany<br />
2009<br />
Mill.<br />
TCE<br />
2010<br />
Mill.<br />
TCE<br />
2011 2)<br />
Mill.<br />
TCE<br />
2010/2011<br />
Change<br />
Mill. TCE<br />
Import Coal 35.1 46.4 47.5 1.1<br />
Domestic Production 1) 14.2 13.2 12.3 - 0.9<br />
Total 49.3 59.6 59.8 0.2<br />
1) incl. inventory reductions 2) provisional<br />
HT-D6<br />
Domestic production adjusted its output once again<br />
and reduced production by 0.9 million TCE from 13.2<br />
million TCE in 2010 to 12.3 million TCE in 2011;<br />
stockpiles, on the other hand, rose by 0.3 million TCE.<br />
The sale of hard coal in t=t developed as shown here:<br />
49
50 Total Hard Coal Sales in Germany<br />
Utilisation 2009<br />
Mill. t<br />
Power Plants<br />
43.7<br />
Steel Industry<br />
12.9<br />
Heating Market<br />
1.4<br />
2010<br />
Mill. t<br />
45.8<br />
18.4<br />
1.8<br />
2011 1)<br />
Mill. t<br />
44.4<br />
16.8<br />
1.9<br />
Total 58.0 66.0 63.1<br />
1) Provisional figures<br />
HT-D7<br />
The difference in quantities between the “TCE” figures<br />
and the “t=t” figures results mainly from the<br />
steam coal sector because mainly coal with heating<br />
values un<strong>der</strong> 7,000 kcal/kg is used here. This is why<br />
the t=t figures are higher.<br />
Imports in 2011 contributed 79% to the high-quality<br />
supplies for the German market. Almost as much<br />
coke was produced in Germany (7.9 million tons) as in<br />
the year before (8.1 million tons).<br />
Import coal and domestic coal contributed to supplies<br />
in the various consumer sectors in 2011 as shown here:<br />
Consumer Groups Import Coal and Domestic Coal<br />
Import Coal<br />
Mill. t<br />
Domestic coal<br />
Mill. t<br />
Total 1)<br />
Mill. t<br />
Power Plants 33.6 10.8 44.4<br />
Steel Mills 14.4 2.4 16.8<br />
Heating Market 1.5 0.4 1.9<br />
Total 49.5 13.6 63.1<br />
1) Provisional<br />
HT-D8<br />
So import coal covered<br />
• 76% of power plant demand<br />
• 86% of steel mill demand<br />
• 79% of heating market demand.<br />
Imports break down according to quality as shown<br />
here:<br />
Imports According to Quality in Mill. t (t = t)<br />
Products 2009 2010 2011<br />
Steam Coal<br />
Anthracite<br />
Coking Coal<br />
Coke<br />
29.3<br />
0.4<br />
6.9<br />
2.9<br />
31.3<br />
0.5<br />
9.2<br />
4.1<br />
33.6<br />
0.5<br />
10.0<br />
4.2<br />
Total 39.5 45.1 48.3<br />
HT-D9 Source: German Fe<strong>der</strong>al Statistical Office,<br />
own calculations<br />
It must be pointed out here that the import figures in 2011<br />
differ from the consumption figures due to inventory<br />
movements. This was also the case in the previous years.<br />
The steam coal was dominated by:<br />
• Colombia 10.5 million tons (about 31%)<br />
• Russia 9.6 million tons (about 28%)<br />
• USA 5.1 million tons (about 15%)<br />
• Poland 2.6 million tons (about 8%)<br />
• South Africa 2.6 million tons (about 8%)<br />
For the first time, Colombia became the largest supplier<br />
of steam coal, followed by Russia and the USA.<br />
South Africa and Poland once again supplied lower<br />
tonnage volumes. The trend of a decline in South Africa’s<br />
importance especially for the German market is<br />
accelerating.<br />
The most important suppliers for coking coal were:<br />
• Australia 4.0 million tons (about 40%)<br />
• USA 3.0 million tons (about 30%)<br />
• Canada 1.7 million tons (about 17%)<br />
• Russia 0.9 million tons (about 9%)
Overall, the supply structure for all qualities is broadly<br />
diversified and comes primarily from politically stable<br />
countries. There were no logistical problems in 2011.<br />
Hard Coal Imports into Germany (Inclusive Coke)<br />
in mn MT<br />
mn MT<br />
11.6<br />
4.2<br />
3.8<br />
5.1<br />
9.5<br />
5.2<br />
10.9<br />
6.1<br />
4.3<br />
5.7<br />
10.6<br />
7.6<br />
8.9<br />
5.1<br />
4.3<br />
8.1<br />
11.1<br />
10.8<br />
South Africa/Other<br />
Poland<br />
Australia<br />
USA<br />
CIS<br />
Colombia<br />
Figure 19 Sources: Statistisches Bundesamt, own calculations<br />
The more than 48 million tons of import coal entered<br />
Germany via the following transport routes:<br />
Transport Routes for Import Coal in Germany<br />
Transport Route<br />
2009<br />
Mill. t<br />
2010<br />
Mill. t<br />
2011 1)<br />
Mill. t<br />
German Ports 14.0 14.0 9.7<br />
Rail 7.8 16.0 15.0<br />
Domestic Ships from ARA Ports 18.2 15.0 23.7<br />
Total<br />
1) Provisional figures<br />
40.0 45.0 48.4<br />
HT-D10<br />
Energy Prices: Steam Coal Retains Competitive<br />
Advantages<br />
The significant competition prices for steam coal rose<br />
almost continuously over the course of 2011 while the<br />
coal prices fell during 2011. Price developments for HS<br />
and natural gas moved very closely in tandem.<br />
This is what happened during the year:<br />
Energy Price Development 2011<br />
01/01/2011<br />
€/TCE<br />
01/07/2011<br />
€/TCE<br />
31/12/2011<br />
€/TCE<br />
Heavy Fuel Oil (HS) 298 373 371<br />
Natural Gas to<br />
Power Plants<br />
238 269 270<br />
Import Coal Price CIF<br />
ARA (Spot Market)<br />
HT-D11<br />
112 99 98<br />
HS followed the trend of crude oil prices and recovered<br />
substantially over the course of 2011. The price<br />
for natural gas did not follow the oil price completely<br />
and, like HS, hovered at a high level during the second<br />
half of the year. However, the rich supply of LNG gas<br />
on the world market caused a volatile response in the<br />
prices on the gas spot markets at times.<br />
In all of the market situations, import coal enjoyed a<br />
great competitive advantage in 2011, which was amplified<br />
with respect to natural gas in 2011 because of the<br />
decline in coal prices.<br />
Energy Price Development as a Yearly Average<br />
2009 2010 2011 2010/2011<br />
Change<br />
€/TCE %<br />
Heavy Fuel Oil (HS) 208 270 355 31.5<br />
Natural Gas / Power Plants1) 246 222 256 15.3<br />
Cross-Bor<strong>der</strong> Price /<br />
Imported Coal<br />
84 90 112 24.4<br />
1) <strong>Annual</strong> mean value BAFA price<br />
HT-D12<br />
51
52 The price advantages of import coal over HS and natural<br />
gas developed on the basis of the above values as<br />
shown below:<br />
Price Advantages of Import Coal<br />
2009<br />
€/TCE<br />
2010<br />
€/TCE<br />
2011<br />
€/TCE<br />
Import Coal / HS 124 180 243<br />
Import Coal / Natural Gas 162 132 144<br />
HT-D13<br />
The German cross-bor<strong>der</strong> price (“BAFA” price) follows<br />
the spot market development (API#2) with a time<br />
lag of 3–4 months.<br />
EUR/t TCE<br />
Development of Energy Prices<br />
free Power Station<br />
Steam Coal Heavy Heating Coal Natural gas<br />
Figure 20 gas preliminary<br />
Source: Statistik <strong>der</strong> Kohlenwirtschaft, own calculation<br />
The price behaviour of steam coal and coke is in line<br />
with the short-term market tendencies. Until a short<br />
time ago, coking coal was mostly negotiated in annual<br />
agreements and price increases/decreases always appeared<br />
in the cross-bor<strong>der</strong> prices with a certain time<br />
lag during the year. Since 2010, most of the agreements<br />
are for quarterly prices only. A large market player is<br />
attempting to establish monthly prices. But American<br />
companies also offer annual prices. The purpose<br />
of the establishment of quarterly or monthly prices is<br />
to allow faster adjustment to the market situation and<br />
the interest in “commoditising” coking coal like coal,<br />
which would make it possible to create financial products<br />
for price hedging. The changeover initially caused<br />
great problems for the steel industry, but companies<br />
were able to conclude agreements with their customers<br />
for a “quarterly passing through” of prices or to hedge<br />
against price volatility. The first indices have already<br />
been created and the first swap was traded in 2011.<br />
Since the so-called contract benchmark prices for hard<br />
coking coal today no longer have the importance they<br />
once had in the past, only the cross-bor<strong>der</strong> prices for<br />
all types of coking coal from third countries are shown<br />
here.<br />
Third Countries<br />
Cross-Bor<strong>der</strong> Price in €/t 1)<br />
2008 126.00<br />
2009 175.00<br />
2010 147.00<br />
2011 185.00<br />
1) Average values for all metallurgical coal types<br />
HT-D14<br />
The German cross-bor<strong>der</strong> price comprises not only<br />
the hard coking coal price, but the prices for semi-soft<br />
coking coal and PCI qualities as well.<br />
Just as is the case for steam coal, the relationship of the<br />
euro to the US dollar plays a significant role.<br />
In 2011, the average price of €185/ton for coking coal<br />
was substantially higher than the level of 2010. As a<br />
consequence of the loss of output from Queensland due<br />
to the flooding at the beginning of 2011, coking coal<br />
prices shot up to more than US$300/ton in Q3 and Q4
2011 and were about €40/ton higher than the average<br />
cross-bor<strong>der</strong> price in 2010 throughout the entire year.<br />
The coke prices developed as shown below:<br />
Coke Price Development (Cross-Bor<strong>der</strong> Prices)<br />
Third-country Imports<br />
€/t<br />
EU Imports<br />
€/t<br />
2009 240.00 193.00<br />
2010 260.00 261.00<br />
2011 320.00 332.00<br />
Increase 2010/2011 60.00 71.00<br />
HT-D15<br />
Coke prices rose strongly because of the stable steel<br />
economy worldwide. A trend toward lower quantities<br />
and prices can be expected for <strong>2012</strong>.<br />
Hard Coal Exit in Germany by 2018 Continues<br />
Scheduled Progress<br />
Since the revision clause for <strong>2012</strong> was struck by the<br />
draft for an act modifying the Act for the Financing of<br />
Hard Coal (Bundestag Document 17/4805) adopted at<br />
the beginning of 2011, the preparations for the scheduled<br />
exit from German coal are proceeding. The Bergwerk<br />
Saar is scheduled for closure in the middle of<br />
<strong>2012</strong>, the Bergwerk West for closure at the end of <strong>2012</strong>.<br />
The quantities shown below are the result:<br />
Presumable Quantities / Production<br />
2011<br />
Mill. TCE<br />
<strong>2012</strong><br />
Mill. TCE<br />
West 3.0 3.0<br />
Prosper Haniel 2.8 3.0<br />
Auguste Viktoria 2.8 3.0<br />
Ensdorf 1.4 0.0<br />
Ibbenbüren 2.0 2.0<br />
Total 12.0 11.0<br />
HT-D16 Source: Own evaluation<br />
Output in <strong>2012</strong> will presumably be only slightly below<br />
the level of the previous year. The development in output<br />
shown below could result in the longer term:<br />
Year<br />
2011 12.0<br />
Output Development<br />
Estimate up to 2018<br />
in million TCE<br />
<strong>2012</strong> 11.0 Closure of Ensdorf<br />
2013 10.0 Closure of West<br />
2014 8.0<br />
2015 6.0<br />
2016 6.0<br />
2017 4.0<br />
2018 4.0<br />
HT-D17 Source: Own evaluation<br />
Trends in Coal Price Development in <strong>2012</strong> More<br />
Downwards Than Upwards<br />
Prices for coal CIF-ARA have been at rock bottom<br />
since the end of 2011 and have moved in a range of<br />
US$95 to US$100 per ton, more than one-third below<br />
the price of the previous year. The market is oversupplied,<br />
and activities which would stimulate demand<br />
53
54 are nowhere to be seen in the world. Freight rates are<br />
also stubbornly remaining at a low level because of<br />
overcapacities in freight space for bulk goods.<br />
On the other hand, the US dollar is sometimes stronger,<br />
sometimes weaker with respect to the euro. We will<br />
have to wait and see what impact the rescue attempts<br />
by the euro states to solve the debt situation for Greece,<br />
Ireland, Portugal and Spain will have on the euro.<br />
Based on the spot market prices for steam coal in Q1<br />
<strong>2012</strong> and the recurring weakening of the euro, the<br />
BAFA price will most likely hover around an estimated<br />
price level of less than €90/TCE over the course of<br />
the year.<br />
The recurrence of losses in Australia because of<br />
weather conditions and strikes will surely cause the<br />
coking coal prices to remain at a high level in <strong>2012</strong> as<br />
well. But the coking coal prices could rise even further<br />
from the concluded contract prices for the last quarter<br />
of 2011 and Q1 <strong>2012</strong> of US$210 to US$220 per ton FOB<br />
for hard coking coal if the steel economy begins to<br />
gather strength, especially in Asia. Prices in the vicinity<br />
of US$225 per ton FOB have already been agreed<br />
for Q2 <strong>2012</strong>.<br />
Steel Production Rose Slightly in 2011<br />
The steel industry posted a little growth in 2011. Crude<br />
steel production rose by 1% from 43.8 million tons in<br />
2010 to 44.28 million tons. The demand for pig iron<br />
production, in contrast, was a little less strong, falling<br />
slightly from 28.5 million tons in 2010 to 27.9 million<br />
tons. Steel production in Q1 <strong>2012</strong> will tend to decline<br />
because of the problematic state of the worldwide<br />
economy, even though this decline will most likely<br />
be slight. The recovery of the demand for steel in the<br />
course of <strong>2012</strong> would be a sign of the strengthening of<br />
the economy in Germany.<br />
Pig Iron Production<br />
2009<br />
Mill. t<br />
2010<br />
Mill. t<br />
2011<br />
Mill. t<br />
Difference 2010/2011<br />
%<br />
Crude Steel 32.7 43.8 44.3 1.0<br />
Pig Iron 20.1 28.5 27.9 - 2.1<br />
HT-D18 Source: Stahl-online<br />
The table below shows the average specific consumption<br />
of energy sources in the German steel industry:<br />
Consumption by the Steel Industry<br />
Energy Source 2009 2010 2011<br />
Coke (dry kg per t / pig iron) 386 365 346<br />
Blasting coal (kg per t / pig iron) 92 138 133<br />
Sintering fuels (kg per t / pig iron) 63 48 50<br />
Oil (kg per t / pig iron) 13 11 14<br />
HT-D19<br />
The improved utilisation of blast furnace capacities<br />
reduced the specific consumption of coke and blasting<br />
coal.<br />
Prices and Trading with CO 2 Certificates<br />
2011 was the next-to-last year of the 2nd period of CO 2<br />
trading which will run from 2008 to the end of <strong>2012</strong>.
Price per t CO 2 in €<br />
Historical Development of EUA with Maturity in<br />
December 2011 – in Euro / t CO 2<br />
18<br />
17<br />
16<br />
15<br />
14<br />
13<br />
12<br />
11<br />
10<br />
9<br />
8<br />
7<br />
6<br />
Jan. 2011<br />
Feb. 2011<br />
Mar 2011<br />
April 2011<br />
Figure 21 Source: Reuters<br />
May 2011<br />
Jun. 2011<br />
July 2011<br />
Aug. 2011<br />
Sep. 2011<br />
Oct. 2011<br />
Nov. 2011<br />
Dec. 2011<br />
Despite the good economy, the mild weather conditions<br />
resulted in significantly lower CO 2 emissions<br />
in 2011 and a correspondingly lower consumption of<br />
CO 2 certificates. The effect was to cause prices to dip<br />
slightly or even fall significantly.<br />
The chart below illustrates price expectations per<br />
04/<strong>2012</strong> for the years from <strong>2012</strong> to 2015:<br />
E EU Carbon Futures - <strong>2012</strong>-2015 - Forward Market <strong>2012</strong><br />
EU-ETS €/t CO 2<br />
Figure 22 CO 2 -Forward Prices <strong>2012</strong>-2015 Source: McCloskey<br />
Parallel to the economic crisis in 2009, there was a<br />
strong decline in the use of energy in power plants<br />
and industry and consequently a significant reduction<br />
in CO 2 emissions. This led in turn to reduced demand<br />
for certificates, triggering strong pressure forcing certificate<br />
prices downward. From the end of 2008 to the<br />
middle of 2011, certificate prices usually fluctuated in<br />
a range between €13 and €16 per ton CO 2 . During the<br />
second half of the year, there was a drastic plunge in<br />
price to less than €7 per ton CO 2 . The shortage signals<br />
originally sought with emissions trading are not effective.<br />
When the EU Commission introduced emissions<br />
trading in 2005, it calculated a CO 2 price of €30 per<br />
ton. The CO 2 certificate prices on the futures market<br />
for the delivery period December 2013 and the following<br />
years followed a course similar to that of the spot<br />
prices. Prices here as well moved in a range close to an<br />
historical low point towards the end of 2011 before recovering<br />
again to some extent up to May <strong>2012</strong>, posting<br />
between €7 and €8 per ton CO 2 in April <strong>2012</strong>.<br />
Is Emissions Trading Dead?<br />
According to the words of E.ON boss Teyssen, the emissions<br />
trading system is dead. In his opinion, there is little<br />
need for a new regulation, especially for an EU energy<br />
efficiency directive. The first step should be to “repair”<br />
the existing system – subsidisation of renewable<br />
energies, emissions trading and investment incentives.<br />
The European Commission, in contrast, wants to<br />
strengthen emissions trading. One solution for the excessively<br />
low prices could be the reduction of the CO 2<br />
entitlements on the market. But an increase in the CO 2<br />
reduction goals for 2020 from the current 20% to 30%<br />
would also be a possibility.<br />
55
56 A study by the British Institute for the Study of Civil<br />
Society (Civitas) of the European ETS recommends<br />
the replacement of the EU ETS and all other green<br />
taxes with a CO 2 tax featuring a fixed price (flat rate)<br />
for all of the facilities and CO 2 emissions already covered<br />
by the EU ETS. The EU ETS is neither the least<br />
expensive nor the most sustainable road to reduction<br />
of CO 2 emissions.<br />
Others want to see a stricter regulation of the trading<br />
in emissions certificates than in the past.<br />
The EU Commission has proposed tighter regulation<br />
of the financial markets – and it should also apply to<br />
the European emissions market. There are exceptions<br />
Change against previous year in %<br />
Change in CO 2 emissions in Germany<br />
Original values of CO 2 emissions<br />
Temperature adjusted CO 2 emissions<br />
Figure 23 Sources: Umweltbundesamt; Deutscher Wetterdienst; AG Energiebilanzen; own<br />
for compliance buyers and tra<strong>der</strong>s in small volumes.<br />
The financial market directive (Markets in Financial<br />
Instruments Directive – MiFID) and the directive<br />
against market misuse are supposed to be amended.<br />
Each of them will be broken down into a directive<br />
and a regulation. Professional CO 2 tra<strong>der</strong>s would obtain<br />
a so-called MiFID license and comply with all<br />
of the rules of the directive, including the reporting<br />
and archiving of business transactions and obtaining<br />
information about trading partners. Companies which<br />
themselves emit carbon dioxide and purchase certificates<br />
to cover these emissions (so-called compliance<br />
buyers) would as a rule not be required to obtain a licence,<br />
according to the Commission.
At the moment, CO 2 trading with short-term certificates<br />
is not subject to official regulation, while the futures<br />
market – the long-term contracts – falls un<strong>der</strong><br />
current regulatory mechanisms of the EU. In the future,<br />
all of the emissions entitlements and other emissions<br />
trading products such as certificates for climate<br />
protection projects in third countries (so-called certified<br />
emissions reductions (CER) and emission reduction<br />
units (ERU)) would be controlled. EU figures<br />
show that the European CO 2 market has grown from<br />
€6 billion to €90 billion in the past five years. Analysts<br />
expect this growth to increase tenfold by the end of<br />
the decade.<br />
CO 2 Emissions in Germany Decline<br />
According to initial estimates (Ziesing in: ET <strong>2012</strong>,<br />
pp. 4 et seqq.), CO 2 emissions in Germany declined<br />
by 2.3% in 2011 in comparison with the previous year.<br />
This corresponds to a reduction of just un<strong>der</strong> 19 million<br />
tons of CO 2 compared with 2010 and is 5.5% (46<br />
million tons CO 2 ) lower than in 2008.<br />
A major contribution to this reduction came from the<br />
weather conditions, which were significantly mil<strong>der</strong><br />
than in 2010, causing primary energy consumption<br />
in 2011, despite economic growth of about 3%, to be<br />
5.3% lower than in the previous year. Adjusted for<br />
temperature, however, the emissions from energy generation<br />
in 2011 rose slightly.<br />
In total, a decline in total greenhouse gas emissions of<br />
2.3% is expected for 2011. This would mean an estimated<br />
reduction of CO 2 emissions of 23.1% in comparison<br />
with the base year. Germany’s mandatory target<br />
of a reduction of 21% for the period from 2008 to <strong>2012</strong><br />
would be substantially exceeded.<br />
Durban: Summits Cannot Save the Climate<br />
The summit in Durban may have closed with a result,<br />
but in actual fact it was a failure. But after the disaster<br />
in Copenhagen two years ago, failure was not an option<br />
for the participants. This forced the 17th World<br />
Climate Conference in Durban to go into the longest<br />
extra time period ever as the wording for new, stricter<br />
and more binding agreements for climate protection<br />
was sought. Doubts as to whether the result deserves<br />
the title of “historic” are justified, however, because it<br />
is meagre. The sluggish negotiation process has been<br />
kept in motion – but that is all.<br />
On paper, the resolutions do not look bad at all. The<br />
climate convention binding all countries, poor and<br />
rich, large and small, is supposed to be negotiated by<br />
2015. A deadline has even been set for the entry into<br />
force as well as the negotiations: 2020. This is new and<br />
could strengthen the binding force. But the resolution<br />
no longer speaks of a “legally binding convention”<br />
which the Europeans would like to have seen. At best,<br />
talk now is of an “agreed result with legal force”.<br />
The Kyoto Protocol is hardly in better shape. Industrialised<br />
countries committed to reductions of their<br />
greenhouse gas emissions in this document. The first<br />
treaty period ends in <strong>2012</strong>. At the moment, the length<br />
of the period for the extension of the Kyoto treaty has<br />
not been determined. Will it be until 2017, as offered<br />
by the EU to increase pressure for the conclusion of a<br />
world climate convention? Or until 2020, as demanded<br />
by China and India so that the date for binding emissions<br />
reductions on their part will be postponed?<br />
The EU wants to continue using the Kyoto Protocol as<br />
a bargaining chip in the negotiations. But Japan, Rus-<br />
57
58 sia and Canada have already announced their withdrawal,<br />
and the United States has not been a party to<br />
the Protocol from the beginning. The result is that the<br />
remaining industrialised countries among the Kyoto<br />
members, above all the EU, are ultimately responsible<br />
for all of 15% of the globally emitted greenhouse<br />
gases. This is less than America and China each emit.<br />
Along with India, they are “responsible” for more than<br />
half of the world’s annual emissions in greenhouse<br />
gases. This shows that anyone pinning his climate policy<br />
hopes primarily on “Kyoto” has already lost.<br />
From Energy Concept to Energy Turnaround<br />
Following the re-evaluation of nuclear energy in the<br />
summer of 2011, the energy concept of September<br />
2010 (cf. VDKi <strong>Annual</strong> <strong>Report</strong> 2011, pp. 51 et seqq.)<br />
was modified. According to its own statements, the<br />
German government has set its long-term strategy for<br />
structuring future energy supplies in this concept.<br />
Major elements of this strategy, now known as the<br />
energy turnaround, include energy efficiency and the<br />
following:<br />
• Shutdown of all nuclear power plants by 2022<br />
• Systematic expansion of power generation from renewable<br />
energy sources<br />
Nuclear Energy Exit by 2022 Decided<br />
In June 2011, the German government decided to discontinue<br />
operation of all nuclear power plants by the<br />
end of 2022. At the same time, it was decided that the<br />
seven nuclear power plants affected by the moratorium<br />
and the nuclear power plant Krümmel would not return<br />
to online operation.<br />
The decision was preceded by a recommendation from<br />
an ethics commission “Secure Energy Supply”, chaired<br />
by Dr Klaus Töpfer, created specifically for this purpose.<br />
Among other points, the ethics commission gave<br />
the following reasons for the recommendation:<br />
“The exit is necessary and is recommended so that the<br />
risks inherent in nuclear power in Germany can be excluded<br />
in the future. It is possible because there are<br />
alternatives with lower risks. The exit should be structured<br />
so that the competitiveness of industry and of the<br />
country as a site of economic operations is not endangered.<br />
Germany has alternatives at its disposal from<br />
science and research, technological developments and<br />
entrepreneurial initiatives for the development of new<br />
business models in a sustainable economy: power generation<br />
using wind, sun, water, geothermal sources,<br />
biomass, the more efficient use and increased productivity<br />
of energy and the utilisation of fossil energy<br />
sources without harm to the climate. Changes<br />
in people’s lifestyles will also help to conserve energy<br />
if they respect nature and preserve it as the foundation<br />
of creation.”<br />
Systematic Expansion of Power Generation from<br />
Renewable Energy Sources<br />
The long-term goal of the energy turnaround is the reduction<br />
of CO 2 emissions. The means to achieve this<br />
end, besides the pillar “energy efficiency”, are the expansion<br />
of the use of renewable energy sources and<br />
utilisation of combined heat and power (CHP).
The expansion targets in the area of power generation<br />
from renewable energy sources and CHP plants are<br />
even more ambitious than those in the energy concept.<br />
In 2020,<br />
• a share of 35% in renewable energies and<br />
• a share of 25% from CHP plants in power generation<br />
have been targeted.<br />
Generation of power from renewable energy sources<br />
will steadily increase through 2050. No long-term<br />
goals have been set for CHP as of the moment, but<br />
there are goals for the share of renewable energies<br />
(RES) in power generation.<br />
• 2030: minimum RES share of 50%<br />
• 2040: minimum RES share of 65%<br />
• 2050: minimum RES share of 80%<br />
Updated Energy Scenarios from Prognos/EWI/<br />
GWS – Additional Burden of €32 Billion for Electricity<br />
Consumers<br />
In mid-2011, the update of the energy scenarios for the<br />
German government’s energy concept (cf. the VDKi<br />
<strong>Annual</strong> <strong>Report</strong> 2011, p. 51) on behalf of the German<br />
Ministry of Economics was published un<strong>der</strong> the title<br />
“Energy Scenarios 2011”.<br />
It analyses the effects on energy and the overall economy<br />
from the accelerated exit from nuclear power<br />
which had been decided in comparison with the extensions<br />
for continued operation of German nuclear<br />
power plants which were still in place in 2010. Based<br />
on this comparison, the update un<strong>der</strong>takes a quanti-<br />
tative estimation of the consequences for energy consumption<br />
and the energy mix, power generation, electricity<br />
price, economic performance and employment,<br />
extending now, however, only until 2030 and not until<br />
2050 as before.<br />
The Energy Scenarios 2011 are also target scenarios<br />
which model economically optimised paths to achieve<br />
objectives set by energy policies on the basis of certain<br />
(predicated) fundamental assumptions. The significant<br />
results:<br />
The bottom line is that the accelerated exit from nuclear<br />
energy decided in Germany appears “feasible”<br />
from an energy economy standpoint, according to<br />
the institute. Gas-fired and coal-fired power plants and<br />
increased electricity imports, along with the expected<br />
energy conservation and the scheduled expansion of<br />
power generation using renewable sources, can compensate<br />
for the contribution from nuclear power. However,<br />
the accelerated exit from nuclear energy will lead<br />
to increased costs for end consumers totalling €32<br />
billion by 2030. In particular, the industry with a high<br />
demand for electric power in Germany must expect<br />
higher power prices and costs (+17%). Simultaneously,<br />
the dependency on energy imports will rise until 2030.<br />
Moreover, the reduction of CO 2 emissions will not be<br />
as great. The required grid expansion and the variances<br />
in regional supply situations were not examined.<br />
But the institute also explicitly noted that there<br />
could be problems in securing the supply and grid<br />
stability in every case if, in deviation from the assumptions<br />
of the scenarios, the expansion of the power<br />
plant facilities is delayed or the demand for electrical<br />
power develops more expansively.<br />
59
60 The institute also pointed out that the results presented<br />
here describe in isolation the effects of the accelerated<br />
exit from nuclear energy and are not the equivalent of<br />
a comprehensive energy turnaround in Germany or do<br />
not correspond to alternative transformation scenarios<br />
such as an increase in the expansion of national power<br />
generation capacities instead of a less costly power<br />
market model all across the EU or an even faster expansion<br />
of renewable energies and grids etc. “In view<br />
of this setting, the power price effects must be regarded<br />
as the lower limit of possible development.”<br />
With respect to the greenhouse gas emissions related<br />
to energy in Germany, it is shown that the (climate)<br />
policy targets which have been set can also be<br />
achieved un<strong>der</strong> the exit scenario. The CO 2 equivalent<br />
of the GHG emissions will decline by 40.1% by 2020<br />
and then by 61.9% by 2030 (in each case with respect<br />
to 1990).<br />
Specific Energy Business Results: Nuclear Power<br />
Exit and New Reference Scenario<br />
The assumed general data for the longer-term development<br />
in the energy business have not been changed in<br />
the “Energy Scenarios 2011” with respect to 2010 with<br />
the exception of the shutdown of nuclear plants. This<br />
is true of the price assumptions as well as of the other<br />
framework data (demography, economic performance<br />
according to sectors etc.). The scenario based on the<br />
nuclear power exit in the Energy Scenarios 2011 reflects<br />
the new situation after the decisions in energy<br />
policies and can therefore be regarded as a new reference<br />
scenario for the energy business in Germany.<br />
The following assumed trends apply especially to the<br />
development of prices for energy sources and CO 2 certificates<br />
(2008 to 2030) in accordance with the “Energy<br />
Scenarios 2011”.<br />
Development of Prices for Energy Sources<br />
and CO 2 Certificates<br />
Prices 2008 2015 2020 2025 2030<br />
Real (Base in Each Case 2008)<br />
International Prices<br />
Oil Price US$/bbl<br />
CO 2 Certificates €/t<br />
Cross-Bor<strong>der</strong> Prices<br />
Crude Oil €/t<br />
Natural Gas Ct/kWh<br />
Steam Coal €/TCE<br />
94<br />
484<br />
2.7<br />
112<br />
90<br />
15<br />
495<br />
2.4<br />
82<br />
98<br />
20<br />
554<br />
2.3<br />
77<br />
HT-D20 Source: German Hard Coal Association (GVSt)<br />
105<br />
29<br />
619<br />
2.5<br />
81<br />
The Contribution of Hard Coal to the Energy<br />
Turnaround<br />
110<br />
38<br />
675<br />
2.6<br />
83<br />
The new reference scenario shows that the German<br />
hard coal market will suffer a drastic collapse in<br />
the next two decades, even though this collapse is not<br />
projected to be quite as precipitous as shown in the<br />
scenario “Extension of Lifetime”. The total hard coal<br />
consumption in Germany will be cut almost in half<br />
in the current decade: it will fall from 57.8 million<br />
TCE in 2010 to 32.1 million TCE in 2020. It will continue<br />
to shrink at a similar rate to only 17.2 million<br />
TCE in 2030. The share of hard coal in primary energy<br />
consumption (PEC) would be reduced from 12.1% in<br />
2010 to 8.2% in 2020 and 5.5% in 2030. Changes in<br />
power generation would be similarly drastic. The hard<br />
coal share, according to the new scenario, would<br />
fall from 18.7% in 2010 to 13.5% in 2020 and later<br />
to 7.4% in 2030.
According to the scenario calculations, the absolute<br />
use of hard coal as a fuel for power generation would<br />
fall to only 17.3 million TCE in 2020 and 6.7 million<br />
TCE in 2030. Based on the Energy Scenarios 2011,<br />
more than half of electrical power would be generated<br />
from renewable sources in 2030: 30% from wind power<br />
and 25% from other renewable energy sources, especially<br />
biomass (9%), photovoltaics (9%) and hydroelectric<br />
plants (5%). In addition, a good fifth of power<br />
generation would be fuelled by natural gas.<br />
According to the Energy Scenarios 2011, renewable<br />
energy sources in 2030 will contribute about 31% to<br />
the coverage of total PEC in Germany. It will be this<br />
long before their contribution is as great as that of oil,<br />
which until then will remain the number one energy<br />
source in the energy mix. The scenario shows that<br />
lignite and hard coal will have a combined share<br />
of only 11% in 2030 (still 20% in 2020), half that of<br />
natural gas at 22%. According to the Energy Scenarios<br />
2011, PEC in total will decline by about one-third by<br />
2030 in comparison with 2008, by 34% (by 20% as<br />
early as 2020); energy conservation and increase in<br />
energy efficiency will consequently be the most important<br />
energy sources of the future, provided that<br />
energy consumption in Germany actually can be reduced<br />
by this scope during this period.<br />
New Coal-fired Power Plants Will Be Required to<br />
Assure Reliable Sources of Power in the Future as<br />
Well.<br />
As described in a publication from the German Fe<strong>der</strong>al<br />
Ministry of Economics (“The Energy Turnaround<br />
in Germany” – Special Issue “Highlights of Economic<br />
Policy” – http://www.bmwi.de), conventional power<br />
plants will be indispensable for power generation in<br />
the future as well. They are capable of doing something<br />
that most of the power generation from renewable<br />
energy sources cannot do at this time: reliably<br />
provide power at the moment it is needed. During the<br />
cold wave in February <strong>2012</strong>, for instance, only a little<br />
less than 1,000 MW of the more than 50,000 MW from<br />
photovoltaics and wind farms was reliably on the grid,<br />
an availability of just barely 2%. Conventional power<br />
plants deliver power continuously for days and weeks,<br />
even when there is no wind and the sky is cloudy. Even<br />
in these days of the energy turnaround, this so-called<br />
generation on demand is decisive as it is not possible<br />
to take more power from the grid than is simultaneously<br />
fed in. The fluctuations in the feed-in of power<br />
from renewable energy power plants must constantly<br />
be balanced to assure the stability of the system. As of<br />
today, only flexible conventional power plants have the<br />
capability to do this.<br />
A Secure Supply of Energy is an Invaluable Asset<br />
The step-by-step increase in the share of power from<br />
renewable energy sources decided in the energy turnaround<br />
must be carried out in such a way that the supply<br />
of power remains affordable and, above all, secure in<br />
the future. The assurance of a reliable supply of power<br />
is especially indispensable for manufacturing companies.<br />
Calculations reveal that the value of a secure<br />
power supply is many times higher than the price we<br />
pay for our electricity today. But a reliable supply of<br />
power is highly valued by private citizens as well. If<br />
the power fails, nothing works any more – no light, no<br />
refrigerator, no coffee maker.<br />
Supply security is generally regarded as guaranteed if<br />
the highest demand for electrical power in a year (the<br />
61
62 so-called annual peak load) can be covered by domestic<br />
power generation facilities.<br />
The annual peak load in Germany comes to about 80<br />
gigawatts – corresponding to about 80–90 large power<br />
plants. The point in time at which this peak load occurs<br />
cannot be predicted exactly. Generally, the annual<br />
peak load occurs on cold winter evenings, but if certain<br />
conditions come together, it can happen at other<br />
points in time. So it is important that domestic generation<br />
output can cover the greatest demand of the year<br />
plus a security margin of several percentage points at<br />
any and every point in time of the year.<br />
VDKI Information-Box:<br />
Secure and Installed Output, Base Load and<br />
Residual Load<br />
The secure output is the share of installed output<br />
which has a 99% probability of always being available,<br />
i.e. even in times where there is no wind or<br />
sunshine.<br />
Installed output in Germany in January 2011 came<br />
to about 160 GW (according to ENTSO-E forecast).<br />
Of this 160 GW output, about 93 GW can be regarded<br />
as secure.<br />
Renewable energy sources (wind, photovoltaics, biomass,<br />
hydroelectric) contribute only about 12 GW of<br />
this secure output. Among renewable energies, photovoltaics<br />
is not at all available as a secure source,<br />
and wind energy is secure only to a small degree.<br />
Hydroelec-tric power is the renewable source which<br />
contributes the greatest share to secure output.<br />
The secure output which is required in addition to<br />
power from renewable sources must still be provided<br />
by conventional power plants. However, even power<br />
plants do not constantly generate electricity over the<br />
entire year (8,760 hours). For instance, the full capacity<br />
hours in 2010 came to about 7,300 hours in nuclear<br />
power plants and to about 3,870 hours in hard coalfired<br />
power plants.<br />
If a power plant is operated with as little interruption<br />
as possible, we say that it covers the base load. The<br />
base load is that part of the total load below which<br />
demand never falls over a longer period of time and<br />
so can be covered by constant power plant operation.<br />
Typically, the base load is covered by power plants<br />
with the lowest generation costs – as a rule, coal-fired<br />
and nuclear power plants.<br />
The full capacity hours with feed-in priority for<br />
wind power, dependent on the weather, came to only<br />
about 1,400 hours, and the average for photovoltaics<br />
systems was 900 hours. The so-called residual load<br />
or remaining energy demand must be covered by<br />
conventional power plants in the future as well. As<br />
power generation from renewable energy sources is<br />
expand-ed, the residual load will become more important<br />
with respect to the base load.<br />
Source: German Fe<strong>der</strong>al Ministry of Economics: The Energy<br />
Turnaround in Germany<br />
The residual load must be covered – after the feed-in<br />
of power from renewable sources – by conventional<br />
power plants. However, the residual load offers little<br />
opportunity to operate a power plant profitably longterm<br />
because the number of operating hours and the<br />
level of the peak prices is falling, leading in the end to<br />
a lower base/peak spread.
<strong>Annual</strong> Full Load Hours of German Power<br />
Plants 2010<br />
nuclear energy<br />
lignite<br />
biomass<br />
hard coal<br />
running and storige water<br />
natural gas<br />
wind<br />
oil<br />
pumped storage<br />
photovoltaics<br />
Figure 24 Source: BDEW<br />
So Germany will need conventional power plants<br />
which are as flexible as possible for secure coverage of<br />
the load even in the future.<br />
Just how great the need for conventional power plant<br />
capacities in the future truly is depends on a number<br />
of different factors. Impacting factors include the future<br />
expansion of facilities utilising renewable energy<br />
sources, the opportunities for interregional balancing<br />
of supply and demand fluctuations on the electrical<br />
power market and the further development of storage<br />
technologies.<br />
At this time, it is very difficult to estimate what this<br />
need will be. When the wind is calm and the skies are<br />
clouded over, situations can arise in which the German<br />
demand must be met almost completely by conventional<br />
power plants. However, it will be necessary<br />
to shut down conventional power plants in the coming<br />
years because of their age. Construction of new plants<br />
in an equivalent volume is required to compensate for<br />
the reduction in capacity; a large part of this capacity<br />
has been un<strong>der</strong> construction for a longer time and will<br />
soon be starting up operation.<br />
But a new power plant will be constructed only if market<br />
conditions allow for a reasonable return on investment.<br />
So it is especially important that an adequate<br />
number of hours and sufficiently high price levels can<br />
be expected in future years. At the moment, this is not<br />
the case if we assume the steadily increasing feed-in of<br />
power from renewable sources (so-called peak shaving)<br />
as well as the level of electricity prices. Even in<br />
2010, the annual full capacity hours for hard coal-fired<br />
power plants amounted only to 3,870, and the tendency<br />
is downwards.<br />
So the focus should not be on capacity mechanisms<br />
and the associated interventions in the market, but<br />
rather on the further development of the power<br />
markets in the direction of the expansion of the balancing<br />
energy markets or the introduction of additional<br />
reserves.<br />
The German Fe<strong>der</strong>al Ministry of Economics and<br />
Technology discussed a design of electricity wholesale<br />
markets feasible for the future with the German<br />
states and associations at the second power plant forum.<br />
The most significant issue was how the electricity<br />
wholesale market must be organised so that the<br />
security of power supply can be guaranteed into the<br />
future. The basis of the discussions at the power plant<br />
forum was an assessment of electricity market design<br />
prepared by the Institute of Energy Economics at the<br />
University of Cologne (EWI) on behalf of the Fe<strong>der</strong>al<br />
Ministry of Economics (BMWi).<br />
The assessment concludes that guaranteeing the secure<br />
supply of power will become an ever greater<br />
challenge for the electricity wholesale market. The<br />
assessors chose two models from among the many<br />
different capacity mechanisms un<strong>der</strong> discussion or<br />
63
64 being used in various countries and examined them<br />
for their capability to generate sufficient investments<br />
in power plants. From the standpoint of efficiency, they<br />
recommend a competitive model in which capacities<br />
(including existing plants) are acquired in a ten<strong>der</strong><br />
and which remains largely unaffected by the spot<br />
market (“security of supply market”).<br />
On the other hand, the scientists rashly rejected an alternative<br />
model (“strategic reserves”), although it is in<br />
many ways attractive and consistent, because it would<br />
lead to unnecessarily high electricity prices without a<br />
compelling reason.<br />
Combined Heat and Power Goal Not Achievable<br />
Even After CHP Reform?<br />
In the opinion of the Öko-Institut, the German government’s<br />
goal to increase the share of CHP in power<br />
generation to 25% by 2020 cannot be achieved un<strong>der</strong><br />
the current general conditions. Associations and companies<br />
in the energy industry are calling for higher<br />
subsidies for CHP within the scope of the power-heat<br />
coupling reform submitted at the end of 2011.<br />
The planned increase of 0.3 eurocents per kWh for<br />
plants which are subject to emissions certificate trading<br />
is consi<strong>der</strong>ed to be inadequate. The demand is for<br />
an increase in the allowances of at least 0.5 eurocents<br />
per kWh.<br />
Renewable Energy: Germany’s Energy Turnaround<br />
Leads to High Burdens on Citizens and<br />
Industry – But Contributes Nothing to Climate<br />
Protection<br />
The share of renewable energies in the total gross end<br />
energy consumption of 9,327 PJ continued to rise in<br />
2011, a consequence of the high compensation rates<br />
and priority for feed-in pursuant to the EEG (Renewable<br />
Energy Act), to 1,366 PJ (14.6%).<br />
Renewable energies accounted for (provisionally)<br />
• 49.6 million TCE of primary energy<br />
demand,equalling a share of 10.9%,<br />
• 122 TWh of gross electric power<br />
generation,equalling a share of 19.8%.<br />
Primary Energy Consumption /<br />
Renewable Energies According to Sectors<br />
2009 2010 2011<br />
Mill. TCE Mill. TCE<br />
1)<br />
Mill. TCE<br />
Electric Power 21.8 24.8 27.9<br />
Heating 14.5 17.5 17.5<br />
Fuels 4.0 4.3 4.1<br />
Total 40.3 46.6 49.5<br />
HT-D21 1) Provisional, source: AGEB<br />
If the emissions trade for climate protection functions<br />
properly, there is no need for the EEG. On the contrary,<br />
its effects run counter to the emissions trade.<br />
But emissions trade in Europe itself achieves almost<br />
nothing in terms of global climate improvement. Although<br />
it reduces the demand for fossil energy sources<br />
in Europe and makes their use more expensive, it does<br />
nothing to reduce the worldwide supply of fossil energy<br />
sources. Unless a worldwide CO 2 trading system<br />
is established and a global climate protection treaty is<br />
concluded, German and European efforts are largely<br />
doomed to failure and are an unnecessary expense for<br />
taxpayers.
Monopoly Commission Critical of EEG<br />
In the view of the Monopoly Commission, the German<br />
Renewable Energy Act (EEG) does not at this time<br />
make any additional contribution to climate protection.<br />
This is the conclusion reached by the Monopoly<br />
Commission in its special assessment entitled “Energy<br />
2011 – Development of Competition with Upside and<br />
Downside”.<br />
In terms of regulatory policies, both the EEG and the<br />
KWK-G (German CHP Act) are redundant against the<br />
backdrop of the European certificate trade. Reductions<br />
in carbon dioxide emissions in Germany “are sold<br />
in other parts of the European Union with the consequence<br />
that the bottom line shows no reduction in<br />
emissions,” notes the Commission.<br />
The Commission’s statements on the goals of the German<br />
government to increase the share of renewable<br />
energies in gross electricity consumption to 35% by<br />
no later than 2020 were “positive with reservations”.<br />
The negative effects of these energy sources are less<br />
harmful than those of fossil or nuclear sources. But<br />
their concrete shape is criticised: “The explicit subsidisation<br />
of generation technologies familiar at this<br />
time, especially wind power and solar facilities, on the<br />
basis of the Renewable Energy Act means that only<br />
technologies for the avoidance of emissions which are<br />
familiar at this time are subsidised.”<br />
Fundamental Change of Systems Overdue<br />
The market regulation for renewable energies has also<br />
led to a broad range of market distortions. The expected<br />
rise in the share of renewable energy sources<br />
in power production will, according to the Monopoly<br />
Commission, presumably cause even greater market<br />
distortions with unfavourable impact on consumers.<br />
The Monopoly Commission consequently regards a<br />
fundamental change to a system more closely in line<br />
with the market to be overdue. However, the opportunity<br />
to reform the EEG and bring it more into line<br />
with the marketplace was passed up during the last<br />
reform in 2011. The Monopoly Commission proposes<br />
a change to a quota system within which electricity<br />
tra<strong>der</strong>s would be obligated to maintain a certain share<br />
of renewable energies in their procurement portfolio.<br />
German Fe<strong>der</strong>al Cartel Office: CO 2 Trade as Model<br />
for Electricity Market<br />
The German Fe<strong>der</strong>al Cartel Office has called for an<br />
allocation system based on the model of the CO 2 certificates<br />
for the energy turnaround. The established<br />
certificate trade is a model for the electricity market<br />
because it leaves the choice of technologies to be used<br />
up to the market.<br />
Trading with the environmental costs of power generation<br />
should be established according to the same<br />
model. The EEG allocation, on the other hand, is “organised<br />
like a planned economy”. High subsidies are<br />
paid out without regard for price or demand signals.<br />
EEG Allocation in <strong>2012</strong> Increased Slightly to About<br />
3.6 Eurocents/kWh<br />
According to information from the transmission grid<br />
operators, German electricity customers paid €13<br />
billion for subsidisation of ecological electricity in<br />
2011. The EEG power has a market value of about<br />
€4.9 billion so that the costs for EEG subsidisation in<br />
65
66<br />
2011 come to about €18 billion and the EEG allocation<br />
amounts to 3.592 eurocents/kWh. The support of<br />
renewable energy sources is moving farther and farther<br />
away from start-up financing for new technologies<br />
and in the direction of permanent subsidisation by<br />
consumers which is increasing in volume and is far in<br />
excess of the subsidies for German coal mining.<br />
The consequence is a higher price for electricity for<br />
German households as seen below:<br />
About Half of the Total Subsidisation for Ecological<br />
Power Went to Solar Energy in 2011<br />
Subsidies for solar energy – subsidised at an unimaginably<br />
high level – were reduced only half-heartedly<br />
by the German government after a lot of discussion<br />
al though drastic price reductions for many of the components<br />
for solar power generation have resulted from<br />
the increased competition, especially with China. Despite<br />
another reduction planned for <strong>2012</strong>, a “subsidi-<br />
Figure 25 Source: BDEW, Status 01/<strong>2012</strong><br />
Strompreis für Haushalte<br />
Electricity Prices for Households<br />
Durchschnittlicher Strompreis eines Drei-Personen-Haushaltes<br />
mit einem Jahresverbrauch von 3.500 kWh/a in Cent/kWh<br />
Averaged monthly electricity prices of a three-person-household<br />
(3,500 KWh/a) in euro<br />
17,11 16,53<br />
0,08<br />
1,79 0,77<br />
0,09<br />
1,79<br />
2,33<br />
1,28<br />
2,28<br />
0,13<br />
0,20<br />
12,91<br />
11,60<br />
13,94 14,32<br />
1,53<br />
1,79 1,79<br />
1,92 1,97<br />
8,62 8,58<br />
0,20<br />
0,25<br />
16,11<br />
1,79<br />
1,79<br />
2,22<br />
9,71<br />
10,23<br />
sation bubble” is being created here without making<br />
any major contribution to power supply and avoidance<br />
of CO 2 . Even if subsidies are reduced in <strong>2012</strong>, this type<br />
of power generation will continue to be many times<br />
more expensive than the price per kWh as traded on<br />
the electricity exchange.<br />
Feed-in of solar power in 2011 barely covered 3%<br />
of the total power demand in Germany. Its contribution<br />
to supply security in the sense of plannable<br />
utilisation of capacity is practically zero. But it<br />
nevertheless cost about €6.5 billion in feed-in<br />
compensation.<br />
According to initial projections, 2011 was a record<br />
year for new connections of photovoltaic systems. An<br />
estimated 7,500 MW went online. Capacity of more<br />
than 25,000 MW may have been reached in 2011. Over<br />
the next 20 years, this will presumably drive the “solar<br />
debt” of the population to substantially more than €120<br />
10,82 11,22 11,75 12,19<br />
13,00<br />
23,21<br />
23,69<br />
24,95<br />
2,05<br />
2,05<br />
0,03<br />
21,65 2,05<br />
20,64<br />
0,13<br />
0,24<br />
3,53<br />
2,05<br />
19,46 1,31 2,05<br />
2,05<br />
17,96<br />
18,66 0,19<br />
1,16<br />
2,05<br />
0,29<br />
1,79 1,79 1,79<br />
17,19 2,05<br />
1,02<br />
1,79<br />
2,05<br />
0,31<br />
0,88<br />
2,05<br />
0,34<br />
1,79<br />
0,31 0,69<br />
3,71 3,78<br />
0,33 0,51<br />
1,79<br />
3,98<br />
0,25 0,42<br />
1,79<br />
3,46<br />
1,79<br />
0,35 1,79<br />
3,30<br />
2,68<br />
2,57<br />
2,48<br />
2,37<br />
14,11 13,89 13,57<br />
1998 1999 2000 2001 2002 2003 2004 2005 2006 2007 2008 2009 2010 2011<br />
Production, transport, distribution VAT Licence fees n Taxes fees, (RES act, cogeneration act) n electricity tax
illion, a figure which must be amortised via electricity<br />
bills.<br />
Renewable Energy Sources Act: Quantities<br />
and Subsidies<br />
TWh million €<br />
TWh<br />
120.0<br />
100.0<br />
80.0<br />
60.0<br />
40.0<br />
20.0<br />
0.0<br />
2006 2008 2010 <strong>2012</strong> 2014 2016<br />
20.000<br />
18.000<br />
16.000<br />
14.000<br />
12.000<br />
10.000<br />
8.000<br />
6.000<br />
4.000<br />
2.000<br />
0<br />
Other Wind Subsidies<br />
Figure 26<br />
Source: Consolidation of the data structure - Leipziger Institute<br />
for Energy, Result Trend-Scenario, RES-medium-term prognosis:<br />
Developments <strong>2012</strong> - 2016 status: 11/2011<br />
“Peak Shaving” of Solar Energy Especially Burdensome<br />
for Hard Coal-Fired Power Plants<br />
Solar energy – even though it receives many times<br />
over the electricity exchange price as feed-in compensation<br />
– makes electricity less expensive above all during<br />
peak hours.<br />
Solar power is generated most strongly at times when<br />
especially large amounts of energy are required: at<br />
midday. Conventional nuclear, coal-fired and gas-fired<br />
power plants must then supply correspondingly lower<br />
quantities of electricity than in the past.<br />
Since power from renewable energy sources is subsidised<br />
by guaranteed feed-in compensation, its price<br />
is not subject to the laws of supply and demand. The<br />
result is the so-called merit or<strong>der</strong> effect: the electricity<br />
otherwise required becomes less expensive overall<br />
because the power plants producing more expensive<br />
electricity never even start up. But this causes the coalfired<br />
power plants to lose the profit margins for electricity<br />
from peak hours which are especially necessary<br />
for their economic operation as mid load power plants.<br />
No Agreement on CCS – Promising Demonstration<br />
Project in Germany Cancelled<br />
No solution to the dispute about the act for un<strong>der</strong>ground<br />
storage of carbon dioxide is in sight. Although the EU<br />
Commission initiated breach of contract proceedings<br />
against Germany in summer 2011 because the relevant<br />
EU directive was not implemented by the deadline, the<br />
national and state governments were unable to agree<br />
on a compromise in the Conciliation Committee. This<br />
stalemate has already led to negative decisions. Vattenfall<br />
has cancelled its planned project, the construction<br />
of a lignite-fired power plant with CO 2 separation<br />
in Lusatia. There is a reluctance to invest billions as<br />
long as the legal situation is unclear.<br />
The energy corporation has been testing the technology<br />
in a pilot project at the industrial site Schwarze<br />
Pumpe since September 2008. According to information<br />
from Vattenfall, about 90% of the carbon dioxide<br />
is separated and liquefied using oxy-fuel technology in<br />
the 30-megawatt facility, built at a cost of €70 million.<br />
The CO 2 is supposed to be transported by pipeline<br />
or tankers to the end storage units where it would be<br />
pressed. The CCS demonstration plant in Jänschwalde<br />
would have been the next step; the technology would<br />
have been used on an industrial scale here. Vattenfall<br />
wanted to start operation of the project with an output<br />
of 300 megawatts and costing €1.5 billion in 2015/16.<br />
1.7 million tons of carbon dioxide would be separated<br />
here every year.<br />
67
68 COUNTRY REPORTS<br />
2011-<strong>2012</strong><br />
AUSTRALIA<br />
Production<br />
Australia has enjoyed continuous growth for 20 years.<br />
The sixth continent made it through the economic crisis<br />
in better condition than comparable industrialised<br />
countries. Even a series of natural disasters at the beginning<br />
and the end of the reporting period had little<br />
impact on growth from an overall economic viewpoint.<br />
The primary reason is the continuing boom in demand<br />
for raw materials, above all coal, iron ore and industrial<br />
metals. However, there are also risks inherent in this<br />
position.<br />
Thanks to its raw materials for energy, Australia is the<br />
ninth-largest energy producer and is the source of 2.4%<br />
of the world’s energy production and 6% of the world’s<br />
hard coal output. Global markets for raw materials and<br />
especially the industries dependent on these raw materials<br />
react especially sensitively to developments on<br />
the sixth continent. Torrential rainfall and rising levels<br />
in the rivers from the end of 2010 and into Q1 2011 led<br />
to flooding across large parts of Queensland. An area<br />
the size of Germany and France combined was practically<br />
un<strong>der</strong>water, and many coking coal mines literally<br />
flooded. One after another, mining companies declared<br />
a case of “force majeure” to their customers. Estimates<br />
concerning how long it would be before coking coal<br />
output again reached the limits of capacity, how many<br />
tons in total would be lost and how long it would take<br />
to fill subsequently the contractual obligations from the<br />
“force majeure” cases were widely at variance with<br />
one another. It was presumed that between 20 and 50<br />
million tons of production would be lost in 2011. In<br />
fact, however, Australia’s exports as a whole declined<br />
by only 19 million tons, although the drop in exports<br />
from Queensland was 31.2 million tons. Then came<br />
the typhoon “Yasi”, which cut a swath of destruction<br />
through the largest sugar cane and banana plantations<br />
in Australia, but by and large spared the coal mines and<br />
especially the ports. In financial terms, Queensland was<br />
affected by a drop of about AUS$400 million in royalties<br />
because of the lost production.<br />
New South Wales (NSW) and Queensland (QLD) are<br />
the sources of 97% of the hard coal. Most of the coking<br />
coal comes from QLD, while steam coal comes primarily<br />
from NSW. Three-fourths of the production is from<br />
opencast pits. The Australian Bureau of Agricultural<br />
and Resource Economics and Sciences (ABARES) had<br />
forecast an increase in steam coal production of 19%<br />
to 225 million tons and a rise in exports of 14% to 163<br />
million tons in <strong>2012</strong>. According to data from ABARES,<br />
seven new mines with annual capacities of about 34<br />
million tons of steam coal started up operation in 2010<br />
and 2011.<br />
Australia’s New Steam Coal Mines<br />
Mine Company State<br />
Capacity in<br />
million tons<br />
Blakefield South<br />
Xstrata/Nippon<br />
Steel NSW<br />
Substitute<br />
Capacity<br />
Cameby Downs Syntech Resources QLD 1.4<br />
Clermont open cut Rio Tinto QLD 12<br />
Narrabri Coal Project Whitehaven Coal NSW 1.5<br />
Moolarben Stage 1 Yancoal Australia NSW 8<br />
Mount Arthur open cut BHP Billiton NSW 3.5<br />
Mangoola Xstrata NSW 8<br />
LB-T1 Source: ABARES, Outlook 2011
As a consequence of the weather conditions, a further<br />
increase in production in Australia’s exporting areas<br />
was not possible in 2011. Output fell instead by 8 million<br />
tons from 344 million tons to 336 million tons.<br />
Smaller quantities of hard coal were mined in Western<br />
Australia (6 million tons), South Australia (3 million<br />
tons) and Tasmania (0.5 million tons) in addition to the<br />
output from Queensland and New South Wales, but this<br />
production was consumed exclusively on the domestic<br />
market.<br />
Lignite as well as hard coal is mined in Victoria.<br />
Usable Production of the Major Production<br />
States of Australia<br />
2009<br />
Million<br />
tons<br />
2010<br />
Million<br />
tons<br />
2011<br />
Million<br />
tons<br />
New South Wales (NSW) 143 149 157<br />
Queensland (QLD) 190 195 179<br />
Total NSW / QLD 333 344 336<br />
Western Australia /<br />
Tasmania<br />
11 11 10<br />
Total 344 355 346<br />
LB-T2<br />
Chinese and Indian companies are competing to obtain<br />
holdings in Australian mines and projects or mining<br />
companies or even to acquire them, or they are seeking<br />
to secure their supplies of coal by concluding long-term<br />
contracts.<br />
Shortly before Christmas 2011, the Chinese company<br />
Yancoal was reported to have submitted an offer to<br />
acquire shares in the coal corporation Gloucester Coal<br />
for about AUS$1.7 billion If the Chinese successfully<br />
complete the acquisition, it will create Australia’s largest<br />
coal corporation listed on the stock exchange; its<br />
market value would be approximately AUS$6 billion.<br />
According to Bloomberg, sales with a total value of<br />
AUS$19.5 billion were transacted in the coal sector in<br />
the past year. Especially the large transactions made the<br />
headlines.<br />
Peabody Energy acquired Macarthur Coal for AUS$3.8<br />
billion, and Rio Tinto took over Riversdale Mining<br />
for AUS$3.4 billion. In addition, a syndicate of Rio<br />
Tinto and Mitsubishi also acquired Coal & Allied for<br />
AUS$1.5 billion, and the Indian Lanco Infratech paid<br />
AUS$750 million for Griffin Coal.<br />
Australia is making great efforts to improve the coal<br />
supply chain, in particular in mining, power generation<br />
and optimised exploitation of the potential of deposits.<br />
23% of Australian mining is done in un<strong>der</strong>ground<br />
operations, 77% in opencast pits. The project list for<br />
steam coal as well as for coking coal is long. Anglo<br />
American is reported to have agreed to an investment<br />
volume of US$1.7 billion for the Greenfield Grosvenor<br />
Project in Queensland. QCoal is planning to start<br />
mining operations in four new coal mines in northern<br />
Bowen Basin. Newspapers have reported that BHP Billiton<br />
has confirmed a total investment volume of almost<br />
AUS$5.5 billion to increase the coking coal capacities<br />
in Queensland (Caval Ridge coking coal mine) by 4.9<br />
million tons per year and steam coal capacities in New<br />
South Wales by about 4 million tons per year. All of the<br />
projects are planned for completion in 2013. The joint<br />
venture BHP Billiton and Mitsubishi Alliance (BMA)<br />
wants to invest AUS$5 billion in the increase of coking<br />
coal production from the new mine project Dannia<br />
and the expansion of existing mines. It has also been<br />
confirmed that a financial investment of AUS$2.5 billion<br />
will increase annual capacity at the Hay Point Coal<br />
Terminal by 11 million tons per year to 55 million tons<br />
per year (from 2014). According to information from<br />
69
70 International Coal, the company wants to start up two<br />
new coking coal mines in Queensland.<br />
The scope and speed of the increase in output depends<br />
on the development of the infrastructure which frequently<br />
turns out to be a bottleneck. But a number of<br />
projects have been initiated here as well with the intention<br />
of eliminating these bottlenecks. The port at<br />
Waratah has agreed to invest a volume of AUS$227<br />
million to increase loading capacities from the current<br />
113 million tons per year to 133 million tons a year and<br />
ultimately to 145 million tons per year by the end of<br />
<strong>2012</strong>. An estimated AUS$1 billion is supposed to be invested<br />
in five larger railway line projects in Hunter Valley<br />
as part of a national construction programme of the<br />
Australian government, including a second railway line<br />
between St. Helier and Muswellbrook and a third track<br />
between Maitland and Minimbah. This should eliminate<br />
above all the congestion along the routes from the<br />
mines to the port in Newcastle.<br />
But there is a lack of local specialists in particular who<br />
could cover the mining industry’s needs for trained experts<br />
for the construction and operation of new mines,<br />
ports and infrastructure.<br />
Australia has about 27% of the world market in world<br />
coal trade: a 55% market share (133 million tons) in<br />
coking coal and a 20% share (148 million tons) in steam<br />
coal. In the long term, Australia has the largest sustainable<br />
expansion potential for steam and coking coal.<br />
Long range, i.e. until 2030, expansion of exports to<br />
400–500 million tons is imaginable. Estimates from the<br />
Bureau of Resources and Energy Economics (BREE)<br />
of the Australian government expect steam coal exports<br />
to rise by an average of 11% to 269 million tons a year<br />
in 2016–2017.<br />
Infrastructure<br />
The weather conditions at the beginning of 2011 were<br />
so violent that even the infrastructure, especially the<br />
railway lines from the mines to the coking coal export<br />
ports in Abbot Point, Dalrymple Bay, Hay Point, Gladstone<br />
and Brisbane, and the port facilities themselves<br />
were damaged. The export was once again the Achilles’<br />
heel for exports, especially in 2011. The government,<br />
the coal-exporting companies and the ports themselves<br />
are making great efforts to improve the situation. At<br />
the coal terminal Dalrymple Bay, for example, more<br />
than 5 million tons of coal were loaded in December,<br />
equivalent to the capacity before the inclement weather.<br />
Export quantities in Newcastle increased back to 112<br />
million tons. The port at Abbot Point could become one<br />
of the world’s largest coal ports. The North Queensland<br />
Bulk Ports Corporation (NQBP) has plans for four new<br />
coal terminals 25 kilometres north of Bowen in Queensland,<br />
each of them with annual capacity of 30 million<br />
tons. These projects fit into the plans of the Queensland<br />
government to realise in total 66 projects at total<br />
expenditures of AUS$142 billion by 2020. As early as<br />
2013, investments in Queensland’s raw material sector<br />
are supposed to be three times what they are today. The<br />
objective is to expand port capacity from its current 242<br />
million tons annually to 787 million tons annually in<br />
2020. But it is questionable whether this will become<br />
reality in view of the political and economic risks such<br />
as a CO 2 tax.<br />
In the short term, however, it is above all essential<br />
to solve the bottleneck problem of the rail transport.<br />
Three projects to add additional tracks are supposed to<br />
alleviate the situation. Additional construction on the<br />
route from Goonyella to Abbot Point and the measures<br />
at Hay Point and Wiggins Island, which are scheduled<br />
for completion by the end of <strong>2012</strong>, will raise the
transport capacities for Queensland to more than 300<br />
million tons a year. In December of last year, the first<br />
coal transport was conducted on the 69-kilometre connection<br />
from northern Bowen Basin to Abbot Point port<br />
which had previously been sorely missed. This investment<br />
by Queensland Rail will double the transport capacity<br />
to Abbot Point Coal Terminal to 50 million tons a<br />
year. It is part of the strategy at QR Rail to expand transport<br />
capacities by 70 million tons a year over the next<br />
three years to a total of 300 million tons per year in 2015.<br />
But the mining companies want to invest as well. The<br />
press has reported BHP Billiton’s confirmation of plans<br />
to construct its own railway line from the company’s<br />
coking coal mines in Bowen Basin to a new coal terminal<br />
in the Abbot Point port. Rio Tinto is planning to<br />
invest AUS$515 million in driverless trains; they would<br />
be the first fully automatic freight trains operated over a<br />
long distance in the world. The track network used by<br />
Rio Tinto for its own 41 trains has a total length of 1,500<br />
kilometres.<br />
About AUS$1 billion is to be invested in five larger expansions<br />
of rail lines in Hunter Valley as part of the Australian<br />
government’s national construction programme.<br />
Exports of the Largest Coal Loading Ports<br />
Coal Loading Ports<br />
Abbot Point<br />
Dalrymple Bay<br />
Hay Point<br />
Gladstone<br />
Brisbane<br />
Total Queensland<br />
Newcastle<br />
Port Kembla<br />
Total New South Wales<br />
2009<br />
Million<br />
tons<br />
15.3<br />
54.2<br />
35.0<br />
58.0<br />
6.3<br />
168.8<br />
92.8<br />
15.0<br />
107.8<br />
2010<br />
Million<br />
tons<br />
17.4<br />
62.7<br />
36.4<br />
61.7<br />
7.6<br />
185.8<br />
95.1<br />
13.3<br />
108.4<br />
2011<br />
Million tons<br />
13.7<br />
49.3<br />
30.8<br />
52.6<br />
6.8<br />
153.2<br />
98.1<br />
14.0<br />
112.1<br />
Total 276.6 294.2 265.3<br />
LB-T3<br />
The coal handling figures for the coal loading ports do<br />
not coincide precisely with the export figures. There<br />
may be customs-related reasons for this.<br />
Almost all of the Australian ports have been expanded<br />
to the capacities shown below in recent years, and in<br />
2010 and 2011 the volumes shown below were transshipped:<br />
Ports<br />
Coal Handling Australian Ports<br />
Coal Handling in<br />
2010<br />
Million tons<br />
Coal Handling in<br />
2011<br />
Million tons<br />
Newcastle 95 114<br />
Port Kembla 13 14<br />
Dalrymple Bay 63 50<br />
Hay Point 36 31<br />
Gladstone 62 53<br />
Abbot Point 17 14<br />
Brisbane 8 7<br />
Total 294 283<br />
LB-T4<br />
Newcastle alone saw the construction of a coal terminal<br />
by the Newcastle Coal Infrastructure Group (NCIG) for<br />
AUS$1 billion. At the end of Phase 1, it will have a capacity<br />
of 30 million tons per year. The second phase of<br />
expansion to an export capacity of 53 million tons per<br />
year is already in the planning stage and is scheduled<br />
to go into operation in 2013/2014; the third phase of<br />
expansion is scheduled to begin in 2015 and increase<br />
capacity to a total of 90 million tons by 2017.<br />
Export<br />
Australia was not able to raise the overall level of its<br />
exports in 2011 because of the adverse weather conditions.<br />
But the demand for Australian coking coal in 2011<br />
remained at the same high level because of the needs of<br />
71
72 the steel industry, which in part recovered quickly from<br />
the economic crisis. The heavy rainfall and the consequent<br />
flooding of large parts of Queensland at the beginning<br />
of 2011 did not affect exports until spring 2011.<br />
Even though the total decline of Australia’s exports by<br />
19 million tons to 281 million tons does not appear so<br />
great, the decline in Queensland of 31 million tons to<br />
152 million tons was significantly greater.<br />
The development of hard coking coal exports in selected<br />
regions is shown below.<br />
Export Development in Selected Regions<br />
Hard Coking Coal<br />
2010<br />
Million<br />
tons<br />
2011<br />
Million<br />
tons<br />
Difference<br />
2010/2011<br />
Million tons<br />
Europe 16.2 15.4 - 0.8<br />
South America 4.7 3.6 - 1.1<br />
Japan 26.5 22.0 - 4.5<br />
India 25.8 24.0 - 1.8<br />
Total 73.2 65.0 - 8.2<br />
LB-T5<br />
In total, exports of coking coal (including semi-soft<br />
coking coal and PCI coal) declined by 17% in comparison<br />
with 2010 to 133 million tons. The largest importers<br />
of Australian coking coal are Japan, China, the EU,<br />
India and Korea. The decline in coking coal from 2010<br />
to Europe and South America was about 1%, to Japan<br />
about 4.5%.<br />
China also decreased its imports of both coking coal<br />
and steam coal by a total of about 3 million tons to 34<br />
million tons.<br />
The reduction in Australia’s exports to China in 2011 in<br />
comparison with 2010 are itemised below:<br />
Development of Australia‘s Exports to China<br />
2010<br />
Million tons<br />
2011<br />
Million tons<br />
Hard Coking Coal 14.0 7.5<br />
Semi-soft Coking Coal (PCI) 8.7 6.7<br />
Steam Coal 14.5 19.9<br />
Total 37.2 34.1<br />
LB-T6<br />
Coal Grade<br />
Coal Exports According to Grades<br />
2010<br />
Million tons<br />
2011<br />
Million tons<br />
Coking Coal (HCC) 102 88<br />
Semi-soft Coking Coal 57 45<br />
Steam Coal 141 148<br />
Total 300 281<br />
LB-T7<br />
Australia was able to increase its exports of steam coal<br />
by about 7 million tons (5%). The torrential rainfall at<br />
the beginning of 2011 was concentrated on Queensland<br />
and not on New South Wales where steam coal makes<br />
up the major output. Japan reduced its imports from<br />
Australia by 4.2 million tons to 64.5 million tons. Sales<br />
to Korea, on the other hand, rose by 3 million tons to<br />
29 million tons.<br />
Most of the Australian coal is still sold in the Pacific<br />
region (for all quality grades):<br />
Sales Development Australia<br />
2010<br />
Million tons<br />
2011<br />
Million tons<br />
Atlantic 26 29<br />
Pacific 274 252<br />
Total 300 281<br />
LB-T8
Australia Introduces CO 2 Certificate Trading and<br />
CO 2 Tax<br />
The Australian parliament has passed a law to levy a<br />
duty of €17 (converted) per ton of CO 2 emissions in<br />
excess of a specified amount from 01 July <strong>2012</strong> on<br />
the country’s 500 largest greenhouse gas producers.<br />
By doing so, Australia becomes the first industrialised<br />
country to follow the lead of the EU, because the CO 2<br />
tax is scheduled to be replaced by an emissions trading<br />
system from 2015. The law was highly controversial,<br />
especially because of its possible negative impact on<br />
the hard coal mining industry as well as on Australian<br />
power prices.<br />
Australia’s key figures are shown here:<br />
Key Figures Australia<br />
2009<br />
Million<br />
tons<br />
2010<br />
Million<br />
tons<br />
2011<br />
Million<br />
tons<br />
Hard Coal Output 348 355 348<br />
Hard Coal Exports<br />
• Steam Coal<br />
• Coking Coal<br />
Imports Germany<br />
• Steam Coal<br />
• Coking Coal<br />
273<br />
139<br />
134<br />
3.9<br />
0.5<br />
3.4<br />
300<br />
141<br />
159<br />
4.3<br />
0.3<br />
4.0<br />
281<br />
148<br />
133<br />
4.3<br />
0.2<br />
4.1<br />
Export Rate in %) 79 85 81<br />
LB-T9<br />
INDONESIA<br />
“Indonesia – the Un<strong>der</strong>rated Island Kingdom”. This is<br />
how the Handelsblatt described the country which receives<br />
almost no attention because it is overshadowed<br />
by China, India or Brazil. But Indonesia has been able<br />
to grow steadily in recent years, in no small part due to<br />
its wealth of raw materials. Over each of the last two<br />
years, the economy grew at a rate of more than 6%, and<br />
the same figure is predicted for <strong>2012</strong>. The South-East<br />
Asian country with the largest population – about 240<br />
million – has been led by a democratic and businessfriendly<br />
government since 2004 and its dynamics are<br />
similar to those of China a few years ago.<br />
Production<br />
Indonesian coal mining continued to expand in 2011.<br />
Provisional estimates show that output increased to<br />
318 million tons – the Indonesian coal mining association<br />
puts the figure at 360 million tons. Output breaks<br />
down into 95 million tons of high-grade hard coal and<br />
223 million tons of low-calorific hard coal (sub-bituminous).<br />
The Largest Hard Coal Producers in Indonesia 2<br />
Company<br />
Output<br />
2010<br />
Million<br />
tons<br />
Output<br />
2011<br />
Million<br />
tons<br />
Exports<br />
2010<br />
Million<br />
tons<br />
Exports<br />
2011<br />
Million<br />
tons<br />
Bumi 61.0 66.0 53.0 61.0<br />
Adaro 42.2 47.9 33.3 37.2<br />
Kideco 28.9 31.6 22.3 34.4<br />
Banpu 23.5 25.0 22.5 25.7<br />
Berau 17.4 19.8 12.7 16.9<br />
Bayan 11.9 11.9 --- 15.5<br />
Bukit Asam 13.1 13.5 4.2 4.7<br />
Total 1) 198.0 215.7 148.0 195.4<br />
Indonesia Total 295 318 240 270<br />
1) Excluding additional purchases, provisional<br />
2) Partly own estimates<br />
LB-T10<br />
Of the total output, 270 million tons were exported and<br />
60 million tons were used for domestic consumption.<br />
The stockpile situation in Indonesia is unknown. The<br />
Indonesian mining industry expects output to increase<br />
73
74 again to as much as 390 million tons per year in <strong>2012</strong>,<br />
whereby 60–70 million tons per year will be required to<br />
cover domestic demand alone.<br />
The tendency of the Indonesian output and with it the<br />
exports is increasingly in the direction of lower calorific<br />
values. The Indonesian hard coal production of 318<br />
million tons is estimated to break down into<br />
• 270 million tons in Kalimantan and<br />
• 48 million tons in Sumatra.<br />
Bumi Resources, Indonesia’s largest coal producer, is<br />
planning to increase its production from an estimated<br />
66 million tons per year today to 75–80 million tons<br />
per year in <strong>2012</strong>. The plan is to increase in particular<br />
the output from the subsidiaries KPC and Arutmin to<br />
80 million tons per year in <strong>2012</strong>. Adaro, Indonesia’s<br />
second-largest producer, wants to raise production by<br />
5 million tons. Banpu is also planning to increase production.<br />
The success of these plans will depend on the<br />
weather as well. Indonesia was also plagued by torrential<br />
rains in 2011, and production was impaired for a<br />
period of time.<br />
Banpu plans to invest US$209 million in its mines Indominco<br />
Mandiri, Trubaindo, Bharinto, Ekatama and<br />
Kitadin on Kalimantan to increase output in <strong>2012</strong> to<br />
a total of 27 million tons a year. Kangaroo Resources<br />
wants to develop two mines, including Pakar, with an<br />
export capacity of 11.6 million tons per year and GKP<br />
(3.5 million tons per year).<br />
The production in Sumatra especially is required for<br />
domestic consumption because the deposits are located<br />
close to the power consumption centre in densely populated<br />
Java. The demand for electricity is also growing<br />
as a consequence of the good economic development.<br />
The state-owned power generator PLN plans to start<br />
operation of 23 new power plants with a total capacity<br />
of 3,351 MW in <strong>2012</strong>. Another 2,191 MW in 2013 and<br />
880 MW in 2014 are scheduled to be connected to the<br />
grid. Hard coal with low calorific values (below 5,000<br />
kcal/kg) from Sumatra is used primarily here for power<br />
generation.<br />
Besides hard coal production, there is lignite output of<br />
about 40 million tons.<br />
Infrastructure<br />
Indonesia currently has six larger deep-water ports<br />
on Kalimantan with an annual handling capacity of<br />
268 million tons, allowing the loading of freighters of<br />
60,000 to 180,000 DWT. In addition, there are ten more<br />
coal terminals nationwide (including Samarinda and<br />
Balikpapan) with an annual capacity totalling 80–100<br />
million tons and a depth which, as a rule, is adequate<br />
for Panamax sizes. Handling capacities are also available<br />
on Sumatra. Moreover, there are numerous offshore<br />
loading facilities for smaller ships.<br />
The large number of loading opportunities has favoured<br />
the strong development of exports. In the long term,<br />
however, continued growth will be dependent on an improvement<br />
in the infrastructure farther away from the<br />
coasts (construction of railway lines) because as of the<br />
moment only the coal reserves which are either in the<br />
proximity of the coasts or have a good river connection<br />
for further transport to the coast have been developed.
The Indonesian government has announced the construction<br />
of a railway line costing US$2.4 billion<br />
which will connect Central and East Kalimantan with<br />
the port Balikpapan on Borneo’s east coast. The first<br />
section will have a length of 185 kilometres and cost<br />
US$1.7 billion. During the second phase, 60 kilometres<br />
of track will be laid in Central Kalimantan. On Sumatra,<br />
PT Bukit Asam Transpacific Railways (BATR) is<br />
planning the construction of a railway line stretching<br />
800 kilometres from Tanjung Enim in South Sulawesi<br />
to Bandarlampung as part of an integrated plan of<br />
coal mining, transport, infrastructure and port logistics.<br />
Construction is set to begin in 2013.<br />
Shipments were handled mainly through the following<br />
ports: Adang Bay, Banjarmasin, Pulau Laut and<br />
Tanjung Bara.<br />
Export<br />
The official export figure for 2011 announced at this<br />
time amounts to about 270 million tons, an increase of<br />
30 million tons in comparison with 2010.<br />
So Indonesia expanded further its leading world market<br />
position as the number one steam coal exporter in<br />
2011. For its part, Indonesia took advantage of the decline<br />
in Chinese exports to export to China, which imported<br />
more Indonesian coal in 2011 than India with 52<br />
million tons. The focus of Indonesian exports is on the<br />
Pacific market. Volumes to the European and American<br />
countries remained almost unchanged at a low level in<br />
2011. The growing domestic demand for coal could<br />
cause Indonesia to lose its dominant position as a coalexporting<br />
country to Australia in a few years.<br />
On the other hand, Indonesia’s coal exports will undoubtedly<br />
also continue to grow. Indonesia’s geographical<br />
location in proximity to the largest consumer<br />
centres China, Japan, South Korea and India is an advantage<br />
for export because of the lower freight costs<br />
and shorter travel times to these countries.<br />
Coal Exports According to Markets<br />
2009<br />
Million<br />
tons<br />
2010<br />
Million<br />
tons<br />
2011 1)<br />
Million<br />
tons<br />
Pacific 216 226 259<br />
Europe 12 13 10<br />
USA 2 1 1<br />
Total 230 240 270<br />
1) Estimated<br />
LB-T11<br />
The largest individual buyers are found in Asia. Exports<br />
to China alone were increased by more than 11%<br />
to 78.0 million tons.<br />
Taiwan<br />
Japan<br />
South Korea<br />
India<br />
China<br />
The Largest Buyers of Indonesian Coal<br />
1) Provisional, in part estimated<br />
LB-T12<br />
2009<br />
Million<br />
tons<br />
25.2<br />
32.1<br />
33.7<br />
37.7<br />
39.4<br />
2010<br />
Million<br />
tons<br />
21.8<br />
26.04<br />
34.7<br />
36.5<br />
68.1<br />
2011 1)<br />
Million<br />
tons<br />
19.1<br />
25.0<br />
36.7<br />
52.8<br />
78.0<br />
Exports to the Asian market will continue to increase.<br />
Kalimantan will remain the focus for exports.<br />
75
76 Key Figures Indonesia<br />
2009<br />
Million<br />
tons<br />
2010<br />
Million<br />
tons<br />
2011<br />
Million<br />
tons<br />
Hard Coal Output 280 295 318<br />
Steam Coal Exports 230 240 270<br />
Imports Germany 0.1 0.1 0.1<br />
Export Rate in %) 82 81 85<br />
LB-T13<br />
A new law regarding foreign ownership in the mining<br />
sector has created substantial uncertainty. Act No. 24 of<br />
March <strong>2012</strong> requires foreign investors to surren<strong>der</strong> the<br />
majority holding in coal mines after 10 years of production<br />
and allows them to retain a maximum interest<br />
of 49%. However, it is still un<strong>der</strong> dispute whether this<br />
applies only to future investments or to current investments<br />
as well. In any case, this uncertainty will lead<br />
to a decline in foreign investments in Indonesian coal<br />
mines. The Indonesian government regulated the coal<br />
market and standardised monthly price indicators for<br />
the steam and coking coal produced in Indonesia in<br />
2010. This system has been firmly in place since September<br />
2010 and serves as the basis for the levying of<br />
royalties and taxes. This so-called Harga Batubara Acuan<br />
(HBA) Index is compiled from a basket of coal and<br />
coking coal indices such as the Energy Publishing NEX<br />
Index, which is based on steam coal with 6,322 kcal/kg<br />
(GAR), water content of 8%, ash content of 15% and<br />
sulphur content of 0.8%.<br />
RUSSIA / UKRAINE /<br />
KAZAKHSTAN<br />
The countries of the former Soviet Union with major<br />
coal production are shown below:<br />
• Russia<br />
• Ukraine<br />
• Kazakhstan<br />
Coal has been able to strengthen the role it plays in all<br />
of these countries due to the higher gas prices tied to<br />
the oil price. The recovery in the steel industry and the<br />
high prices for coking coal on the world market were<br />
especially important factors enabling an increase in output<br />
in comparison with 2010.<br />
Only Russia is of any major significance for the world<br />
market.<br />
Overall, Ukraine was able to increase production by<br />
almost 8% to 82 million tons per year. Steam coal rose<br />
strongly by 12% to 57 million tons per year while the<br />
production of coking coal grew merely by 4% to 25<br />
million tons per year. A comparable level in coking coal<br />
output is expected for <strong>2012</strong>.<br />
Kazakhstan is developing more and more into a coal<br />
exporter. Kazakhstan has large coal deposits as well as<br />
other raw materials. About 108 million tons of hard coal<br />
were produced in 2011, of which about 30 million tons<br />
were exported.
Only Russia will be consi<strong>der</strong>ed in the following remarks.<br />
Last year, the Russian economy repeated precisely the<br />
growth rate in 2010 of 4.3%. This indicates that the<br />
world’s largest energy exporter has recovered from the<br />
dramatic collapse in economic performance of 7.8% in<br />
2009 which was caused above all by the drop in raw<br />
material prices from the middle of 2008.<br />
Coal Production in Russia<br />
2009<br />
Million<br />
tons<br />
2010<br />
Million<br />
tons<br />
2011 1)<br />
Million<br />
tons<br />
Coking Coal 1) 61 67 65<br />
Steam Coal 239 254 271<br />
Total 300 321 336<br />
1) Incl. anthracite<br />
LB-T14 Source: McCloskey<br />
Production<br />
Coal production in Russia rose by 15 million tons to<br />
about 336 million tons, of which 67 million tons were<br />
coking coal. Lower domestic demand caused a decline<br />
of 6% in the demand for hard coal to 185 million tons,<br />
including coking coal. In total, however, production<br />
rose owing to the greater demand from abroad. Initial<br />
estimates indicate that opencast pit output came to<br />
about 231 million tons, while production from un<strong>der</strong>ground<br />
operations amounted to 105 million tons.<br />
The most important area for Russian hard coal output<br />
is in the Kemerovo region, where production in 2011<br />
rose by 3% to 192 million tons. The largest company<br />
in this region, OAO Kuzbassrazrezugol, reduced its<br />
coal production by 3%, however, a consequence of the<br />
concentration on topsoil removal operations aimed at<br />
increasing coal mining output in 2013. Total output<br />
came to 47 million tons a year.<br />
The most important Russian producers developed as<br />
shown below:<br />
Producers<br />
Coal Producers in Russia<br />
2010 *<br />
in million<br />
tons<br />
2011 *<br />
in million<br />
tons<br />
SUEK 87.0 92.2<br />
Kuzbassrazrezugol 49.7 47.0<br />
Siberian Business Union (SDS) 14.0 22.4<br />
Yuzhkuzbassugol 11.2 9.2<br />
Vostsibugol 14.9 15.8<br />
Raspadskaya 7.2 6.3<br />
Yuzhny Kuzbass 13.8 14.0<br />
Yakutugol 9.0 7.8<br />
Total 206.8 214.7<br />
* In part estimated<br />
LB-T15<br />
Exports to the Far East increased as well. The Russian<br />
mining and steel group Mechel mined the first 200,000<br />
tons of coking coal from the Elgen project. SUEK, the<br />
largest Russian producer, secured a licence for development<br />
of the Apatskoe coking coal fields, located in Russia’s<br />
Trans-Baikal region about 700 kilometres from the<br />
Chinese bor<strong>der</strong>. But SUEK has itself declared its plans<br />
to increase production in the Kuzbass Basin by 46% (13<br />
million tons a year) in comparison with 2011 by 2016.<br />
A production target of 32.8 million tons annually has<br />
been set for <strong>2012</strong>, whereby 2/3 of this total is expected<br />
to be exported.<br />
77
78 Infrastructure<br />
Russian Ports<br />
Baltic Sea Ports and North Russia<br />
2009<br />
Million<br />
tons<br />
2010<br />
Million<br />
tons<br />
2011 1)<br />
Million<br />
tons<br />
Murmansk 11.5 9.6 10.8<br />
Vysotsk 2.9 2.3 3.2<br />
Riga 13.8 11.5 13.5<br />
Ventspils 5.3 3.6 6.8<br />
Tallinn (Muuga) 1.6 1.2 0.3<br />
St. Petersburg 2.4 2.2 0.3<br />
Ust-Luga 6.6 7.6 12.3<br />
Miscellaneous 2.1 1.7 0.8<br />
Total 46.2 39.7 48.0<br />
South Russia and Ukraine<br />
Mariupol (Ukraine) 1.5 1.7 1.7<br />
Tuapse (Russia) 3.1 3.5 2.9<br />
Yuzhny (Ukraine) 2.9 2.4 1.0<br />
Miscellaneous 7.5 7.6 7.5<br />
Total 15.0 15.2 13.1<br />
Russia Far East<br />
Vostochny 14.1 14.5 16.2<br />
Vanino 1.2 1.3 1.5<br />
Muchka 4.9 5.0 10.0<br />
Miscellaneous 7.9 11.9 12.3<br />
Total 28.1 32.7 40.0<br />
Total 89.3 87.6 101.1<br />
LB-T16 1) Partly estimated<br />
The Russian national railway has massive problems of<br />
capacity and quality. As coal exports frequently compete<br />
with the transport of wheat, iron ore and steel in the<br />
most important export ports as well, bottlenecks are a<br />
more and more common occurrence for rail transports.<br />
Either there are not enough cars available or the route<br />
to the export ports is blocked by empty cars from innumerable<br />
small railway companies which do not load the<br />
cars because the customers did not accept the transport<br />
prices or the cars are in terrible condition and unusable.<br />
This unsatisfactory situation has prompted the mining<br />
company Mechel to construct its own railway line over<br />
a distance of 321 kilometres, connecting the Elgen coking<br />
coal mine with the Siberian railway network.<br />
The Russians are also seeking to employ their own harbours,<br />
above all in the Baltic region, because of the high<br />
transit fees in the Baltic countries. The 13.5 million tons<br />
that passed through Riga did not suffice to maintain the<br />
port’s position as the leading export point for Russian<br />
coal and it had to surren<strong>der</strong> this honour to Vostochny<br />
(16.2 million tons). Total exports through the Baltic<br />
ports increased by 4%. Coal handlings in the Black<br />
Sea ports remained almost the same. The Far East ports<br />
were once again able to post the greatest growth (22%).<br />
Overall, a highly dynamic development of export capacities<br />
in the Russian Far East ports can be observed.<br />
There will be no lack of port capacities over the next<br />
few years to restrict further increases in exports to the<br />
Pacific market. Nevertheless, new projects have been<br />
initiated, including a coal terminal in Wrangel Bay on<br />
the Sea of Japan with a capacity of 15 million tons a<br />
year.<br />
Export<br />
In response to the rise in demand abroad, Russia exported<br />
about 14 million tons more than in the previous<br />
year, bringing seaborne trade to a total of 101 million<br />
tons. In addition, coal was traded in greenbor<strong>der</strong> with<br />
former CIS states. Total exports came to just un<strong>der</strong> 107<br />
million tons.<br />
Russia is planning to export substantially more coal to<br />
the Asian market in the future. The government wants to
increase exports to the Asian-Pacific markets from the<br />
current 32 million tons per year to 85 million tons by<br />
2030 over the course of three time periods (2011–2015,<br />
2016–2020 and 2021–2030). The planning includes<br />
the expansion of the transport infrastructure, the loading<br />
railway stations and ports in the Russian Far East.<br />
All of this is to proceed parallel to an increase in coal<br />
production in all of Russia of 4% annually from 336<br />
million tons a year in 2011 to 450 million tons a year<br />
in 2030. According to information from the provincial<br />
government, 4 million tons per year of hard coal of all<br />
types will be exported to China from the Trans-Baikal<br />
region where two coal mines are operated on the bor<strong>der</strong><br />
to China from <strong>2012</strong>.<br />
Key Figures Russia<br />
2009<br />
Million<br />
tons<br />
2010<br />
Million<br />
tons<br />
2011<br />
Million<br />
tons<br />
Coal Output 300 321 336<br />
Hard Coal Exports 1) 90 87 101<br />
• Steam Coal 85 80 93<br />
• Coking Coal 5 7 8<br />
Imports Germany 9.3 10.5 11.2<br />
• Steam Coal 8.7 9.3 9.6<br />
• Coking Coal 0.5 1.0 1.2<br />
• Coke 0.1 0.2 0.4<br />
Export Rate in %) 30 27 31<br />
1) Seaborne only<br />
LB-T17<br />
In the region of north-western Europe, imports from<br />
Russia rose by 23% (9 million tons), especially to the<br />
UK, which imported 70% more steam coal (just un<strong>der</strong><br />
12 million tons) than in 2010. In Germany, imports from<br />
Russia increased by 3.2 million tons to 11.2 million<br />
tons, making Russia the most important coal supplier for<br />
Germany.<br />
USA<br />
Production<br />
Production in the USA declined slightly in 2011 in comparison<br />
with 2010 (by 6 million tons to 976 million tons),<br />
although exports rose by 23 million tons to 97 million<br />
tons. There are several reasons for this.<br />
First: competition from shale gas and coal in power<br />
generation. Even though power generation in the US is<br />
still largely based on coal – 93% of the coal consumption<br />
in the USA during the first nine months was used<br />
for power generation – dramatically falling gas prices,<br />
especially from autumn 2011 on, are the harbingers of<br />
a change in fuels; the long-term impact of this change<br />
on American production and world coal trade cannot<br />
clearly be foreseen as of today. As more and more shale<br />
gas at prices ranging between US$2 and US$3 per mm<br />
BTU (1 mm BTU corresponds to 27.777 TCE, so the<br />
price converts to US$56 to US$83 per TCE) is offered<br />
on the market, it is becoming almost impossible for coal<br />
from the Appalachian region in particular as well as from<br />
the Illinois Basin to compete. When transport costs are<br />
included, coal is almost twice as expensive as shale gas.<br />
As a consequence, there is a changeover from coal to gas<br />
taking place in the fuel used for power generation, above<br />
all in the eastern half of North America. Coal from the<br />
Pow<strong>der</strong> River Basin, on the other hand, has substantially<br />
lower production costs and is (still) competitive with<br />
shale gas. Another dramatic decline in output of 50 million<br />
tons is expected for <strong>2012</strong>.<br />
79
80<br />
The large mining companies have already announced the<br />
closure or mothballing of some of the mines. Moreover,<br />
the power plants have stockpiles of 161 million short<br />
tons and are more than full, and the power plant operators<br />
are undoubtedly fulfilling their purchase obligations<br />
pursuant to the long-term contracts usually concluded in<br />
the USA more than they are covering actual need.<br />
Second: the new environmental protection regulations<br />
from the Environmental Protection Agency<br />
(EPA) obligate power plant operators to retrofit their facilities<br />
with purification equipment by 2015 which will<br />
handle emissions of dust, SO 2 , NO x and mercury. These<br />
obligations are based on the “Cross State Air Pollution<br />
Rule” (CSAPR) issued in 2011 and the “Mercury and<br />
Air Toxic Standards” (MACT) issued at the end of 2011<br />
by the EPA. The retrofitting of many of these facilities<br />
is no longer worth the expense because of their age or<br />
their lack of competitiveness with gas. The retrofitting<br />
costs are estimated at US$11 billion. Announcements<br />
of the closure of power plants have already been made.<br />
There are estimates that as much as 70 GW of coal-fired<br />
power plant capacities may be eliminated as a result.<br />
This would be a substantial burden on coal production<br />
in the future.<br />
Third: the economy in the USA has not recovered as<br />
well as hoped, and the development of power consumption<br />
of Americans was correspondingly restrained.<br />
Moreover, the winter was mild. The Energy Information<br />
Agency (EIA) estimates that the share of coal in the<br />
total power generation will fall from the current 49% to<br />
39% in the next 25 years.<br />
Developments in the coking coal sector are completely<br />
opposite. Output could rise in this sector because of<br />
the improvements in steel production from worldwide<br />
demand and higher prices on the world market.<br />
But the USA was not spared from extreme weather conditions<br />
in 2011, either. High water and flooding made<br />
the rivers so important for coal transport (Ohio, Big<br />
Sandy and Mississippi) impassable for ships at times;<br />
while this did not affect production, it certainly impaired<br />
exports.<br />
Output Breakdown USA<br />
2009<br />
Million<br />
tons<br />
2010<br />
Million<br />
tons<br />
2011<br />
Million<br />
tons<br />
Appalachian 1) 326 313 307<br />
Interior 130 135 140<br />
Western 527 534 529<br />
Total 983 982 976<br />
East of Mississippi 416 409 406<br />
West of Mississippi 567 573 570<br />
Total 983 982 976<br />
¹ ) Incl. coal from stockpile processing, incl. lignite<br />
Shown in metric tons<br />
LB-T18 Source: US EIA<br />
The administration wants to exploit coal potential more<br />
strongly by employing mo<strong>der</strong>n technology as a way to<br />
reduce the dependency of the USA on oil imports. The<br />
plan for mo<strong>der</strong>nisation of the energy sector includes<br />
investments in the CCS programme. The US Department<br />
of Energy (DOE) is subsidising a CCS project in<br />
the amount of US$450 million in a new power plant<br />
planned in Texas. Post-combustion technology is supposed<br />
to separate 90% of the CO 2 , which will then be<br />
transported in pipelines to the oil fields in Texas to improve<br />
petroleum output. The costs for the entire project<br />
are budgeted at US$1.7 billion.
Infrastructure<br />
The rise in exports meant that the infrastructure capacities<br />
of railways and ports were utilised very well. Since<br />
the private railway companies with their networks hold<br />
a monopolistic position in some of the output areas, the<br />
freight rates rose substantially. About 81 million tons,<br />
including domestic deliveries (about 10 million tons),<br />
were handled by the American seaports in 2011. There<br />
are technical reasons related to customs which account<br />
for the discrepancy between coal handling and export<br />
volumes. The inland ship capacities and coal handling<br />
capacities could cause a bottleneck to additional exports.<br />
While previous investments in new port capacities<br />
were made primarily on the East Coast, there has<br />
been an increase in planning activities (6 projects) on<br />
the West Coast for future exports to Asia. However,<br />
these projects are also meeting with opposition and protests<br />
from the populace, and the environmental authorities<br />
want to have an overall appraisal showing all of the<br />
possible effects of the export of large quantities of coal<br />
from Wyoming and Montana to Asia.<br />
Utilisation of Port Capacity USA<br />
Port Terminal<br />
Hampton Roads Lamberts Point<br />
DTA<br />
KM Pier IX<br />
Baltimore Chesapeake<br />
CNX Marine (Consol)<br />
2009<br />
Million<br />
tons<br />
2010<br />
Million<br />
tons<br />
2011 1)<br />
Million<br />
tons<br />
} 24.79 } 30.1 } 38.3*)<br />
} 5.75 } 13.7 } 19.7<br />
Mobile 7.09 9.7 12.5<br />
Lower River IMT (2/3 KM)<br />
United (Electrocoal)<br />
IC Marine Terminal<br />
} 4.27<br />
} 8.49 } 11.0<br />
Total 1) 41.90 61.99 81.5<br />
LB-T19 1) Some figures estimated<br />
*) Source: IHS/McCloskey 10/02/<strong>2012</strong>, p. 25<br />
Export / Import<br />
The USA is heavily oriented to Europe in its exports<br />
and was able to increase its exports of coking coal<br />
once again by 12 million tons; the rise in steam coal<br />
exports of 16 million tons was even more pronounced.<br />
Seaborne export rose by about 27 million tons to a total<br />
of 91 million tons in 2011. Overland exports to Canada<br />
represented another 6 million tons.<br />
Exports USA 2011<br />
Coking Coal<br />
Million<br />
tons<br />
Steam Coal<br />
Million<br />
tons<br />
Total<br />
Million<br />
tons<br />
Seaborne 59.3 31.4 90.7<br />
Overland (Canada) 3.8 2.2 6.0<br />
Total 63.1 33.6 96.7<br />
LB-T20 Source: McCloskey<br />
Seaborne exports of about 91 million tons focused on<br />
Europe (37 million tons) and Brazil (8 million tons).<br />
Germany was once again the largest customer in Europe,<br />
procuring 8.1 million tons of coking coal and<br />
steam coal. In contrast, imports, especially of Colombian<br />
coal, declined sharply. The USA remains a net exporter.<br />
Owing to the stiff competition between shale gas<br />
and steam coal on the one hand and restrained demand<br />
in Europe on the other, there might be signs of a development<br />
which would shift exports from the Atlantic<br />
market to the Pacific market in the future. Substantial<br />
quantities of coal were exported in 2011; 6 million tons<br />
went to Japan, 9.5 million tons to South Korea, and additional<br />
volumes were exported to India and China. The<br />
extent to which American coal is competitive in Asia<br />
depends on many factors. Transport costs are a significant<br />
consi<strong>der</strong>ation.<br />
81
82<br />
The level of sea freight rates is low at the moment. If it<br />
becomes possible in the future to ship Pow<strong>der</strong> River Basin<br />
coal from the West Coast to Asia, American coal will<br />
no doubt find its way to China and India for a long time.<br />
Import-Export Balance USA (Seaborne)<br />
2004<br />
Mill.<br />
tons<br />
2007<br />
Mill.<br />
tons<br />
2008<br />
Mill.<br />
tons<br />
2009<br />
Mill.<br />
tons<br />
2010<br />
Mill.<br />
tons<br />
2011<br />
Mill.<br />
tons<br />
Export (seaborne) 26 37 53 44 64 91<br />
Import (seaborne) 25 31 31 19 16 11<br />
Balance 1 6 22 25 48 80<br />
LB-T21<br />
Imports from Colombia declined by 4.7 million tons to<br />
8.4 million tons. Venezuela exported 0.7 million tons<br />
to the USA.<br />
Ongoing export of steam and coking coal is expected<br />
for <strong>2012</strong>. If world market prices remain high and freight<br />
rates remain low, steam coal should continue to be of<br />
interest for the Atlantic market as well as for the Asian<br />
market. Owing to the price sensitivity of American coal,<br />
however, much depends on the total transport costs and<br />
the sea freight rates.<br />
Key Figures USA<br />
2009<br />
Million tons<br />
2010<br />
Million tons<br />
2011<br />
Million tons<br />
Hard Coal Output 983 982 976<br />
Hard Coal Exports 53 74 97<br />
• Steam Coal 19 23 34<br />
• Coking Coal 34 51 63<br />
Hard Coal Imports 19 18 13<br />
Imports Germany 5.1 5.7 8.1<br />
• Steam Coal 3.2 2.7 5.1<br />
• Coking Coal 1.9 3.0 3.0<br />
Export Rate in %) 5 8 10<br />
LB-T22<br />
COLOMBIA<br />
Production<br />
Hard coal output in Colombia rose strongly in 2011<br />
and reached a record high level. In total, production increased<br />
by about 11 million tons to 85.8 million tons.<br />
The achievement of the production target is noteworthy<br />
because production was impaired by a number of circumstances<br />
of varying intensity and duration. To start<br />
with, the general La Niña weather phenomenon and the<br />
accompanying heavy rainfall had Colombia firmly in<br />
their grip in the spring of 2011. However, the rainfall<br />
affected most of all the coal mines in central Colombia,<br />
not the coal regions La Guajira and Cesar in the north of<br />
Colombia which are relevant for exports to Europe. But<br />
Colombia was once again hit by torrential rainfall in the<br />
fourth quarter of 2011. Production in the opencast pit<br />
mines La Loma, Prodeco and Cerrejón as well as in the<br />
regions Santan<strong>der</strong>, Norte Santan<strong>der</strong>, Boyaca and Cumdinamarca<br />
was subject to substantial disruption. Then<br />
there were short strikes and terrorist attacks in the form<br />
of bombings of railway lines and mines. On the other<br />
hand, the companies have prepared themselves for the<br />
rainfall, stockpiled larger quantities in some of the ports<br />
and increased total production so that the planned targets<br />
could be reached.<br />
The Colombian Ministry of Energy expects total production<br />
of 97 million tons for <strong>2012</strong>, corresponding to<br />
an increase of about 10 million tons (just un<strong>der</strong> 11%)<br />
in comparison with 2011. Cerrejón alone, the largest<br />
producer, produced 32 million tons (previous year 30.2<br />
million tons) which was both a record for the year and<br />
about 36% of the total Colombian output. If the producers’<br />
expansion plans are all carried out as reported,<br />
Colombia’s coal production could increase by as much<br />
as 60 million tons to about 145 million tons in 2020.
Cerrejón is planning to increase output from 32 million<br />
tons a year to 40 million tons a year by the end of 2015<br />
while Drummond, in a joint venture with Itochu, wants<br />
to achieve an increase of 14% to 25 million tons in <strong>2012</strong><br />
and to 40 million tons in 2013. MPX wants to have annual<br />
production of 5 million tons by 2015, followed by<br />
another increase to 35 million tons by 2020; output in<br />
Vale’s Hatillo Mine is supposed to rise from the current<br />
3–4 million tons a year to 9.5 million tons a year in<br />
2014. Added to this are the Cerrolargo Sur deposits in<br />
the Cesar regions which have not yet been exploited;<br />
reserves here are estimated at 500 million tons.<br />
Metallurgic coal output hovered at the previous year’s<br />
level of 4 million to 4.5 million tons. But the coking<br />
coal industry, especially in central Colombia, could<br />
grow substantially in the coming years. According to<br />
information from the companies, Colombia could expand<br />
output of coking coal to between 8 million and 10<br />
million tons a year by 2015. An increase of 7.2 million<br />
tons is planned for <strong>2012</strong>. Asian companies are working<br />
especially hard on obtaining coking coal production<br />
licences in Colombia.<br />
Criticism of the conditions in coal mining in Colombia<br />
not justified<br />
NGOs and Greens in Germany and neighbouring European<br />
countries repeatedly criticise the violation of<br />
human rights and the working and environmental conditions,<br />
and parliamentary initiatives are frequently<br />
placed on the agenda. But these accusations are false<br />
with respect to today’s situation for coal mining companies,<br />
above all in the north of Colombia. In fact, they are<br />
completely unjustified with respect to the progress and<br />
past experience with resettlements and the indigenous<br />
population as well as for the populace there and the coal<br />
miners. Nor do the claims of harmful ecological effects<br />
of mining activities reflect the manifold and extensive<br />
efforts made by the companies to recultivate the mined<br />
areas, the preparation of these areas for subsequent use<br />
and the compliance with voluntarily established tolerance<br />
values which are in part stricter than those in the<br />
law. Occupational safety and wage levels are in line<br />
with domestic and international standards or exceed<br />
them significantly. The mining companies in Colombia,<br />
especially those in coal exports, are highly appreciated<br />
as both employers and entrepreneurs, in particular<br />
because of their public commitment to responsibility<br />
for safe and healthy working conditions, environmental<br />
protection and compliance with social and ethical<br />
standards as well as with constitutional procedure.<br />
These companies are as fully aware of their responsibility<br />
as the German companies importing coal. Many<br />
companies which are also members of the VDKi stand<br />
firmly committed to the ten principles of the UN Global<br />
Compact as the key instrument of obligation to compliance<br />
with ecological, social and ethical standards of all<br />
of the parties involved in the international coal supply<br />
chain. The UN Global Compact, initiated in 2000, is<br />
the largest initiative of socially committed companies<br />
worldwide. All of its members have un<strong>der</strong>taken the<br />
obligation to honour human rights, to provide humane<br />
working conditions, to comply with environmental<br />
protection standards and to fight corruption. Moreover,<br />
many coal-importing companies in Germany<br />
• have their own principles of corporate social responsibility<br />
(CSR),<br />
• maintain principles and guidelines for responsible<br />
procurement which are mandatory within the company,<br />
• establish special corporate policies for purchasing<br />
which are obligatory for suppliers,<br />
83
84 • engage internationally independent and experienced<br />
auditors to conduct audits on behalf of the companies<br />
themselves,<br />
• form their own opinions through visits and meetings<br />
on the sites.<br />
The large mining companies in Colombia as well as<br />
many of the German coal-importing companies are listed<br />
on stock exchanges, some of them on the Dow Jones<br />
Sustainability Index, and strive for transparency and<br />
continuous improvement in current conditions on the<br />
sites. Any potential for improvement determined during<br />
audits or supplier qualification is discussed with the<br />
suppliers and concrete measures for exploiting this potential<br />
are agreed. The promise of the greatest possible<br />
contribution to sustainable, responsible procurement of<br />
import hard coal cannot be realised without cooperation<br />
in a spirit of trust among importers, coal producers<br />
and other stakehol<strong>der</strong>s. The criticism heard from some<br />
that the royalties paid by mining companies to the municipalities<br />
frequently do little to benefit the populace<br />
in the communities affected by mining operations by<br />
providing an improved infrastructure has prompted Colombian<br />
lawmakers to pass a law containing new regulations<br />
for the distribution of the royalties. Revenues<br />
of US$5.3 billion are expected in the coal-producing<br />
regions between <strong>2012</strong> and 2020. These revenues are<br />
now earmarked for payment to the central government<br />
to prevent local mismanagement and corruption, and<br />
they will be used from there for the development of the<br />
poorer regions of Colombia and the improvement of the<br />
infrastructure, including the improvement of transport<br />
facilities for the coal industry, especially the coking<br />
coal industry in central Colombia.<br />
Exporter<br />
Exports According to Companies<br />
2009<br />
Million<br />
tons<br />
2010<br />
Million<br />
tons<br />
2011<br />
Million<br />
tons<br />
Cerrejón 30.3 31.5 32.1<br />
Drummond 20.5 22.5 24.3<br />
Prodeco / Carbones De la Jagua 9.0 12.1 14.6<br />
Vale / Carbones del Caribe 1.8 2.1 4.8<br />
Coal Corp. (*incl. coking coal) 1.5 1.2 1.5<br />
Other (incl. central Colombia) 3.2 2.9 3.9<br />
Total 66.3 72.3 81.2<br />
LB-T23<br />
Export<br />
According to information from the companies, Colombia<br />
was able to increase its exports by 9 million tons<br />
to 81.2 million tons, enabling Colombia to maintain its<br />
position as the fourth-largest coal-exporting country<br />
(seaborne).<br />
Colombian coal goes primarily to the Atlantic market.<br />
Of the total exports of steam coal, only 2 million tons<br />
went to the Pacific region and about 56 million tons<br />
were shipped to the Atlantic market. Exports to Europe<br />
grew by 17.8 million tons. Imports to Germany<br />
increased by 36% to a total of 10.8 million tons. The<br />
Asian market had the greatest decline in exports on a<br />
percentage basis. 59% (4.8 million tons) less hard coal<br />
was exported in 2011 to China alone. Exports to America<br />
also declined by 18% (18.3 million tons).<br />
The lion’s share of the exports, 32 million tons, come<br />
from the opencast pit Cerrejón in the province La Guajira,<br />
followed by Drummond with 24.3 million tons; the<br />
latter’s opencast pits are located in the neighbouring<br />
district Cesar.
Steam Coal Exports – Structure of Colombia<br />
2009<br />
Million<br />
tons<br />
2010<br />
Million<br />
tons<br />
2011<br />
Million<br />
tons<br />
America 24.5 22.3 18.3<br />
North America (USA + Canada) 16.0 13.1 8.4<br />
South and Central America 8.5 9.2 9.9<br />
Asia --- 8.8 1.9<br />
Europe 38.9 38.1 55.9<br />
Mediterranean Region 10.5 11.3 21.0<br />
North-west Europe 28.4 26.8 34.9<br />
Total 63.4 69.2 76.1<br />
LB-T24<br />
Smaller quantities of coking coal and coke are not included<br />
in the export figures.<br />
Key Figures Colombia<br />
2009<br />
in million<br />
tons<br />
2010<br />
in million<br />
tons<br />
2011<br />
in million<br />
tons<br />
Hard Coal Output 70.0 74.4 85.8 1)<br />
Hard Coal Exports<br />
• Steam Coal<br />
• Coking Coal<br />
66.3<br />
63.4<br />
2.9<br />
72.2<br />
69.2<br />
3.0<br />
81.2<br />
76.1<br />
5.1<br />
Imports Germany 5.2 7.9 10.8<br />
Export Rate in %) 95 98 94<br />
1) provisional<br />
LB-T25<br />
Infrastructure<br />
The major part of the existing infrastructure for transport<br />
and export ports is utilised at a high level of capacity.<br />
Most of the coal is transported by rail to the coal<br />
terminals. The ownership circumstances of the Fenoco<br />
railway (Ferrocarriles del Norte de Colombia S.A.), the<br />
lines on which above all coal from the Cesar mining<br />
area is transported, have changed. A number of producers,<br />
including Drummond, Prodeco, Vale and Goldman<br />
Sachs, have acquired shares in the railway, which<br />
means that Drummond is no longer able to use the full<br />
capacity alone as it did in the past. An average of 24<br />
coal trains run every day from the Cesar region to the<br />
Caribbean ports. In 2009, Fenoco was or<strong>der</strong>ed to plan a<br />
detour with a length of about 54 kilometres around residential<br />
areas as a means of noise and environment protection.<br />
Fenoco has proposed a 2-phase solution: first a<br />
second track with a length of 126 kilometres, then two<br />
by-passes around the residential areas.<br />
If the plan to double coal output to 150 million tons<br />
per year by 2020 is to become reality, there will be the<br />
need for an ambitious expansion of the entire coal infrastructure<br />
to the export ports. Cerrejón is investing<br />
US$1.3 billion for expansion of capacity to 40 million<br />
tons per year. The money is going to technical improvement<br />
of the railway tracks and to the port Puerto Bolivar.<br />
A second wharf and another ship loa<strong>der</strong> will be<br />
constructed here. Drummond and Glencore are at this<br />
time constructing two new direct loading facilities in<br />
the vicinity of Ciénaga so that the increased volumes<br />
can be exported, but there are also environmental protection<br />
reasons for the construction: ships in Colombia<br />
must all be loaded using direct loading facilities beginning<br />
of 2014.<br />
The port expansion of Puerto Brisa featuring planned<br />
annual capacity of 25 million tons in the Caribbean has<br />
been delayed by a suit filed by the indigenous Indios.<br />
Operational start-up is not expected before the end of<br />
<strong>2012</strong> at the earliest.<br />
The transport system, especially rail transport, is a major<br />
Achilles’ heel. Colombia therefore intends to announce<br />
a ten<strong>der</strong> for private investors for the construction<br />
and operation of a new railway line with a length<br />
of 1,000 miles at a cost of US$3 billion to connect the<br />
85
86 coal mines near Bogotá with the new loading ports on<br />
the Caribbean coast. Completion is planned for 2014.<br />
The capacities have been increased slightly in the<br />
smaller coal ports, but they are not being utilised in full.<br />
A syndicate of mine operators un<strong>der</strong> the lea<strong>der</strong>ship of<br />
Prodeco is participating in the construction of Puerto<br />
Nuevo, a new coal terminal with a coal handling capacity<br />
of 30 million tons a year and direct loading of ships.<br />
The expansion of the Panama Canal now in progress<br />
and scheduled for completion in 2014 will be of greater<br />
significance in the long run for Colombian exports. The<br />
expansion is regarded to be the key to increasing exports<br />
to the Pacific region because it will then be possible<br />
for smaller Capesize ships to use the canal instead<br />
of having to sail around the Cape of Good Hope.<br />
REPUBLIC OF SOUTH AFRICA<br />
Coal is an important economic factor for South Africa.<br />
In 2009, the coal mining industry had the highest sales<br />
value within the mining industry, posting trading volume<br />
of 65.3 billion rand and outperforming platinum<br />
(58 billion rand) and gold (49 billion rand).<br />
Coal covers about 70% of the South African primary<br />
energy demand and contributes about 30% to coverage<br />
of the petrol demand in South Africa. 93% of the<br />
electric power is generated using coal. Coal exports<br />
account for about 25% of the coal output. More than<br />
70,000 people are employed in coal mining. As it is so<br />
important, a “South African Coal Road Map” was established<br />
in 2010; it concerns the present structure of<br />
the coal industry and its future developments over the<br />
next 25 years. It is a platform for exchanging and disseminating<br />
information among the various stakehol<strong>der</strong>s<br />
in the industry.<br />
The draft for an energy plan covering the next twenty<br />
years has been evolved for use in energy policies. The<br />
use of coal in the power generation mix is highly dependent<br />
on the targets for the reduction of CO 2 . The<br />
Ministry of Finance has proposed the introduction of a<br />
CO 2 tax on primary energy sources in the amount of 120<br />
rand (about US$16) per ton of CO 2 equivalent. However,<br />
this tax would not be levied below a certain level<br />
of emissions. The Ministry of Energy has proposed a<br />
“balanced scenario” between low CO 2 emissions and<br />
low costs for electricity. Energy capacity is targeted to<br />
rise from the current 40 GW to 92 GW; the absolute<br />
quantity of coal used for this would presumably be<br />
higher than today’s level despite the improvements in<br />
degree of efficiency. An overall increase in output for<br />
both domestic consumption and for export from about<br />
250 million tons in 2010 to more than 350 million tons<br />
in 2020 has been forecast.<br />
Production<br />
South African production in 2011 of presumably 252<br />
million tons remained almost at the level of 2010. There<br />
are a number of reasons for this stagnation in output,<br />
which has been observed for quite a while. One, the<br />
contracts concluded by the state-owned power utility<br />
Eskom for the domestic consumption for power<br />
generation are still largely long-term contracts which<br />
include a long-term fixed price or a cost-plus agreement<br />
and are presumably substantially below the world<br />
market prices or the export prices for South African<br />
coal. According to its own information, Eskom has<br />
contractually secured or obtained binding commitments<br />
for about 95% of its need for coal until 2018.
Nevertheless, Eskom regards the long-term procurement<br />
of South African coal for its own needs to be a major<br />
challenge.<br />
Moreover, the current railway and port infrastructure<br />
cannot be used as an incentive for new investments<br />
in coal mines because even today’s production has to<br />
fight for every bit of free capacity. Furthermore, many<br />
of the so-called junior mining companies do not have<br />
access to the existing infrastructure, a circumstance<br />
which limits their opportunities to obtain funds from<br />
the market for the development of new coal mines.<br />
There are two other developments which might have<br />
a negative impact on new production sites: one is the<br />
discussions in the government regarding a “nationalisation”<br />
of the mining sector, the second the concerns<br />
about the levying of an export tax. This would require<br />
payment of a capital gains tax of 50% on the sale of<br />
mining rights, intended to put a stop to speculations.<br />
The African National Congress rejected the nationalisation<br />
of the mining industry at the end of 2011, but the<br />
tax remains as a new uncertainty factor.<br />
The domestic market in South Africa consumed the<br />
following quantities in 2011:<br />
Consumption of the Domestic Markets<br />
2009<br />
Million<br />
tons<br />
2010<br />
Million<br />
tons<br />
2011 1)<br />
Million<br />
tons<br />
Power Generation 112 121 126<br />
Synthetic Fuels (Sasol) 45 45 45<br />
Industry / Domestic Fuel 15 15 7<br />
Metallurgical Industry 3 3 3<br />
Total 175 184 181<br />
1) provisional<br />
LB-T26<br />
This is why the many new companies un<strong>der</strong> the BEE<br />
regime (Black Economic Empowerment) have regrettably<br />
not yet made any contributions to a significant expansion<br />
of production. In some cases, BEE companies<br />
have done nothing more than take over existing mines<br />
from large mining companies. However, exploration<br />
progress in the Waterberg Coal Field is accelerating so<br />
that this region should play a greater role in coal mining<br />
in the future. Production from these mines could double<br />
in the next 5 years, provided that adequate transportation<br />
capacities are available. Other coal fields in Limpopo<br />
Province are also being explored, but the focus<br />
here is on coking coal. A major part of the steam coal<br />
for export and the domestic market is produced in eight<br />
large mines, each of which has output of more than 10<br />
million tons a year. Five companies stand for 80% of<br />
the coal production in South Africa: Anglo-American,<br />
Exxaro, Sasol, BHP Billiton and Xstrata.<br />
There has been no change in the critical condition<br />
of the supply of electric power to South African Industry.<br />
The state-owned company Eskom is responsible<br />
for 96% of the power generation in South Africa.<br />
Electricity prices are regulated by the national regulator.<br />
Eskom’s installed capacity amounts to 40,870 MW,<br />
of which 34,658 MW is coal-fired. Eskom fires 120 to<br />
130 million tons of coal per year for power generation,<br />
corresponding to about 70% of the total consumption<br />
in South Africa. The quality of South African coal has<br />
declined in recent years. This has prompted Eskom to<br />
renegotiate coal supply agreements with the aim of obtaining<br />
the required quality. But the price for the coal<br />
procured pursuant to the newly concluded contracts<br />
has increased. The state-owned utility company Eskom<br />
has pointed out that South Africa’s long-term coal<br />
supply for coal-fired power plants is at jeopardy if the<br />
coal promotion policies are not revised. It is especially<br />
87
88 important to achieve a balance between coal export and<br />
coverage of domestic energy demand. Eskom sees the<br />
overriding problem in the fact that coal grades with<br />
higher ash content, previously purchased only by Eskom,<br />
are now being exported; besides putting pressure<br />
on domestic coal prices pushing them upwards, there<br />
could be a shortfall of about 40 million tons per year for<br />
power generation in 2018. In addition, about 40 million<br />
tons a year are used for coal liquefication, especially for<br />
the Sasol petrol production.<br />
New construction of coal-fired power plants by Eskom<br />
will presumably increase domestic consumption again<br />
as of 2013. Eskom is planning to increase its total power<br />
generation capacities by 12,000 MW over the next<br />
10 years.<br />
BHP Billiton has announced that it will be developing<br />
a new coal mine – Van Dyks Drift Central – at a cost<br />
of between US$500 million to US$5 billion. There are<br />
also numerous M&A activities to be reported. Glencore<br />
has acquired a 14.1% interest in Optimum Coal, which<br />
operates the Optimum opencast pits and mines in the<br />
Mpumalanga Coal Field. Shortly before, the latter had<br />
acquired the Remkoogte exploration rights in South<br />
Africa’s Limpopo Province from BHP Billiton. Once<br />
fully developed, these deposits could produce up to 4<br />
million tons of coal a year. Glencore has also acquired a<br />
stake of 43.66% in Umbeco Mining at a price of about<br />
US$111 million. This gives Glencore access to South<br />
Africa’s main coal field in Mpumalanga and to an (additional)<br />
1.5 million tons in export rights during Phase<br />
V of the coal terminal Richards Bay. Umbeco itself operates<br />
three steam coal mines – Middelkraal, Kleinfontein<br />
and Klippau – with total production capacity of 2.3<br />
million tons a year.<br />
Resource Generation Limited has concluded a contract<br />
with the Indian company Integrated Coal Mining Limited<br />
for the supply of 139 million tons of steam coal<br />
from the planned Boikarabelo Mine over the next 38<br />
years. Production is slated to begin at the end of 2013.<br />
There is a real boom in coal production going on in the<br />
countries neighbouring South Africa. Many new projects<br />
have been launched in Botswana, Mozambique<br />
and Zimbabwe.<br />
MOZAMBIQUE<br />
Mozambique is well on the way to becoming a respected<br />
coal exporter in the coming years. The contribution<br />
made by mining to economic growth (GDP) in Mozambique<br />
for the next three years is estimated at 11%.<br />
Moreover, the country will have tax revenues from exports<br />
in the future. The project “Moatize” of Vale there<br />
is especially far advanced; ultimately, the aim is to expand<br />
it to a capacity of 26 million tons annually (11<br />
million tons p.a. of coking coal / 15 million tons p.a.<br />
of steam coal). The first 620 kilotons were produced<br />
there in December 2011. Vale has also made progress in<br />
the infrastructure. Vale intends to connect the Moatize<br />
Mine with the port Nakala, located 900 kilometres away<br />
in the north of Mozambique. However, the granting of<br />
the licence was linked to the condition that a part of the<br />
railway line is built through Malawi in the form of a<br />
137-kilometre-long extension in the south of Malawi.<br />
The railway line is supposed to have an annual capacity<br />
of 11 million tons with the potential to be expanded further.<br />
The railway line is supposed to go into operation<br />
in three years. Until now, the coal has been transported<br />
over the Sena Line to Tete Province. Beacon Hill has<br />
also delivered the first shipment of coal for export from
the Moatize Mine to Tete Province. It was loaded in the<br />
port of Beira. But many other companies are also investing<br />
significant amounts at this time to develop the<br />
rich coal deposits in southern Africa. The seams around<br />
Moatize (23 billion tons) are currently regarded as the<br />
largest coal region in the world which has not yet been<br />
developed. In the meantime, 140 licences for exploration<br />
and mining, most of them for Tete Province, have<br />
been granted.<br />
Source: Platts, UNCTAD<br />
Mozambique coal and power<br />
The coal developer Riversdale from Mozambique has<br />
been acquired by Rio Tinto for AUS$4 billion. The company,<br />
which is listed on the Australian stock exchange,<br />
has anthracite coal mines in Zululand in South Africa,<br />
but its major projects are the coking coal mines in Benga<br />
and Zambezi in Mozambique. Production is supposed<br />
to reach the level of 5 million tons a year in 2013, and<br />
the first shipments were supposed to have been exported<br />
through the port at Beira at the end of 2011.<br />
An Indian syndicate of five state-owned companies is<br />
planning to offer US$1 billion for a 59% interest in<br />
the company Minas de Revuboe. Minas de Revuboe<br />
is developing an opencast pit for coking coal in Tete<br />
Province for US$500 million. The mine is supposed to<br />
produce 5 million tons a year from 2014. Anglo American<br />
is also reported to be interested in the acquisition of<br />
this mining company.<br />
Infrastructure Southern Africa<br />
A number of infrastructure projects, especially railway<br />
projects, have been initiated in southern Africa and will<br />
have substantial impact on the future coal supply chain:<br />
• The Trans-Kalahari Railway, 1,400 kilometres long,<br />
is supposed to connect Botswana’s coal fields with<br />
the port at Walvis Bay. Costs are estimated at US$5<br />
billion to US$9 billion. When fully complete, it will<br />
transport 60 million tons of coal a year. Operation<br />
is set to begin in 2017. This will make it possible<br />
to move coal reserves from Botswana, Namibia and<br />
Mozambique.<br />
• The improvement of the railway line to Beira (Sena<br />
Line) is top priority because it is expected to secure<br />
exports for the next few years. But additional<br />
capacities will be required after that.The first<br />
89
90 general discussions about connecting the areas of<br />
Mozambique’s coal fields with the ports of Maputo,<br />
Beira and Nahala have taken place. But there is a<br />
lot of uncertainty, especially concerning the nondiscriminatory<br />
access to the railway lines for all<br />
mine operators.<br />
• Ncondezi Coal has been awarded a contract by Rio<br />
Tinto and Minas de Revuboe for the development<br />
of a rail and port project with an annual capacity of<br />
25 million tons. The railway line is supposed to connect<br />
Mozambique’s Tete Province with the northern<br />
part of the Zambezi Delta, a distance of about<br />
500 kilometres. This would be an alternative to the<br />
route to Beira and Nahala in the north, which has<br />
been designed by Vale for an annual capacity of 20<br />
million tons to handle its export requirements. The<br />
new port on the green meadow could have an export<br />
capacity of 100 million tons a year in its final stage<br />
of completion.<br />
Infrastructure South Africa<br />
The South African infrastructure – especially rail transport<br />
– is still not satisfactory. The number of train <strong>der</strong>ailments<br />
suffered by Transnet along the route to Richards<br />
Bay (RBCT), most of which caused a shutdown lasting<br />
several days, has declined. The state-owned railway<br />
company Transnet has drawn up a 10-year maintenance<br />
plan with a total volume of US$4.5 billion. Transnet has<br />
also invested in new locomotives. In addition, Transnet<br />
wants to invest US$750 million in the expansion of the<br />
railway line to an annual capacity of 80 million tons<br />
so that it can meet the obligations recently accepted to<br />
transport coal from the Boikarabelo Project in Limpopo<br />
Province to Richards Bay and other commitments.<br />
Exports Through South African Ports<br />
2009<br />
Million<br />
tons<br />
2010<br />
Million<br />
tons<br />
2011<br />
Million<br />
tons<br />
RBCT 61.1 63.4 65.5<br />
Durban 0.9 0.9 0.7<br />
Maputo/Mozambique 1.3 1.3 1.1<br />
Total 63.3 65.6 67.3<br />
LB-T27<br />
RBCT previously had a loading capacity of 76 million<br />
tons, but only about 82% of the capacity was utilised.<br />
The expansion to 91 million tons has been completed.<br />
But doubts are growing as to whether this capacity can<br />
be fully utilised in view of stagnating output development<br />
and the inadequacies of railway deliveries. In<br />
2011, RBCT exported “only” 65.5 million tons, but this<br />
was an increase of 2 million tons in comparison with<br />
2010. In other respects, the national railway company<br />
Transnet has guaranteed only freight of 65 million tons<br />
a year. However, it is planning investments of US$6.4<br />
billion with the objective of increasing transport capacity<br />
by 44% to 98 million tons a year in 2018/2019.<br />
The capacity is supposed to be increased to 81 million<br />
tons a year for 2014 at a cost of US$2 billion.
Export Rights to Richards Bay Coal Terminal<br />
after Expansion<br />
Richards Bay Coal<br />
Terminal (RBCT)<br />
Million tons<br />
per year 72.00<br />
%<br />
79.13<br />
Ingwe 26.95 29.62<br />
Anglo Coal 19.78 21.74<br />
Xstrata 15.06 16.54<br />
Total 4.09 4.49<br />
Sasol 3.6 3.96<br />
Kangra 1.65 1.82<br />
Eyesizwe 0.87 0.96<br />
South Dunes Coal Terminal 6.00 6.59<br />
Other Exporters (incl. BEE) 9.00 9.89<br />
Common Users (incl. BEE) 4.00 4.39<br />
Total 91.00 100.00<br />
LB-T28<br />
Export<br />
Exports in 2011 reached the level of the previous year<br />
at 67 million tons. South Africa was able to hold its<br />
FOB prices at a higher level than the Atlantic competitors<br />
(Colombia, USA, Russia) thanks to demand from<br />
India and the Far East.<br />
Structure of the Seaborne Exports in 2011<br />
Total<br />
Million<br />
tons<br />
Europe 1)<br />
Million<br />
tons<br />
Asia<br />
Million<br />
tons<br />
Miscellaneous<br />
Million<br />
tons<br />
Steam Coal 66.5 22.6 38.7 5.2<br />
Anthracite 0.8 0.4 0.1 0.3<br />
Total 67.3 23.0 38.8 5.5<br />
1) Incl. neighbouring Mediterranean countries<br />
LB-T29<br />
There has been a major shift in the structure of exports<br />
towards Asia. The decreased demand from Europe<br />
as a consequence of prices was compensated by<br />
greater demand from India and China in particular,<br />
which purchased 28 million tons per year in 2011 from<br />
South Africa, only 1 million tons less than in 2010.<br />
Taiwan purchased 3.5 million tons a year, South Korea<br />
3.5 million tons a year. In view of India’s high need<br />
for steam coal in the future, the exports to this country<br />
could continue to rise and Europe’s importance decline<br />
further.<br />
Europe, including the Mediterranean region (Turkey, Israel<br />
and UAE) remained an important market, but took<br />
only 35% of the exports. Still, this was almost 8 million<br />
tons more than in 2010. The largest European consumers<br />
were Italy, Spain, Germany, Turkey and Israel.<br />
Key Figures Republic of South Africa<br />
2009<br />
Million<br />
tons<br />
2010<br />
Million<br />
tons<br />
2011<br />
Million<br />
tons<br />
Hard Coal Output 250.0 254.0 252.0<br />
Hard Coal Exports 1)<br />
• Steam Coal<br />
• Coking Coal<br />
Imports Germany<br />
• Steam Coal<br />
• Coking Coal<br />
63.3<br />
62.7<br />
0.6<br />
5.3<br />
5.2<br />
0.1<br />
65.6<br />
65.0<br />
0.6<br />
3.3<br />
3.2<br />
0.1<br />
67.3<br />
66.5<br />
0.8<br />
2.6<br />
2.6<br />
0<br />
Export Rate in %) 24.9 27.0 26.7<br />
1) Seaborne only<br />
LB-T30<br />
CANADA<br />
Production<br />
Hard coal and lignite output in Canada came to 67 million<br />
tons in 2011. The producing provinces are British<br />
Columbia, Alberta and Saskatchewan. Of this output,<br />
about 35 million tons of steam coal come from<br />
Alberta and Saskatchewan, most of which is consumed<br />
as hard lignite or lignite in local power plants.<br />
Most of the hard coal production – largely from<br />
91
92 British Columbia – is exported as coking coal (27 million<br />
tons), PCI coal and, in smaller quantities, as steam<br />
coal (6 million tons).<br />
The significantly higher price level in 2011 and the<br />
rapid recovery of the steel industry supported the continued<br />
long-term expansion of Canadian mining. This<br />
is especially apparent at Canada’s leading coal handling<br />
facilities, the Westshore Terminals. This export coal terminal,<br />
located 32 kilometres from Vancouver and right<br />
at the bor<strong>der</strong> to the USA, posted record volumes in coking<br />
coal shipped to Asia as well as in exported steam<br />
coal. The latter came above all from American mines in<br />
the Pow<strong>der</strong> River Basin in Montana and Wyoming and<br />
from some of the mines in Utah. A total of more than 25<br />
million tons per year was transshipped from Westshore<br />
in 2011. Capacity is supposed to be expanded to 33 million<br />
tons per year by the end of <strong>2012</strong>.<br />
Electricity generation in Canada is essentially based<br />
on coal and hydroelectric power. Canada has installed<br />
coal-fired power plant capacity of about 14,000 MW.<br />
The government plans to shut down these plants successively<br />
from 2015 and replace them with CO 2 -low<br />
technologies, above all coal-fired power plants using<br />
CCS. A demonstration project with an investment volume<br />
of US$1.2 billion is currently un<strong>der</strong> construction<br />
at the Boundary Dam Power Station in Saskatchewan.<br />
Canada is taking these steps with the objective of reducing<br />
its CO 2 emissions by 17% in comparison with<br />
2005 by 2020. At the same time, Canada has announced<br />
its withdrawal from the Kyoto Protocol and will not<br />
participate in the second phase from 2013.<br />
Infrastructure<br />
Export coal is delivered to the Westshore Terminal near<br />
Vancouver by CP Rail, while CN transports the coal to<br />
the Neptune Bulk Terminal. Coal is also transshipped<br />
via the Ridley Terminal located farther to the north.<br />
Coal handling capacities and volumes in all of the<br />
ports are supposed to be expanded or have the levels as<br />
shown below over the next 5 years, whereby the handling<br />
figures do not agree with the export figures for<br />
technical reasons related to customs.<br />
Terminal<br />
Neptune Bulk<br />
Terminal<br />
Westshore<br />
Terminal<br />
Ridley<br />
Terminal<br />
Handling Capacities 2011<br />
Capacities 2011<br />
Million tons per<br />
year<br />
Exports 2011 1)<br />
Million tons per<br />
year<br />
Capacities 2015<br />
Million tons per<br />
year<br />
9.0 5.2 12.5<br />
29.0 27.0 33.0<br />
12.0 8.6 24.0<br />
Total 50.0 40.8 69.5<br />
1) Provisional figures<br />
LB-T31<br />
So the port capacities would be prepared for additional<br />
exports in the event of a rise in demand and production.<br />
Thun<strong>der</strong> Bay Terminal, which has a capacity of 11–12<br />
million tons, is used for inland shipment of Canadian<br />
coal to the USA over the Great Lakes.<br />
Exports<br />
The seaborne exports of 32 million tons break down<br />
into about 6 million tons of coking coal and about 26<br />
million tons of steam coal. 1.3 million tons went overland<br />
to the USA, most of it coking coal.<br />
There will be opportunities for Canada’s export situation<br />
to improve even further in <strong>2012</strong> if the steel industry<br />
continues to be as productive as in 2011. But there will<br />
also be good opportunities for Canada to export to Asia.
Key Figures Canada<br />
2009<br />
Million<br />
tons<br />
2010<br />
Million<br />
tons<br />
2011<br />
Million<br />
tons<br />
Hard Coal Output 1) 63 68 67<br />
Hard Coal Exports 28 33 33<br />
• Steam Coal 6 6 6<br />
• Coking Coal 22 27 27<br />
Imports Germany 1.1 1.2 1.7<br />
• Coking Coal 1.1 1.2 1.7<br />
Export Rate in %) 100 100 100<br />
1) Incl. hard lignite<br />
LB-T32<br />
VIETNAM<br />
Production<br />
Vietnam’s economy grew by 5.9% in 2011, above all a<br />
result of the rapid growth in exports. This is also forecast<br />
for Vietnam in <strong>2012</strong>. The demand for electricity<br />
is growing parallel to this increase. Coal is a leading<br />
fuel for power generation and will overtake hydroelectric<br />
power in the next five years. According to information<br />
from Vietnam Electricity (EVN), average annual<br />
power growth of 15% is assumed for the next five<br />
years. Investments of US$3 billion for new coal-fired<br />
power plants and power lines in the period from 2011<br />
to 2015 will be required if the demand for electricity<br />
is to be met even approximately. Power consumption<br />
will almost double from 98 GWh to 175 GWh in 2015.<br />
A total of about 27 GW of new power plant capacities<br />
is supposed to be constructed, just un<strong>der</strong> 15 GW using<br />
coal. This development will have enormous impact on<br />
coal production and electricity prices. Estimates indicate<br />
that the latter will increase by 10% to 16% in <strong>2012</strong>.<br />
Coal production in 2011 amounted to 49 million tons<br />
and increased by 5 million tons. Domestic consumption<br />
increased from 23 million tons to 32 million tons. Most<br />
of the output is anthracite, but small quantities of lignite<br />
and sub-bituminous coal are also produced. The latter<br />
are used exclusively for domestic consumption while<br />
the anthracite output goes largely to exports.<br />
The growing demand for power which is becoming<br />
evident also requires an increase in coal production.<br />
Investment requirements are calculated at about US$15<br />
billion if the Vietnamese coal industry is to be able to<br />
achieve its expansion targets by 2020. Two-thirds of<br />
this amount will be required between <strong>2012</strong> and 2015<br />
for the expansion and extension of current mines and<br />
the development of new coal deposits. An increase in<br />
production capacity to 55–58 million tons by 2015 and<br />
to 60–65 million tons by 2020 has been targeted.<br />
But Vietnam’s dynamically growing economy will also<br />
trigger an increase in import demand for steam coal.<br />
The first trial delivery was imported in 2011. Owing<br />
to its power plant expansion programme, imports could<br />
cause Vietnam to become a major importer of steam<br />
coal and to restrict exports because of a rise in its own<br />
needs. Initial estimates project imports of up to 100 million<br />
tons a year in 2020. Exports are supposed to be<br />
reduced further. Export tax will be increased from 15%<br />
to 20% in <strong>2012</strong>.<br />
Infrastructure<br />
The watersides on the eastern side of Vietnam are mostly<br />
shallow and have in the past allowed access only by<br />
ships of less than 10,000 DWT.<br />
According to information from Vinacom, it has received<br />
approval to construct a new coal port in the<br />
93
94 south of Vietnam which will serve to supply the coalfired<br />
power plants in the Mekong Delta. This is where<br />
most of the new coal-fired power plants are scheduled<br />
to be constructed.<br />
Export<br />
Seaborne exports once again declined, this time by almost<br />
2 million tons, to about 17.2 million tons in 2011.<br />
A further decline to 13.5 million tons is planned for<br />
<strong>2012</strong>, a figure which is supposed to shrink to 3 million<br />
tons a year by 2015.<br />
China, Japan and South Korea buy only smaller volumes.<br />
The Vietnamese anthracite coal is also used in<br />
part as PCI coal.<br />
The Vietnamese export of anthracite steam coal is in<br />
part low calorific and is profitable only because of the<br />
short sea routes to China. This coal would not stand a<br />
commercial chance on the normal international steam<br />
coal market. Nevertheless, it covers demand which otherwise<br />
might have to be met by purchases on the world<br />
market and thus alleviates pressures on this market. A<br />
small part of the exports also goes overland to China.<br />
Key Figures Vietnam<br />
2009<br />
Million tons<br />
2010<br />
Million tons<br />
2011<br />
Million tons<br />
Output 43.0 44.0 49.0 1)<br />
Export<br />
thereof China<br />
25.1<br />
24.1<br />
19.2<br />
18.0<br />
17.2<br />
14.0<br />
Export Rate in %) 58 42 35<br />
1) Provisional<br />
LB-T33<br />
PEOPLE’S REPUBLIC OF<br />
CHINA<br />
While China continued to be the locomotive pulling the<br />
world economy train in 2011, its growth slowed down.<br />
In Q4 2011, the economy as seen in the year-on-year<br />
comparison grew more slowly than at any time in the<br />
last two and a half years. Total economic performance<br />
in China last year increased by 9.4% – the increase in<br />
2010 was 10.4%. The situation in China continues to<br />
be better than in the United States and the euro zone. A<br />
forecast of the United Nations indicates that China will<br />
grow more slowly in <strong>2012</strong> and 2013 than in 2010 and<br />
2011. This country – just like other developing countries<br />
– will not be able to evade the effects of the economic<br />
slump in the established economic powers USA,<br />
EU and Japan. The UN economists assume economic<br />
growth of just un<strong>der</strong> 9% in this and the coming year for<br />
China. The central government adjusted the growth target<br />
for GDP downwards to 7.5% for 2011 (2010: 8%) at<br />
the beginning of the year. The inflation rate in 2011 was<br />
also higher than expected. It amounted to 7.5% in July,<br />
to 7.3% in August and to 6.1% in September. In the first<br />
8 months, the inflation rate was 7.1% instead of the annual<br />
average of 5% expected by the government. The<br />
objective for <strong>2012</strong> is to hold inflation to 4%. The demand<br />
for steel, cement and power rose continuously, a<br />
consequence above all of the increasing urbanisation in<br />
China. China produces 81.5% (3,822 TWh) of its electricity<br />
using coal. The need for coal rose accordingly.
Power/Crude Steel/Pig Iron Production<br />
2009 2010 2011<br />
Power Generation TWh 3,664 4,207 4,690<br />
Crude Steel Production Million tons 568 627 695.5<br />
Pig Iron Production Million tons 544 590 683.3<br />
LB-T34<br />
The economy of the People’s Republic is continuing to<br />
grow strongly, prosperity and education are increasing.<br />
China wants to make plenty of funds available to promote<br />
the economy and expansion of the infrastructure<br />
in <strong>2012</strong> as well, as Prime Minister Wen Jiabao declared<br />
to the National People’s Congress in March <strong>2012</strong>. A total<br />
of nine million new jobs are to be created. A general<br />
objective is to prevent the gap between rich and poor<br />
from becoming any greater. There are been frequent<br />
protests because of the high inflation rate, the low level<br />
of wages and poor working conditions.<br />
At the end of 2011, installed power generation in<br />
China amounted to 1,056 GW, an increase of 111 GW<br />
(+11%). The installed coal-fired power plant output in<br />
2011 came to 745 GW, increasing by about 6.5% or 45<br />
GW in comparison with 2010. According to a report<br />
from the China Electricity Council (CEC), the capacity<br />
of Chinese power generation is to be expanded to<br />
1,493 GW by 2015: 342 GW hydroelectric power, 928<br />
GW coal-fired power plants, 43 GW nuclear energy,<br />
40 GW gas-fired power plants, 100 GW wind power<br />
plants, 5 GW photovoltaics and 5 GW biomass power<br />
plants. Power consumption is expected to grow in a<br />
magnitude of 8,000 to 8,810 TWh annually until 2020,<br />
corresponding to an annual increase of 4.6% to 6.6%.<br />
Installed power generation capacity will be expanded<br />
to 1,935 GW by 2020. About 60% of this, i.e. 1,170<br />
GW, is supposed to come from coal-fired power plants.<br />
This means that in the future 1–2 new coal-fired power<br />
plants will go online every week. An addition of 85 GW<br />
is calculated for <strong>2012</strong>.<br />
Electric power generation and consumption increased<br />
by about 12% to 4,690 TWh, coal-fired power generation<br />
by 14.8% or 333 TWh to 3,822 TWh. Pig iron and<br />
crude steel production continued to grow strongly. A<br />
total of 696 million tons per year of crude steel and 683<br />
million tons per year of pig iron were produced. A total<br />
of 1.262 billion tons of coal were consumed for power<br />
generation in coal-fired power plants in 2011. On average,<br />
330 grams of coal are required for the production<br />
of 1 kWh of electricity, documenting that China has<br />
substantially improved the average degree of efficiency<br />
of coal-fired power plants in recent years.<br />
China overtakes the USA as the largest energy<br />
consumer<br />
China has taken the place of the United States as the<br />
world’s largest energy consumer. According to the Statistical<br />
Yearbook of BP, China’s economy was responsible<br />
for one-fifth of the global energy consumption,<br />
while the USA had a share of 19%.<br />
China leads in the expansion of renewable energies,<br />
CCS and CO 2 reduction<br />
Although power generation in China is dominated by<br />
coal-fired power plants, China is making consi<strong>der</strong>able<br />
effort to catch up in environmental and climate protection<br />
and to take over a leading position in the movement.<br />
The Chinese market for energy efficiency and<br />
renewable energies is developing rapidly and is gigantic.<br />
The massive additional construction of new facilities<br />
alone requires a high level of efficiency. The German<br />
Energy Agency (DENA) has developed building<br />
95
96 standards for Chinese residential and office buildings<br />
on behalf of the Chinese Ministry of Construction; they<br />
are oriented to the strictest German standards of efficiency.<br />
China overtakes even Germany at times in environmental<br />
technology. No country in the world is investing<br />
more money in renewable energies than China.<br />
The world market share of the Chinese in solar energy<br />
rose from 36% to 45% in 2010 alone. The situation is<br />
similar for wind energy. 2010 was the first year ever<br />
in which the largest number of new wind turbines was<br />
installed in China, not in Europe and North America.<br />
Almost half of all of the new wind turbines built each<br />
year are located in China.<br />
Production<br />
Coal production was expanded further and rose by 280<br />
million tons to 3,520 million tons in 2011.<br />
The consolidation of the domestic coal industry progressed<br />
all over China in 2011. The reasons include<br />
preventing the demand and supply capacities from<br />
drifting even further apart as well as improving the environmental<br />
and occupational safety standards in the<br />
small and mini mines by merging them. The number of<br />
fatal accidents evidently fell from more than 6,000 only<br />
a few years ago and from 2,400 in 2010 to fewer than<br />
2,000 in 2011, but this figure, despite all of the achieved<br />
progress, is still far too high. The majority of the fatal<br />
accidents occur in the small mines, some of which are<br />
not approved. More than 100 miners died in October<br />
2011 alone. A number of mines were subsequently<br />
closed and safety inspections were carried out in others.<br />
The number of small operations is being reduced<br />
further. The consolidation process began in Shanxi<br />
Province where the number of coal mines was reduced<br />
by more than 1,500 in 2009. Another 1,355 mini mines<br />
with a total capacity of 125 million tons were closed in<br />
2010 so that the total number of coal mines fell from<br />
2,598 to 1,053 at the end of 2010. Overall, the number<br />
of small operations with annual production of less<br />
than 300,000 tons was reduced to fewer than 10,000. In<br />
April 2011, the government announced the beginning<br />
of consolidation in the autonomous region Inner Mongolia<br />
where mines with a total production of less than<br />
1.2 million tons a year were closed.<br />
By the end of 2010, 13 national coal centres had been<br />
established by the central government since 2007:<br />
Shandong (Shaanxi Province), Shaanbei (Shaanxi<br />
Province), Huanglong/Huating (Gansu Province), Jinbei<br />
(Shaanxi Province), Jinzhong (Shaanxi Province),<br />
Jindong (Shaanxi Province), Luxi (Shandong Province),<br />
Lianghuai (Aukui Province) Jizhong (Hebei<br />
Province), Henan Province, Mengdong (Inner Mongolia),<br />
Yungui (Yuman and Guizhon Province) and Ningdong<br />
(Ningxia Hui Region). Xinjiang was established<br />
as the fourteenth national coal centre at the beginning<br />
of 2011.<br />
There is a plan to merge coal companies in Hebei Province<br />
and reduce their number from 340 to 50 in 2015.<br />
The number of coal mines will be reduced from 485<br />
to below 200. In Shandong Province, the local government<br />
has decided to close all of the coal mines with less<br />
than 300,000 tons per year output capacity by 2015.<br />
In addition, new coal mines with annual capacity below<br />
450,000 tons a year will no longer be approved.<br />
The number of coal companies will be reduced from<br />
113 to about 60 by the end of <strong>2012</strong>. In the future, they<br />
will have to have an annual output capacity of at least<br />
600,000 tons a year by the end of <strong>2012</strong> and 1.2 million<br />
tons a year by the end of 2015.
However, the mergers and closures of mini mines do<br />
not give rise to any fears of a decline in production.<br />
On the contrary, the central government expects these<br />
measures to result in improved efficiency and in general<br />
a greater orientation to competitive structures which<br />
will compensate for the loss of capacities in the mini<br />
mines. As of the end of 2010, 5 gigantic state-owned<br />
coal producers had emerged, each of them with an output<br />
capacity of more than 100 million tons annually.<br />
They are China Shenhua Group, China National Coal<br />
Group, Datong Coal Group, Shanxi Coking Coal Group<br />
and Chemical Industry Group. China’s objective is to<br />
develop ten mega coal-producing companies with output<br />
capacities of 100 million tons annually each and another<br />
10 companies with a capacity of 50 to 100 million<br />
tons a year by 2015. Following the merger with 169<br />
smaller coal mines, Shaanxi Coking Coal Group, the<br />
largest coking coal producer, alone now has an output<br />
capacity of 130–140 million tons a year and produced<br />
more than 102 million tons of coking coal in 2010.<br />
Coal Production in China<br />
2009<br />
Million tons<br />
2010<br />
Million tons<br />
2011 1)<br />
Million tons<br />
State-owned Mines 1,518 1,694 1,774<br />
Provincial Mines 365 516 576<br />
Small Operations 1,027 1,200 1,300<br />
Total 2,910 3,410 3,650<br />
LB-T35 1) Provisional Source: China Coal <strong>Report</strong>, Issue No. 0234<br />
Hard coal output is to be increased further. There is a<br />
large number of new projects especially in the autonomous<br />
region Inner Mongolia and in Xinhua Province.<br />
As growth rates in the demand for electric power and<br />
steel remain high, coal production will presumably<br />
grow at an average rate of 150–200 million tons a year<br />
and will pass the 3.8 billion tons a year mark in <strong>2012</strong>.<br />
China’s coking plant capacity amounts to 400 million<br />
tons a year, its coke production in 2011 was at about<br />
the same level.<br />
The provincial government of Guizhon has adopted a<br />
plan to incorporate the approximately 1,600 coal mines<br />
owned by local mine operators into about 40 holding<br />
companies. L&L Energy is one of the few American<br />
listed companies which can acquire 14 coal mines operated<br />
in Guizhon province with coking coal production<br />
capacity of 3 million tons a year.<br />
Production is supposed to be increased from 100 million<br />
tons in 2010 to 430 million tons in 2015 above all<br />
in Xinjiang Province in western China. 65 large coal<br />
projects are currently being realised here. The province<br />
is seeking to produce as much as 1,000 million tons a<br />
year, about one-third of the current coal consumption,<br />
by 2020. Xinjiang’s reserves are estimated to be 2.2<br />
trillion tons, corresponding to 40% of the Chinese coal<br />
reserves.<br />
Inner Mongolia, China’s largest coal-producing province,<br />
increased output in comparison with 2010 by<br />
about 30% to between 900 million and 1,000 million<br />
tons in 2011. Operation of new coal mines began in this<br />
province in 2011 as well, e.g. a mine with an annual<br />
capacity of 10 million tons a year operated by Huadian<br />
Coal Corporation. In addition, Chinese coal companies<br />
are looking abroad, especially in Australia and Indonesia,<br />
for new projects or coal producers with whom they<br />
can conclude long-term coal purchasing agreements.<br />
China’s national development and reform commission<br />
has cooperated with the Ministry of Finance to prepare<br />
a set of guidelines for an emergency coal reserve. It<br />
foresees the build-up of coal reserves of 5 million tons<br />
97
98 by 10 large coal-producing companies and power generation<br />
companies in cooperation with 8 coal ports as<br />
preparation for the electricity shortage which occurs in<br />
summer of every year.<br />
According to information from the IEA, increases in<br />
coal production from 2009 to 2015 will occur above all<br />
in China and worldwide coal trade will be decisively<br />
influenced by this fact. But the scope of the impact will<br />
ultimately depend on how great or how restrained the<br />
expansion of production in the coming years can be.<br />
An increase of 3.7% over the approximately 3.6 billion<br />
tons of coal produced in 2011 is expected for <strong>2012</strong>. The<br />
current 5-year plan sets the target of limiting consumption<br />
of coal to 4.1 billion tons a year until 2015.<br />
Infrastructure<br />
China’s infrastructure is steadily being expanded and<br />
was promoted especially strongly by the road improvement<br />
programme begun in 2009. A new corridor connecting<br />
China and Inner Mongolia at Ceke has been<br />
built, above all to relieve the congestion on the roads.<br />
Traffic jams of the lorries loaded with coal were at times<br />
up to 100 kilometres long. The new 8-lane motorway is<br />
supposed to create capacity of 12 million tons a year. A<br />
new road connection is supposed to be constructed over<br />
246 kilometres to Mongolia and the Tavan Tolgoi mining<br />
area there. New coal terminals are being built: coal<br />
handling capacity of 35 million tons in the port of Jinzhon<br />
and a coal terminal in Gadon port with a capacity<br />
of 20 million tons a year in Zhuhai in southern China.<br />
But especially great investments are being made in new<br />
railway capacities. In 2020, China is supposed to have<br />
railway transport capacities of more than 3 billion tons<br />
a year, an increase from 2 billion tons a year in 2010.<br />
The total length of railway tracks in 2020 will have<br />
increased to about 130,000 kilometres from 40,000<br />
kilometres in 2010. Special emphasis will be given to<br />
the expansion of connecting lines to western China.<br />
Chinese railways transported about 2 billion tons of<br />
coal in 2010, almost 2/3 of the total output. China’s<br />
Datong-Qinhuangdao Railway alone transported 440<br />
million tons in 2011, corresponding to about 20% of<br />
all coal transports by rail. The expansion of the railway<br />
system is a great challenge for China because more and<br />
more coal must be transported from the north and west<br />
to the consumer centres in the south. China’s largest<br />
coal port, Qinhuangdao, transshipped 253 million tons<br />
of coal in 2011, utilising capacity to more than 100%.<br />
There are plans to expand capacity at the ports Huanghua<br />
and Tianjin as well.<br />
Import/Export<br />
China’s import/export development had a major impact<br />
in terms of quantity and price on the world’s hard coal<br />
market in 2011. China’s change from a net exporter to<br />
a net importer of hard coal, first observed in 2009, continues.<br />
Imports Steam Coal<br />
Imports Coking Coal<br />
Import/Export Development<br />
2010<br />
in million<br />
tons<br />
119*<br />
47<br />
2011<br />
in million<br />
tons<br />
138*<br />
45<br />
Difference<br />
2010/2011<br />
in million<br />
tons<br />
19<br />
- 2<br />
Total Imports 166 183 17<br />
Exports Steam Coal<br />
Exports Coking Coal/<br />
Coke<br />
18*<br />
4<br />
11*<br />
7<br />
Total Exports 22 18 - 4<br />
* Steam + anthracite<br />
LB-T36<br />
- 7<br />
3
Due to 19 million tons in additional imports and 4 million<br />
tons in lower exports, China’s impact on the world<br />
market totalled 23 million tons. This enabled the coal<br />
exporting countries to compensate almost completely<br />
for the weak demand for steam coal on the Atlantic<br />
market.<br />
Chinese exports declined in total by 4 million tons to<br />
18 million tons in 2011. The export of steam coal fell<br />
further by 7 million tons to 11 million tons (including<br />
anthracite), while the export of coking coal rose by 3<br />
million tons.<br />
Coke exports of 3.3 million tons remained constant in<br />
comparison with 2010. The largest customers for steam<br />
and coking coal for these sharply reduced exports were<br />
South Korea (5.2 million tons), Japan (6.1 million tons)<br />
and Taiwan (1.9 million tons).<br />
Coal Exports According to Grades<br />
2009<br />
Million tons<br />
2010<br />
Million tons<br />
2011<br />
Million tons<br />
Steam Coal 18.5 13.6 6.8<br />
Coking Coal 0.6 1.1 3.6<br />
Anthracite 3.2 4.2 4.2<br />
Total 22.3 18.9 14.6<br />
Coke 0.5 3.3 3.3<br />
LB-T37<br />
The 10% increase in imports also had an impact on<br />
the world market and was covered mostly by Indonesia<br />
(about 65 million tons), Australia (about 33 million<br />
tons), Russia (about 11 million tons) and Mongolia<br />
(about 20 million tons). Vietnam supplied 14 million<br />
tons of anthracite, largely to south-west China. But coal<br />
was also imported from the Atlantic region, including<br />
the USA, Canada, Colombia and South Africa, even<br />
though the volume was substantially lower than in 2010.<br />
The balance between exports and imports (excluding<br />
coke) developed as shown below:<br />
Balance Exports / Imports<br />
2009<br />
Million tons<br />
2010<br />
Million tons<br />
2011<br />
Million tons<br />
Exports 22 19 15<br />
Imports 127 166 183<br />
Balance - 105 - 147 - 168<br />
LB-T38<br />
China proved to be a net importer for the third time<br />
since 2009. Simultaneously, China overtook Japan as<br />
the world’s largest coal importer. Japan’s imports declined<br />
to 175 million tons in 2011.<br />
There are many and various reasons for the increase<br />
in imports. With regard to coking coal, the overriding<br />
cause is in the declining quality of domestic coking coal<br />
as well as the increased costs for domestic production.<br />
Another reason is the location of some of the steel companies<br />
on the coast in the vicinity of coal terminals;<br />
they are able to import coking coal from the Australian<br />
region while the new mills constructed in China’s western<br />
provinces are becoming increasingly dependent on<br />
coking coal imports from Mongolia.<br />
99
100 The export volumes for the large Chinese exporters<br />
declined parallel to the decrease in exports.<br />
Companies Authorised to Conduct Exports<br />
2009<br />
Million tons<br />
2010<br />
Million tons<br />
2011 1)<br />
Million tons<br />
China Coal 4.3 5.1 6.5<br />
Shenhua 13.6 10.4 5.5<br />
Shanxi (SCIEC) 3.6 3.8 1.8<br />
Minmetals 1.1 0.4 0.2<br />
Total 22.6 19.7 14.4<br />
1) Provisional<br />
LB-T39<br />
Continued high imports of up to 180 million tons per<br />
year are predicted for <strong>2012</strong>. But domestic output will be<br />
expanded further. The degree to which China imports<br />
coal will also depend greatly on the international price<br />
level. If the Chinese domestic price level is higher than<br />
the world market price level, this will be the main reason<br />
for the power plants and steel mills located on the<br />
coast to procure their supplies from the world market.<br />
The price cap for domestic coal adopted at the beginning<br />
of <strong>2012</strong> could counteract this development. The<br />
price cap of US$127 a ton introduced on 01/01/<strong>2012</strong><br />
caused Chinese coal to fall un<strong>der</strong> this price, which simultaneously<br />
had an impact on the prices for imported<br />
hard coal.<br />
Key Data People’s Republic of China<br />
2009<br />
Million<br />
tons<br />
2010<br />
Million<br />
tons<br />
2011<br />
Million<br />
tons<br />
Hard Coal Output 2,910 3,240 3,520<br />
Hard Coal Exports<br />
• Steam Coal<br />
incl. Anthracite<br />
• Coking Coal<br />
22.3<br />
21.7<br />
3.2<br />
0.6<br />
18.9<br />
17.8<br />
4.2<br />
1.1<br />
14.6<br />
11.0<br />
4.2<br />
3.6<br />
Coke Exports 0.5 3.3 3.3<br />
Hard Coal Imports<br />
• Steam Coal<br />
• Coking Coal<br />
• Anthracite<br />
Imports Germany<br />
• Steam Coal<br />
• Coke<br />
126.7<br />
57.8<br />
34.5<br />
34.4<br />
0.15<br />
-<br />
0.15<br />
166.2<br />
92.5<br />
47.2<br />
26.5<br />
0.2<br />
-<br />
0.2<br />
183.1<br />
102.3<br />
44.7<br />
36.1<br />
0.2<br />
-<br />
0.2<br />
Export Rate in %) 0.8 0.6 0.4<br />
LB-T40<br />
China is also concerned about its CO 2 emissions. As it<br />
is the world’s largest producer of CO 2 emissions, China<br />
is consi<strong>der</strong>ing the introduction of a CO 2 tax comparable<br />
to the one in Australia. However, a total of 6 potential<br />
models are first being tested in a pilot phase before a final<br />
decision about one of them is made. The Ministry of<br />
Finance is currently preparing a proposal which would<br />
levy a CO 2 tax of initially US$1.56 per ton of CO 2 emitted<br />
in a company, a mine or a plant. The CO 2 tax would<br />
be aimed at the large consumers of oil, coal and natural<br />
gas while simultaneously establishing incentives for the<br />
implementation of measures to reduce emissions. China<br />
has also assumed a leading role in CCS technology. The<br />
IEA has acknowledged especially the progress in both<br />
technology and investments.
MONGOLIA<br />
This country is one of the ten richest nations in the<br />
world in terms of raw materials. As much as 160 billion<br />
tons of coal (especially coking coal), 1.6 billion<br />
tons of iron ore, 40 million tons of copper, 3,000 tons<br />
of gold and large deposits of rare earths can be found<br />
un<strong>der</strong> the desert sands there. In the past, their exploitation<br />
was consi<strong>der</strong>ed to be unprofitable because of low<br />
demand, low prices and the lack of infrastructure. This<br />
has fundamentally changed owing to the growing demand<br />
from threshold countries such as India and China<br />
and the sustained rise in the prices for raw materials. As<br />
a consequence, Mongolia’s importance with regard to<br />
raw material policies and strategies for the future has<br />
risen enormously. Visible expression of this importance<br />
can be seen in Chancellor Merkel’s visit to Mongolia in<br />
October 2011 and the trip to Germany un<strong>der</strong>taken by<br />
Tsakhia Elbegodrj, the President of Mongolia, in March<br />
<strong>2012</strong>. The two countries want to continue to develop<br />
the strategic partnership in raw materials, industry and<br />
technology. Conditions for this happening are good: as<br />
many as 40,000 of the total Mongolian population of<br />
2.8 million speak German – a legacy of the close exchange<br />
with the former East Germany. Later, when the<br />
formerly socialist Mongolia changed to a free market<br />
economy and set itself apart in a positive sense from<br />
other transformation countries in Central Asia by establishing<br />
relative stable democratic structures and<br />
a multi-party system, Germany was among the most<br />
important helpers in its development. The high coking<br />
coal prices and the growing import demand from China<br />
and India have induced many raw material corporations<br />
to invest in Mongolia.<br />
Production<br />
In view of Mongolia’s location – Russia and China are<br />
the only countries with which it shares bor<strong>der</strong>s – it is no<br />
surprise that Chinese companies in particular want to<br />
secure their access to the coking coal deposits waiting<br />
to be developed.<br />
In July 2011, the Mongolian government – following a<br />
highly competitive ten<strong>der</strong> – signed an agreement with<br />
a group of companies un<strong>der</strong> the lea<strong>der</strong>ship of China’s<br />
largest coal producer Shenhua (40%), a Russian-Korean<br />
syndicate (36%) and Peabody Energy (24%) giving this<br />
group access to 50% of the Tavan Tolgoi coal deposits<br />
in the western Tsankhi block. The remaining 50% is<br />
supposed to be reserved for Mongolian investors. The<br />
Tavan Tolgoi coal deposits have estimated reserves of 6<br />
billion tons, 1.2 billion tons in the Tsankhi Block, 65%<br />
of which is believed to be high-grade coking coal.<br />
Initially, however, the Parliament did not ratify this<br />
agreement for formal reasons, causing confusion. A<br />
midsize German company – BBM Operta – and Macmahon<br />
from Australia have concluded a contract with<br />
the Mongolian state-owned company Erdenes TT for<br />
the development, exploitation and production of up to<br />
100 million tons of coking coal over the next 10 years,<br />
also in Tavan Tolgoi. Hunnu Coal has acquired from<br />
Rio Tinto 70% of the Altai Nuurs Coal Joint Ventures<br />
Project in Gobi Altai Province in south-western Mongolia.<br />
The target is the production of between 250 and<br />
500 million tons of coal. The Australian company CEO<br />
has acquired eight coal development licences in Southern<br />
Gobi and Ovorhangay.<br />
101
102<br />
Xanadu and Noble Energy have formed a strategic alliance<br />
for the exploration of various raw materials,<br />
including coal, in Mongolia. Xanadu is already developing<br />
various projects, including the coal projects in<br />
Galshar and Khar Tarvaga.<br />
Mongolian Mining Corporation, currently the largest<br />
coking coal producer in Mongolia, wants to acquire the<br />
Barumi Narau coking coal mine and its deposits of 253<br />
million tons.<br />
Statistics in Mongolia are not yet fully developed, and<br />
figures concerning production are not (yet) reliable.<br />
3 million tons are supposed to be produced from the<br />
newly developed Tsankhi Block in <strong>2012</strong>.<br />
Export<br />
In 2010, Mongolia exported 16 million tons a year of<br />
coking coal to China; exports in 2011 are estimated at<br />
20 million tons a year, and exports of 50 million tons<br />
a year for 2015 and of 80 million tons a year for 2017<br />
are already being projected. This un<strong>der</strong>lines Mongolia’s<br />
dynamic export development.<br />
Infrastructure<br />
Although most of the coking coal and coal deposits are<br />
located within a 300-kilometre radius of the Chinese<br />
bor<strong>der</strong> and lorry transport is currently the only feasible<br />
option, the transport of larger quantities in the future<br />
will require above all a railway infrastructure. Mass<br />
exports are not possible without rail connections. They<br />
will also be necessary if Mongolia wants to go beyond<br />
China and deliver around the world by connecting to<br />
seaborne coal trade. This will require a Mongolian<br />
connection to the Trans-Siberian Railway so that the<br />
Russian ports Vladivostok, Vostochny and Vanino in<br />
the Far East can be accessed. But a rail connection to<br />
China, perhaps to the port of Dandong near the North<br />
Korean bor<strong>der</strong>, is also un<strong>der</strong> consi<strong>der</strong>ation. The Mongolian<br />
Ministry of Transport has announced a ten<strong>der</strong><br />
for a railway project with a length of 1,000 kilometres<br />
which will connect the current Russian railway to the<br />
port at Vanino with the coal region Tavan Tolgoi.<br />
POLAND<br />
Production<br />
Polish output remained almost constant in comparison<br />
with 2010. Total production amounted to about 76.2<br />
million tons. Despite the good earnings position in the<br />
last 5 years, however, Polish production has decreased<br />
by more than 20 million tons. Production of lignite, on<br />
the other hand, has risen by more than 11% to about 63<br />
million tons.<br />
The Largest Hard Coal Producers in Poland<br />
Company Output Exports<br />
2010<br />
Million<br />
tons<br />
2011<br />
Million<br />
tons<br />
2010<br />
Million<br />
tons<br />
2011<br />
Million<br />
tons<br />
Kompania Weglowa 39.5 38.7 7.9 3.7<br />
Katowicka Group<br />
Kapitalowa<br />
12.3 12.8 0.5 0.6<br />
Jastrzebska Spólka<br />
Weglowa<br />
13.3 12.6 0.3 0.4<br />
Independent Mines 11.1 12.1 1.7 2.1<br />
Total 76.2 76.2 10.4 6.8<br />
LB-T41<br />
It was possible to maintain the level of Polish coking<br />
coal output and coke production, in no small part because<br />
of the healthy steel industry. Coking coal production<br />
came to 11.6 million tons.
Investments were again made in coke production by<br />
reactivating mothballed mines. Following coke production<br />
of 9.13 million tons in 2010, capacity in 2011 grew<br />
back to about 11 million tons.<br />
Progress in the privatisation of Polish mining is very<br />
slow. Weglokoks announced in 2010 that it intended to<br />
go public in the summer of 2011, privatising the stateowned<br />
company. In addition, Poland announced plans<br />
for a merger of Weglokoks with two other coal mining<br />
companies, Kattowicki Holding Weglowy SA and<br />
Kompania Weglowa. Now the government is planning<br />
to place between 20% and 40% of the Weglokoks stock<br />
on the exchange. More and more, Poland is importing<br />
more coal than it exports, primarily steam coal, but<br />
smaller quantities of coking coal and anthracite as well.<br />
Volume in 2011 came to 15.1 million tons. The steam<br />
coal came primarily from Russia (9.3 million tons) and<br />
the Czech Republic (2 million tons) and is used mostly<br />
in northern Poland. The coking coal comes from the<br />
USA.<br />
Poland has also been given the opportunity by the EU<br />
to pay subsidies related to closures to the mining companies.<br />
In addition, Poland produced 9.13 million tons<br />
of coke, 64% of which was exported to neighbouring<br />
European countries.<br />
Infrastructure<br />
There were no changes in the transport infrastructure,<br />
which is now too large for the current export volume,<br />
in 2011. The export logistics in Poland are well developed.<br />
Loading ports include Gdansk, Swinoujscie, Szczecin<br />
and Gdynia. While Gdansk is able to load Capesize<br />
freighters, Swinoujscie and Gdynia are accessible only<br />
for Panamax ships, and only Handysize vessels can access<br />
Szczecin. In the middle term, these ports will gain<br />
in importance for imports. Capacity is now 7 million<br />
tons, but could be increased to 19 million tons.<br />
Export<br />
Export of hard coal in 2011 declined by almost 35%<br />
to 6.8 million tons. With imports of 15.1 million tons,<br />
Poland remained a net importer. Of the exported 6.8<br />
million tons, 4.7 million tons were marketed by Weglokoks;<br />
2.1 million tons were marketed directly by the<br />
mining companies.<br />
Exports in 2011 break down as shown below<br />
(Weglokoks only):<br />
Export 2011<br />
Coking Coal<br />
Million tons<br />
Steam Coal<br />
Million tons<br />
Total<br />
Million tons<br />
Seaborne --- 2.4 2.4<br />
Overland 0.7 1.6 2.3<br />
Total 0.7 4.0 4.7<br />
LB-T42<br />
Germany (about 2.6 million tons) and the Czech Republic<br />
(about 1.8 million tons) by land and the UK by<br />
sea (0.6 million tons) where the largest purchasers of<br />
steam coal. A major part of these quantities was transported<br />
by rail.<br />
103
104 Key Figures Poland<br />
2009<br />
Million<br />
tons<br />
2010<br />
Million<br />
tons<br />
2011<br />
Million<br />
tons<br />
Hard Coal Output 78.0 76.6 76.2<br />
Hard Coal Exports 8.7 10.4 6.8<br />
•Steam Coal 6.7 8.7 5.1<br />
• Coking Coal 2.0 1.7 1.7<br />
Coke Exports 4.6 6.3 5.9<br />
Hard Coal Imports 10.0 13.5 15.1<br />
Imports Germany 4.2 3.9 5.1<br />
• Steam Coal 2.5 1.5 2.6<br />
• Coking Coal --- --- ---<br />
• Coke 1.7 2.4 2.5<br />
Export Rate in %<br />
(Coke converted into coal)<br />
LB-T43<br />
CZECH REPUBLIC<br />
14 24 19<br />
Production<br />
In 2011, 11.3 million tons of hard coal were produced<br />
in the Czech Republic, so there was no increase in hard<br />
coal output.<br />
Coke production by the Czechs amounted to 2.6 million<br />
tons in 2011. Lignite production came to 46.6 million<br />
tons, a slight increase of 2.6 million tons.<br />
The Czech hard coal production of 11.3 million tons<br />
breaks down into 5.2 million tons of coking coal and<br />
6.1 million tons of steam coal (estimated).<br />
Infrastructure<br />
Czech coal and coke exports were transported overland<br />
by rail and on the Danube (Bratislava).<br />
Export / Import<br />
Exports of hard coal and coke amounted to about 6.8 million<br />
tons, thereof 6.3 million tons of coal and 0.5 million<br />
tons of coke. Austria (1.9 million tons), Slovakia (1.5<br />
million tons) and Poland (2.5 million tons) were the largest<br />
customers. A large part of the exports consists of coking<br />
coal (2.5 million tons). The Czech Republic imported<br />
small quantities of coal and coke – about 1.8 million tons<br />
– mainly from Poland and Russia.<br />
Key Figures Czech Republic<br />
2009<br />
Million<br />
tons<br />
2010<br />
Million<br />
tons<br />
2011 1)<br />
Million<br />
tons<br />
Hard Coal Output 11.0 11.7 11.3<br />
Hard Coal Exports 6.0 6.3 6.3<br />
Coke Exports 0.5 0.5 0.5<br />
Imports Germany 0.3 0.4 0.4<br />
• Steam Coal 0.2 --- 0.1<br />
• Coke 0.1 0.4 0.3<br />
Export Rate in %<br />
(Coke converted into coal)<br />
1) provisional<br />
LB-T44<br />
62 59 61
VENEZUELA<br />
Production<br />
Political tensions within the country and the disputes<br />
with neighbouring Colombia continued in the reporting<br />
period. The production of Carbones Del Guasare in the<br />
Paso Diablo Mine remained at the low level of 2010.<br />
Hard coal output in 2011 amounted to 3.78 million tons,<br />
the same amount as in the previous year. Slight growth<br />
of 0.4 million tons is projected for <strong>2012</strong>.<br />
Unusually heavy rains impaired mining operations and<br />
transport of the coal for several months. But government<br />
control of management causes inefficiency in<br />
daily operation as well.<br />
Production / Exports by Company<br />
2009<br />
Million<br />
tons<br />
2010<br />
Million<br />
tons<br />
2011<br />
Million<br />
tons<br />
Carbones Del Guasare 2.7 2.2 2.1<br />
Interamerican Coal 0.5 0.5 0.2<br />
Carbones De La Guajira --- 0.8 0.7<br />
Miscellaneous 0.3 0.6 0.8<br />
Total 3.5 4.1 3.8<br />
LB-T45<br />
Infrastructure<br />
While the current infrastructure is adequate to export<br />
the small quantities, it is obsolete. Owing to the expropriations<br />
of international corporations in the past,<br />
especially in the oil sector, as well as the general economic<br />
chaos in Venezuela, no investors are willing to<br />
put money into new infrastructure projects.<br />
Export<br />
Exports in 2011 remained at 3.8 million tons, the level<br />
of the previous year. Despite the best sales opportunities,<br />
Venezuela is unable to develop its potential. The<br />
largest purchasers were Europe (1.4 million tons) and<br />
the USA (0.7 million tons). The remain<strong>der</strong> was exported<br />
to Central and South America.<br />
Key Figures Venezuela<br />
2009<br />
Million<br />
tons<br />
2010<br />
Million<br />
tons<br />
2011<br />
Million<br />
tons<br />
Hard Coal Output 3.7 3.8 3.8<br />
Hard Coal Exports 3.7 3.8 3.8<br />
Imports Germany<br />
• Steam Coal<br />
0.35<br />
0.35<br />
0.43<br />
0.43<br />
0.16<br />
0.16<br />
Export Rate in %) 92.4 100.0 100.0<br />
LB-T46<br />
Small amounts of Colombian coal were exported<br />
through the ports in Frontier, Milliton and Bulk Trading.<br />
Estimates assume 0.7 million tons to 0.8 million<br />
tons.<br />
105
106 <strong>Report</strong> in Figures<br />
Table 1 World Energy Consumption by Source of Energy and Regions ....................................................... 107<br />
Table 2 World Hard Coal Production / Foreign Trade (Cross Bor<strong>der</strong> Trade and Seaborne Trade) ........ 108/109<br />
Table 3 Seaborne Hard Coal Trade ..........................................................................................................110/111<br />
Table 4 World Coke Production ......................................................................................................................112<br />
Table 5 Qualities of Steam Coal Traded on the World Market .......................................................................113<br />
Table 6 Qualities of Coking Coal Traded on the World Market ..............................................................114/115<br />
Table 7 Hard Coal Export of Australia ............................................................................................................116<br />
Table 8 Hard Coal Export of Indonesia ...........................................................................................................117<br />
Table 9 Hard Coal Export of Russia ...............................................................................................................118<br />
Table 10 Hard Coal Export of the United States ...............................................................................................119<br />
Table 11 Hard Coal Export of Colombia ......................................................................................................... 120<br />
Table 12 Hard Coal Export of South Africa ..................................................................................................... 121<br />
Table 13 Hard Coal Export of Canada ............................................................................................................. 122<br />
Table 14 Hard Coal Export of China ................................................................................................................ 123<br />
Table 15 Hard Coal Export of Poland .............................................................................................................. 124<br />
Table 16 Hard Coal Imports of EU-Countries - Imports and Cross Bor<strong>der</strong> Trade .......................................... 125<br />
Table 17 Primary Energy Consumption in Germany ....................................................................................... 126<br />
Table 18 Coal Handling in German Ports ........................................................................................................ 127<br />
Table 19 Hard Coal Sales in Germany ............................................................................................................. 128<br />
Table 20 Petcoke Sales in Germany ................................................................................................................. 129<br />
Table 21 Import of Hard Coal and Coke to Germany ............................................................................... 130/131<br />
Table 22 Consumption, Import/Export and Power Generation in Germany .................................................... 132<br />
Table 23 European/International Price Quotations .......................................................................................... 133<br />
Table 24 Germany: Energy Prices / Exchange Rates ....................................................................................... 134<br />
Table 25 Hard Coal Market in Germany: Quantities and Prices 1957 -2011 .................................................. 135
World-Energy Consumption by Source of Energy and Regions Mill. TCE<br />
Source of Energy 2005 2006 2007 2008 2009 2010 2011 1)<br />
Mineral Oil 5,792 5,584 5,645 5,617 5,551 5,754 5,550<br />
Natural Gas 3,768 3,653 3,767 3,898 3,794 4,083 4,070<br />
Nuclear Energy 940 907 888 886 873 895 1,110<br />
Hydro Power 1,000 996 1,013 1,026 1,059 1,108 370<br />
Hard Coal 4,106 4,014 4,207 4,394 4,358 4,750 4,850<br />
Lignite 330 330 330 330 330 330 330<br />
Total 15,936 15,484 15,850 16,151 15,965 16,920 16,280<br />
Shares Shares<br />
in %<br />
in %<br />
Region of Consumption 2005 2006 2007 2008 2009 2010 2011<br />
North America 26.5 25.8 25.6 24.8 23.8 23.1 22.6<br />
Asia/Australia 32.7 33.4 34.3 35.3 37.1 38.1 39.1<br />
since 2007 EU-27 16.0 15.8 16.4 15.8 14.4 14.5 14.3<br />
CIS 9.2 8.8 8.7 7.8 7.4 8.3 8.4<br />
Remaining World 15.6 16.2 15.0 16.3 17.3 16.0 15.6<br />
Total 100.0 100.0 100.0 100.0 100.0 100.0 100.0<br />
Mill. TCE<br />
Coal Consumption 4,030 4,436 4,344 4,724 4,688 5,080 5,180<br />
(Hard Coal and Lignite)<br />
Shares Shares<br />
in %<br />
in %<br />
Region of Consumption 2005 2006 2007 2008 2009 2010 2011<br />
North America 20.8 19.9 19.3 18.9 16.2 15.6 15.6<br />
Asia/Australia 56.7 58.3 59.7 61.0 65.7 67.1 66.7<br />
since 2007 EU-27 10.0 11.1 10.6 9.5 7.9 7.9 7.5<br />
CIS 6.0 5.5 3.6 5.2 4.6 4.8 5.2<br />
Remaining World 6.5 5.2 6.8 5.4 5.6 4.6 5.0<br />
Total 100.0 100.0 100.0 100.0 100.0 100.0 100.0<br />
Consi<strong>der</strong>ed were only commercial traded sources of energy.<br />
Source: BP Statistical Review of World Energy - 2010, 1) Year 2011: Own calculations<br />
Table 1<br />
107
108 World Hard Coal Production / Foreign Trade - (Cross Bor<strong>der</strong> Trade and Seaborne Trade)<br />
2006 2007 2008<br />
Production Export Import Production Export Import Production Export Import<br />
Germany 24 0 42 24 0 48 19 0 46<br />
France 0 0 21 0 0 18 0 0 19<br />
Great Britain 19 0 50 17 0 43 18 0 48<br />
Spain 1) 12 0 27 11 0 25 10 0 33<br />
Poland 94 16 4 87 12 5 83 8 9<br />
Czech Republic 14 5 1 13 7 2 13 7 3<br />
Romania 2 3 0 3 3 0 0<br />
since 2007 EU-27 168 21 236 158 19 231 149 15 217<br />
Russia 309 89 25 314 93 24 330 95 28<br />
Kazakhstan 92 25 0 88 26 0 90 25 0<br />
Ukraine 80 3 4 75 3 9 78 5 0<br />
Countries Total 481 117 29 477 122 33 498 125 28<br />
Canada 34 28 21 37 31 29 38 33 23<br />
USA 1,066 46 30 1,043 53 33 1,068 74 31<br />
Colombia 64 58 0 69 65 0 73 69 0<br />
Venezuela 8 8 0 8 8 0 6 6 0<br />
Countries Total 1,172 140 51 1,157 157 62 1,185 182 54<br />
South Africa 244 69 0 243 68 0 235 63 0<br />
Australia 314 237 0 322 250 0 334 261 0<br />
India 390 0 53 430 0 52 465 0 54<br />
China 2) 2,326 63 38 2,523 53 51 2,716 45 41<br />
Japan 0 0 177 0 0 180 0 0 190<br />
Indonesia 199 171 0 231 189 0 255 202 0<br />
Countries Total 3,473 540 268 3,184 242 283 3,436 247 285<br />
Other Countries 57 40 274 59 49 298 13 37 346<br />
World 5,351 858 858 5,600 907 907 5,850 930 930<br />
2011 preliminary figures<br />
1) Production incl."Lignito Negro"<br />
2) Production incl. lignite (about 50 mill. t estimated)<br />
Sources: Statistik <strong>der</strong> Kohlenwirtschaft. ECE. IEA. statistics of import and export countries. Barlow Jonker. internal calculations
2009 2010 2011<br />
Production Export Import Production Export Import Production Export Import<br />
15 0 36 14 0 41 13 0 44 Germany<br />
0 0 10 0 0 19 0 0 15 France<br />
18 0 38 18 1 27 18 0 32 Great Britain<br />
9 0 18 9 0 13 7 0 16 Spain 1)<br />
78 9 10 77 14 10 76 7 15 Poland<br />
11 6 2 11 7 2 12 6 2 Czech Republic<br />
4 0 5 4 0 4 4 0 5 Romania/Bulgaria 3)<br />
135 15 189 133 22 182 130 13 198 EU-27 since 2007<br />
300 100 25 321 97 10 336 107 2 Russia<br />
80 25 0 106 29 1 108 30 0 Kazakhstan<br />
72 4 0 76 6 10 82 0 10 Ukraine<br />
452 129 25 503 132 21 526 137 12 Countries Total<br />
28 28 2 33 33 9 33 33 9 Canada<br />
983 53 19 982 74 15 976 97 11 USA<br />
70 66 0 75 72 0 86 81 0 Colombia<br />
4 4 0 4 4 0 4 4 0 Venezuela<br />
1,085 151 21 1,094 183 24 1,099 215 20 Countries Total<br />
250 63 0 250 68 0 252 67 0 South Africa<br />
344 273 0 355 300 0 348 281 0 Australia<br />
532 0 59 537 0 86 554 0 114 India<br />
2,910 23 127 3,410 19 166 3,650 15 183 China 2)<br />
0 0 162 0 0 184 0 0 175 Japan<br />
280 230 0 295 240 0 318 270 0 Indonesia<br />
3,722 253 348 4,242 259 436 4,522 285 472 Countries Total<br />
112 32 333 143 89 390 81 44 340 Other Countries<br />
6,100 916 916 6,720 1,053 1,053 6,958 1,042 1,042 World<br />
3) since 2009 Romania/Bulgaria<br />
Mill. t (t=t)<br />
Table 2<br />
109
110 Seaborne Hard Coal Trade<br />
2006 2007 2008<br />
Exporting Countries Coking Coal Steam Coal Total Coking Coal Steam Coal Total Coking Coal Steam Coal Total<br />
Australia 124 113 237 138 112 250 135 126 261<br />
USA 20 6 26 26 11 37 36 17 53<br />
South Africa 1 68 69 1 67 68 0 63 63<br />
Canada 23 3 26 25 4 29 25 6 31<br />
China 4 59 63 2 51 53 4 42 46<br />
Colombia 1 58 59 1 65 66 0 69 69<br />
Indonesia 171 171 0 189 189 0 202 202<br />
Poland 1 9 10 1 4 5 0 2 2<br />
Russia 6 69 75 6 72 78 3 75 78<br />
Venezuela 8 8 0 8 8 0 6 6<br />
Other 3 30 33 2 35 37 4 24 28<br />
Total 183 594 777 202 618 820 207 632 839<br />
Importing Countries/ 2006 2007 2008<br />
Regions Coking Coal Steam Coal Total Coking Coal Steam Coal Total Coking Coal Steam Coal Total<br />
Europe 1) 45 167 212 50 161 211 50 159 209<br />
EU-25/since 2007 EU-27 40 164 204 45 156 201 45 143 188<br />
Asia 123 310 433 131 346 477 139 368 507<br />
Japan 73 119 192 74 126 200 56 131 187<br />
South Korea 20 60 80 21 65 86 23 73 96<br />
Taiwan 9 58 67 9 61 70 11 60 71<br />
Hongkong 3 13 16 3 20 23 3 17 20<br />
China 0 11 11 0 12 12 0 11 11<br />
India 19 23 42 23 29 52 29 25 54<br />
Latin America 13 4 17 14 6 20 18 5 23<br />
Other (incl. USA) 2 113 115 7 105 112 0 100 100<br />
Total 183 594 777 202 618 820 207 632 839<br />
2011 preliminary figures; excl. land transport<br />
1) incl. Mediterranian countries<br />
Analysis of several sources
2009 2010 2011<br />
Coking Coal Steam Coal Total Coking Coal Steam Coal Total Coking Coal Steam Coal Total Exporting Countries<br />
134 139 273 159 141 300 133 148 281 Australia<br />
31 12 43 48 16 64 60 31 91 USA<br />
1 61 62 1 67 68 1 66 67 South Africa<br />
22 6 28 27 6 33 26 6 32 Canada<br />
1 22 23 2 17 19 5 10 15 China<br />
3 63 66 4 69 73 3 78 81 Colombia<br />
0 230 230 0 277 277 0 270 270 Indonesia<br />
1 3 4 0 6 6 0 3 3 Poland<br />
5 85 90 7 80 87 8 93 101 Russia<br />
0 4 4 0 4 4 0 4 4 Venezuela<br />
3 33 36 2 30 32 3 30 33 Other<br />
201 658 859 250 713 963 239 739 978 Total<br />
2009 2010 2011 Importing Countries/<br />
Coking Coal Steam Coal Total Coking Coal Steam Coal Total Coking Coal Steam Coal Total Regions<br />
36 153 189 51 125 176 48 148 196 Europe 1)<br />
Mill. t<br />
36 137 173 51 125 176 39 116 155 EU-25/since 2007 EU-27<br />
115 432 547 149 511 660 140 531 671 Asia<br />
45 113 158 52 132 184 55 120 175 Japan<br />
16 81 97 19 92 111 31 98 129 South Korea<br />
11 59 70 5 59 64 0 67 67 Taiwan<br />
31 85 116 32 117 149 21 109 130 China<br />
0 12 12 0 10 10 0 13 13 Hongkong<br />
12 47 59 26 60 86 33 81 114 India<br />
6 4 10 3 19 22 4 31 35 Latin America<br />
44 69 113 47 58 105 47 29 76 Other (incl. USA)<br />
201 658 859 250 713 963 239 739 978 Total<br />
Table 3<br />
111
112<br />
Table 4<br />
World Coke Production 1,000 t<br />
Country/Region 2005 2006 2007 2008 2009 2010 2011<br />
Europe<br />
Austria 1,360 1,360 1,428 1,360 1,290 1,400 1,350<br />
Belgium 2,833 2,714 2,667 1,983 1,570 1,880 1,867<br />
Bosnia-Herzegovina 459 450 596 816 714 920 891<br />
Bulgaria 682 615 500 300 0 0<br />
Czech 3,227 3,231 3,063 3,206 2,172 2,396 2,436<br />
Finland 894 870 865 860 740 828 852<br />
France 4,301 4,290 4,374 4,422 3,170 3,110 2,841<br />
Germany 8,040 8,250 8,520 8,260 6,770 8,150 7,990<br />
Hungary 614 913 1,014 999 746 1,018 1,000<br />
Italy 4,515 4,560 4,632 4,455 2,724 3,708 4,488<br />
Netherlands 2,260 2,160 2,180 2,166 1,700 1,882 1,998<br />
Norway 0 0 0 0 0 0 0<br />
Poland 8,396 9,599 10,264 9,832 6,947 9,546 9,134<br />
Portugal 0 0 0 0 0 0 0<br />
Romania 1,910 1,804 1,669 1,017 237 0 0<br />
Slowakia 1,739 1,749 1,750 1,735 1,575 1,550 1,600<br />
Spain 2,590 2,742 2,753 2,400 1,691 2,021 2,045<br />
Sweden 1,191 1,182 1,193 1,174 980 1,118 1,151<br />
Great Britain 3,991 4,276 4,280 4,152 3,600 3,774 3,850<br />
Europe in total 49,002 50,765 51,748 49,137 36,626 43,301 43,493<br />
CIS 50,025 51,067 54,054 50,783 45,379 48,220 49,673<br />
North America 20,337 20,237 20,184 19,029 14,550 19,574 19,403<br />
Latin America 10,431 10,785 12,026 12,275 9,754 12,000 13,213<br />
Africa 2,861 2,855 3,232 2,975 1,970 2,691 2,618<br />
Middle East 5,892 6,211 6,135 5,711 5,282 5,610 5,800<br />
Asia<br />
China 254,117 297,680 321,714 312,148 355,140 383,400 427,790<br />
India 18,603 18,635 18,038 18,367 19,096 19,779 21,510<br />
Japan 38,095 38,077 38,354 38,300 35,900 37,447 37,500<br />
South Korea 10,246 9,887 9,949 10,614 9,577 12,835 14,484<br />
Other 4,537 3,963 4,585 4,580 4,630 5,454 5,558<br />
In total 325,598 368,242 392,640 384,009 424,343 458,915 506,842<br />
Austral-Asia 3,278 3,117 3,323 3,161 2,498 3,149 2,982<br />
WORLD in total 467,424 513,279 543,342 527,080 540,402 593,460 644,024<br />
Sources: Several sources, data from associations and industry
Qualities of Steam Coal Traded on the World Market<br />
Exporting Countries Volatile Ash Moisture Sulphur F. Carbon Grinding Index Calorific Value<br />
Atlantic Supplier<br />
% % % % % HGI kcal/kg<br />
USA (east coast) 17 - 39 5 - 15 5 - 12 0,5 - 3,0 39 - 70 31 - 96 6000 - 7200<br />
South Africa 16 - 31 8 - 15 6 - 10 0,5 - 1,7 51 - 61 43 - 65 5400 - 6700<br />
Colombia 30 - 39 4 - 15 7 - 16 0,5 - 1,0 36 - 55 43 - 60 5000 - 6500<br />
Venezuela 34 - 40 6 - 8 5 - 8 0,6 47 - 58 45 - 50 6500 - 7200<br />
Poland 25 - 31 8 - 16 7 - 11 0,6 - 1,0 44 - 56 45 - 50 5700 - 6900<br />
Czech Republic 25 - 27 6 - 8 7 - 9 0,4 - 0,5 58 - 60 60 - 70 6700 - 7100<br />
Russia 27 - 34 11 - 15 8 - 12 0,3 - 0,6 47 - 58 55 - 67 6000 - 6200<br />
Pacific Supplier<br />
Australia 25 - 30 8 - 15 7 - 8 0.3 - 1.0 47 - 60 45 - 79 5900 - 6900<br />
Indonesia 37 - 47 1 - 16 9 - 22 0.1 - 0.9 30 - 50 44 - 53 3700 - 6500<br />
China 27 - 31 7 - 13 8 - 13 0.3 - 0.9 50 - 60 50 - 54 5900 - 6300<br />
Russia (east coast) 17 - 33 11 - 20 8 - 10 0.3 - 0.5 47 - 64 70 - 80 5500 - 6800<br />
Vietnam / Anthr. 5 - 6 15 - 33 9 - 11 0.85 - 095 58 - 83 35 5100 - 6800<br />
Germany 19 - 33 6 - 7 8 - 9 0.7 - 1.4 58 - 65 60 - 90 6600 - 7100<br />
Indication in gross bandwidths<br />
Sources: see table 6<br />
Table 5<br />
113
114 Qualities of Coking Coal Traded on the World Market<br />
Exporting Countries/ Volatile Ash Latent Moisture Sulphur Phosphorus Swelling Index<br />
Qualities % % % % % FSI<br />
Low Volatile<br />
Australia/NSW 21-24 9.3-9.5 1.0 0.38-0.40 0.03-0.07 6-8<br />
Australia/Qld. 17-25 7.0-9.8 1.0-1.5 0.52-0.70 0.007-0.06 7-9<br />
Canada 21-24 9.5 0.6 0.30-0.60 0.04-0.06 6-8<br />
USA 18-21 5.5-7.5 1.0 0.70-0.90 n/a. 8-9<br />
Middle Volatile<br />
Australia/NSW 27-28 7.9-8.3 1.5-1.8 0.38-0.39 0.04-0.06 5-7<br />
Australia/Qld. 26-29 7.0-9.0 1.2-2.0 0.38-0.90 0.03-0.055 6-9<br />
Canada 25-28 8.0 0.9 0.30-0.55 0.03-0.07 6-8<br />
USA 26-27 6.8-9.0 1.0 0.95-1.10 n/a. 7-9<br />
Poland 23-28 7.0-8.9 0.7-1.5 0.60-0.80 n/a 6-9<br />
China 25-30 9.5-10.0 1.3-1.5 0.35-0.85 0.015<br />
High Volatile<br />
Australia/NSW 34-40 5.5-9.5 2.4-3.0 0.35-1.30 0.002-0.05 4 - 7<br />
Australia/Qld. 30-34 6.5-8.2 2.0 0.50-0.70 0.02-0.04 8 - 9<br />
Canada 29-35 3.5-6.5 1.0 0.55-1.20 0.006-0.04 6 - 8<br />
USA 30-34 6.8-7.3 1.9-2.5 0.80-0.85 n/a. 8 - 9<br />
Poland 29-33 6.9-8.9 0.8-1.5 0.60-1.00 n/a 5-8<br />
Germany 26.6 1) 7.4 1) 1.5 1) 1.1 1) 0.01-0.04 7-8<br />
Figures in bandwidths<br />
1) Utilization mixture for coking plant<br />
2) CSR-value ( Coke Strength un<strong>der</strong> Reduction) describing the heating strength of coke after heating up to 1,100° C and following<br />
CO 2 -fumigation. The CSR-values classified to the coal are only standard values.<br />
Sources: Australian Coal <strong>Report</strong>, Coal Americas, companies' information
Coke strength Fluidity Contraction Dilatation Reflection Macerale Minerals<br />
CSR-value 2) max ddpm max % max % middle % reactive % inert % %<br />
50-65 500-2000 20-30 25-140 1.23-1.29 38-61 36-58 3-4<br />
60-75 34-1400 24-34 35-140 1.12-1.65 61-75 20-34 3-5<br />
65-72 10-150 20-26 7-27 1.22-1.35 70-75 20-35 5<br />
60-70 30-100 25-28 30-60 1.30-1.40 65-75 20-30 3<br />
40-60 200-2000+ 25-35 0-65 1.01-1.05 50-53 43-44 4-6<br />
50-70 150-7000 19-33 (-)5-240 1.00-1.10 58-77 20-38 3-4<br />
50-70 150-600 21-28 50-100 1.04-1.14 70-76 20-24 5<br />
60-70 500-7000 22-18 50-100 1.10-1.50 72-78 18-24 4<br />
n/a n/a 26-32 30-120 n/a n/a n/a n/a<br />
35-55 100-4000 27-45 (-)10-60 0.69-0.83 67-84 11-28 2-5<br />
65-75 950-1000+ 23-24 35-160 0.95-1.03 61-79 18-36 3-4<br />
50-60 600-30000 22-31 50-148 1.00-0.95 76-81 17-19 2-4<br />
60-70 18000-26847 26-33 150-217 1.00-1.10 75-78 18-21 4<br />
n/a n/a n/a n/a n/a n/a n/a n/a<br />
50-65 30-3000 27-28 108-170 1.15-1.45 60-80 15-35 5<br />
Table 6<br />
115
116 Hard Coal Export of Australia 1,000 t<br />
Table 7<br />
Importing Countries 2005 2006 2007 2008 2009 2010 2011<br />
Germany 4,445 5,372 6,744 5,156 3,759 4,303 4,280<br />
France 4,033 4,542 3,733 3,446 2,077 2,946 2,366<br />
Belgium/Luxembourg 1,906 1,600 2,580 2,927 680 1,298 1,179<br />
The Netherlands 3,704 3,975 3,240 2,523 500 1,217 1,470<br />
Italy 2,286 2,234 2,466 2,041 1,122 1,741 1,560<br />
Great Britain 5,034 4,568 3,478 3,943 2,746 3,612 3,579<br />
Denmark 130 0 0 0 151 0 0<br />
Spain 3,508 2,977 3,043 2,105 776 1,715 1,337<br />
Portugal 0 0 0 0 0 0 0<br />
Sweden 1,261 1,289 1,273 1,379 716 1,825 1,092<br />
Other 364<br />
EU-25/since 2007: EU-27 26,307 26,557 27,709 24,730 12,904 18,657 17,227<br />
Israel 849 300 348 824 672 592 498<br />
Turkey 815 1,118 838 2,242 759 1,304 787<br />
Romania 0 0 0 0 0 0<br />
Other Europe 1) 1,246 1,120 315 383 350 288 0<br />
Europe 29,217 29,095 29,210 28,179 14,685 20,841 18,512<br />
Japan 104,812 103,293 115,466 117,962 101,618 117,768 103,291<br />
South Korea 30,158 23,576 22,096 36,797 41,662 43,629 45,915<br />
Taiwan 21,868 22,653 25,463 24,385 22,517 28,706 26,880<br />
Hongkong 0 0 0 303 1,175 440 895<br />
India 18,985 18,938 22,511 25,694 27,092 32,862 30,194<br />
China 5,468 7,450 3,957 3,295 46,546 37,069 34,014<br />
Brazil 3,454 2,929 3,360 5,036 3,713 3,457 2,198<br />
Chile 984 1,625 462 592 481 944 1,135<br />
Other Countries 18,123 27,718 27,899 17,576 13,902 15,042 18,109<br />
Export in Total 233,069 237,277 250,454 259,819 273,391 300,758 281,143<br />
1) incl. Mediterranean countries. 2011 preliminary figures<br />
Source: McCloskey
Hard Coal Export of Indonesia 1,000 t<br />
Importing Countries 2005 2006 2007 2008 2009 2010 2011<br />
Germany 132 1,509 1,168 513 86 69 34<br />
The Netherlands 2,139 3,704 1,822 1,669 239 0 927<br />
Italy 6,285 8,626 6,290 6,252 5,427 7,094 4,882<br />
Great Britain 1,302 1,822 1,141 2,126 786 162 390<br />
Ireland 602 609 152 318 0 0 0<br />
Denmark 0 0 0 0 0 0 0<br />
Spain 3,317 4,033 4,226 3,826 4,361 2,115 1,877<br />
Slovenia 634 1,562 1,242 2,032 840 840 559<br />
Other 770 2,835 2,000 1,014 376 2,220 851<br />
EU-25/since 2007: EU-27 15,181 24,700 18,041 17,750 12,115 12,500 9,520<br />
USA 2,050 2,646 2,962 2,956 2,025 1,240 1,180<br />
Chile 1,368 1,733 1,600 498 437 980 483<br />
Japan 27,313 32,842 34,135 39,719 32,109 26,040 24,950<br />
Südkorea 14,377 20,780 26,521 26,620 33,698 34,650 36,720<br />
Hongkong 9,409 10,514 11,550 10,382 11,131 9,540 8,650<br />
Taiwan 17,896 24,397 25,753 25,754 25,206 21,770 19,090<br />
Malaysia 7,400 7,324 7,814 9,415 11,184 8,600 11,880<br />
Philippines 3,906 4,113 4,290 6,160 7,066 5,160 6,050<br />
Thailand 6,404 7,800 9,413 11,371 10,334 8,770 6,780<br />
India 16,255 19,822 24,840 29,283 37,735 36,500 52,800<br />
China 2,503 6,219 14,894 16,093 39,402 68,060 77,950<br />
Other countries 4,981 8,049 7,492 6,259 7,844 6,164 13,836<br />
Export in total 129,043 170,939 189,305 202,260 230,286 239,974 269,889<br />
2011 preliminary figures<br />
Sources: Own calculations. companies' information<br />
Table 8<br />
117
118 Hard Coal Export of Russia 1,000 t<br />
Table 9<br />
Importing Countries 2005 2006 2007 2008 2009 2010 2011<br />
Germany 6,620 9,100 8,367 7,800 9,449 10,308 10,731<br />
Belgium/Luxembourg 1,000 1,747 1,327 1,867 0 0 0<br />
Italy 1,800 1,522 818 1,723 1,017 862 2,346<br />
Great Britain 18,000 22,701 19,828 21,434 15,501 7,332 11,592<br />
Spain 4,200 2,761 905 2,623 1,439 768 1,917<br />
Finland 2,400 4,440 5,080 3,745 4,770 2,900 5,111<br />
Poland 2500 3,327 5,000 5,267 1,766 1,402 1,389<br />
Romania 0 0 982 1,009 222 308 438<br />
Other 6039 8,029 5,533 11,325 13,532 12,802<br />
EU-25/since 2007: EU-27 37,000 51,637 50,336 51,001 45,489 37,412 46,326<br />
Turkey 7,000 6,500 4,013 2,229 8,672 9,139 8,180<br />
Romania 3,000 1,505 0 0 0 0 0<br />
Other Europe 10,000 8,005 4,013 2,229 8,672 9,139 8,180<br />
Europe 47,000 59,642 54,349 53,230 54,161 46,551 54,506<br />
Japan 10,700 9,204 11,491 9,960 8,718 10,575 11,608<br />
South Korea 3,300 1,071 6,358 7,495 4,541 8,574 13,100<br />
Taiwan 1,200 1,305 1,329 1,203 1,652 1,116 3,498<br />
China 800 1,030 269 760 12,122 11,660 10,836<br />
Other countries 1) 5,200 2,248 5,104 4,952 8,409 9,056 7,434<br />
Export in Total 2) 68,200 74,500 78,900 77,600 89,603 87,532 100,982<br />
1) 2005-2011 exports via Cyprus/Libanon; the quantities were partially exported in other not known countries<br />
2) only hard coal exports (seaborne trade) in countries outside of the former UdSSR<br />
2011 preliminary figures<br />
Sources: 2005-2011: information from companies. own calculations
Hard Coal Export of the United States 1,000 t<br />
Importing Countries 2005 2006 2007 2008 2009 2010 2011<br />
Germany 606 2,191 2,065 5,662 5,104 5,727 8,140<br />
France 1,146 1,475 2,162 3,213 3,052 2,788 3,615<br />
Belgium/Luxembourg 1,881 1,959 1,907 2,746 2,503 2,080 2,783<br />
The Netherlands 4,247 1,191 4,117 2,976 2,458 3,314 5,908<br />
Italy 2,226 2,975 3,212 2,891 2,125 3,000 5,070<br />
Great Britain 1,599 2,251 3,032 5,342 4,052 3,980 6,283<br />
Ireland 0 0 74 142 0 0 219<br />
Denmark 66 348 72 283 291 73 146<br />
Spain 1,685 1,472 1,337 2,161 1,581 1,837 1,551<br />
Portugal 143 267 258 391 1,020 531 891<br />
Finland 259 661 265 425 202 428 452<br />
Sweden 535 426 483 667 434 676 633<br />
Other 239 849 2,300 6,315 1,920 4,076 1,717<br />
EU-25/since 2007: EU-27 14,632 16,065 21,284 33,214 24,742 28,510 37,408<br />
Israel 0 0 0 0 0 0 0<br />
Turkey 1,708 1,106 1,306 1,736 1,295 2,296 2,670<br />
Romania 1,391 1,002 0 0 0 0 937<br />
Other Europe 1) 1,495 1,240 4,087 5,414 2,033 3,069 6,330<br />
Europe 19,226 19,413 26,677 40,364 28,070 33,875 47,345<br />
Canada 17,577 18,030 16,625 20,589 9,509 10,528 6,022<br />
Mexico 906 454 422 1,092 1,161 1,682 2,526<br />
Argentina 218 317 273 331 417 281 233<br />
Brazil 3,792 4,110 5,908 5,785 6,720 7,177 7,867<br />
Japan 1,888 301 5 1,572 822 2,869 6,209<br />
South Korea 1,304 515 201 1,225 1,562 5,237 9,479<br />
Taiwan 0 2 2 71 77 227 0<br />
Other countries 0 1,581 3,091 2,468 4,891 11,787 17,033<br />
Export in total 44,911 44,723 53,204 73,497 53,229 73,663 96,714<br />
1) incl. Mediterranean countries<br />
2011 preliminary figures<br />
Source:McCloskey<br />
Table 10<br />
119
120 Hard Coal Export (only Steam Coal) of Colombia 1,000 t<br />
Table 11<br />
Importing Countries 2005 2006 2007 2008 2009 2010 2011<br />
Germany 4,256 3,729 6,931 5,906 5,173 7,397 10,550<br />
France 2,228 3,341 2,720 2,589 2,232 2,329 1,100<br />
Belgium/Luxembourg 510 0 0 149 168 125 68<br />
The Netherlands 4,597 6,031 5,554 5,986 10,726 9,061 7,412<br />
Italy 2,589 1,993 1,887 2,026 2,080 1,715 1,593<br />
Great Britain 2,133 2,511 3,003 4,041 4,471 4,417 4,198<br />
Ireland 893 1,129 475 661 980 1,048 1,942<br />
Denmark 1,252 1,998 2,259 1,869 1,973 1,092 4,998<br />
Greece 0 71 149 0 0 76 480<br />
Spain 1,988 1,501 2,219 2,301 2,441 2,272 2,125<br />
Portugal 2,521 2,920 2,590 1,903 1,929 1,553 2,069<br />
Finland 0 158 0 130 72 277 459<br />
Sweden 0 0 0 0 0 0 1,169<br />
Slovenia 426 220 238 356 341 0 1,031<br />
Other 858<br />
since 2007: EU-27 23,393 25,602 28,163 28,359 32,587 31,362 40,052<br />
Israel 4,722 3,371 3,527 2,092 2,549 3,770 5,595<br />
Other Europe 1) 2,703 2,898 3,437 3,901 3,718 3,006 10,222<br />
Europe 30,818 31,871 35,127 34,352 38,854 38,138 55,869<br />
Japan 0 27 28 31 30 119 145<br />
Hongkong 0 0 0 0 0 0<br />
USA 17,641 20,179 21,830 21,919 14,191 11,301 6,928<br />
Canada 2,132 1,944 1,450 2,214 1,794 1,843 1,488<br />
Brazil 285 268 208 1,038 750 1,123 1,631<br />
Other Countries 3,924 4,211 6,034 9,123 7,814 16,683 10,033<br />
Export in total 54,800 58,500 64,677 68,677 63,433 69,207 76,094<br />
1) incl. Mediterranean countries. Turkey<br />
2011 preliminary figures<br />
Sources: IEA. McCloskey. companies´ information
Hard Coal Export of South Africa 1,000 t<br />
Importing Countries 2005 2006 2007 2008 2009 2010 2011<br />
Germany 9,453 8,189 6,505 8,190 5,231 3,363 2,644<br />
France 5,473 4,267 4,799 5,450 2,050 1,030 1,190<br />
Belgium/Luxembourg 1,677 1,512 1,088 1,140 300 500 430<br />
Netherlands 1) 7,713 13,687 10,580 8,234 4,049 1,087 1,056<br />
Italy 5,286 4,616 4,776 4,170 4,230 3,400 3,630<br />
Great Britain 11,837 8,431 4,580 3,110 1,000 470 670<br />
Ireland 788 389 478 0 460 220 50<br />
Denmark 1,651 2,300 2,130 1,140 1,080 780 1,380<br />
Greece 132 0 0 0 0 50 0<br />
Spain 8,836 7,585 6,724 5,981 5,062 3,670 2,470<br />
Portugal 1,561 1,000 1,970 1,660 1,240 320 0<br />
Finland 0 120 0 150 0 0 0<br />
Other 441 170 535 185 680 170 180<br />
since 2007: EU-27 54,848 52,266 44,165 39,410 25,382 15,060 13,700<br />
Israel 5,123 4,780 4,520 3,720 3,250 2,490 3,180<br />
Morocco 2,835 2,890 1,267 1,333 300 810 70<br />
Turkey 1,302 1,913 1,349 1,350 1,106 3,182 2,760<br />
Other Europe 1) 9,260 9,583 7,136 6,403 4,656 6,482 6,010<br />
Europe 64,108 61,849 51,301 45,813 30,038 21,542 19,710<br />
Japan 140 0 440 50 390 300 620<br />
South Korea 130 0 290 1,150 525 2,260 3,520<br />
Taiwan 411 70 410 160 2,220 2,990 3,490<br />
Hongkong 0 0 0 0 340 160 0<br />
India 3,904 2,469 8,492 7,766 18,690 22,397 17,071<br />
China 0 0 30 0 790 6,960 10,460<br />
USA 126 0 100 0 0 170 40<br />
Brazil 654 1,484 759 1,223 296 1,099 1,030<br />
Other countries 5,089 3,064 6,068 6,493 8,927 10,534 11,380<br />
Export in total 74,562 68,936 67,890 62,655 62,216 68,412 67,321<br />
1) incl. Mediterranean countries<br />
2011 preliminary figures<br />
Sources: South African Coal <strong>Report</strong>. own calculations<br />
Table 12<br />
121
122 Hard Coal Export of Canada 1,000 t<br />
Table 13<br />
Importing Countries 2005 2006 2007 2008 2009 2010 2011<br />
Germany 1,757 1,608 1,733 1,708 1,070 1,203 1,736<br />
France 529 372 598 569 117 166 104<br />
Belgium/Luxembourg 0 0 0 0 0 48 55<br />
The Netherlands 807 1,194 1,047 272 300 696 267<br />
Italy 1,469 1,178 1,013 1,084 465 1,016 1,000<br />
Great Britain 1,677 1,418 1,492 1,123 317 284 505<br />
Denmark 0 0 0 0 0 0 0<br />
Spain 344 175 227 235 1 64 120<br />
Portugal 0 0 0 0 0 0 0<br />
Finland 516 494 345 426 258 416 422<br />
Sweden 0 0 0 0 0 0 0<br />
Other 59 221<br />
since 2007: EU-27 7,099 6,439 7,086 5,587 2,528 3,952 4,430<br />
Other Europe 1) 1,170 1,582 1,203 1,426 952 840 182<br />
Europe 8,269 8,021 8,289 7,783 3,480 4,792 4,612<br />
Japan 7,499 8,676 10,548 11,482 8,765 10,615 9,265<br />
South Korea 5,014 4,975 6,078 6,736 7,381 6,553 8,611<br />
Taiwan 1,276 1,221 1,130 1,154 795 638 1,070<br />
Brazil 1,718 1,584 1,545 2,020 936 1,693 2,281<br />
USA 1,709 1,750 1,758 1,725 1,045 1,470 1,330<br />
Chile 549 721 702 411 214 259 216<br />
Mexico 406 274 230 695 283 697 400<br />
Other countries 1,490 344 369 468 4,931 5,944 5,602<br />
Export in Total 27,930 27,566 30,649 32,474 27,830 32,661 33,387<br />
1) incl. Mediterranean countries<br />
2011 preliminary figures<br />
Sources: McCloskey. own estimations
Hard Coal Export of China 1,000 t<br />
Importing Countries 2005 2006 2007 2008 2009 2010 2011<br />
Germany 75 0 43 14 5 7 11<br />
France 8 0 166 216 0 0 0<br />
Belgium/Luxembourg 282 189 170 143 0 14 0<br />
The Netherlands 141 245 51 57 5 0 0<br />
Italy 0 0 0 0 0 0 0<br />
Great Britain 54 34 0 0 0 0 0<br />
Spain 332 292 0 104 0 0 0<br />
Greece 0 0 0 0 0 0 0<br />
EU-15 892 760 430 534 10 21 11<br />
Japan 23,175 20,586 15,548 13,337 6,391 6,436 6,222<br />
South Korea 21,206 18,779 19,225 16,457 9,919 7,207 5,559<br />
Taiwan 16,230 13,258 12,690 10,597 4,870 4,418 2,197<br />
Hongkong 944 855 674 475 122 395 1<br />
India 3,855 5,001 539 1,006 0 0 173<br />
Malaysia 46 36 37 52 12 12 6<br />
Thailand 0 28 1 1 0 0 0<br />
North Korea 147 576 237 228 52 224 205<br />
Philippines 1,916 1,035 1,019 1,119 839 2 0<br />
Brazil 278 191 283 156 0 0 0<br />
Other countries 2,986 2,127 2,435 1,309 133 225 127<br />
Export in total 71,675 63,232 53,118 45,271 22,348 18,940 14,501<br />
2011 preliminary figures<br />
Source: McCloskey<br />
Table 14<br />
123
124 Hard Coal Export of Poland 1,000 t<br />
Table 15<br />
Importing Countries 2005 2006 2007 2008 2009 2010 2011<br />
Germany 7,022 7,330 4,651 3,834 2,649 3,659 2,659<br />
France 1,227 762 340 358 597 10<br />
Belgium 649 291 1 1 79 232 1<br />
The Netherlands 270 320 70 1 165 81 0<br />
Italy 540 248 111 0 0 0 0<br />
Great Britain 1,614 1,008 277 197 565 598 634<br />
Ireland 287 235 255 266 240 257 206<br />
Denmark 821 523 350 151 82 455 60<br />
Spain 111 150 64 0 0 23 20<br />
Portugal 221 0 0 0 0 0 0<br />
Finland 653 513 273 88 224 220 37<br />
Austria 1,155 1,233 1,807 906 853 883 435<br />
Sweden 172 283 288 60 59 134 84<br />
Czech Republic 1,146 1,642 2,365 1,017 746 1,444 1,820<br />
Slovakia 802 1,030 617 64 71 638 568<br />
Hungary 380 249 259 127 58 118 133<br />
Other 50 72 8 1,029 1,970 557 10<br />
since 2007: EU-27 17,120 15,889 11,736 7,741 8,119 9,896 6,677<br />
Other countries 1,451 620 364 559 581 480 101<br />
Export in total 18,571 16,509 12,100 8,300 8,700 10,376 6,778<br />
2011 preliminary figures<br />
Sources: McCloskey. Fe<strong>der</strong>al Statistical Office and own calculation
Hard Coal Imports of EU-Countries: Import incl. Cross Bor<strong>der</strong> Trade of Member States 1,000 t<br />
2005 2006 2007 2008 2009 2010 2011<br />
Germany 39,900 46,500 47,480 44,000 36,800 41,000 44,200<br />
France 20,500 20,700 19,200 19,400 16,200 18,900 15,300<br />
Italy 24,500 24,500 24,600 26,200 22,000 22,700 24,000<br />
Netherlands 13,000 12,000 13,000 12,100 10,800 11,800 11,700<br />
Belgium 10,000 9,000 8,000 6,000 4,100 3,500 4,000<br />
Luxembourg 150 150 150 150 200 200 200<br />
Great Britain 43,800 49,000 45,300 43,200 38,100 26,500 31,700<br />
Ireland 2,500 3,000 3,000 2,300 2,300 2,200 1,900<br />
Denmark 5,200 7,000 8,000 7,700 4,400 4,100 4,500<br />
Greece 700 800 800 800 400 600 600<br />
Spain 24,700 22,550 20,800 16,500 17,100 12,800 15,300<br />
Portugal 5,300 5,700 5,500 3,800 3,100 2,700 3,600<br />
Finland 4,500 7,000 7,000 4,600 6,000 5,900 7,000<br />
Austria 4,100 4,000 4,000 4,200 4,000 4,000 3,800<br />
Sweden 2,700 3,000 3,200 2,500 2,400 3,000 2,700<br />
Poland 2,000 5,200 5,800 9,900 10,000 10,000 15,100<br />
Czech Republic 1,000 1,900 2,500 2,200 1,700 1,900 2,400<br />
Hungary 500 1900 2,000 1,900 1,400 1,800 1,500<br />
Slovakia 5,600 5,600 5,300 4,900 3,200 3,500 3,400<br />
Slovenia 500 600 500 600 600 600 500<br />
Latvia 200 300 n.a. n.a. n.a. n.a. n.a.<br />
Lithuania 500 700 n.a. n.a. n.a. n.a. n.a.<br />
Estonia 500 100 n.a. n.a. n.a. n.a. n.a.<br />
Cyprus -<br />
Malta -<br />
Bulgaria (1,500) (1600) 1400 1300 3,500 2,900 3,300<br />
Romania (3,500) (3300) 3300 3200 1,200 1,400 1,200<br />
EU-25 212,350 231,200<br />
EU27 since 2007 217,350 236,100 230,830 217,450 189,500 182,000 197,900<br />
thereof coke: thereof coke: thereof coke: coke: coke: coke:<br />
Coke 10,000 11,000 12,000 11,000 11,000 8,000 8,000<br />
Sources: McCloskey. Euracoal. own calculations<br />
2011 preliminary figures<br />
Table 16<br />
125
126<br />
Table 17<br />
Primary Energy Consumption in Germany mill. TCE<br />
Energy Sources 2005 2006 2007 2008 2009 2010 2011<br />
Hard Coal 62.8 65.6 67.4 61.4 50.1 57.9 57.5<br />
thereof Import Coal (37.8) (45.3) (46.0) (43.6) (41.8) (50.4) (49.5)<br />
Lignite 54.5 53.7 55.0 53.0 51.4 51.6 53.3<br />
Mineral Oil 175.8 176.7 157.9 166.4 159.3 160.0 155.2<br />
Natural Gas 110.9 112.1 106.6 104.4 100.3 107.1 93.3<br />
Nuclear Energy 60.7 62.3 52.3 55.4 50.2 52.3 40.2<br />
Hydro and Wind Power 5.9 6.3 7.4 7.5 7.1 7.2 7.9<br />
Foreign Trade Balance Electricity -1.0 -2.4 0.2 0.0 -1.8 -2.2 -0.7<br />
Other Energy Sources 18.0 23.2 25.6 36.0 41.8 47.9 49.7<br />
Total 487.6 497.5 472.4 484.1 458.4 481.8 456.4<br />
Shares in %<br />
Energy Sources 2005 2006 2007 2008 2009 2010 2011<br />
Hard Coal 12.9 13.2 14.3 12.7 10.9 12.0 12.6<br />
thereof Import Coal (7.8) (9.1) (9.7) (9.0) (9.1) (10.5) (10.9)<br />
Lignite 11.2 10.8 11.6 11.0 11.2 10.7 11.7<br />
Mineral Oil 36.1 35.5 33.4 34.3 34.8 33.2 34.0<br />
Natural Gas 22.7 22.6 22.6 21.6 21.9 22.2 20.4<br />
Nuclear Energy 12.4 12.5 11.1 11.4 11.0 10.9 8.8<br />
Hydro and Wind Power 1.2 1.3 1.5 1.6 1.6 1.5 1.7<br />
Foreign Trade Balance Electricity -0.2 -0.5 0.0 0.0 -0.4 -0.5 -0.2<br />
Other Energy Sources 3.7 4.6 5.5 7.4 9.0 10.0 11.0<br />
Total 100.0 100.0 100.0 100.0 100.0 100.0 100.0<br />
Sources: The Working Group on Energy Balances, The Fe<strong>der</strong>al Statistical Office of Germany, own calculations
North Sea Ports<br />
Coal Handling in German Ports 1,000 t<br />
2003 2004 2005 2006 2007 2008 2009 2010 2011<br />
Hamburg 4,794 4,944 4,636 4,963 5,781 5,195 5,189 5,276 5,805<br />
Wedel - Schulau 700 700 600 871 0 0 0 0 530<br />
Stade-Bützfleth 43 12 19 13 6 4 9 5 8<br />
Wilhelmshaven 1,453 1,672 1,520 1,332 1,360 2,229 2,404 1,843 1,924<br />
Bremen 1,464 1,505 1,216 1,715 1,965 1,668 1,410 1,796 1,599<br />
Brunsbüttel 387 393 273 622 749 874 500 434 424<br />
Emden 5 5 1 2 -<br />
Nordenham 1,439 2,058 1,915 2,129 2,162 1,889 2,284 2,235 2,792<br />
Papenburg 260 289 214 170 143 149 121 141 0<br />
Remaining North Sea Ports S.H. 67 126 37 70 632 574 502 610 0<br />
Remaining North Sea Ports N.S. 2 - - - - - 7 3<br />
Total 10,609 11,699 10,430 11,885 12,803 12,587 12,420 12,349 13,085<br />
Baltic Sea Ports<br />
Rostock 1,145 1,187 1,145 1,251 993 1,443 823 1,200 1,345<br />
Wismar 41 42 33 30 22 35 26 34 0<br />
Stralsund 2 1 3 0 0 1 - - -<br />
Lübeck 3 - - - - - - - -<br />
Flensburg 358 343 325 275 246 301 230 209 237<br />
Kiel 113 418 402 193 123 291 453 479 271<br />
Saßnitz 7 3 1 5 1<br />
Wolgast 2 - - -<br />
Remaining Baltic Sea Ports 7 4 2 3 - 1 - - -<br />
Total 1,669 1,995 1,910 1,752 1,393 2,075 1,533 1,927 1,854<br />
Tonnage Total 12,278 13,694 12,340 13,637 14,196 14,662 13,953 14,276 14,939<br />
Source: Fe<strong>der</strong>al Statistical Office<br />
Table 18<br />
127
128<br />
Table 19<br />
Total Sales 1) in Hard Coal, Coke and Briquettes<br />
Hard Coal Sales in Germany 1,000 t<br />
2005 2006 2007 2008 2009 2010 2011<br />
Power Stations 50,000 53,800 55,400 52,300 43,700 45,800 44,400<br />
Iron and Steel Industry 17,400 18,400 18,800 17,700 12,900 18,400 16,800<br />
Heating Market/Other 2) 1,100 1,300 1,600 1,700 1,400 1,800 1,900<br />
Total 68,500 73,500 75,800 71,700 58,000 66,000 63,100<br />
1) Domestic Sales 2)incl, Consumption of Mines, Benefits<br />
Sources: Statistik <strong>der</strong> Kohlenwirtschaft, 2011 own calculations<br />
Therefrom Import Coal<br />
Power Stations 3) 30,900 27,300 33,400 34,900 30,900 34,400 33,600<br />
Iron and Steel Industry 11,600 11,300 14,700 13,600 10,000 14,700 14,400<br />
Heating Market 1,800 700 1,000 1,300 900 1,300 1,500<br />
Total Imports 44,300 39,300 49,100 49,800 41,800 50,400 49,500<br />
3) Imports of power plants accord, to K-Bogen (BAFA, Division 431), own calculations<br />
Sources: BAFA, Statistik <strong>der</strong> Kohlenwirtschaft, own calculations/partly estimations
Pet Coke in Germany 1,000 t<br />
Petcoke 2002 2003 2004 2005 2006 2007 2008 2009 2010 2011<br />
Production of refineries 1642 1799 1794 1912 1918 1851 2018 1902 2013 1763<br />
+ Import 1031 885 858 762 988 727 937 556 703 676<br />
= Quantity 2673 2684 2652 2674 2906 2578 2955 2458 2716 2439<br />
- Domestic sales 1415 1247 1278 1173 1378 1177 1464 1026 1125 1056<br />
- Export 682 729 683 660 654 628 673 815 774 761<br />
- Consumption of refineries 576 708 691 841 874 773 818 617 817 622<br />
= Usage 2673 2684 2652 2674 2906 2578 2955 2458 2716 2439<br />
Source: MWV<br />
Table 20<br />
129
130 Imports of Hard Coal and Coke to Germany<br />
Countries<br />
Steam<br />
Coal<br />
Coking<br />
Coal<br />
2008 2009<br />
Anthr. Coke Total<br />
Steam<br />
Coal<br />
Coking<br />
Coal<br />
Anthr. Coke Total<br />
Poland 3,790 45 0 1,566 5,401 2,489 24 0 1,712 4,225<br />
Czech Republic 168 0 0 183 351 151 0 0 129 280<br />
Spain 0 0 0 482 482 0 0 0 0 0<br />
France 0 0 0 459 459 0 0 0 408 408<br />
Other 969 6 70 484 1,529 459 0 89 427 975<br />
since 2007 EU-27 4,927 51 70 3,174 8,222 3,099 24 89 2,676 5,888<br />
CIS 6,939 607 292 173 8,011 8,696 478 260 102 9,536<br />
Norway 1,522 148 70 0 1,740 1,321 0 0 0 1,321<br />
USA 3,079 2,583 0 0 5,662 3,207 1,897 0 0 5,104<br />
Canada 22 1,651 0 0 1,673 0 1,070 0 0 1,070<br />
Colombia 5,710 82 0 0 5,792 5,105 68 0 21 5,194<br />
South Africa 8,086 140 0 0 8,226 5,246 4 0 0 5,250<br />
Australia 520 5,020 0 0 5,540 447 3,311 0 0 3,758<br />
China 10 2 2 628 642 3 0 2 141 146<br />
Indonesia 513 0 0 0 513 86 0 0 0 86<br />
Venezuela 63 0 0 29 92 346 0 0 7 353<br />
Other Third Countries 1,851 0 35 1 1,887 1,687 0 10 2 1,699<br />
0<br />
Third Countries 28,315 10,233 399 831 39,778 26,144 6,828 272 273 33,517<br />
Total 33,242 10,284 469 4,005 48,000 29,243 6,852 361 2,949 39,405<br />
2011 preliminary figures<br />
Sources: Fe<strong>der</strong>al Statistical Office, BAFA, own calculations
Steam<br />
Coal<br />
Coking<br />
Coal<br />
2010 2011<br />
Anthr. Coke Total<br />
Steam<br />
Coal<br />
Coking<br />
Coal<br />
Anthr. Coke Total Countries<br />
3,650 8 1 2,399 6,058 2,646 11 1 2,481 5,139 Poland<br />
63 0 0 379 442 27 0 3 330 360 Czech Republic<br />
0 0 0 86 86 0 0 0 33 33 Spain<br />
0 0 0 179 179 0 0 0 62 62 France<br />
1007 74 170 490 1,741 620 20 196 595 1,431 Other<br />
4,720 82 171 3,533 8,506 3,293 31 200 3,501 7,025 EU-27 since 2007<br />
9,295 730 317 248 10,590 9,574 863 294 361 11,092 CIS<br />
856 0 0 0 856 857 0 0 0 857 Norway<br />
2,742 2,956 29 0 5,727 5,079 3,036 24 0 8,139 USA<br />
0 1,203 0 0 1,203 43 1,693 0 0 1,736 Canada<br />
7,397 191 0 39 7,627 10,550 214 0 62 10,826 Colombia<br />
3,330 0 1 0 3,331 2,644 0 0 0 2,644 South Africa<br />
289 4,014 0 0 4,303 206 4,074 0 0 4,280 Australia<br />
7 0 0 199 206 6 0 5 184 195 China<br />
70 0 0 0 70 0 34 0 0 34 Indonesia<br />
410 20 0 2 432 132 29 0 0 161 Venezuela<br />
2,236 3 0 93 2,332 1,261 1 7 120 1,389 Other Third Countries<br />
26,632 9,117 347 581 36,677 30,352 9,944 330 727 41,353 Third Countries<br />
31,352 9,199 518 4,114 45,183 33,645 9,975 530 4,228 48,378 Total<br />
1,000 t<br />
Table 21<br />
131
132 Consumption, Import/Export and Power Generation in Germany<br />
Table 22<br />
Gross Electricity Consumption<br />
2005 2006 2007 2008 2009 2010 2011<br />
in TWh 612.1 617.2 618.1 614.8 578.9 610.4 608.5<br />
Electricity Foreign Trade<br />
in TWh<br />
Exports 61.9 65.9 63.4 62.7 54.9 59.9 56.0<br />
Imports 53.4 46.1 44.3 40.2 40.6 42.2 50.0<br />
Balance -8.5 -19.8 -19.1 -22.5 -14.3 -17.7 -6.0<br />
Gross Electricity Generation<br />
in TWh 620.6 637.0 637.2 637.0 593.2 628.1 614.5<br />
Utilization of Energy Sources for Power Generation<br />
in TWh 2005 2006 2007 2008 2009 2010 2011<br />
Hard Coal 134.1 137.9 142.0 124.6 107.9 117.0 114.5<br />
therefrom Import Coal 1) (85.3) (85.4) (86.2) ('86.4) (76.3) (86.8) (86.4)<br />
Lignite 154.1 151.1 155.1 150.6 146.5 145.9 153.0<br />
Natural Gas 71.0 73.4 75.9 86.7 78.8 86.8 84.0<br />
Fuel Oil 11.6 10.5 9.6 9.2 9.6 8.4 7.0<br />
Nuclear Energy 163.0 167.4 140.5 148.8 134.9 140.6 108.0<br />
Hydro / Wind Power 53.9 57.5 67.8 67.1 57.6 58.8 66.0<br />
Other 32.8 39.4 46.3 50.0 57.9 70.6 82.0<br />
Total 620.5 637.2 637.2 637.0 593.2 628.1 614.5<br />
1) Sales to power stations, 2011: preliminary figures<br />
Sources:BDEW, Statistik <strong>der</strong> Kohlenwirtschaft, BAFA, AG Energiebilanzen, DIW, own calculations
Crude Oil Prices<br />
European / International Price Quotations<br />
2005 2006 2007 2008 2009 2010 2011<br />
USD/Barrel Brent 55.00 65.14 72.44 96.99 67.86 79.47 111.27<br />
USD/TCE 283.00 335.00 373.00 499.21 349.28 409.04 572.71<br />
Source: MWV<br />
Natural Gas Prices: Free German Bor<strong>der</strong><br />
€/TCE 142.00 191.00 180.00 237.00 198.00 185.00 230.00<br />
Source: Statistik <strong>der</strong> Kohlenwirtschaft<br />
Steam Coal Marker Prices 1 %S, CIF NW Europa<br />
USD/TCE 71.25 74.41 101.03 174.74 81.75 107.16 142.81<br />
€/TCE 57.27 59.23 73.17 118.29 58.69 81.01 102.49<br />
Source: McCloskey<br />
Sea Freight Rates Capesize Units - Port of Destination ARA ( Amsterdam, Rotterdam, Antwerp)<br />
South Africa USD/t 15.75 15.94 32.33 30.36 13.66 12.41 10.74<br />
USA/East Coast USD/t 16.60 14.87 34.47 32.65 16.68 15.06 12.01<br />
Australia/NSW USD/t 24.00 24.07 51.77 50.91 22.46 22.15 19.43<br />
Colombia USD/t 16.10 14.89 33.55 31.71 16.25 14.75 11.89<br />
Sources: Frachtcontor Junge, own calculations<br />
Table 23<br />
133
134<br />
Table 24<br />
Exchange Rates<br />
Germany - Energy Prices / Exchange Rates<br />
2005 2006 2007 2008 2009 2010 2011<br />
EUR/USD 0.8038 0.7965 0.7296 0.6799 0.7169 0.7543 0.7184<br />
Source: Deutsche Bundesbank<br />
Cross Bor<strong>der</strong> Prices for Coking Coal and Coke - EUR/t<br />
Imported Coking Coal 95.25 105.88 96.22 132.62 173.75 174.78 185.30<br />
Imported Coke 230.30 166.79 175.55 281.20 196.91 259.37 319.78<br />
Sources: Coking Coal - since 2003 Fe<strong>der</strong>al Statistical Office. Coke: Fe<strong>der</strong>al Statistical Office<br />
Cross Bor<strong>der</strong> Prices for Steam Coal in € / TCE: Utilization in Power Plants<br />
Source: BAFA Division 431 (cross bor<strong>der</strong> price = cif price ARA + freight German bor<strong>der</strong>)<br />
Energy Prices free power station €/ TCE<br />
year 1. quarter 2. quarter 3. quarter 4. quarter Anual Value<br />
2004 48.68 55.44 58.76 61.81 55.36<br />
2005 64.81 64.01 65.59 65.8 65.02<br />
2006 63.03 61.61 59.75 62.54 61.76<br />
2007 63.10 63.51 67.14 78.54 68.24<br />
2008 93.73 106.01 131.80 120.13 112.48<br />
2009 91.24 76.35 69.36 73.31 78.81<br />
2010 75.06 86.34 87.97 92.89 85.33<br />
2011 105.30 105.22 106.22 110.44 106.97<br />
Energy Sources 2005 2006 2007 2008 2009 2010 2011<br />
Natural Gas 206,00 220,00 209,00 269,00 246,00 222,00 256,00<br />
Heating Oil. Heavy 166,00 203,00 198,00 275,00 208,00 270,00 355,00<br />
Steam Coal 70,00 67,00 73,00 117,00 84,00 90,00 112,00<br />
Sources: BAFA. Statistik <strong>der</strong> Kohlenwirtschaft. own calculations. 2011 preliminary
Imports of Hard Coal and<br />
Coke t=t<br />
Year Mill. t Year Mill. t<br />
Hard Coal Market in Germany<br />
Quantities and Prices 1957 - 2011<br />
Quantities Prices<br />
Domestic Mining of Hard<br />
Coal Mill. t usable output<br />
Year Mill. t Year Mill. t<br />
Steam Coal from<br />
non-EEC Countries 1)<br />
Domestic Industry<br />
Coal 2)<br />
Year €/ TCE Year €/ TCE Year €/ TCE Year €/ TCE<br />
1957 18.9 1987 8.8 1957 149.4 1987 75.8 1957 40 1987 46 1957 29 1987 132<br />
1958 13.9 1988 8.1 1958 148.8 1988 72.9 1958 37 1988 42 1958 29 1988 134<br />
1959 7.5 1989 7.3 1959 141.7 1989 71.0 1959 34 1989 49 1959 29 1989 137<br />
1960 7.3 1990 11.7 1960 142.3 1990 69.8 1960 33 1990 49 1960 29 1990 138<br />
1961 7.3 1991 16.8 1961 142.7 1991 66.1 1961 31 1991 46 1961 29 1991 139<br />
1962 8.0 1992 17.3 1962 141.1 1992 65.5 1962 30 1992 42 1962 30 1992 147<br />
1963 8.7 1993 15.2 1963 142.1 1993 57.9 1963 30 1993 37 1963 30 1993 148<br />
1964 7.7 1994 18.1 1964 142.2 1994 52.0 1964 30 1994 36 1964 31 1994 149<br />
1965 8.0 1995 17.7 1965 135.1 1995 53.1 1965 29 1995 39 1965 32 1995 149<br />
1966 7.5 1996 20.3 1966 126.0 1996 47.9 1966 29 1996 38 1966 32 1996 149<br />
1967 7.4 1997 24.3 1967 112.0 1997 45.8 1967 29 1997 42 1967 32 1997 149<br />
1968 6.2 1998 30.2 1968 112.0 1998 40.7 1968 28 1998 37 1968 30 1998 149<br />
1969 7.5 1999 30.3 1969 111.6 1999 39.2 1969 27 1999 34 1969 31 1999 149<br />
1970 9.7 2000 33.9 1970 111.3 2000 33.3 1970 31 2000 42 1970 37 2000 149<br />
1971 7.8 2001 39.5 1971 110.8 2001 27.1 1971 32 2001 53 1971 41 2001 149<br />
1972 7.9 2002 39.2 1972 102.5 2002 26.1 1972 31 2002 45 1972 43 2002 160<br />
1973 8.4 2003 41.3 1973 97.3 2003 25.7 1973 31 2003 40 1973 46 2003 160<br />
1974 7.1 2004 44.3 1974 94.9 2004 25.7 1974 42 2004 55 1974 56 2004 160<br />
1975 7.5 2005 39.9 1975 92.4 2005 24.7 1975 42 2005 65 1975 67 2005 160<br />
1976 7.2 2006 46.5 1976 89.3 2006 20.7 1976 46 2006 62 1976 76 2006 170<br />
1977 7.3 2007 47.5 1977 84.5 2007 21.3 1977 43 2007 68 1977 76 2007 170<br />
1978 7.5 2008 48.0 1978 83.5 2008 17.1 1978 43 2008 112 1978 84 2008 170<br />
1979 8.9 2009 39.5 1979 85.8 2009 13.8 1979 46 2009 79 1979 87 2009 170<br />
1980 10.2 2010 45.2 1980 86.6 2010 12.9 1980 56 2010 85 1980 100 2010 170<br />
1981 11.3 2011 48.4 1981 87.9 2011 12.1 1981 84 2011 107 1981 113 2011 170<br />
1982 11.5 1982 88.4 1982 86 1982 121<br />
1983 9.8 1983 81.7 1983 75 1983 125<br />
1984 9.6 1984 78.9 1984 72 1984 130<br />
1985 10.7 1985 81.8 1985 81 1985 130<br />
1986 10.9 1986 80.3 1986 60 1986 130<br />
2011: preliminary figures, since 1991 Eastern Germany included, EUR values are rounded<br />
1) Price free German bor<strong>der</strong> (BAFA Div. 432), since 1996: BAFA Div. 431, since 2010: BAFA Div. 422<br />
2) Estimated cost-covering price<br />
Sources: Fe<strong>der</strong>al Statistical Office, Statistik <strong>der</strong> Kohlenwirtschaft, BAFA, RAG, own calculations<br />
Table 25<br />
135
136<br />
ARA Amsterdam-Rotterdam-Antwerp<br />
BAFA Bundesamt für Wirtschaft und Ausfuhrkontrolle<br />
(Fe<strong>der</strong>al Office of Economics and Export Control)<br />
BDEW Bundesverband <strong>der</strong> Energie- und Wasserwirtschaft<br />
e.V. (German Energy and Water Association)<br />
BEE Black Economic Empowerment<br />
BIP Bruttoinlandsprodukt (GDP - Gross domestic product)<br />
capesize definition for bulk-carrier > 100.000 - 150.000 DWT<br />
CCS Carbon Capture Storage<br />
CHP combined heat and power<br />
cif INCOTERM: cost-insurance-freight<br />
CIS Confe<strong>der</strong>ation of Independent States<br />
DIW Deutsches Institut für Wirtschaftsforschung (German<br />
Institute for Economic Research)<br />
ECE Economic Commission for Europe<br />
EEG Erneuerbare-Energien-Gesetz (Renewable Energy<br />
Sources Act)<br />
EEX European Energy Exchange AG, Leipzig<br />
ETS Emission Trading System<br />
EUA EU Allowances<br />
ERU Emission Reduction Unit<br />
EWEA European Wind Energy Association<br />
fob INCOTERM: free on board<br />
GVSt Gesamtverband Steinkohle (German Hard Coal<br />
Association)<br />
ICER International Certified Emission Reduction<br />
IEA International Energy Agency<br />
Glossary<br />
HS heavy fuel oil<br />
kWh kilowatt hour<br />
LNG Liquified Natural Gas<br />
MENA Middle East North Africa<br />
mt metric ton<br />
NAR coal trade: net as received<br />
NER New Entrants Reserve<br />
NPS New Policies Scenario in the WEO 2011 by IEA<br />
OECD Organisation for Economic Co-operation and<br />
Development<br />
Panamax definition for bulk-carrier 50.000 - 90.000 DWT<br />
PCI-coal metallurgical area: pulverized coal injection<br />
PEC Primary Energy Consumption<br />
QLD Queensland<br />
RES renewables<br />
sintering coal low-volatile coal, used in sintering plants<br />
TCE ton coal equivalent (7.000 kcal/kg = 29.307 kcal)<br />
Spotmarket short-term market<br />
st short ton (= 0,90719 mt)<br />
t ton<br />
t/a ton per annum<br />
WCI World Coal Institute<br />
WEO World Energy Outlook<br />
WKA Wind Power Plant
AGEB (Arbeitsgemeinschaft Energiebilanzen/The Working Group<br />
on Energy Balances)<br />
www.ag-energiebilanzen.de<br />
American Coal Council<br />
www.americancoalcouncil.org<br />
APFCR (Association of Coal Producers and Suppliers of Romania)<br />
www.apfcr.ro<br />
Australian Bureau of Agriculture and Resource Economics<br />
www.abareconomic.com<br />
Australian Coal Association<br />
www.australiancoal.com<br />
Australian Institute of Energy<br />
www.aie.org.au<br />
BRGM (Bureau de Recherces Géologiques et Minières)<br />
www.brgm.fr<br />
CARBUNION (Fe<strong>der</strong>ation of Spanish Coal Producers)<br />
www.carbunion.com<br />
CERTH/ISFTA (Centre for Research and technology<br />
Hellas/Institute for Solid Fuels Technology & Applications<br />
www.certh.gr/isfta.en.aspx<br />
Chamber of Mines of South Africa<br />
www.bullion.org.za<br />
CoalImp (Association of UK Coal Importers)<br />
www.coalimp.org.uk<br />
Coal International<br />
www.coalinternational.co.uk<br />
COALPRO (Confe<strong>der</strong>ation of the UK Coal Producers)<br />
www.coalpro.co.uk<br />
Coaltrans Conferences Ltd.<br />
www.coaltrans.com<br />
DEBRIV (Bundesverband Braunkohle/<br />
German Lignite Organization)<br />
www.braunkohle.de<br />
DTEK (Ukrainian Coal Producer)<br />
www.dtek.com<br />
EIA (Energy Information Administration)<br />
www.eia.doe.gov<br />
EMAG (Institute of Innovative Technologies)<br />
www.emag.pl<br />
EPS (Electric Power Industry of Serbia)<br />
www.eps.co.yu<br />
Euracoal<br />
www.euracoal.org<br />
FDBR - Fachverband Dampfkessel, Behälter- u. Rohrleitungsbau e.V.<br />
www.fdbr.de<br />
Finnish Coal Info<br />
www.helen.fi<br />
Institutions / Links:<br />
Geocontrol<br />
www.geocontrol.es<br />
GIG (Central Mining Institute)<br />
www.gig.eu<br />
Gol<strong>der</strong> (Gol<strong>der</strong> Associates Ltd.)<br />
www.rmtltd.com<br />
GVSt (Gesamtverband Steinkohle)<br />
www.gvst.de<br />
HBP (Hornonitrianske Bane Prievidza)<br />
www.hbp.sk<br />
IEA (International Energy Agency)<br />
www.iea.org<br />
ISSeP (Institut Scientifique de Service Public)<br />
www.issep.be<br />
IZ Klima - Informationszentrum klimafreundliches<br />
Kohlekraftwerk e.V.<br />
www.iz-klima.de<br />
KOMAG (Institute of Mining Technology)<br />
www.komag.eu<br />
MATRA (Mátra Erömü Rt)<br />
www.mert.hu<br />
Mini Maritsa Iztok EAD (Bulgarian Lignite Producer)<br />
www.marica-iztoc.com<br />
National Mining Association<br />
www.infomine.com<br />
PATROMIN (Fe<strong>der</strong>ation of the Romanian Mining Industry)<br />
www.patromin.ro<br />
PPC (Public Power Corporation)<br />
www.dei.gr<br />
PPWB (Confe<strong>der</strong>ation of the Polish Lignite Industry)<br />
www.ppwb.org.pl<br />
Premogovnik Velenje (Slovenian Lignite Producer)<br />
www.rlv.si<br />
Svenska Kolinstitutet<br />
www.kolinstitutet.se<br />
TKI (Turkish Coal Enterprises)<br />
www.tki.gov.tr<br />
University of Nottingham<br />
www.nottingham.ac.uk<br />
US Department of Energy - Fossil.Energy.gov<br />
www.fe.doe.gov<br />
World Coal Association<br />
www.worldcoal.org<br />
ZSDNP (Czech Confe<strong>der</strong>ation of the Coal and Oil Producers)<br />
www.zsdnp.cz<br />
137
138 Members of VDKI<br />
Member Company Area Code Phone Fax Website<br />
AG <strong>der</strong> Dillinger Hüttenwerke + 49 6831 47-2220 47-3227 www.dillinger.de<br />
Werkstraße 1, 66763 Dillingen/Saar, Germany<br />
Alpha Coal Sales Co., LLC + 01 276 739 8467 276 739 8445 www.alphanr.com<br />
One Alpha Place, P.O. Box 16429, Bristol VA 24209, USA<br />
AMCI CARBON GMBH + 49 211 17 16 55-0 17 16 55-33 www.amciworld.com<br />
Peter-Müller-Str. 16, 40468 Düsseldorf, Germany<br />
Antwerp Port Authority + 32 3 205 22 46 205 22 69 www.portofantwerp.be<br />
Entrepotkaai 1, 2000 Antwerp, Belgium<br />
Brunsbüttel Ports GmbH + 49 4852 884-0 884-26 www.schrammgroup.de<br />
Elbehafen, 25541 Brunsbüttel, Germany<br />
BS/ENERGY Braunschweiger Versorgungs-Aktiengesellschaft & Co. KG + 49 531 383-0 383-2644 www.bvag.de<br />
Taubenstraße 7, 38106 Braunschweig, Germany<br />
Bulk Trading S.A. + 41 9161 15-130 9161 15-137 www.bulktrading.ch<br />
Piazza Molino Nuovo 17, 6900 Lugano, Switzerland<br />
Cargill International S.A. + 41 22 703 2451 22 703 2740 www.cargill.com<br />
14, Chemin de Normandie, 1206 Geneve, Switzerland<br />
CMC Coal Marketing Company Ltd. + 353 1 708 2600 708 2699 www.cmc-coal.ie<br />
Fumbally Square, New Street, Dublin 8, Ireland<br />
CS Additive GmbH + 49 201 879 15-0 879 15-50 www.cs-additive.de<br />
Rüttenschei<strong>der</strong> Straße 2, 45128 Essen, Germany<br />
Currenta GmbH & Co. KG OHG + 49 214 3057885 30657885 www.currenta.de<br />
BIS-EN-BM, Geb. G11, 51068 Leverkusen, Germany<br />
DAKO Coal Kohlen Ex- und Import GmbH + 49 2302 970 30 17 970 30 70 www.dako-coal.com<br />
Kämpenstrasse 151, 58456 Witten, Germany<br />
DB Schenker Rail Deutschland AG, MB Montan + 49 6131 15-61100 15-61199 www.dbschenker.com<br />
Rheinstraße 2, 55116 Mainz, Germany<br />
Deutsche Bank AG, London Branch + 44 20 754 509 96 754 737 13 www.db.com<br />
Winchester House, 1 Great Winchester Street, London EC2N 2DB, UK<br />
Douglas Services GmbH + 49 6123 70390 703920<br />
Rohrbergstr. 23 b, 65343 Eltville, Germany<br />
Duisburger Hafen AG + 49 203 803-330 803-436 www.duisport.de<br />
Alte Ruhrorter Str. 42-52, 47119 Duisburg, Germany<br />
EDF Trading (Switzerland) AG + 49 30 700 140 460 700 140 150 www.edftrading.com<br />
Berlin Office, DomAquaree, Karl-Liebknecht-Str. 5, 10178 Berlin,<br />
Germany<br />
Electrabel S.A. + 32 2 518 61 11 2 518 64 00 www.electrabel.com<br />
Boulevard Simón Bolivar/Simón Bolivarlaan 34, 1000 Brussels, Belgium<br />
EnBW Trading GmbH + 49 721 63-23314 914-20071 www.enbw.com<br />
Durlacher Allee 93, 76131 Karlsruhe, Germany
Member Company Area Code Phone Fax Website<br />
Enerco bv + 31 46 48 19 900 48 59 211 www.enerco.nl<br />
Keerweg 2, 6122 CL Buchten, The Netherlands<br />
E.ON Energy Trading SE + 49 211 732 75-0 732 75-1552 www.eon-energy-trading.com<br />
Holzstraße 6, 40221 Düsseldorf, Germany<br />
E.ON Kraftwerke GmbH + 49 511 439-02 439-4052 www.eon-kraftwerke.com<br />
Tresckowstraße 5, 30457 Hannover, Germany<br />
EUROKOR Barging B.V. + 31 180 481 960 481 969 www.eurokorbarging.nl<br />
Rid<strong>der</strong>poort 40, 2984 BG Rid<strong>der</strong>kerk, The Netherlands<br />
European Bulk Services (E.B.S.) B.V. + 31 181 258 121 258 125 www.ebsbulk.nl<br />
Elbeweg 117, 3198 LC Europoort Rotterdam, The Netherlands<br />
Europees Massagoed-Overslagbedrijf (EMO) bv + 31 181 37 1111 37 1222 www.emo.nl<br />
Missouriweg 25, 3199 LB Maasvlakte RT, The Netherlands<br />
EVN AG + 43 2236 200 12352 200 82352 www.evn.at<br />
EVN Platz, 2344 Maria Enzersdorf, Austria<br />
Exxaro International Coal Trading B.V., Rotterdam, Zug + 41 41 727 0570 727 0579 www.exxaro.com<br />
Bahnhofstrasse 29, 6300 Zug, Switzerland<br />
FLAME S.A. + 41 91 985 20 70 980 94 01 www.flamesa.ch<br />
Riva Paradiso 2, 6900 Lugano-Paradiso, Switzerland<br />
Frachtcontor Junge & Co. GmbH + 49 40 3000-0 3000-343 www.frachtcontor.com<br />
Ballindamm 17, 20095 Hamburg, Germany<br />
GLENCORE International AG + 41 41 709 2000 709 3000 www.glencore.com<br />
Baarermattstrasse 3, 6341 Baar, Switzerland<br />
Goldman Sachs International + 44 20 7051 2937 7051 6704 www.gs.com<br />
Rivercourt, 120 Fleet Street, London EC4A 2BB, UK<br />
Grosskraftwerk Mannheim AG + 49 621 8684310 8684319 www.gkm.de<br />
Marguerrestr. 1, 68199 Mannheim, Germany<br />
GUNVOR SA + 41 22 718 79 00 718 79 29 www.gunvorgroup.com<br />
Rue du Rhone 82-84, 1204 Genève, Switzerland<br />
Häfen und Güterverkehr Köln AG + 49 221 390 10 20 390 10 22 www.hgk.de<br />
Harry-Blum-Platz 2, 50678 Köln, Germany<br />
HANSAPORT Hafenbetriebsgesellschaft mbH + 49 40 740 03-1 74 00 32 22 www.hansaport.de<br />
Am Sandauhafen 20, 21129 Hamburg, Germany<br />
HCC Hanseatic Coal & Coke Trading GmbH + 49 40 23 72 03-0 23 26 31 www.hcc-trading.de<br />
Sachsenfeld 3-5, 20097 Hamburg, Germany<br />
HMS Bergbau AG + 49 30 656681-0 656681-15 www.hms-ag.com<br />
An <strong>der</strong> Wuhlheide 232, 12459 Berlin, Germany<br />
Holcim (Deutschland) AG + 49 40 360 02-0 36 24 50 www.holcim.com<br />
Willy-Brandt-Str. 69, 20457 Hamburg, Germany<br />
HTAG Häfen und Transport AG + 49 203 47989-0 47989-193 www.htag-duisburg.de<br />
Neumarkt 7-11, 47119 Duisburg, Germany<br />
139
140 Member Company Area Code Phone Fax Website<br />
ICT Coal GmbH + 49 201 860 44 61 860 44 65 www.ict-coal.de<br />
Katernberger Str. 107, 45327 Essen, Germany<br />
IMPERIAL Shipping Holding GmbH + 49 203 5794-0 5794-229 www.imperial-shipping.com<br />
Dr.-Hammacher-Str. 49, 47119 Duisburg, Germany<br />
Infracor GmbH, DG-IR-VO-EAW + 49 2365 49-6084 49-806084 www.infracor.de<br />
Paul-Baumann-Straße 1, 45722 Marl, Germany<br />
Inspectorate Deutschland GmbH + 49 203 860 967-13 860 967-20 www.inspectorate.com<br />
Daimlerstr. 4a, 47167 Duisburg, Germany<br />
J.P. Morgan Energy Europe Ltd. + 44 207 777 2295 207 777 4744 www.jpmorgan.com<br />
25 Bank Street, Canary Wharf, London E14 5JP, UK<br />
L.B.H. Netherlands B.V. + 31 10 506 50 00 501 34 00 www.lbh.nl<br />
Rijsdijk 13, 3161 HK Rhoon, The Netherlands<br />
LEHNKERING Ree<strong>der</strong>ei GmbH + 49 203 31 88-0 31 46 95 www.lehnkering.com<br />
Schifferstraße 26, 47059 Duisburg, Germany<br />
Mark-E Aktiengesellschaft + 49 2331 12 3-0 123-22222 www.mark-e.de<br />
Körnerstraße 40, 58095 Hagen, Deutschland<br />
OBA Bulk Terminal Amsterdam + 31 20 5873701 6116908 www.oba-bulk.nl<br />
Westhavenweg 70, 1042 AL Amsterdam, The Netherlands<br />
OVET B.V. + 31 11 5676700 5620316 www.ovet.nl<br />
Mr F.J. Haarmanweg 16 d, 4538 AR Terneuzen, The Netherlands<br />
Oxbow Coal GmbH + 49 201 439 529-0 439 529-50 www.oxbow.com<br />
Renteilichtung 44a, 45134 Essen, Germany<br />
Peabody COALTRADE GmbH + 49 201 89 45 135 89 45 45 www.peabodyenergy.com<br />
Ruhrallee 185, 45136 Essen, Germany<br />
Peterson Agricare & Bulk Logistics B.V. + 31 10 28 23 333 28 23 282 www.controlunion.com<br />
Boompjes 270, 3011 XZ Rotterdam, The Netherlands<br />
Pfeifer & Langen KG + 49 2274 701-300 701-293 www.pfeifer-langen.com<br />
Dürener Str. 40, 50189 Elsdorf, Germany<br />
Port of Amsterdam + 31 20 523 45 77 523 40 77 www.portofamsterdam.nl<br />
De Ruijterkade 7, 1013 AA Amsterdam, The Netherlands<br />
Port of Rotterdam + 31 10 252 1638 252 4041 www.portofrotterdam.com<br />
Wilhelminakade 909, 3072 AP Rotterdam, The Netherlands<br />
RAG Verkauf GmbH + 49 2323 15-5410 15-5412 www.rag-verkauf.de<br />
Shamrockring 1, 44623 Herne, Germany<br />
RC INSPECTION B.V. + 31 10 425 02 46 501 99 80 www.rc-inspection.com<br />
Gustoweg 66, 3029 AS Rotterdam, The Netherlands<br />
Rheinbraun Brennstoff GmbH + 49 221 480-1364 480-1369 www.energieprofi.com<br />
Stüttgenweg 2, 50935 Köln, Germany<br />
Rhenus PartnerShip GmbH & Co. KG + 49 203 8009-326 8009-221 www.rhenus.de<br />
August-Hirsch-Str. 3, 47119 Duisburg, Germany
Member Company Area Code Phone Fax Website<br />
RWE Supply & Trading GmbH + 49 201 12-09 12-17900 www.rwetrading.com<br />
Altenessener Str. 27, 45141 Essen, Germany<br />
SEA-Invest N.V. + 32 9 255 02 51 259 08 93 www.sea-invest.be<br />
Skaldenstraat 1, 9042 Gent, Belgium<br />
Stadtwerke Flensburg GmbH + 49 461 487-0 487-1880 www.stadtwerke-flensburg.de<br />
Batteriestraße 48, 24939 Flensburg, Germany<br />
Stadtwerke Hannover AG + 49 511 430-0 430-2772 www.enercity.de<br />
Ihmeplatz 2, 30449 Hannover, Germany<br />
STEAG GmbH + 49 201 801-3230 801-3232 www.steag.com<br />
Rüttenschei<strong>der</strong> Str. 1-3, 45128 Essen, Germany<br />
SUEK AG, Swiss Office + 41 71 226 85 00 226 85 03 www.suekag.com<br />
Vadianstrasse 59, 9000 St. Gallen, Switzerland<br />
SüdWestStrom Kraftwerke GmbH & Co. KG + 49 7071 157-381 157-488 www.suedweststrom.de<br />
Eisenhutstraße 6, 72072 Tübingen, Germany<br />
Südzucker AG Mannheim/Ochsenfurt + 49 621 421-0 421-466 www.suedzucker.de<br />
Gottlieb-Daimler-Str. 12, 68165 Mannheim, Germany<br />
swb Erzeugung GmbH & Co. KG + 49 421 359-2270 359-2366 www.swb-gruppe.de<br />
Theodor-Heuss-Allee 20, 28215 Bremen, Germany<br />
Terval s.a. + 32 4 264 9348 4 264 0835 www.terval.com<br />
Ile Monsin 129, 4020 Liège, Belgium<br />
Traxys Europe SA + 352 4599 991 4599 99222 www.traxys.com<br />
19-21, Route D´Arlon, 8009 Strassen, Luxembourg<br />
Trianel Kohlekraftwerk Lünen GmbH & Co. KG + 49 2306 3733-0 3733-150 www.trianel-luenen.de<br />
Frydagstr. 40, 44536 Lünen, Germany<br />
Vattenfall Energy Trading Netherlands N.V. + 31 20 799 5684 562 7599 www.vattenfall.com<br />
Spaklerweg 20, 1096 BA Amsterdam, The Netherlands<br />
Vattenfall Europe Wärme AG + 49 30 267-10095 267-10719 www.vattenfall.de<br />
Puschkinallee 52, 12435 Berlin, Germany<br />
Vitol S.A. + 41 22 322 1111 22 781 6611 www.vitol.com<br />
Boulevard du Pont d`Arve 28, 1205 Geneva, Switzerland<br />
Wincanton GmbH + 49 621 8048-247 8048-449 www.wincanton.eu<br />
Antwerpener Straße 24, 68219 Mannheim, Germany<br />
Zeeland Seaports + 31 115 647 400 647 500 www.zeeland-seaports.com<br />
Schelpenpad 2, 4531 PD Terneuzen, The Netherlands<br />
141
142 Space for notes
Board of Director VDKi<br />
Chairman:<br />
Dr Wolfgang Cieslik<br />
STEAG GmbH, Essen, Germany<br />
Vice-Chairman:<br />
Reinhard Seifert<br />
HCC Hanseatic Coal & Coke Trading GmbH,<br />
Hamburg, Germany<br />
Alexan<strong>der</strong> Bethe<br />
EDF Trading (Switzerland) AG, Berlin, Germany<br />
Dr Markus Bin<strong>der</strong><br />
Grosskraftwerk Mannheim AG, Mannheim, Germany<br />
Bert Lagendijk<br />
L.B.H. Netherlands B.V., NL - Rhoon; Netherlands<br />
Bernhard Lümmen<br />
Oxbow Coal GmbH, Duisburg, Germany<br />
Dr Michael G. Müller<br />
RWE Power AG, Essen, Germany<br />
Dirk Schmidt-Holzmann<br />
TERVAL s.a., B-Liège, Belgium<br />
Dr Matthias Neubronner<br />
E.ON Kraftwerke GmbH, Hannover, Germany<br />
Hans-Joachim Welsch<br />
AG <strong>der</strong> Dillinger Hüttenwerke, Dillingen/Saar, Germany<br />
Rainer Winge<br />
Südzucker AG, Mannheim/Ochsenfurt, Germany<br />
Markus Witt<br />
Vattenfall Europe Wärme AG, Berlin, Germany<br />
Managing Director:<br />
RA Dr Erich Schmitz<br />
143
Publisher:<br />
<strong>Verein</strong> <strong>der</strong> <strong>Kohlenimporteure</strong> e.V.<br />
D-20095 Hamburg, Ferdinandstrasse 35<br />
Phone: +49 (0) 40 32 74 84<br />
Fax: +49 (0) 40 32 67 72<br />
e-mail: <strong>Verein</strong>-<strong>Kohlenimporteure</strong>@t-online.de<br />
Internet: www.verein-kohlenimporteure.de<br />
www.kohlenimporteure.de<br />
Design & Layout:<br />
Compactmedia Agentur GmbH, Hamburg<br />
(ISSN 1612-5371)