EU industrial structure - EU Bookshop - Europa
EU industrial structure - EU Bookshop - Europa EU industrial structure - EU Bookshop - Europa
EU industrial structure 2011 — Trends and Performance The ranking of the sectors above may differ considerably from year to year due to the highly cyclical behaviour of GFCF. This can be illustrated for the manufacturing sector transport equipment. Annual growth rates of GFCF in fixed 76 prices are shown for France, Germany, Italy and Spain; especially volatile is the French series. The effect of the crisis on the investments is obvious, cf. Figure III.17. FIgURE III.17: Annual growth rates of gFCF in manufacture of transport equipment in France, germany, Italy and Spain 1995-2009 40 30 20 10 0 -10 -20 -30 -40 Spain Germany Italy France 1996 1997 1998 1999 2000 2001 2002 2003 2004 2005 2006 2007 2008 2009 Source: own calculations using Eurostat data. Capital intensity is an indicator that can be used to characterise the technology of sectors. It is useful not only for descriptive purposes, but also as determinant of industry conditions and behaviour. High levels of investment can operate as a barrier to entry, imply a higher degree of risk, and influence cost structures and price strategies of firms. Though capital intensity should be measured as the stock of capital per person employed, a proxy is used in this section, namely the ratio of investment in tangible assets to the number of persons employed. The calculation of the indicator is based on 2005, 2006 and 2007 data. The values presented correspond to the average of these three years. The data refer to EU‑27 and the coverage by industry, which goes up to three digits of NACE Rev. 1, encompassing a range of sectors from mining and quarrying to market services. In a few cases, due to lack of observations, estimations were needed to complete the table. This is not a strict indicator of capital stock per person employed but of the investment flow per person employed. A drawback is that investment is highly cyclical and therefore the results must be interpreted as an approximation, although the cyclical effect is partially offset by taking average values over three years. The sectors that operate with relatively high levels of capital intensity are a mix of utilities, manufacturing and services sectors. Conversely, apart from wholesale and retail, all medium investment intensity sectors are in manufacturing. And, logically, the manufacturing sectors with the lowest investment intensity (leather, textiles) are labour intensive and face the strongest competition from low cost countries, cf. Table III.5. TAbLE III.5: EU investment intensity. Average 2005-07 code sector million € / 1 000 persons E Electricity, gas and water supply 49.0 dF Refined petroleum 43.1 c Mining and quarrying 29.1 i Transport and communication 14.3 dg Chemicals 14.2 K Real estate and business activities 13.3 >>>
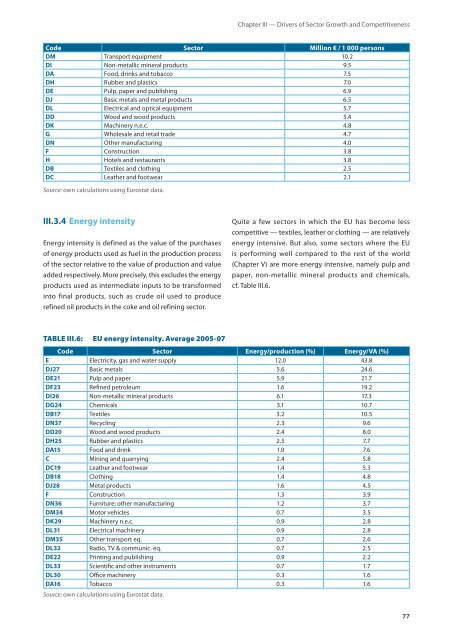
Chapter III — Drivers of Sector Growth and Competitiveness code sector million € / 1 000 persons dm Transport equipment 10.2 di Non‑metallic mineral products 9.5 da Food, drinks and tobacco 7.5 dh Rubber and plastics 7.0 dE Pulp, paper and publishing 6.9 dJ Basic metals and metal products 6.5 dl Electrical and optical equipment 5.7 dd Wood and wood products 5.4 dK Machinery n.e.c. 4.8 g Wholesale and retail trade 4.7 dn Other manufacturing 4.0 F Construction 3.8 h Hotels and restaurants 3.8 dB Textiles and clothing 2.5 dc Leather and footwear 2.1 Source: own calculations using Eurostat data. iii34 Energy intensity Energy intensity is defined as the value of the purchases of energy products used as fuel in the production process of the sector relative to the value of production and value added respectively. More precisely, this excludes the energy products used as intermediate inputs to be transformed into final products, such as crude oil used to produce refined oil products in the coke and oil refining sector. TAbLE III.6: EU energy intensity. Average 2005-07 Quite a few sectors in which the EU has become less competitive — textiles, leather or clothing — are relatively energy intensive. But also, some sectors where the EU is performing well compared to the rest of the world (Chapter V) are more energy intensive, namely pulp and paper, non‑metallic mineral products and chemicals, cf. Table III.6. code sector Energy/production (%) Energy/va (%) E Electricity, gas and water supply 12.0 43.8 dJ27 Basic metals 5.6 24.6 dE21 Pulp and paper 5.9 21.7 dF23 Refined petroleum 1.6 19.2 di26 Non‑metallic mineral products 6.1 17.3 dg24 Chemicals 3.1 10.7 dB17 Textiles 3.2 10.5 dn37 Recycling 2.3 9.6 dd20 Wood and wood products 2.4 8.0 dh25 Rubber and plastics 2.5 7.7 da15 Food and drink 1.9 7.6 c Mining and quarrying 2.4 5.8 dc19 Leather and footwear 1.4 5.3 dB18 Clothing 1.4 4.8 dJ28 Metal products 1.6 4.5 F Construction 1.3 3.9 dn36 Furniture; other manufacturing 1.2 3.7 dm34 Motor vehicles 0.7 3.5 dK29 Machinery n.e.c. 0.9 2.8 dl31 Electrical machinery 0.9 2.8 dm35 Other transport eq. 0.7 2.6 dl32 Radio, TV & communic. eq. 0.7 2.5 dE22 Printing and publishing 0.9 2.2 dl33 Scientific and other instruments 0.7 1.7 dl30 Office machinery 0.3 1.6 da16 Tobacco 0.3 1.6 Source: own calculations using Eurostat data. 77
- Page 27 and 28: Chapter I — The aftermath of the
- Page 29 and 30: nacE rev 2 growth 2009 Chapter I
- Page 31 and 32: The third step in assessing future
- Page 33 and 34: The business survey indicator used
- Page 37 and 38: Chapter II Changes in EU Industrial
- Page 39 and 40: While there is some variety in the
- Page 41 and 42: developments. This is confirmed by
- Page 43 and 44: Looking at the overall specialisati
- Page 45 and 46: TAbLE II.2: Sectoral specialisation
- Page 47 and 48: For countries as a whole, it should
- Page 49 and 50: Chapter II — Changes in EU Indust
- Page 51 and 52: technology scale. They are less and
- Page 53 and 54: ox II.4: SME definition FIgURE II.7
- Page 55 and 56: definition of shocks. Shocks, or di
- Page 57: Appendix figure FIgURE II.11: Secto
- Page 60 and 61: EU industrial structure 2011 — Tr
- Page 62 and 63: EU industrial structure 2011 — Tr
- Page 64 and 65: EU industrial structure 2011 — Tr
- Page 66 and 67: EU industrial structure 2011 — Tr
- Page 68 and 69: EU industrial structure 2011 — Tr
- Page 70 and 71: EU industrial structure 2011 — Tr
- Page 72 and 73: EU industrial structure 2011 — Tr
- Page 74 and 75: EU industrial structure 2011 — Tr
- Page 76 and 77: EU industrial structure 2011 — Tr
- Page 80 and 81: EU industrial structure 2011 — Tr
- Page 82 and 83: EU industrial structure 2011 — Tr
- Page 84 and 85: EU industrial structure 2011 — Tr
- Page 86 and 87: EU industrial structure 2011 — Tr
- Page 88 and 89: EU industrial structure 2011 — Tr
- Page 90 and 91: EU industrial structure 2011 — Tr
- Page 92 and 93: EU industrial structure 2011 — Tr
- Page 94 and 95: EU industrial structure 2011 — Tr
- Page 97 and 98: Chapter IV International competitiv
- Page 99 and 100: Chapter IV — International compet
- Page 101 and 102: FIgURE IV.1: EU accounts for almost
- Page 103 and 104: TAbLE IV.4: EU exports of manufactu
- Page 105 and 106: iv22 Export market shares Export ma
- Page 107 and 108: iv23 sectoral trade balance The rel
- Page 109 and 110: FIgURE IV.3: EU-27 RCA index in 200
- Page 111 and 112: RCA‑indices for individual manufa
- Page 113 and 114: FIgURE IV.8: China trade in manufac
- Page 115 and 116: Chapter IV — International compet
- Page 117 and 118: communi‑ cation computer and info
- Page 119 and 120: FIgURE IV.13: Japan trade in servic
- Page 121 and 122: FIgURE IV.17: Russia trade in servi
- Page 123 and 124: Chapter IV — International compet
- Page 125 and 126: IV.4 The role of technology in EU s
- Page 127 and 128: The import dependence of exports, v
Chapter III — Drivers of Sector Growth and Competitiveness<br />
code sector million € / 1 000 persons<br />
dm Transport equipment 10.2<br />
di Non‑metallic mineral products 9.5<br />
da Food, drinks and tobacco 7.5<br />
dh Rubber and plastics 7.0<br />
dE Pulp, paper and publishing 6.9<br />
dJ Basic metals and metal products 6.5<br />
dl Electrical and optical equipment 5.7<br />
dd Wood and wood products 5.4<br />
dK Machinery n.e.c. 4.8<br />
g Wholesale and retail trade 4.7<br />
dn Other manufacturing 4.0<br />
F Construction 3.8<br />
h Hotels and restaurants 3.8<br />
dB Textiles and clothing 2.5<br />
dc Leather and footwear 2.1<br />
Source: own calculations using Eurostat data.<br />
iii34 Energy intensity<br />
Energy intensity is defined as the value of the purchases<br />
of energy products used as fuel in the production process<br />
of the sector relative to the value of production and value<br />
added respectively. More precisely, this excludes the energy<br />
products used as intermediate inputs to be transformed<br />
into final products, such as crude oil used to produce<br />
refined oil products in the coke and oil refining sector.<br />
TAbLE III.6: <strong>EU</strong> energy intensity. Average 2005-07<br />
Quite a few sectors in which the <strong>EU</strong> has become less<br />
competitive — textiles, leather or clothing — are relatively<br />
energy intensive. But also, some sectors where the <strong>EU</strong><br />
is performing well compared to the rest of the world<br />
(Chapter V) are more energy intensive, namely pulp and<br />
paper, non‑metallic mineral products and chemicals,<br />
cf. Table III.6.<br />
code sector Energy/production (%) Energy/va (%)<br />
E Electricity, gas and water supply 12.0 43.8<br />
dJ27 Basic metals 5.6 24.6<br />
dE21 Pulp and paper 5.9 21.7<br />
dF23 Refined petroleum 1.6 19.2<br />
di26 Non‑metallic mineral products 6.1 17.3<br />
dg24 Chemicals 3.1 10.7<br />
dB17 Textiles 3.2 10.5<br />
dn37 Recycling 2.3 9.6<br />
dd20 Wood and wood products 2.4 8.0<br />
dh25 Rubber and plastics 2.5 7.7<br />
da15 Food and drink 1.9 7.6<br />
c Mining and quarrying 2.4 5.8<br />
dc19 Leather and footwear 1.4 5.3<br />
dB18 Clothing 1.4 4.8<br />
dJ28 Metal products 1.6 4.5<br />
F Construction 1.3 3.9<br />
dn36 Furniture; other manufacturing 1.2 3.7<br />
dm34 Motor vehicles 0.7 3.5<br />
dK29 Machinery n.e.c. 0.9 2.8<br />
dl31 Electrical machinery 0.9 2.8<br />
dm35 Other transport eq. 0.7 2.6<br />
dl32 Radio, TV & communic. eq. 0.7 2.5<br />
dE22 Printing and publishing 0.9 2.2<br />
dl33 Scientific and other instruments 0.7 1.7<br />
dl30 Office machinery 0.3 1.6<br />
da16 Tobacco 0.3 1.6<br />
Source: own calculations using Eurostat data.<br />
77


