

EU industrial structure - EU Bookshop - Europa
EU industrial structure - EU Bookshop - Europa
EU industrial structure - EU Bookshop - Europa

Create successful ePaper yourself
Turn your PDF publications into a flip-book with our unique Google optimized e-Paper software.
Chapter III — Drivers of Sector Growth and Competitiveness<br />
code sector 2005 2006 2007 2008 2009<br />
g Wholesale and retail trade 0.13 0.13 0.13 0.12 0.10<br />
h Hotels and restaurants 0.12 0.13 0.12 0.12 0.09<br />
i Transport and communication 0.34 0.35 0.37 0.38 0.34<br />
J Financial intermediation 0.10 0.11 0.10 0.12 0.10<br />
K Real estate and business activities 0.42 0.43 0.44 0.40 0.33<br />
l Public administration 0.27 0.27 0.28 0.27 0.26<br />
m Education 0.09 0.09 0.09 0.09 0.08<br />
n Health and social work 0.10 0.10 0.11 0.10 0.08<br />
O Other services 0.25 0.27 0.28 0.28 0.25<br />
total 023 023 024 024 024<br />
Note: The investment ratio is defined as the ratio of gross fixed capital formation (GFCF) to value added.<br />
Source: own calculations using Eurostat data.<br />
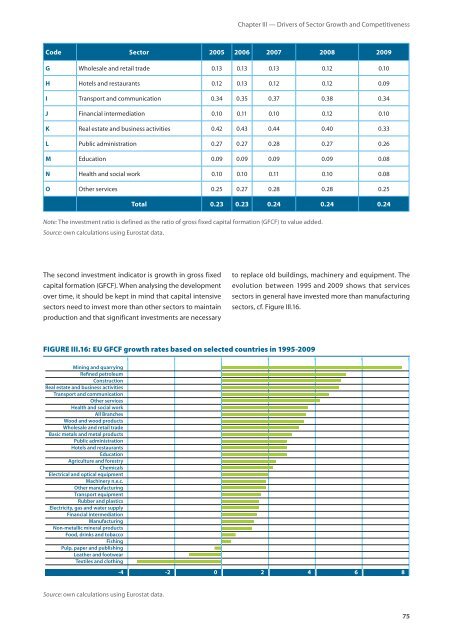
The second investment indicator is growth in gross fixed<br />
capital formation (GFCF). When analysing the development<br />
over time, it should be kept in mind that capital intensive<br />
sectors need to invest more than other sectors to maintain<br />
production and that significant investments are necessary<br />
FIgURE III.16: <strong>EU</strong> gFCF growth rates based on selected countries in 1995-2009<br />
Mining and quarrying<br />
Rened petroleum<br />
Construction<br />
Real estate and business activities<br />
Transport and communication<br />
Other services<br />
Health and social work<br />
All Branches<br />
Wood and wood products<br />
Wholesale and retail trade<br />
Basic metals and metal products<br />
Public administration<br />
Hotels and restaurants<br />
Education<br />
Agriculture and forestry<br />
Chemicals<br />
Electrical and optical equipment<br />
Machinery n.e.c.<br />
Other manufacturing<br />
Transport equipment<br />
Rubber and plastics<br />
Electricity, gas and water supply<br />
Financial intermediation<br />
Manufacturing<br />
Non-metallic mineral products<br />
Food, drinks and tobacco<br />
Fishing<br />
Pulp, paper and publishing<br />
Leather and footwear<br />
Textiles and clothing<br />
Source: own calculations using Eurostat data.<br />
to replace old buildings, machinery and equipment. The<br />
evolution between 1995 and 2009 shows that services<br />
sectors in general have invested more than manufacturing<br />
sectors, cf. Figure III.16.<br />
-4 -2 0 2 4 6 8<br />
75


