

EU industrial structure - EU Bookshop - Europa
EU industrial structure - EU Bookshop - Europa
EU industrial structure - EU Bookshop - Europa

Create successful ePaper yourself
Turn your PDF publications into a flip-book with our unique Google optimized e-Paper software.
<strong>EU</strong> <strong>industrial</strong> <strong>structure</strong> 2011 — Trends and Performance<br />
i22 recent developments in services<br />
industries<br />
The quarterly data presented in section I.1.2 presented<br />
highly aggregated service sectors; the analyses below offer<br />
more detail on developments in various service sectors<br />
for the last months for which data are available. From the<br />
last month for which data are available for all sectors, one<br />
30<br />
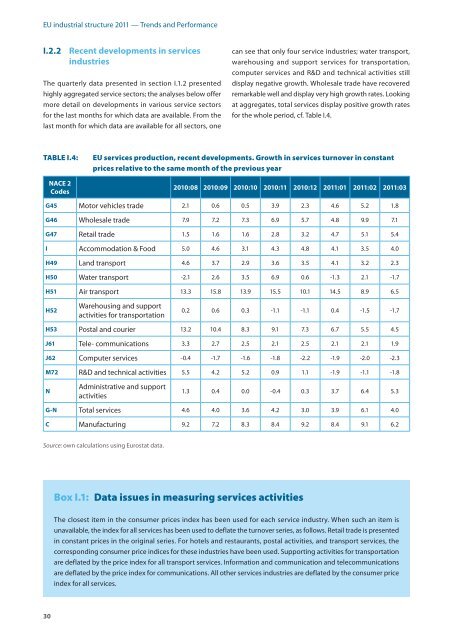
can see that only four service industries; water transport,<br />
warehousing and support services for transportation,<br />
computer services and R&D and technical activities still<br />
display negative growth. Wholesale trade have recovered<br />
remarkable well and display very high growth rates. Looking<br />
at aggregates, total services display positive growth rates<br />
for the whole period, cf. Table I.4.<br />
TAbLE I.4: <strong>EU</strong> services production, recent developments. growth in services turnover in constant<br />
prices relative to the same month of the previous year<br />
nacE 2<br />
codes<br />
2010:08 2010:09 2010:10 2010:11 2010:12 2011:01 2011:02 2011:03<br />
g45 Motor vehicles trade 2.1 0.6 0.5 3.9 2.3 4.6 5.2 1.8<br />
g46 Wholesale trade 7.9 7.2 7.3 6.9 5.7 4.8 9.9 7.1<br />
g47 Retail trade 1.5 1.6 1.6 2.8 3.2 4.7 5.1 5.4<br />
i Accommodation & Food 5.0 4.6 3.1 4.3 4.8 4.1 3.5 4.0<br />
h49 Land transport 4.6 3.7 2.9 3.6 3.5 4.1 3.2 2.3<br />
h50 Water transport ‑2.1 2.6 3.5 6.9 0.6 ‑1.3 2.1 ‑1.7<br />
h51 Air transport 13.3 15.8 13.9 15.5 10.1 14.5 8.9 6.5<br />
h52<br />
Warehousing and support<br />
activities for transportation<br />
0.2 0.6 0.3 ‑1.1 ‑1.1 0.4 ‑1.5 ‑1.7<br />
h53 Postal and courier 13.2 10.4 8.3 9.1 7.3 6.7 5.5 4.5<br />
J61 Tele‑ communications 3.3 2.7 2.5 2.1 2.5 2.1 2.1 1.9<br />
J62 Computer services ‑0.4 ‑1.7 ‑1.6 ‑1.8 ‑2.2 ‑1.9 ‑2.0 ‑2.3<br />
m72 R&D and technical activities 5.5 4.2 5.2 0.9 1.1 ‑1.9 ‑1.1 ‑1.8<br />
n<br />
Administrative and support<br />
activities<br />
1.3 0.4 0.0 ‑0.4 0.3 3.7 6.4 5.3<br />
g‑n Total services 4.6 4.0 3.6 4.2 3.0 3.9 6.1 4.0<br />
c Manufacturing 9.2 7.2 8.3 8.4 9.2 8.4 9.1 6.2<br />
Source: own calculations using Eurostat data.<br />
box I.1: Data issues in measuring services activities<br />
The closest item in the consumer prices index has been used for each service industry. When such an item is<br />
unavailable, the index for all services has been used to deflate the turnover series, as follows. Retail trade is presented<br />
in constant prices in the original series. For hotels and restaurants, postal activities, and transport services, the<br />
corresponding consumer price indices for these industries have been used. Supporting activities for transportation<br />
are deflated by the price index for all transport services. Information and communication and telecommunications<br />
are deflated by the price index for communications. All other services industries are deflated by the consumer price<br />
index for all services.


