EU industrial structure - EU Bookshop - Europa
EU industrial structure - EU Bookshop - Europa EU industrial structure - EU Bookshop - Europa
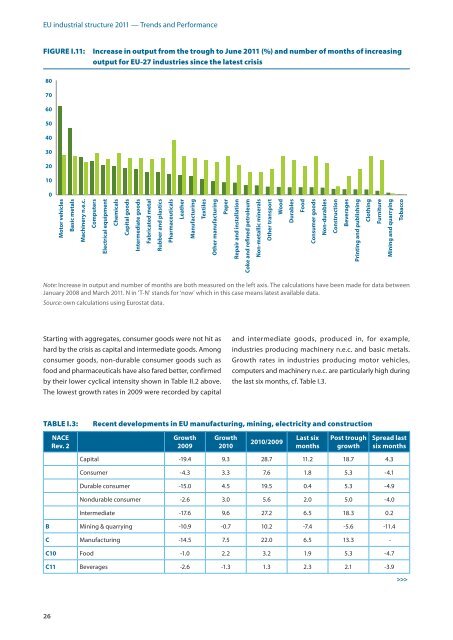
EU industrial structure 2011 — Trends and Performance FIgURE I.11: Increase in output from the trough to June 2011 (%) and number of months of increasing output for EU-27 industries since the latest crisis 80 70 60 50 40 30 20 10 0 Starting with aggregates, consumer goods were not hit as hard by the crisis as capital and intermediate goods. Among consumer goods, non‑durable consumer goods such as food and pharmaceuticals have also fared better, confirmed by their lower cyclical intensity shown in Table II.2 above. The lowest growth rates in 2009 were recorded by capital 26 Motor vehicles Basic metals Machinery n.e.c. Computers Electrical equipment Chemicals Capital goods Intermediate goods Fabricated metal Rubber and plastics Pharmaceuticals Leather Manufacturing Textiles Other manufacturing Paper Note: Increase in output and number of months are both measured on the left axis. The calculations have been made for data between January 2008 and March 2011. N in ‘T‑N’ stands for ‘now’ which in this case means latest available data. Source: own calculations using Eurostat data. Repair and installation Coke and rened petroleum Non-metallic minerals Other transport Wood Durables Food Consumer goods Non-durables and intermediate goods, produced in, for example, industries producing machinery n.e.c. and basic metals. Growth rates in industries producing motor vehicles, computers and machinery n.e.c. are particularly high during the last six months, cf. Table I.3. TAbLE I.3: Recent developments in EU manufacturing, mining, electricity and construction nacE rev 2 growth 2009 growth 2010 2010/2009 last six months Construction Beverages Printing and publishing post trough growth Clothing Furniture Mining and quarrying Tobacco spread last six months Capital ‑19.4 9.3 28.7 11.2 18.7 4.3 Consumer ‑4.3 3.3 7.6 1.8 5.3 ‑4.1 Durable consumer ‑15.0 4.5 19.5 0.4 5.3 ‑4.9 Nondurable consumer ‑2.6 3.0 5.6 2.0 5.0 ‑4.0 Intermediate ‑17.6 9.6 27.2 6.5 18.3 0.2 B Mining & quarrying ‑10.9 ‑0.7 10.2 ‑7.4 ‑5.6 ‑11.4 c Manufacturing ‑14.5 7.5 22.0 6.5 13.3 ‑ c10 Food ‑1.0 2.2 3.2 1.9 5.3 ‑4.7 c11 Beverages ‑2.6 ‑1.3 1.3 2.3 2.1 ‑3.9 >>>
nacE rev 2 growth 2009 Chapter I — The aftermath of the crisis — a long and uneven recovery(?) growth 2010 2010/2009 last six months post trough growth spread last six months c12 Tobacco ‑2.8 ‑6.2 ‑3.4 ‑8.3 ‑7.5 ‑10.0 c13 Textiles ‑16.6 8.4 25.0 1.3 11.0 ‑1.3 c14 Clothing ‑10.8 0.6 11.3 ‑2.4 3.9 ‑3.2 c15 Leather and footwear ‑12.5 3.3 15.8 7.3 14.1 5.8 c16 Wood ‑13.7 3.8 17.5 1.7 5.0 ‑3.9 c17 Paper ‑8.9 6.1 15.0 0.8 8.5 ‑5.6 c18 Printing ‑7.2 1.6 8.9 1.4 3.8 ‑4.3 c19 Refined petroleum ‑7.8 0.1 7.9 1.5 6.3 ‑3.9 c20 Chemicals ‑10.4 10.1 20.5 3.4 19.9 ‑3.6 c21 Pharmaceuticals 3.3 5.8 2.5 3.6 14.2 ‑6.8 c22 Rubber & plastics ‑12.8 7.9 20.7 6.5 15.9 ‑0.2 c23 Non metallic mineral products ‑18.5 2.6 21.1 5.9 6.6 0.7 c24 Basic metals ‑25.6 19.6 45.1 8.5 46.2 2.7 c25 Metal products ‑21.8 7.4 29.1 9.1 16.0 3.0 c26 Computers, electronic & optical ‑15.2 11.3 26.5 9.4 23.7 0.7 c27 Electrical eq. ‑20.3 11.2 31.5 8.6 20.7 2.1 c28 Machinery n.e.c. ‑26.1 10.5 36.5 14.9 26.3 8.5 c29 Motor vehicles ‑21.9 21.8 43.7 16.6 62.1 8.4 c30 Other transport eq. ‑6.1 ‑2.7 3.4 2.6 5.8 ‑3.2 c31 Furniture ‑16.3 ‑0.9 15.4 2.6 2.8 ‑1.9 c32 Other manufacturing ‑5.9 7.9 13.7 2.9 9.6 ‑3.1 c33 Repair of machinery ‑8.7 3.4 12.1 3.0 8.7 ‑1.2 d Electricity & gas ‑4.9 4.2 9.1 ‑3.7 3.4 ‑10.2 F Construction ‑8.6 ‑3.9 4.7 ‑1.3 4.0 ‑7.1 F41 Buildings ‑10.8 ‑3.2 7.6 ‑1.7 3.5 ‑7.7 F42 Civil engineering 2.2 ‑7.0 ‑9.3 0.9 3.5 ‑4.0 Source: own calculations using Eurostat data. The remainder of this section aims to assess future developments for the manufacturing industries. The analyses below are undertaken using information on new orders and other leading indicators: order‑book levels, stocks of finished products and production expectations. The discussion will shed light on expectations for the near future and on the extent to which the recovery will be felt across the manufacturing industries in the months to come. Monthly real21 growth rates, relative to the same month of the previous year, of production and new orders for total 21 New orders have been deflated with the corresponding producer price indices for the aggregates. manufacturing are used in the first step of the assessment of future developments. New orders recorded its lowest level in February 2009. The decline, although modest in the beginning, started in early 2007. The recovery of new orders, during the recent recession, preceded the recovery of production with one month. Production growth hit bottom in March 2009. Positive growth rates of new orders occurred again in November 2009, two months before production growth rates became positive. Twelve‑month growth rates of new orders and production increased steadily until the second quarter of 2010. After having levelled out during the last quarter of 2010 and the first two months of 2011, growth rates are declining again, cf. Figure I.12. 27
- Page 1: EU industrial structure 2011 Trends
- Page 4 and 5: ENTERPRISE & INDUSTRY MAGAZINE The
- Page 6 and 7: EU industrial structure 2011 — Tr
- Page 8 and 9: EU industrial structure 2011 — Tr
- Page 10 and 11: EU industrial structure 2011 — Tr
- Page 12 and 13: EU industrial structure 2011 — Tr
- Page 14 and 15: EU industrial structure 2011 — Tr
- Page 17 and 18: Chapter I The aftermath of the cris
- Page 19 and 20: The impact of the last downturn in
- Page 21 and 22: The impacts of the latest recession
- Page 23 and 24: The previous figures imply that the
- Page 25 and 26: i12 services recession and recovery
- Page 27: Chapter I — The aftermath of the
- Page 31 and 32: The third step in assessing future
- Page 33 and 34: The business survey indicator used
- Page 37 and 38: Chapter II Changes in EU Industrial
- Page 39 and 40: While there is some variety in the
- Page 41 and 42: developments. This is confirmed by
- Page 43 and 44: Looking at the overall specialisati
- Page 45 and 46: TAbLE II.2: Sectoral specialisation
- Page 47 and 48: For countries as a whole, it should
- Page 49 and 50: Chapter II — Changes in EU Indust
- Page 51 and 52: technology scale. They are less and
- Page 53 and 54: ox II.4: SME definition FIgURE II.7
- Page 55 and 56: definition of shocks. Shocks, or di
- Page 57: Appendix figure FIgURE II.11: Secto
- Page 60 and 61: EU industrial structure 2011 — Tr
- Page 62 and 63: EU industrial structure 2011 — Tr
- Page 64 and 65: EU industrial structure 2011 — Tr
- Page 66 and 67: EU industrial structure 2011 — Tr
- Page 68 and 69: EU industrial structure 2011 — Tr
- Page 70 and 71: EU industrial structure 2011 — Tr
- Page 72 and 73: EU industrial structure 2011 — Tr
- Page 74 and 75: EU industrial structure 2011 — Tr
- Page 76 and 77: EU industrial structure 2011 — Tr
<strong>EU</strong> <strong>industrial</strong> <strong>structure</strong> 2011 — Trends and Performance<br />
FIgURE I.11: Increase in output from the trough to June 2011 (%) and number of months of increasing<br />
output for <strong>EU</strong>-27 industries since the latest crisis<br />
80<br />
70<br />
60<br />
50<br />
40<br />
30<br />
20<br />
10<br />
0<br />
Starting with aggregates, consumer goods were not hit as<br />
hard by the crisis as capital and intermediate goods. Among<br />
consumer goods, non‑durable consumer goods such as<br />
food and pharmaceuticals have also fared better, confirmed<br />
by their lower cyclical intensity shown in Table II.2 above.<br />
The lowest growth rates in 2009 were recorded by capital<br />
26<br />
Motor vehicles<br />
Basic metals<br />
Machinery n.e.c.<br />
Computers<br />
Electrical equipment<br />
Chemicals<br />
Capital goods<br />
Intermediate goods<br />
Fabricated metal<br />
Rubber and plastics<br />
Pharmaceuticals<br />
Leather<br />
Manufacturing<br />
Textiles<br />
Other manufacturing<br />
Paper<br />
Note: Increase in output and number of months are both measured on the left axis. The calculations have been made for data between<br />
January 2008 and March 2011. N in ‘T‑N’ stands for ‘now’ which in this case means latest available data.<br />
Source: own calculations using Eurostat data.<br />
Repair and installation<br />
Coke and rened petroleum<br />
Non-metallic minerals<br />
Other transport<br />
Wood<br />
Durables<br />
Food<br />
Consumer goods<br />
Non-durables<br />
and intermediate goods, produced in, for example,<br />
industries producing machinery n.e.c. and basic metals.<br />
Growth rates in industries producing motor vehicles,<br />
computers and machinery n.e.c. are particularly high during<br />
the last six months, cf. Table I.3.<br />
TAbLE I.3: Recent developments in <strong>EU</strong> manufacturing, mining, electricity and construction<br />
nacE<br />
rev 2<br />
growth<br />
2009<br />
growth<br />
2010<br />
2010/2009<br />
last six<br />
months<br />
Construction<br />
Beverages<br />
Printing and publishing<br />
post trough<br />
growth<br />
Clothing<br />
Furniture<br />
Mining and quarrying<br />
Tobacco<br />
spread last<br />
six months<br />
Capital ‑19.4 9.3 28.7 11.2 18.7 4.3<br />
Consumer ‑4.3 3.3 7.6 1.8 5.3 ‑4.1<br />
Durable consumer ‑15.0 4.5 19.5 0.4 5.3 ‑4.9<br />
Nondurable consumer ‑2.6 3.0 5.6 2.0 5.0 ‑4.0<br />
Intermediate ‑17.6 9.6 27.2 6.5 18.3 0.2<br />
B Mining & quarrying ‑10.9 ‑0.7 10.2 ‑7.4 ‑5.6 ‑11.4<br />
c Manufacturing ‑14.5 7.5 22.0 6.5 13.3 ‑<br />
c10 Food ‑1.0 2.2 3.2 1.9 5.3 ‑4.7<br />
c11 Beverages ‑2.6 ‑1.3 1.3 2.3 2.1 ‑3.9<br />
>>>


