

EU industrial structure - EU Bookshop - Europa
EU industrial structure - EU Bookshop - Europa
EU industrial structure - EU Bookshop - Europa

You also want an ePaper? Increase the reach of your titles
YUMPU automatically turns print PDFs into web optimized ePapers that Google loves.
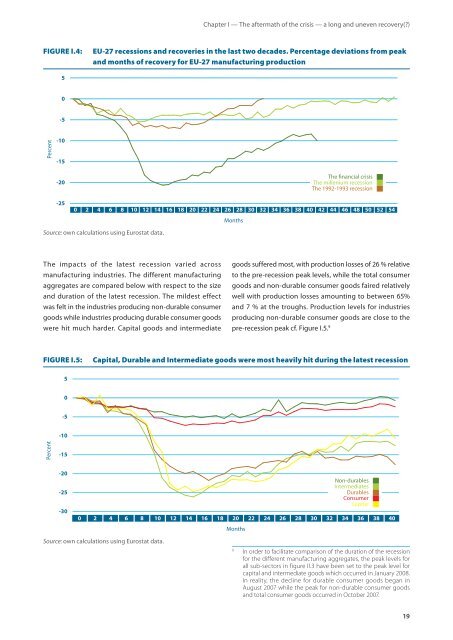
The impacts of the latest recession varied across<br />
manufacturing industries. The different manufacturing<br />
aggregates are compared below with respect to the size<br />
and duration of the latest recession. The mildest effect<br />
was felt in the industries producing non‑durable consumer<br />
goods while industries producing durable consumer goods<br />
were hit much harder. Capital goods and intermediate<br />
Chapter I — The aftermath of the crisis — a long and uneven recovery(?)<br />
FIgURE I.4: <strong>EU</strong>-27 recessions and recoveries in the last two decades. Percentage deviations from peak<br />
and months of recovery for <strong>EU</strong>-27 manufacturing production<br />
Percent<br />
5<br />
0<br />
-5<br />
-10<br />
-15<br />
-20<br />
-25<br />
0 2 4 6 8 10 12 14 16 18 20 22 24 26 28 30 32 34 36 38 40 42 44 46 48 50 52 54<br />
Source: own calculations using Eurostat data.<br />
Months<br />
The nancial crisis<br />
The millenium recession<br />
The 1992-1993 recession<br />
goods suffered most, with production losses of 26 % relative<br />
to the pre‑recession peak levels, while the total consumer<br />
goods and non‑durable consumer goods faired relatively<br />
well with production losses amounting to between 65%<br />
and 7 % at the troughs. Production levels for industries<br />
producing non‑durable consumer goods are close to the<br />
pre‑recession peak cf. Figure I.5. 9<br />
FIgURE I.5: Capital, Durable and Intermediate goods were most heavily hit during the latest recession<br />
Percent<br />
5<br />
0<br />
-5<br />
-10<br />
-15<br />
-20<br />
-25<br />
-30<br />
0 2 4 6 8 10 12 14 16 18 20 22 24 26 28 30 32 34 36 38 40<br />
Source: own calculations using Eurostat data.<br />
Months<br />
Non-durables<br />
Intermediates<br />
Durables<br />
Consumer<br />
Capital<br />
9 In order to facilitate comparison of the duration of the recession<br />
for the different manufacturing aggregates, the peak levels for<br />
all sub-sectors in figure II.3 have been set to the peak level for<br />
capital and intermediate goods which occurred in January 2008.<br />
In reality, the decline for durable consumer goods began in<br />
August 2007 while the peak for non-durable consumer goods<br />
and total consumer goods occurred in October 2007.<br />
19


