EU industrial structure - EU Bookshop - Europa
EU industrial structure - EU Bookshop - Europa EU industrial structure - EU Bookshop - Europa
EU industrial structure 2011 — Trends and Performance IV.5 Trade in intermediate goods This section aims at providing information about how the globalisation process and increased trade in intermediate goods have impacted on the trade performance of EU industries. This is analysed in two ways. First, the extent of imported intermediates in exports for countries and industries is analysed. This is followed by analysis of the competitiveness of EU manufacturing in intermediate trade. The EU manufacturing industry is compared with those of the BRIC countries, Japan and the USA. A distinct feature of the increased globalisation is the fragmentation of firms’ value chains and establishment of cross‑border networks by an increasing number of firms. This implies that imports and exports move together, since companies’ production process are increasingly characterised 124 box IV.7: Vertical specialisation by sequential production in different locations depending on the comparative advantages of the locations. An increasing share of firms’ exports is composed of imports: for example, it is no longer valid to label a product which is exported from the UK as ‘Made in UK’ since the production of components and services needed to produce the product has taken place in many locations across the world. The concept ‘vertical specialisation’ [Hummels et al. (2001)] which is a measure of the import content of exports, has been proposed to gauge this feature of trade with intermediate goods. The concept of vertical specialisation concerns both imports and exports of goods between at least three countries. Intermediates are imported in one country from a source country and used in the production of further intermediate goods or final goods which are exported to a destination country, cf. Box IV.7. When an industry i in country k uses imported inputs to produce an exported good, vertical specialisation VS is ki defined as: 78 Vertical specialisation for a country k equals the sum of VS for all i, VS = Σ VS . Relating it to exports yields vertical k i ki specialisation share of total exports for a country: 79 VS share of total exports for country k = where X denotes exports. 80 78 Hummels et. at. (2001) p. 78. 79 The concept ‘import content of exports’ is sometimes used to describe the same phenomena, OECD (2010). 80 See Hummels et. al. (2001) p. 79 for details. It is shown that vertical specialisation for a country k is an export-weighed average of the sector vertical specialisation export shares. The equivalent matrix notation of the expression above is uAM[I — AD] -1 X/X k, where u is a vector of 1’s, AM is the n x n imported coefficient matrix, I is the identity matrix, AD is the n x n domestic coefficient matrix, X is n x 1 vector of exports, Xk is total country exports and n is the number of sectors. In order to calculate the shares for sectors, X is replaced by a n x n vector with sector exports in the diagonal and zeros elsewhere. See OECD (2010) for details.
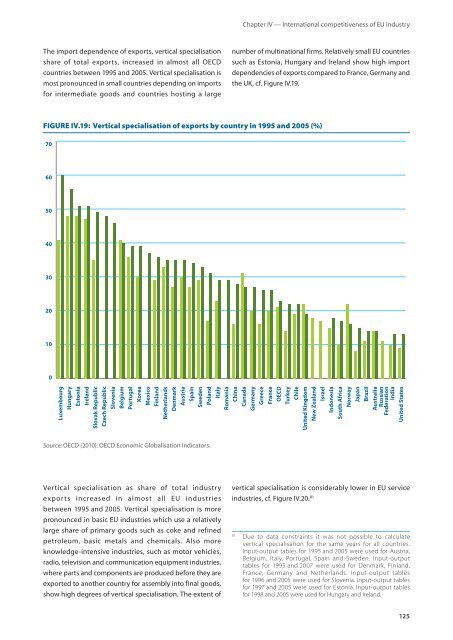
The import dependence of exports, vertical specialisation share of total exports, increased in almost all OECD countries between 1995 and 2005. Vertical specialisation is most pronounced in small countries depending on imports for intermediate goods and countries hosting a large Chapter IV — International competitiveness of EU industry number of multinational firms. Relatively small EU countries such as Estonia, Hungary and Ireland show high import dependencies of exports compared to France, Germany and the UK, cf. Figure IV.19. FIgURE IV.19: Vertical specialisation of exports by country in 1995 and 2005 (%) 70 60 50 40 30 20 10 0 Luxembourg Hungary Estonia Ireland Slovak Republic Czech Republic Slovenia Belgium Portugal Korea Mexico Finland Netherlands Denmark Austria Spain Sweden Source: OECD (2010). OECD Economic Globalisation Indicators. Vertical specialisation as share of total industry exports increased in almost all EU industries between 1995 and 2005. Vertical specialisation is more pronounced in basic EU industries which use a relatively large share of primary goods such as coke and refined petroleum, basic metals and chemicals. Also more knowledge‑intensive industries, such as motor vehicles, radio, television and communication equipment industries, where parts and components are produced before they are exported to another country for assembly into final goods, show high degrees of vertical specialisation. The extent of Poland Italy Romania China Canada Germany Greece France OECD Turkey Chile United Kingdom New Zealand Israel Indonesia South Africa Norway Japan Brazil Australia Russian Federation India United States vertical specialisation is considerably lower in EU service industries, cf. Figure IV.20. 81 81 Due to data constraints it was not possible to calculate vertical specialisation for the same years for all countries. Input-output tables for 1995 and 2005 were used for Austria, Belgium, Italy, Portugal, Spain and Sweden. Input-output tables for 1995 and 2007 were used for Denmark, Finland, France, Germany and Netherlands. Input-output tables for 1996 and 2005 were used for Slovenia. Input-output tables for 1997 and 2005 were used for Estonia. Input-output tables for 1998 and 2005 were used for Hungary and Ireland. 125
- Page 76 and 77: EU industrial structure 2011 — Tr
- Page 78 and 79: EU industrial structure 2011 — Tr
- Page 80 and 81: EU industrial structure 2011 — Tr
- Page 82 and 83: EU industrial structure 2011 — Tr
- Page 84 and 85: EU industrial structure 2011 — Tr
- Page 86 and 87: EU industrial structure 2011 — Tr
- Page 88 and 89: EU industrial structure 2011 — Tr
- Page 90 and 91: EU industrial structure 2011 — Tr
- Page 92 and 93: EU industrial structure 2011 — Tr
- Page 94 and 95: EU industrial structure 2011 — Tr
- Page 97 and 98: Chapter IV International competitiv
- Page 99 and 100: Chapter IV — International compet
- Page 101 and 102: FIgURE IV.1: EU accounts for almost
- Page 103 and 104: TAbLE IV.4: EU exports of manufactu
- Page 105 and 106: iv22 Export market shares Export ma
- Page 107 and 108: iv23 sectoral trade balance The rel
- Page 109 and 110: FIgURE IV.3: EU-27 RCA index in 200
- Page 111 and 112: RCA‑indices for individual manufa
- Page 113 and 114: FIgURE IV.8: China trade in manufac
- Page 115 and 116: Chapter IV — International compet
- Page 117 and 118: communi‑ cation computer and info
- Page 119 and 120: FIgURE IV.13: Japan trade in servic
- Page 121 and 122: FIgURE IV.17: Russia trade in servi
- Page 123 and 124: Chapter IV — International compet
- Page 125: IV.4 The role of technology in EU s
- Page 129 and 130: The calculations of vertical specia
- Page 131 and 132: IV.6 International movement of fact
- Page 133 and 134: In many sectors, outward EU‑27 FD
- Page 135 and 136: iv62 internationalisation of r&d An
- Page 137: The US is the most important locati
- Page 140 and 141: EU industrial structure 2011 — Tr
- Page 142 and 143: EU industrial structure 2011 — Tr
- Page 144 and 145: EU industrial structure 2011 — Tr
- Page 146 and 147: EU industrial structure 2011 — Tr
- Page 148 and 149: EU industrial structure 2011 — Tr
- Page 150: EU industrial structure 2011 — Tr
- Page 155 and 156: How to obtain EU publications Free
The import dependence of exports, vertical specialisation<br />
share of total exports, increased in almost all OECD<br />
countries between 1995 and 2005. Vertical specialisation is<br />
most pronounced in small countries depending on imports<br />
for intermediate goods and countries hosting a large<br />
Chapter IV — International competitiveness of <strong>EU</strong> industry<br />
number of multinational firms. Relatively small <strong>EU</strong> countries<br />
such as Estonia, Hungary and Ireland show high import<br />
dependencies of exports compared to France, Germany and<br />
the UK, cf. Figure IV.19.<br />
FIgURE IV.19: Vertical specialisation of exports by country in 1995 and 2005 (%)<br />
70<br />
60<br />
50<br />
40<br />
30<br />
20<br />
10<br />
0<br />
Luxembourg<br />
Hungary<br />
Estonia<br />
Ireland<br />
Slovak Republic<br />
Czech Republic<br />
Slovenia<br />
Belgium<br />
Portugal<br />
Korea<br />
Mexico<br />
Finland<br />
Netherlands<br />
Denmark<br />
Austria<br />
Spain<br />
Sweden<br />
Source: OECD (2010). OECD Economic Globalisation Indicators.<br />
Vertical specialisation as share of total industry<br />
exports increased in almost all <strong>EU</strong> industries<br />
between 1995 and 2005. Vertical specialisation is more<br />
pronounced in basic <strong>EU</strong> industries which use a relatively<br />
large share of primary goods such as coke and refined<br />
petroleum, basic metals and chemicals. Also more<br />
knowledge‑intensive industries, such as motor vehicles,<br />
radio, television and communication equipment industries,<br />
where parts and components are produced before they are<br />
exported to another country for assembly into final goods,<br />
show high degrees of vertical specialisation. The extent of<br />
Poland<br />
Italy<br />
Romania<br />
China<br />
Canada<br />
Germany<br />
Greece<br />
France<br />
OECD<br />
Turkey<br />
Chile<br />
United Kingdom<br />
New Zealand<br />
Israel<br />
Indonesia<br />
South Africa<br />
Norway<br />
Japan<br />
Brazil<br />
Australia<br />
Russian<br />
Federation<br />
India<br />
United States<br />
vertical specialisation is considerably lower in <strong>EU</strong> service<br />
industries, cf. Figure IV.20. 81<br />
81 Due to data constraints it was not possible to calculate<br />
vertical specialisation for the same years for all countries.<br />
Input-output tables for 1995 and 2005 were used for Austria,<br />
Belgium, Italy, Portugal, Spain and Sweden. Input-output<br />
tables for 1995 and 2007 were used for Denmark, Finland,<br />
France, Germany and Netherlands. Input-output tables<br />
for 1996 and 2005 were used for Slovenia. Input-output tables<br />
for 1997 and 2005 were used for Estonia. Input-output tables<br />
for 1998 and 2005 were used for Hungary and Ireland.<br />
125


