EU industrial structure - EU Bookshop - Europa
EU industrial structure - EU Bookshop - Europa EU industrial structure - EU Bookshop - Europa
EU industrial structure 2011 — Trends and Performance TAbLE IV.10: Manufactured products - World trade matrix, income level: exports in 2009 (%) Export Eu‑27 120 high income non Eu‑27 upper medium income destination low medium income low income Origin EU‑27 26.9 7.3 3.3 2.9 0.4 40.6 High income non EU‑27 6.3 12.8 3.9 7.5 0.6 31.1 Upper medium income 3.4 4.3 1.5 2.1 0.3 11.5 Low medium income 3.3 8.2 1.7 1.9 0.9 16.0 Low income 0.1 0.4 0.1 0.2 0.1 1.0 world World 39.8 33.1 10.4 14.6 2.2 100.0 Note: Due to rounding, certain columns or rows do not add up to 100 %. The matrix is calculated from export data. It refers exclusively to manufactured products, so it does not include crude oil and other products from mining and quarrying. The values in each cell are percentage shares of total world trade. The main diagonal in the matrix (shaded cells) represents intra‑region trade (e.g. exports from EU countries to EU countries). Each cell shows the share of total world exports which are exported from an exporter to a certain destination. For example, Upper medium income countries’ exports to EU‑27 accounts for 3.4 % of total world exports and total Upper median income countries’ exports accounts for 11.5 % of total world exports. Source: own calculations using COMTRADE data. When intra‑regional EU trade is excluded from the data, the largest share of EU‑27 trade (both exports and imports) takes place with high income countries. Some 53 % of extra‑EU exports go to other high‑income countries, and 56 % of imports originate from high‑income countries towards the EU. However, 21 % of extra‑EU exports go to low‑medium income countries, and 18% of EU imports also originate from these countries, cf. Tables IV.11 and IV.12. TAbLE IV.11: Manufactured products - World trade matrix income level: destination of exports in 2009 (%) Export Eu‑27 high income non Eu‑27 upper medium income destination low medium income low income world Origin EU‑27 0.0 52.8 23.9 20.8 2.6 100.0 High income non EU‑27 34.5 0.0 21.1 41.0 3.4 100.0 Upper medium income 33.7 43.0 0.0 20.6 3.1 100.0 Low medium income 23.2 58.5 12.3 0.0 6.1 100.0 Low income 15.8 47.3 8.9 28.0 0.0 100.0 Note: Due to rounding, certain columns or rows do not add up to 100 %. The matrix is calculated from export data. It refers exclusively to manufactured products, so it does not include crude oil and other products from mining and quarrying. The main diagonal in the matrix (shaded cells) shows that intra‑regional trade (e.g. exports from EU countries to EU countries) is excluded in this table. Exporters are shown in rows and destination markets in columns. Each cell shows the share of total exports from an exporter to a certain destination. For example, 33.7 % of Upper medium income countries’ exports are destined for EU‑27. Source: own calculations using COMTRADE data.
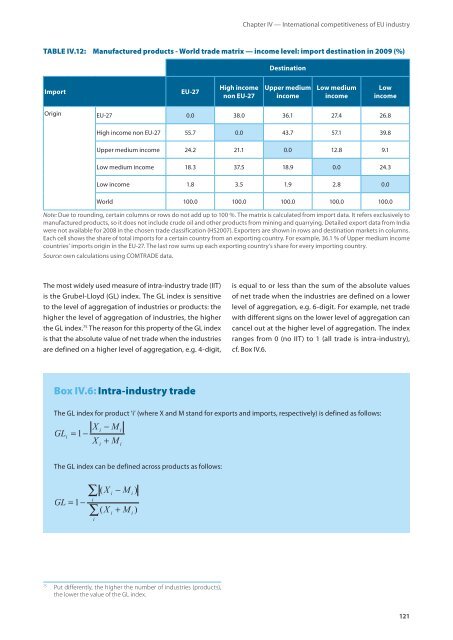
Chapter IV — International competitiveness of EU industry TAbLE IV.12: Manufactured products - World trade matrix — income level: import destination in 2009 (%) import Eu‑27 high income non Eu‑27 destination upper medium income low medium income low income Origin EU‑27 0.0 38.0 36.1 27.4 26.8 High income non EU‑27 55.7 0.0 43.7 57.1 39.8 Upper medium income 24.2 21.1 0.0 12.8 9.1 Low medium income 18.3 37.5 18.9 0.0 24.3 Low income 1.8 3.5 1.9 2.8 0.0 World 100.0 100.0 100.0 100.0 100.0 Note: Due to rounding, certain columns or rows do not add up to 100 %. The matrix is calculated from import data. It refers exclusively to manufactured products, so it does not include crude oil and other products from mining and quarrying. Detailed export data from India were not available for 2008 in the chosen trade classification (HS2007). Exporters are shown in rows and destination markets in columns. Each cell shows the share of total imports for a certain country from an exporting country. For example, 36.1 % of Upper medium income countries’ imports origin in the EU‑27. The last row sums up each exporting country’s share for every importing country. Source: own calculations using COMTRADE data. The most widely used measure of intra‑industry trade (IIT) is the Grubel‑Lloyd (GL) index. The GL index is sensitive to the level of aggregation of industries or products: the higher the level of aggregation of industries, the higher the GL index. 75 The reason for this property of the GL index is that the absolute value of net trade when the industries are defined on a higher level of aggregation, e.g. 4‑digit, box IV.6: Intra-industry trade 75 Put differently, the higher the number of industries (products), the lower the value of the GL index. is equal to or less than the sum of the absolute values of net trade when the industries are defined on a lower level of aggregation, e.g. 6‑digit. For example, net trade with different signs on the lower level of aggregation can cancel out at the higher level of aggregation. The index ranges from 0 (no IIT) to 1 (all trade is intra‑industry), cf. Box IV.6. The GL index for product ‘i’ (where X and M stand for exports and imports, respectively) is defined as follows: The GL index can be defined across products as follows: 121
- Page 72 and 73: EU industrial structure 2011 — Tr
- Page 74 and 75: EU industrial structure 2011 — Tr
- Page 76 and 77: EU industrial structure 2011 — Tr
- Page 78 and 79: EU industrial structure 2011 — Tr
- Page 80 and 81: EU industrial structure 2011 — Tr
- Page 82 and 83: EU industrial structure 2011 — Tr
- Page 84 and 85: EU industrial structure 2011 — Tr
- Page 86 and 87: EU industrial structure 2011 — Tr
- Page 88 and 89: EU industrial structure 2011 — Tr
- Page 90 and 91: EU industrial structure 2011 — Tr
- Page 92 and 93: EU industrial structure 2011 — Tr
- Page 94 and 95: EU industrial structure 2011 — Tr
- Page 97 and 98: Chapter IV International competitiv
- Page 99 and 100: Chapter IV — International compet
- Page 101 and 102: FIgURE IV.1: EU accounts for almost
- Page 103 and 104: TAbLE IV.4: EU exports of manufactu
- Page 105 and 106: iv22 Export market shares Export ma
- Page 107 and 108: iv23 sectoral trade balance The rel
- Page 109 and 110: FIgURE IV.3: EU-27 RCA index in 200
- Page 111 and 112: RCA‑indices for individual manufa
- Page 113 and 114: FIgURE IV.8: China trade in manufac
- Page 115 and 116: Chapter IV — International compet
- Page 117 and 118: communi‑ cation computer and info
- Page 119 and 120: FIgURE IV.13: Japan trade in servic
- Page 121: FIgURE IV.17: Russia trade in servi
- Page 125 and 126: IV.4 The role of technology in EU s
- Page 127 and 128: The import dependence of exports, v
- Page 129 and 130: The calculations of vertical specia
- Page 131 and 132: IV.6 International movement of fact
- Page 133 and 134: In many sectors, outward EU‑27 FD
- Page 135 and 136: iv62 internationalisation of r&d An
- Page 137: The US is the most important locati
- Page 140 and 141: EU industrial structure 2011 — Tr
- Page 142 and 143: EU industrial structure 2011 — Tr
- Page 144 and 145: EU industrial structure 2011 — Tr
- Page 146 and 147: EU industrial structure 2011 — Tr
- Page 148 and 149: EU industrial structure 2011 — Tr
- Page 150: EU industrial structure 2011 — Tr
- Page 155 and 156: How to obtain EU publications Free
Chapter IV — International competitiveness of <strong>EU</strong> industry<br />
TAbLE IV.12: Manufactured products - World trade matrix — income level: import destination in 2009 (%)<br />
import Eu‑27<br />
high income<br />
non Eu‑27<br />
destination<br />
upper medium<br />
income<br />
low medium<br />
income<br />
low<br />
income<br />
Origin <strong>EU</strong>‑27 0.0 38.0 36.1 27.4 26.8<br />
High income non <strong>EU</strong>‑27 55.7 0.0 43.7 57.1 39.8<br />
Upper medium income 24.2 21.1 0.0 12.8 9.1<br />
Low medium income 18.3 37.5 18.9 0.0 24.3<br />
Low income 1.8 3.5 1.9 2.8 0.0<br />
World 100.0 100.0 100.0 100.0 100.0<br />
Note: Due to rounding, certain columns or rows do not add up to 100 %. The matrix is calculated from import data. It refers exclusively to<br />
manufactured products, so it does not include crude oil and other products from mining and quarrying. Detailed export data from India<br />
were not available for 2008 in the chosen trade classification (HS2007). Exporters are shown in rows and destination markets in columns.<br />
Each cell shows the share of total imports for a certain country from an exporting country. For example, 36.1 % of Upper medium income<br />
countries’ imports origin in the <strong>EU</strong>‑27. The last row sums up each exporting country’s share for every importing country.<br />
Source: own calculations using COMTRADE data.<br />
The most widely used measure of intra‑industry trade (IIT)<br />
is the Grubel‑Lloyd (GL) index. The GL index is sensitive<br />
to the level of aggregation of industries or products: the<br />
higher the level of aggregation of industries, the higher<br />
the GL index. 75 The reason for this property of the GL index<br />
is that the absolute value of net trade when the industries<br />
are defined on a higher level of aggregation, e.g. 4‑digit,<br />
box IV.6: Intra-industry trade<br />
75 Put differently, the higher the number of industries (products),<br />
the lower the value of the GL index.<br />
is equal to or less than the sum of the absolute values<br />
of net trade when the industries are defined on a lower<br />
level of aggregation, e.g. 6‑digit. For example, net trade<br />
with different signs on the lower level of aggregation can<br />
cancel out at the higher level of aggregation. The index<br />
ranges from 0 (no IIT) to 1 (all trade is intra‑industry),<br />
cf. Box IV.6.<br />
The GL index for product ‘i’ (where X and M stand for exports and imports, respectively) is defined as follows:<br />
The GL index can be defined across products as follows:<br />
121


