Detailed visual seabed survey at drilling site 7218/11-1
Detailed visual seabed survey at drilling site 7218/11-1
Detailed visual seabed survey at drilling site 7218/11-1

You also want an ePaper? Increase the reach of your titles
YUMPU automatically turns print PDFs into web optimized ePapers that Google loves.
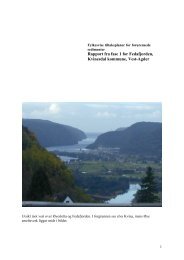
5.3.2 Plots of sponge distribution and density<br />
We haveadopted two methods for presentingobserv<strong>at</strong>ionsof spongedensities.First, a 'dot-map'<br />
showingthe actualobserv<strong>at</strong>ionsmadealongthe ROVtrack (Figure22). Becausethis canbe <strong>visual</strong>ly<br />
difficult to interpret, we alsopresentdistribution maps,where the distribution of spongedensities<br />
areinterpol<strong>at</strong>edin-betweenthe actualobserv<strong>at</strong>ionpoints,usingthe SURFERprogramme(Figure23).<br />
Estim<strong>at</strong>edspongedensities(%of sedimentsurfaceoccupiedby sponge)rangedfrom 0 %to 15-25 %,<br />
andgenerallyweredistributedall overthe <strong>survey</strong>area.<br />
Figure22. Visualobserv<strong>at</strong>ionsof estim<strong>at</strong>edspongedensities,Darwin,August2012<br />
Akvaplan-niva AS, 9296 Tromsø<br />
28 www.akvaplan.niva.no