Detailed visual seabed survey at drilling site 7218/11-1
Detailed visual seabed survey at drilling site 7218/11-1
Detailed visual seabed survey at drilling site 7218/11-1

Create successful ePaper yourself
Turn your PDF publications into a flip-book with our unique Google optimized e-Paper software.
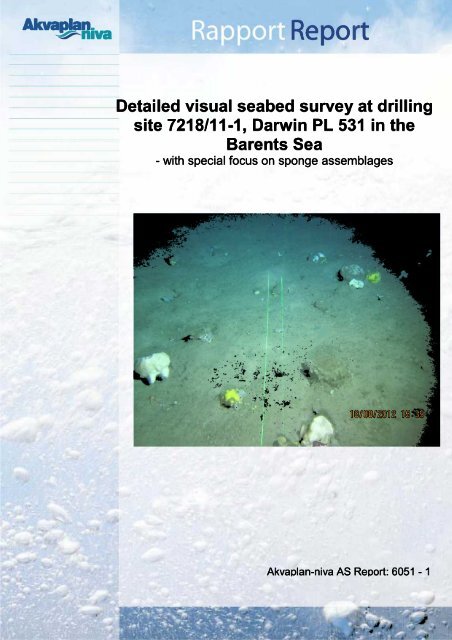
<strong>Detailed</strong> <strong>visual</strong> <strong>seabed</strong> <strong>survey</strong> <strong>at</strong> <strong>drilling</strong><br />
<strong>site</strong> <strong>7218</strong>/<strong>11</strong>-1, Darwin PL 531 in the<br />
Barents Sea<br />
- with special focus on sponge assemblages<br />
Akvaplan-niva AS Report: 6051 - 1
Cover picture: sponges <strong>at</strong> the sediment surface <strong>at</strong> Darwin, PL531, August, 2012. White: Geodia<br />
and yellow: Apl ysilla . Photo: Oceaneering AS/ Akvaplan -niva.
Akvaplan -niva AS<br />
Rådgivning og forskning innen miljø og akvakultur<br />
Org.nr: NO 937 375 158 MVA<br />
Framsenteret<br />
9296 Tromsø<br />
Tlf: 77 75 03 00, Fax: 77 75 03 01<br />
www.akvaplan.niva.no<br />
Report title<br />
<strong>Detailed</strong><strong>visual</strong><strong>seabed</strong><strong>survey</strong><strong>at</strong> <strong>drilling</strong> <strong>site</strong> <strong>7218</strong>/<strong>11</strong>-1, Darwin PL 531 in<br />
the BarentsSea- with specialfocuson spongeassemblages .<br />
Author(s)<br />
SabineCochrane<br />
RunePalerud<br />
JesperHansen<br />
AnnaHelenaFalk<br />
Client<br />
RepsolExplor<strong>at</strong>ionNorwayAS(RENAS)<br />
Akvaplan -niva report no.<br />
6051– 1<br />
D<strong>at</strong>e<br />
25.09.2012<br />
No. of pages<br />
64<br />
Distribution<br />
Restricted<br />
Client’s reference<br />
SigurdHellem<br />
Summary<br />
On commissionto RENASNorway, Akvaplan-niva provided biological assistanceduring ROVsediment<br />
mappingaround the planned<strong>drilling</strong><strong>site</strong> <strong>at</strong> the Darwinprospect(PL531)in the BarentsSea, August2012.<br />
ROVfilming along a transect length of approxim<strong>at</strong>ely27 200 m was carried out, over approxim<strong>at</strong>ely17<br />
hours.Thisreport documentsthe distributionanddensitiesof the spongepopul<strong>at</strong>ionsin the area,together<br />
with other biologicalandsedimentcharacteristics.In general,the seafloorcloseto the planned<strong>drilling</strong> <strong>site</strong><br />
<strong>at</strong> the Darwinprospectcanbe characterizedasmainlycomprisedof mud, with somesc<strong>at</strong>teredstones. The<br />
area is visibly rich in bottom currents, and the visible sea-floor communitiesare domin<strong>at</strong>ed by sponges<br />
suchasGeodia,Aplysilla,Farreaoccaandassoci<strong>at</strong>edorganismssuchassqu<strong>at</strong>lobsters(Munida).<br />
Themain challengesfor spongeassessmentsare outlined, and the approachappliedduring the <strong>survey</strong>is<br />
describedin detail. Further,a summaryof st<strong>at</strong>eof knowledgeregardingspongesandmethodsof assessing<br />
spongeassemblagesisoutlined.<br />
Project manager Quality control ler<br />
SabineCochrane LarsHenrikLarsen<br />
© 2012 Akvaplan -niva AS. This report may only be copied as a whole. Copying of part of this<br />
report (sections of text, illustr<strong>at</strong>ions, tables, conclusions, etc.) and/or reproduction in other<br />
ways, is only permitted with written consent from Akvaplan -niva AS.
Table of Contents<br />
PREFACE ................................ ................................ ................................ ................................ ..........................4<br />
1 INTRODUCTION ................................ ................................ ................................ ................................ .............5<br />
1.1BACKGROUND................................ ................................ ................................ ................................ ...................5<br />
1.2SUMMARYOFPREVIOUSURVEYSATDARWIN................................ ................................ ................................ .........5<br />
1.2.1Baseline<strong>survey</strong>20<strong>11</strong>................................ ................................ ................................ ............................. 5<br />
1.2.2Additionalstudies2012................................ ................................ ................................ .........................6<br />
1.3AIMSANDCHALLENGES FORPRESENTSURVEY................................ ................................ ................................ ..........7<br />
2 MATERIALSANDMETHODS................................ ................................ ................................ ..........................8<br />
2.1VESSELANDNAVIGATION................................ ................................ ................................ ................................ .....8<br />
2.2ROV,VIDEOANDSTILLIMAGES................................ ................................ ................................ ............................. 8<br />
2.3SURVEYTRACKANDWAYPOINTS................................ ................................ ................................ ..........................10<br />
2.4OBSERVATIONLOGSANDEVENTLOGGING................................ ................................ ................................ .............<strong>11</strong><br />
2.4.1Stepstakento addresschallenges................................ ................................ ................................ .......<strong>11</strong><br />
2.4.2Eventlogging................................ ................................ ................................ ................................ .......12<br />
3 ABOUTSPONGESANDCHALLENGES FORASSESMENT................................ ................................ ...............13<br />
3.1OSPARHABITATCLASSIFICATI ONOFSPONGES ................................ ................................ ................................ .......13<br />
3.2SPONGESIN THESOUTH-WESTERNBARENTSEA................................ ................................ ................................ ....13<br />
3.3ABOUTSPONGES IN GENERAL................................ ................................ ................................ .............................. 16<br />
3.4RED-LISTEDSPONGES ................................ ................................ ................................ ................................ ........18<br />
3.5SPONGESASECOSYSTEMENGINEERS ................................ ................................ ................................ ....................19<br />
4 ABUNDANCEQUANTIFICATIONCHALLENGES - CASESTUDYSALINA,JUKSAANDDARWIN.........................21<br />
4.1GENERAL................................ ................................ ................................ ................................ ........................21<br />
4.2CURRENTAPPROACHES – ASSESSINGCOVERAGE ................................ ................................ ................................ .....22<br />
5 RESULTSANDDISCUSION................................ ................................ ................................ ...........................25<br />
5.1GENERALOBSERVATIONS ................................ ................................ ................................ ................................ ...25<br />
5.2SEAFLOORCONDITIONS................................ ................................ ................................ ................................ .....26<br />
5.2.1Sedimentcomposition................................ ................................ ................................ .........................26<br />
5.2.2Litter andotherhumanimpacts................................ ................................ ................................ ..........26<br />
5.2.3Seashorealgaeandfishfalls................................ ................................ ................................ ................27<br />
5.3DISTRIBUTIONMAPSANDSELECTED IMAGES................................ ................................ ................................ ..........27<br />
5.3.1Generaloverview................................ ................................ ................................ ................................ . 27<br />
5.3.2Plotsof spongedistributionanddensity................................ ................................ .............................. 28<br />
5.3.3Overallassessmentof spongedensities<strong>at</strong> the Darwin<strong>site</strong>................................ ................................ . 36<br />
5.3.4Integr<strong>at</strong>edassessment – baseline<strong>survey</strong>anddetailed<strong>site</strong><strong>survey</strong>................................ ......................37<br />
5.3.5Dominantspongespeciesrecordedin the current<strong>survey</strong>................................ ................................ ...38<br />
5.3.6Trawltracks................................ ................................ ................................ ................................ .........44<br />
5.3.7Generalimpressions(images)................................ ................................ ................................ ..............45<br />
5.4ENVIRONMENTALCOSTSANDBENEFITSFORDISCHARGESCENARIOS ................................ ................................ ............48<br />
5.4.1Dischargescenarios................................ ................................ ................................ ............................. 48<br />
5.4.2Depositionscenariosrel<strong>at</strong>edto areaof impactto sponges................................ ................................ . 50<br />
5.4.3Compar<strong>at</strong>iveassessment ................................ ................................ ................................ .....................56<br />
5.5ASSESSINGVULNERABILI TYOFSPONGEASSEMBL AGESTODRILLINGDISCHARGES ................................ ............................ 56<br />
5.5.1Wh<strong>at</strong> do sensitivityandvulnerabilitymean?................................ ................................ .......................56<br />
5.5.2Ongoingandplannedexperimentalandin situ workon assessingsensitivityof spongesto <strong>drilling</strong><br />
cuttings................................. ................................ ................................ ................................ ........................57<br />
6 REFERENCES ................................ ................................ ................................ ................................ .................58<br />
APPENDICES ................................ ................................ ................................ ................................ ....................60<br />
<strong>Detailed</strong> <strong>site</strong> <strong>survey</strong> <strong>at</strong> PL531 Darwin<br />
Akvaplan-niva AS Rapport 6051 - 1
List of figures and tables<br />
FIGURE1.EXPLORATIONWELL<strong>7218</strong>/<strong>11</strong>-1 (DARWIN) LOCATIONINTHEBARENTSEA(SOURCE<br />
: RENAS) ................................ ...5<br />
FIGURE2.ROVTRANSECTS ANDRECORDSOFSPONGESFOUNDATDARWINDURINGTHEBASELINESURVEYIN20<strong>11</strong>.THERELATIVE<br />
AMOUNTSOFTHEVARIOUSCATEGORIES OFSPONGEDENSITIESARESHOWNINTHEPIECHART. SEDIMENTSAMPLESWERETAKEN<br />
ATTHEREDDOTS(AXESCROSSES ).THESPUDLOCATIONISMARKEDWITHA BLUETRIANGLE(SEEARROW).FIGUREFROMDNV<br />
(20<strong>11</strong>)................................. ................................ ................................ ................................ ............................. 6<br />
FIGURE3.MSNJORDVIKING................................. ................................ ................................ ................................ ........8<br />
FIGURE4.MAGNUMROVSYSTEMUNDERDEPLOYMENTFROMNJORDVIKING. THEBLUECYLINDERATTHEBASEOFTHEROVISTHE<br />
HDSTILLCAMERA. PHOTOSABINECOCHRANE . ................................ ................................ ................................ .........9<br />
FIGURE5.INSTALLINGHDCAMERAONTHEMAGNUMROV.INCLUDEDTOGIVESCALETOTHEFIGUREABOVE. PHOTOSABINE<br />
COCHRANE . ................................ ................................ ................................ ................................ ........................9<br />
FIGURE6.PLANNEDSURVEYROUTEFORDETAILEDSITESURVEYATDARWIN, AUGUST2012................................. ....................<strong>11</strong><br />
FIGURE7.OVER4 TONNESOFSPONGES(PRESUMABLY ACCIDENTA LLY) COLLECTED INA TRAWLDURINGA RESEARCH EXPEDITIONTO<br />
THETROMSØFLAKET , NORTHERNORWAYIN2007.IMAGE: NORWEGIANRESEARCHINSTITUTE<br />
(HTTP:// WWW.IMR.NO/ TOKT/ TOKTOMTALER/ OKOSYSTEMTOKTET /TOKTDAGBOK _2007/DEKKET_FULLT_AV_SVAMP/ NB-NO).<br />
................................ ................................ ................................ ................................ ................................ ......14<br />
FIGURE8.GEODIASPONGEASSEMBL AGEIN THENORTHWESTATLANTIC. IMAGE: NORTHWESTATLANTICFISHERIESORGANISATION ).<br />
................................ ................................ ................................ ................................ ................................ ......14<br />
FIGURE9.GENERALDISTRIBUTIONOFHABITAT-FORMINGSPONGES INTHENEATLANTICANDNORDICSEASASINDICATEDBYRECORDS<br />
IN THEOSPAR[…]DATABASE . CONCENTRATION OFSPONGESVARYCONSIDERABL YWITHINTHESEAREAS........................... 15<br />
FIGURE10.BARENTSEA. SPONGEBYCATCHIN RESEARCHBOTTOMTRAWLING1982-97SUPERIMPOSED ONFISHING..................16<br />
FIGURE<strong>11</strong>.GENERALSTRUCTURE OFA HYPOTHETICAL SPONGE. FIGUREFROMUNIVERSITYOFBERKELEY<br />
(HTTP:// WWW.UCMP.BERKELEY .EDU/ PORIFERA / PORIFERAMM .HTML)................................. ................................ ........17<br />
FIGURE12.SCANNINGELECTRONMICROSCOPE (SEM)IMAGEOFSPONGESPICULES. IMAGEFROM<br />
HTTP:// WWW.UCMP.BERKELEY .EDU/ PORIFERA / PORSKEL .HTML................................. ................................ .................17<br />
FIGURE13.LEFT: UNIDENTIFIEDSPONGEFROMTHEDEEP-WATERLICENSEBØNNA, HOMETOAPOPULATIONOFGAMMARID<br />
CRUSTACEANS ANDRIGHT: AGEODIACOLONY, OFFERINGSUBSTRATE ANDSHELTERFOROTHERORGANISMS . PHOTOLEFT:<br />
AKVAPLAN-NIVA/OCEANEERING /ENIRIGHT: ILLUSTRATION PHOTOGRA PH, UNKNOWNLOCATION................................. .....18<br />
FIGURE14.PHOTOSFROMMERCIER(2012)SHOWING(LEFT) A SEA-PENFIELDAND(RIGHT) DEVELOPINGLARVAEOFTHEREDFISH<br />
SEBASTESTUCKEDAMONGTHEPOLYPSOFTHESEAPENS . SIZEOFTHESEAPENS ISNOTGIVEN, BUTTHESCALEBARS ONTHERIGHT<br />
AREBOTH1 MM. ................................ ................................ ................................ ................................ ...............20<br />
FIGURE15.ABUNDANCESCALEDEFINEDBYDNV,2008.UPPERLEFTRARE, UPPE RIGHT, SCATTERED , LOWERLEFT, REGULARAND<br />
LOWERRIGHT, HIGHDENSITY ................................. ................................ ................................ ............................... 21<br />
FIGURE16.IMAGEFROMSALINA, 2010,CLASSIFIED ASHAVINGA HIGHDENSITYOFSPONGES . THEGENERALSEAFLOORPICTUREIS<br />
SIMILARALSOFORBOTHDARWINANDJUKSA. ................................ ................................ ................................ .........22<br />
FIGURE17.IMPROVISEDCONCEPTUAL VISUALISATIONOFSPONGECOVERAGE , USEDINJULY, 2012................................ ...........23<br />
FIGURE18.MATHEMATICALLY CALCULATED%COVERSCHEMEADOPTEDBYPALERUDANDHANSENDURINGTHEPRESENTVISUAL<br />
SURVEYATDARWIN, AUGUST, 2012................................. ................................ ................................ ....................24<br />
FIGURE19.VISUALREPRESENTATION OFDEPTHSRECORDEDDURINGTHESURVEY , BASEDONTHESURVEYLOG. THEPLANNE DRILLING<br />
LOCATIONATDARWINISSHOWNBYA YELLOWSTAR................................. ................................ ................................ 25<br />
FIGURE20.ILLUSTRATIVE IMAGE SHOWINGTYPICALSEDIMENTCONDITIONSATTHEDARWINFIELD, AUGUST, 2012.PHOTOS:<br />
OCEANEERINGAS................................ ................................ ................................ ................................ .............26<br />
FIGURE21.OBSERVATIONOFMARINELITTER. PIECEOFSHAPEDMETALOFUNKNOWNORIGIN................................. .................26<br />
FIGURE22.VISUALOBSERVATIONS OFESTIMATEDSPONGEDENSITIES , DARWIN, AUGUST2012................................ ...............28<br />
FIGURE23.MAPILLUSTRATING THEDENSITYESTIMATION(%COVERAGESPONGES ) ONTHESEDIMENTSURFACE. SEEMETHODS<br />
SECTIONFORQUANTIFI CATIONMETHOD. BLACKCROSSES INDICATEOBSERVATIONS ; DATAAREINTERPOLATE DBETWEENPOINTS<br />
BYTHEKRIGINGMETHODINSURFERPROGRAMME . ................................ ................................ ................................ 29<br />
FIGURE24.LOCATIONOFTHE30IMAGE SELECTED FORFURTHERANALYSIS ................................. ................................ .........30<br />
FIGURE25.PHOTOSFROMSELECTED POSITIONS , ILLUSTRATING THECATEGORY0-1 %COVERAGE . DARWINFIELD, AUGUST2012..31<br />
FIGURE26.PHOTOSFROMSELECTED POSITIONSWITH0-1 %COVERAGEOFSPONGESATDARWINAUGUST2012.THESEIMAGES<br />
TAKENEARLYMORNING, WHENFISHBECAMEABUNDANT................................. ................................ .......................... 32<br />
FIGURE27.PHOTOSFROMSELECTED POSITIONS(SEEMAPINFIGUREX) WITH1-5 %COVERAGEOFSPONGESATDARWINAUGUST<br />
2012................................. ................................ ................................ ................................ ............................. 33<br />
FIGURE28.PHOTOSFROMSELECTED POSITIONSWITH1-5 %COVERAGEOFSPONGESATDARWINAUGUST2012.......................34<br />
FIGURE29.PHOTOSFROMSELECTEDPOSITIONSWITH5-10%COVERAGEOFSPONGESATDARWINAUGUST2012.....................35<br />
FIGURE30.VISUALREPRESENTATION OFFREQUENCIES OFSPONGEABUNDANCECLASSESACROSSTHESTUDYAREA. UPPER:<br />
HISTOGRAMSHOWINGACTUALNUMBERSOFOBSERVATIONSANDLOWER: PIECHARTEXPRESSING RELATIVEFREQUENCIES AS<br />
Akvaplan-niva AS, 9296 Tromsø<br />
2 www.akvaplan.niva.no
PERCENTAGES . NOTETHAT0 %ABUNDANCE(NOTPRESENT ) SHOULDBECONSIDERED AS0-1 %.SEEIMAGESABOVE. THEREARE<br />
SELDOMNOSPONGESOVERMANYMETRESOFSEABED, THUS0 %ISA MATTEROFSCALEANDTIMING(TOTHEMILLISECOND ) OF<br />
WHENTHEOBSERVATIONWASMADE................................. ................................ ................................ ....................36<br />
FIGURE31.MAPOFOBSERVATIONS OFSPONGEDENSITIESCARRIEDOUTDURINGTHE20<strong>11</strong>BASELINESURVEYANDTHECURRENT<br />
2012DETAILEDVISUALSITESURVEY ................................. ................................ ................................ .....................37<br />
FIGURE32.IMAGESOFTHEMOSTDOMINANTSPONGESPECIES/ GROUPSOBSERVEDATTHEDARWINFIELD. ILLUSTRATION IMAGES<br />
FROMAKVAPLAN-NIVAARCHIVES ................................. ................................ ................................ .........................40<br />
FIGURE33.OBSERVATIONS OFTHEPOTATOSPONGEGEODIAATDARWIN, AUGUST, 2012................................. .....................41<br />
FIGURE34.OBSERVATIONS OFTHEYELLOWSPONGE , APLYSILLA , ATDARWIN, AUGUST2012................................. .................42<br />
FIGURE35.OBSERVATIONS OFTHEGLASS-SPONGEFARREAOCCAATDARWIN, AUGUST, 2012................................. ...............43<br />
FIGURE36.OBSERVATIONS FORTHEBLUESPONGEHYMEDESMA , DARWIN, AUGUST2012................................. ....................44<br />
FIGURE37.OBSERVATIONS OFTRAWLTRACKSATTHEDARWINFIELD, AUGUST, 2012................................ ........................... 45<br />
FIGURE38.UPPER: SPOTTEDWOLFISHRESTINGONTHESEDIMENT , AMONGTHEGLASS-SPONGEFARREAOCCA. LOWER:SAITHE,<br />
ATTRACTEDTOTHELIGHTSOFTHEROV................................ ................................ ................................ ...............46<br />
FIGURE39.UPPER: FISH(SAITHE) ANDPOSSIBLYA CORRODEDMETALFISHINGFLOATWITHSOMEBIOLOGICALGROWTHAND(LOWER)<br />
SPONGESONMUDDYSEDIMENT; GEODIAANDAPLYSILLA IN THEFOREGROUND , ANDFARREAOCCAFARTHERBACK(TOTHE<br />
RIGHT)................................. ................................ ................................ ................................ ............................ 47<br />
FIGURE40.LARGESTONEINFOREGROUND, WITHGROWTHOFWHATAPPEARSTOBEHYDROI DS. IN THEBACKGROUNDMUDDY<br />
SEDIMENTSANDERECTSPONGECOLONIES , FREQUENTED BYFISH................................. ................................ ................48<br />
FIGURE41.ILLUSTRATIONOFDEPOSITIONCASE1: DISCHARGE ATTHEORIGINALSPUDLOCATION. UPPER: OBSERVATIONS AND<br />
(LOWER) INTERPOLATED DISTRIBUTIONOFSPONGEABUNDANCES, WITHOVERLAYEDMODELEDSPATIALEXTENTOFDEPOSITED<br />
DRILLINGCUTTINGS(ASPROVIDEDBYSINTEF). ................................ ................................ ................................ .......51<br />
FIGURE42.ILLUSTRATIONOFDEPOSITIONCASE2: DISCHARGE FROMBOTHTHEORIGINALSPUDLOCATIONANDFROMRIG. UPPER:<br />
OBSERVA TIONSAND(LOWER) INTERPOLATED DISTRIBUTIONOFSPONGEABUNDANCES, WITHOVERLAYEDMODELEDSPATIAL<br />
EXTENTOFDEPOSITEDRILLINGMUD/ CUTTINGS(ASPROVIDEDBYSINTEF)................................ ................................ . 52<br />
FIGURE43.ILLUSTRATIONOFDEPOSITIONCASE6: DISCHARGE300M NORTHOFTHEORIGINALSPUDLOCATION. UPPER:<br />
OBSERVATIONS AND(LOWER) ESTIMATIONSOFSPONGEABUNDANCES , WITHOVERLAYEDMODELEDSPATIALEXTENTOF<br />
DEPOSITEDRILLINGMUD/ CUTTINGS(ASPROVIDEDBYSINTEF)................................ ................................ ...............53<br />
FIGURE44.ILLUSTRATIONOFDEPOSITIONCASE7: DISCHARGE ATTHENEWSPUDLOCATION(UPDATE21.09.2012).UPPER:<br />
OBSERVATIONS AND(LOWER). INTERPOLATED ESTIMATI ONSOFSPONGEABUNDANCES, WITHOVERLAYEDMODELEDSPATIAL<br />
EXTENTOFDEPOSITEDRILLINGMUD/ CUTTINGS(ASPROVIDEDBYSINTEF)................................ ................................ 54<br />
FIGURE45.ILLUSTRATIONOFDEPOSITIONCASE6A: DISCHARGENORTH-EASTOFTHESPUDLOCATION. UPPER: OBSERVATIONS AND<br />
(LOWER) INTERPOLATED ESTIMATIONSOFSPONGEABUNDANCES, WITHOVERLAYEDMODELEDSPATIALEXTENTOFDEPOSITED<br />
DRILLINGMUD/ CUTTINGS(ASPROVIDEDBYSINTEF). ................................ ................................ ............................... 55<br />
TABLE1.DESIGNATEDWAYPOINTSFORTHEPRESENTSURVEY. POSITIONSFROMRENAS................................ ........................10<br />
TABLE2.EXTRACTFROMTABLE8 INKÅLÅSETAL., 2010.COUNTYDISTRIBUTIONOFTHENUMBEROFTHREATENEDANDNEAR<br />
THREATENED SPECIESBASEDONDATAFROMTHERØDLISTEDATABASE , ANDCONCERNSKNOWNCURRENTOCCURRENCES OR<br />
ASSUMEDCURRENTOCCURRENCESBASEDONEARLIEROBSERVATIONS ................................. ................................ .........18<br />
TABLE3.EXTRACTFROMEUROPEANSTANDARDCEN/TC230/WG2/TG7"WATERQUALITY—VISUALSEABEDSURVEYSUSING<br />
REMOTELYOPERATEDANDTOWEDOBSERVATIONGEARFORCOLLECTIONOFENVIRONMENTAL DATA". ............................... 23<br />
TABLE4.LISTOFTHEMOSTFREQUENTLYRECORDEDSPONGESPECIES / GROUPSATTHEDARWINFIELD, AUGUST, 2012.SIMPLIFIED<br />
IDENTIFICATION CHARACTERISTICS AREPROVIDEDTOASSISTNON-SPECIALISTS ................................. ............................... 38<br />
TABLE5.EXTRACTFROMOSPAR2010,LISTINGTHEMAINPRESSURESWHICHMAYAFFECTSPONGEPOPULATIONS......................49<br />
TABLE6.SUMMARYOFENVIRONMENTALCOSTSANDBENEFI TSASSOCIATEDWITHTHETHREEMAINTYPESOFDISCHARGESCENARI OS.<br />
................................ ................................ ................................ ................................ ................................ ......50<br />
TABLE7.COMPARISONOFTHEEXTENTOFIMPACTSTOTHESEAFLOORANDSPONGEASSEMBLAGES , UNDER5 DIFFERENTDISCHARGE<br />
SCENARIOS . NOTECASE7 ISCALCULATED FORTHENEWSPUDLOCATION(UPDATED21.09.2012)WHEREASTHEOTHER<br />
SCENARIOS AREBASEDONTHEORIGINALSPUDLOCATION. ................................ ................................ .......................56<br />
<strong>Detailed</strong> <strong>site</strong> <strong>survey</strong> <strong>at</strong> PL531 Darwin<br />
Akvaplan-niva AS Rapport 6051 - 3
Preface<br />
In August,2012,Akvaplan-niva wascontractedby RepsolExplor<strong>at</strong>ionNorwayAS(RENAS) to conduct<br />
a detailed<strong>visual</strong>seafloor<strong>survey</strong><strong>at</strong> the Darwinprospectin the south-westernBarentsSea(PL531).<br />
The backgroundfor the <strong>survey</strong> is the presenceof deep-sea spongeassemblages(a habit<strong>at</strong> type<br />
definedassensitiveby OSPAR) . A detailedmappingis requiredin order for both the industryandthe<br />
regul<strong>at</strong>ory authorities to plan the most appropri<strong>at</strong>e str<strong>at</strong>egy for handlingof drill cuttings in areas<br />
with sponges. The main aim of the <strong>survey</strong>therefore was to map the distribution and densitiesof<br />
spongeassemblages,andgeneralseafloorconditionsin the vicinityof the planned<strong>drilling</strong> <strong>site</strong>.<br />
We thank the master, Paul Aasen,and crew of MS Njord Viking for excelent cooper<strong>at</strong>ion. ROV<br />
supervisorsand pilots from OceaneeringASare gr<strong>at</strong>efully acknowledgedfor their skill and cheerful<br />
<strong>at</strong>titude to unfamiliartasksregardingbiological<strong>survey</strong>ing.We thank the <strong>survey</strong>orsfrom iSURVEYAS,<br />
for enablinggeo-referencedbiologicalrecordings.Finally,specialthanksto SigurdHellem,RENAS, for<br />
<strong>survey</strong>planningand necessarydiscussions.Other RENASand Proactimastaff alsoare acknowledged<br />
for their contributions.<br />
Surveyparticipantswere:<br />
Akvaplan-niva (biologicalservices) OceaneeringAS(ROVservices)<br />
SabineCochrane(landcontact,reporting) RuneAustvoll(supervisor)<br />
JesperHansen(fieldwork) HansM. Dahle<br />
RunePalerud(fieldwork,maps,analyses) StianJacobsen<br />
HelenaFalk(imagecompil<strong>at</strong>ion) EmmaSletten<br />
KjetilRisnes<br />
iSURVEYAS(<strong>survey</strong>ors) HåvardFredheim<br />
BjørnEdvardsen, senioroffshore<strong>survey</strong>or<br />
DagAtle Skår, offshore<strong>survey</strong>or<br />
Akvaplan-niva AS, 9296 Tromsø<br />
4 www.akvaplan.niva.no
1 Introduction<br />
1.1 Background<br />
RepsolExplor<strong>at</strong>ionNorway AS(RENAS)is planningthe Darwin explor<strong>at</strong>ion well, <strong>7218</strong>/<strong>11</strong>-1, (ED50<br />
UTM34N 8.001.215,E4<strong>11</strong>.870)in PL531.Thewell is loc<strong>at</strong>edapproxim<strong>at</strong>ely133nauticalmiles(246<br />
km) North Westof Hammerfestand177nauticalmiles(327km)North Westof Banakairport.<br />
Drilling<strong>at</strong> the well is plannedto be carriedout in in December2012.Duringthe planning, a needfor<br />
a detailed baseline<strong>survey</strong> to map spongedensitiesin the vicinity of the well loc<strong>at</strong>ion has been<br />
identified. Thepurposeof the Surveywasto identify potentialareasnearthe <strong>drilling</strong>loc<strong>at</strong>ionsuitable<br />
for depositingdrill cuttings..<br />
Figure1.Explor<strong>at</strong>ionWell<strong>7218</strong>/<strong>11</strong>-1 (Darwin) loc<strong>at</strong>ionin the BarentsSea(source:RENAS)<br />
Thew<strong>at</strong>er depth <strong>at</strong> the loc<strong>at</strong>ion is approxim<strong>at</strong>ely320 metres., and the w<strong>at</strong>er movementalongthe<br />
<strong>seabed</strong>during the previous <strong>survey</strong> periods and assessmentscarried out in 20<strong>11</strong> and 2012 (DNV<br />
20<strong>11</strong>a; 20<strong>11</strong>b,2012) indic<strong>at</strong>eda strongnorth-eastwarddirection.<br />
1.2 Summary of previous <strong>survey</strong> s <strong>at</strong> Darwin<br />
1.2.1 Baseline <strong>survey</strong> 20<strong>11</strong><br />
Duringthe baseline<strong>survey</strong><strong>at</strong> Darwin in 20<strong>11</strong>(DNV20<strong>11</strong>)areaswith high density areasof sponges<br />
wereidentified(text insertedfrom DNV20<strong>11</strong>a/b):<br />
“Darwin is regardedas a speciesrich habit<strong>at</strong> with 49 taxa of benthic mega fauna recorded. The<br />
<strong>seabed</strong><strong>at</strong> Darwinhadhighdensitiesof soft bottom sponges.Spongecoverin c<strong>at</strong>egory“high density”<br />
constituted<strong>11</strong>.8%of the benthichabit<strong>at</strong>. ThismakesDarwinthe most spongerich field in the 20<strong>11</strong><br />
<strong>survey</strong>.Figure2 (note: Figure5-14 in original report) showsthe distribution of sponges<strong>at</strong> Darwin.<br />
Therewere no recordingsof coralsor red-listed speciesduringthe <strong>visual</strong>monitoring.Squ<strong>at</strong>lobsters<br />
were the most abundantmobile macro fauna and occurredin high numbersbetween spongesand<br />
pebbles.Rel<strong>at</strong>ivelyfew echinodermspecieswereobservedcomparedto other fields."<br />
<strong>Detailed</strong> <strong>site</strong> <strong>survey</strong> <strong>at</strong> PL531 Darwin<br />
Akvaplan-niva AS Rapport 6051 - 1 5
Figure2. ROVtransectsandrecordsof spongesfound<strong>at</strong> Darwinduringthe baseline<strong>survey</strong>in 20<strong>11</strong>. Therel<strong>at</strong>ive<br />
amountsof the variousc<strong>at</strong>egoriesof spongedensitiesare shownin the pie chart.Sedimentsamplesweretaken<br />
<strong>at</strong> the red dots (axescrosses).TheSPUDloc<strong>at</strong>ion is markedwith a blue triangle (seearrow). Figurefrom DNV<br />
(20<strong>11</strong>).<br />
The baseline <strong>survey</strong> did not reveal the presenceof soft or hard corals <strong>at</strong> the Darwin field.<br />
Furthermore,no red-list specieswere identified. The specieswith the highestregistereddensities<br />
were the squ<strong>at</strong> lobster Munida spp. as well as spongespeciessuch as Geodia. Rel<strong>at</strong>ively high<br />
densitiesof soft bottom spongespecieswererecordedin the area, with 85.2%of the benthichabit<strong>at</strong><br />
containing "sc<strong>at</strong>tered" to "high densities"of sponges.Darwinhad the highestrecordingsof sponge<br />
densities,rel<strong>at</strong>iveto other nearbyfields<strong>survey</strong>edin 20<strong>11</strong>. (text modifiedfrom DNV20<strong>11</strong>).<br />
Qualit<strong>at</strong>iveabundanceclassesappliedby DNVare: 1. Singlespecimen/rare, 2. Sc<strong>at</strong>tered,3. Common<br />
and4. Highdensity.Illustr<strong>at</strong>ionsof thesedensityclassific<strong>at</strong>ionsare givenin Section2, M<strong>at</strong>erialsand<br />
methods.<br />
1.2.2 Additional studies 2012<br />
Basedon the resultsfrom the BaselineSurvey,duringthe planningof the well RENASaskedDNVto<br />
go deeperinto the d<strong>at</strong>a and try to identify areaswith low densityof spongeswere a CTSsolution<br />
could be deployedfor cuttingsdeposition.In addition SINTEFwas askedto model the spreadingof<br />
cuttingsby different cuttingshandlingsolutions.<br />
DNV(2012) summarizetheir findings:"Thescopeof work wasto assessthe distribution of deepsea<br />
sponges<strong>at</strong> Darwinby d<strong>at</strong>a interpol<strong>at</strong>ions.Byusingspongedensityd<strong>at</strong>a from the BarentsSea<strong>visual</strong><br />
<strong>survey</strong>20<strong>11</strong>, interpol<strong>at</strong>ed maps were made, showingcalcul<strong>at</strong>edvaluesof spongedensitiesin the<br />
<strong>drilling</strong> area.Backgroundd<strong>at</strong>a like spongedensitiesfrom other fields and sedimentsamplingd<strong>at</strong>a<br />
was included in the evalu<strong>at</strong>ion of the sponge situ<strong>at</strong>ion <strong>at</strong> the Darwin field". DNV have made<br />
recommend<strong>at</strong>ionsfor loc<strong>at</strong>ionsfor drill cutting depositionth<strong>at</strong> were estim<strong>at</strong>edto havethe lowest<br />
impacton the spongeassemblages .<br />
Akvaplan-niva AS, 9296 Tromsø<br />
6 www.akvaplan.niva.no
1.3 Aims and challenges for present <strong>survey</strong><br />
RENAScommissioneda new and more detailed <strong>visual</strong> sea bed <strong>survey</strong>in the vicinity of the SPUD<br />
loc<strong>at</strong>ion (ED50UTM34N 8.001.215,E 4<strong>11</strong>.870)for the well <strong>at</strong> Darwin (PL531). The <strong>survey</strong> was<br />
performed with parallel ROVlines 25 m apart, coveringa square of 800 times 800m within the<br />
coordin<strong>at</strong>es(ED50UTM34)E 4<strong>11</strong>.600to E 412.400,and N8.000.800 to N 8.001.600,around the<br />
plannedDarwin explor<strong>at</strong>ionwell, <strong>7218</strong>/<strong>11</strong>-1. The estim<strong>at</strong>edtotal <strong>survey</strong>distancefor the proposed<br />
programis28 km (15nm).<br />
Theprimaryaimsof the environmental<strong>survey</strong>,asgivenby RENASare:<br />
Map the presenceof spongesand other vulnerable specieson the sea bed around the<br />
planned spud loc<strong>at</strong>ion with a higher resolution than during the 20<strong>11</strong> <strong>visual</strong> <strong>survey</strong> (DNV<br />
20<strong>11</strong>).If possible,the extentof areaswith sponge aggreg<strong>at</strong>ionsis to be defined;<br />
Distinguishbetweensoft benthosandhardbenthosspeciesandcommunities;<br />
Identify asmuchaspossibleof the observedfaun<strong>at</strong>o specieslevel;<br />
Givea descriptionof the generalvulnerabilityof the area.<br />
Secondaryaims:<br />
Map areaaccordingto coverage,accordingto table in NS9435:2009,and identify speciesor<br />
subgroupsin the area;<br />
Adviseand report on suitable cuttings deposition <strong>site</strong>s for a CTSsolution basedon fauna<br />
observ<strong>at</strong>ions(spongedensities).<br />
RENASfurther specified:"The mappingshall have the highest sp<strong>at</strong>ial resolution closeto the well<br />
loc<strong>at</strong>ions(combin<strong>at</strong>ionof 20<strong>11</strong>and2012<strong>survey</strong>).Themappingshallfollow the proposedp<strong>at</strong>h, but it<br />
shall also take actual observ<strong>at</strong>ionsinto accountduring ROV<strong>survey</strong>ing.The onboard biologistsare<br />
responsiblefor the p<strong>at</strong>h optimiz<strong>at</strong>ion.<br />
The<strong>survey</strong> will be conductedwith an ROVth<strong>at</strong> asa minimum havea video camerawith sufficient<br />
lights and subseapositioningsystem.It is preferableto haveHDstill picture camerawith flashlight,<br />
HD video camera and laser for distance measurements(two laser beams with a set distance<br />
between). HD still and camerashould be connected. The <strong>survey</strong>log shall provide geo-referenced<br />
biologicalregistr<strong>at</strong>ions.".<br />
Note:in practiceit is not alwayspossibleto provideall thesespecific<strong>at</strong>ionsunderthe time restrictions<br />
whichapply, but theseshallbethe aim.<br />
<strong>Detailed</strong> <strong>site</strong> <strong>survey</strong> <strong>at</strong> PL531 Darwin<br />
Akvaplan-niva AS Rapport 6051 - 1 7
2 M<strong>at</strong>erials and methods<br />
2.1 Vessel and navig<strong>at</strong>ion<br />
Fieldworkwascarriedout usingthe Danish-registered85m vesselMS Njord Viking(Figure3). Total<br />
expedition period was from 17.08.2012 - 19.08.2012. Mobilis<strong>at</strong>ion and demobilis<strong>at</strong>ion was <strong>at</strong><br />
HammerfestPolarbase.<br />
Figure3. MSNjordViking.<br />
Vesselpositioningwascarriedout in cooper<strong>at</strong>ionbetweenthe ship'scaptainandthe <strong>survey</strong>orsfrom<br />
iSURVEYAS.<br />
2.2 ROV, video and still images<br />
A MAGNUM ® ROV(Remotely Oper<strong>at</strong>ed Vehicle) system was used, which is a side entry cage<br />
deployed,dual manipul<strong>at</strong>or 170hp heavy work classROV(Figure4 and Figure5). The systemis<br />
deliveredand oper<strong>at</strong>edby OceaneeringAS.Thecageor TetherManagementSystem(TMS)supplies<br />
an additional85hp,is capableof poweringskidsandalsohasthruster control andauto heading.The<br />
wincheswere equippedwith a heavecompens<strong>at</strong>iondevice.<br />
The videosystempre-installedon the MagnumROVwasused,andan additionalHighDefinition(HD)<br />
still camera (Imenco Tiger Shark)was installed. Two flashes were installed, but the angle was<br />
potentially not optimal becauseof the physicallimit<strong>at</strong>ions of the ROV-frame. A twin pair of Imenco<br />
line laserswereinstalledadjustedto 10 cmbetweenlines.<br />
Akvaplan-niva AS, 9296 Tromsø<br />
8 www.akvaplan.niva.no
Figure4. MagnumROVsystemunderdeploymentfrom NjordViking. Thebluecylinder<strong>at</strong> the baseof the ROVis<br />
the HDstill camera.PhotoSabineCochrane.<br />
Figure5. InstallingHDcameraon the Magnum ROV.Includedto give scaleto the figure above.PhotoSabine<br />
Cochrane.<br />
<strong>Detailed</strong> <strong>site</strong> <strong>survey</strong> <strong>at</strong> PL531 Darwin<br />
Akvaplan-niva AS Rapport 6051 - 1 9
2.3 Survey track and waypoints<br />
Theplannedwaypointswere providedby RENASandare givenin Table1.<br />
Table1. Design<strong>at</strong>edwaypointsfor the present<strong>survey</strong>.Positionsfrom RENAS.<br />
Easting Northing Easting Northing<br />
WP001 412400 8000800 WP034 412000 8001600<br />
WP002 412400 8001600 WP035 4<strong>11</strong>975 8001600<br />
WP003 412375 8001600 WP036 4<strong>11</strong>975 8000800<br />
WP004 412375 8000800 WP037 4<strong>11</strong>950 8000800<br />
WP005 412350 8000800 WP038 4<strong>11</strong>950 8001600<br />
WP006 412350 8001600 WP039 4<strong>11</strong>925 8001600<br />
WP007 412325 8001600 WP040 4<strong>11</strong>925 8000800<br />
WP008 412325 8000800 WP041 4<strong>11</strong>900 8000800<br />
WP009 412300 8000800 WP042 4<strong>11</strong>900 8001600<br />
WP010 412300 8001600 WP043 4<strong>11</strong>875 8001600<br />
WP0<strong>11</strong> 412275 8001600 WP044 4<strong>11</strong>875 8000800<br />
WP012 412275 8000800 WP045 4<strong>11</strong>850 8000800<br />
WP013 412250 8000800 WP046 4<strong>11</strong>850 8001600<br />
WP014 412250 8001600 WP047 4<strong>11</strong>825 8001600<br />
WP015 412225 8001600 WP048 4<strong>11</strong>825 8000800<br />
WP016 412225 8000800 WP049 4<strong>11</strong>800 8000800<br />
WP017 412200 8000800 WP050 4<strong>11</strong>800 8001600<br />
WP018 412200 8001600 WP051 4<strong>11</strong>775 8001600<br />
WP019 412175 8001600 WP052 4<strong>11</strong>775 8000800<br />
WP020 412175 8000800 WP053 4<strong>11</strong>750 8000800<br />
WP021 412150 8000800 WP054 4<strong>11</strong>750 8001600<br />
WP022 412150 8001600 WP055 4<strong>11</strong>725 8001600<br />
WP023 412125 8001600 WP056 4<strong>11</strong>725 8000800<br />
WP024 412125 8000800 WP057 4<strong>11</strong>700 8000800<br />
WP025 412100 8000800 WP058 4<strong>11</strong>700 8001600<br />
WP026 412100 8001600 WP059 4<strong>11</strong>675 8001600<br />
WP027 412075 8001600 WP060 4<strong>11</strong>675 8000800<br />
WP028 412075 8000800 WP061 4<strong>11</strong>650 8000800<br />
WP029 412050 8000800 WP062 4<strong>11</strong>650 8001600<br />
WP030 412050 8001600 WP063 4<strong>11</strong>625 8001600<br />
WP031 412025 8001600 WP064 4<strong>11</strong>625 8000800<br />
WP032 412025 8000800 WP065 4<strong>11</strong>600 8000800<br />
WP033 412000 8000800 WP066 4<strong>11</strong>600 8001600<br />
Theplanned<strong>survey</strong>trackisshownin Figure6.<br />
Akvaplan-niva AS, 9296 Tromsø<br />
10 www.akvaplan.niva.no
Figure6. Planned<strong>survey</strong>routefor detailed<strong>site</strong> <strong>survey</strong><strong>at</strong> Darwin,August2012.<br />
The<strong>survey</strong>grid comprised33 lines,eachof which is 800m in length.Thedistancebetweenthe lines<br />
is 25 m. The total length of the <strong>survey</strong> route (using a hypothetical straight line between the<br />
waypointsand includingthe transit between lines) was approxim<strong>at</strong>ely 27 200 m (26 400 m if only<br />
linesare included). All the abovewaypointswere used,althoughthe actualROVtrack variedslightly<br />
accordingto currentsand objects of biologicalinterest. Because currentswere reported to havea<br />
strongeasterlydirection,the directionof the maintracklineswasrot<strong>at</strong>ed 90 degrees.<br />
The ROVwas launchedon 18.08.2012<strong>at</strong> 13:53 local time (-2h for UTC),starting from the first<br />
waypoint <strong>at</strong> 14:41. The <strong>survey</strong> was completed on 19:08.2012 <strong>at</strong> 06:24 and ROVrecovery was<br />
completed <strong>at</strong> 06:47. Total video time was 17h 05m 06s, and total ROVdeploymenttime was the<br />
same(videopermanentlyon).<br />
2.4 Observ<strong>at</strong>ion logs and event logging<br />
2.4.1 Steps taken to address challenges<br />
Oneof the challengesof conducting biologicalanalysesfrom non-geo-referencedvideo and/or still<br />
photographsis the time-consumingwork of m<strong>at</strong>ching imagesor recorded 'events' to geographic<br />
positions.TheROVdive log recordsthe time of eachnote, or event taken,but the positionsneedto<br />
be m<strong>at</strong>chedwith the <strong>survey</strong>orlog.The<strong>survey</strong>orlog continuouslyrecordsthe ROVtrack,but doesnot<br />
containthe biologicalobserv<strong>at</strong>ions.<br />
<strong>Detailed</strong> <strong>site</strong> <strong>survey</strong> <strong>at</strong> PL531 Darwin<br />
Akvaplan-niva AS Rapport 6051 - 1 <strong>11</strong>
Akvaplan-niva haspreviouslyworked with iSURVEYto developa systemwhich allowsthe biological<br />
events (i.e. observ<strong>at</strong>ions)to be taken without havingto stop the <strong>survey</strong>orlogging.Usually,event<br />
recordingrequiresa 'fix' procedure,whichtakesapproxim<strong>at</strong>ely3 minutesto complete.Thiswould be<br />
too time-consumingfor all our biologicalobserv<strong>at</strong>ions,and would have forced us to restrict the<br />
number of geo-referencedobserv<strong>at</strong>ionsmade. The <strong>survey</strong>orson-board from iSURVEYproduceda<br />
customised recording system, which allowed biologists to click on a number of pre-defined<br />
c<strong>at</strong>egories,asbiologicalrecordingsweremade.<br />
2.4.2 Event logging<br />
In the ROVcontrol room, the biologistsweregivena PClinkedto the <strong>survey</strong>log,andcouldmakegeoreferencedobserv<strong>at</strong>ionsas<br />
event logs. A number of pre-defined c<strong>at</strong>egorieswere made, allowing<br />
rapidrecording.Additionalnotescouldbemadefor eachof these.<br />
o Sediment(absenceof recordingmeansonly mud andsmallerstoneswereobserved):<br />
Stone<br />
Stonewith growth<br />
Boulder<br />
Boulderwith growth<br />
o Fauna(alphabeticalorder,l<strong>at</strong>in namefirst, colloquialdescriptivecharacteristicgiven)<br />
Sponges<br />
Aplysilla (yellow)<br />
Candelabrum(string)<br />
Axinella(funnel)<br />
Farreaocca(bumpy)<br />
Geodia(pot<strong>at</strong>o)<br />
Hymedesmia(blue)<br />
Polymastia(dog'sball; with spikes)<br />
Stylochordyla(stalked)<br />
Otherfauna<br />
Ascidiacea(seasquirts)<br />
Annelida(worms)<br />
Anthozoa(seaanemonesandseapens)<br />
Bryozoa<br />
Crustacea<br />
o Decapoda(Crabs)<br />
o Decapoda(Hermitcrabs)<br />
o Gammaridae(smallshrimps)<br />
o Isopoda<br />
o Munida(Squ<strong>at</strong>lobster)<br />
o Pandalus(the commercialshrimp)<br />
Echinoderm<strong>at</strong>a<br />
o Asteroidae(starfish)<br />
o Holothuroidae(seacucumbers)<br />
o Ophiuroidae(brittle-stars)<br />
o (pillow-stars)<br />
Fish<br />
Mollusca(shells)<br />
o Otherobserv<strong>at</strong>ions<br />
Litter (objectsspecified)<br />
Macroalgae(recordedto showconnectionsbetweenthe shoreandthe offshore<br />
shelf)<br />
Akvaplan-niva AS, 9296 Tromsø<br />
12 www.akvaplan.niva.no
3 About sponges and challenges for assessment<br />
3.1 OSPAR habit<strong>at</strong> classific<strong>at</strong>ion of sponges<br />
Offshore sponges in the south-western Barents Sea are classified under the OSPAR habit<strong>at</strong><br />
descriptionas"DeepSeaspongeaggreg<strong>at</strong>ions". Thefollowingtext is modifiedfrom OSPAR(2005):<br />
Deepseaspongeaggreg<strong>at</strong>ionsare principallycomposedof spongesfrom two classes:Hexactinellida<br />
andDemospongia.Glasssponges(Hexactinellidae)tend to be the dominantgroupof spongesin the<br />
deep sea although demospongidssuch as Cladorhizaand Asbestoplumaare also present. The<br />
massivespongesth<strong>at</strong> domin<strong>at</strong>e some areas include Geodia barretti, G. macandrewi,and Isops<br />
phlegraei.Theycan occur<strong>at</strong> very high densities,particularlyon the slopein areaswhere substr<strong>at</strong>e<br />
and hydrographicconditionsare favourable.Surveym<strong>at</strong>erial from a spongefield in the northern<br />
North Seaand other loc<strong>at</strong>ionshad a comparablediversityanddensityof spongeswith tropical reefs<br />
(Konnecker,2002). The spongesalso influence the density and occurrenceof other speciesby<br />
providingshelterto smallepifauna,within the osculaand canalsystem,and an elev<strong>at</strong>ed perch,e.g.<br />
for brittlestars(Konnecker,2002).Deep-seaspongeshavesimilarhabit<strong>at</strong> preferencesto cold-w<strong>at</strong>er<br />
corals,and henceare often found <strong>at</strong> the sameloc<strong>at</strong>ion.Researchhasshownth<strong>at</strong> the densem<strong>at</strong>s of<br />
spiculespresent around spongefields may inhibit colonis<strong>at</strong>ionby infaunal animals,resulting in a<br />
dominanceof epifaunalelements(Gubbay,2002).Inform<strong>at</strong>ion indic<strong>at</strong>esth<strong>at</strong> dominant speciesare<br />
slow growingtaking severaldecadesto reachlargesize(Klitgaard& Tendal,2001).Thehabit<strong>at</strong> and<br />
the rich diverse associ<strong>at</strong>edfauna is therefore likely to take many years to recover if adversely<br />
affected(Konnecker,2002).<br />
Theyoccurbetweenw<strong>at</strong>er depthsof 250-1300m(Bett & Rice,1992),where the w<strong>at</strong>er temper<strong>at</strong>ure<br />
rangesfrom 4-10°Candthere is moder<strong>at</strong>e currentvelocity(0.5knots).Deep-seaspongeaggreg<strong>at</strong>ions<br />
may be found on soft substr<strong>at</strong>aor hard substr<strong>at</strong>a,suchas bouldersand cobbleswhich may lie on<br />
sediment.Icebergplough-mark zonesprovidean ideal habit<strong>at</strong> for spongesbecausestableboulders<br />
and cobbles,exposedon the <strong>seabed</strong>,providenumerous<strong>at</strong>tachment/settlementpoints(B.Bett, pers<br />
comm.). However,with 3.5kg of pure siliceousspiculem<strong>at</strong>erial per m 2 reported from some <strong>site</strong>s<br />
(Gubbay,2002),the occurrenceof spongefields canalter the characteristicsof surroundingmuddy<br />
sediments.Densitiesof occurrenceare hardto quantify,but spongesin the classHexactinellidahave<br />
been reported <strong>at</strong> densitiesof 4-5 per m², whilst ‘massive’growth forms of spongesfrom class<br />
Demospongiahavebeenreported <strong>at</strong> densitiesof 0.5-1 per m 2 (B.Bett,pers. comm.).<br />
3.2 Sponges in the south -western Barents Sea<br />
Spongesare found in most sea-floor (benthic)faunalassemblages,both on hard andsoft substr<strong>at</strong>es.<br />
In the south-westernpart of the BarentsSea(precisearea not specifiedhere),spongescompriseup<br />
to 57 % of the benthic biomass(Ereskovsky,1995).Slightlyfarther east,along the Murman coast,<br />
almost80%of the recordedbiomasswasdue to sponges(Propp,1971).Extremelyhigh densitiesof<br />
spongesalso have been recorded in the Tromsøflaketarea west of the Troms/Finnmarkarea in<br />
northern Norway(Figure7).<br />
<strong>Detailed</strong> <strong>site</strong> <strong>survey</strong> <strong>at</strong> PL531 Darwin<br />
Akvaplan-niva AS Rapport 6051 - 1 13
Figure7. Over4 tonnesof sponges(presumablyaccidentally)collectedin a trawl duringa researchexpeditionto<br />
the Tromsøflaket, northern Norway in 2007. Image: Norwegian Research Institute<br />
(http://www.imr.no/tokt/toktomtaler/ okosystemtoktet/toktdagbok_2007/dekket_fullt_av_svamp/nb -no).<br />
TheNorwegianseafloorand habit<strong>at</strong> mappingprogrammeMAREANOhascharacterizedspongebeds<br />
asa habit<strong>at</strong> on the Tromsøflaket(seewww.mareano.no– <strong>at</strong> time of writing, spongemap facility out<br />
of order on web<strong>site</strong>).Densespongeaggreg<strong>at</strong>ionsare knownglobally.Geodiaspongebedshavebeen<br />
well documentedalsoin the north-westernAtlantic(Canada;Figure8).<br />
Figure 8. Geodia sponge assemblagein the Northwest Atlantic. Image: Northwest Atlantic Fisheries<br />
Organis<strong>at</strong>ion).<br />
In European w<strong>at</strong>ers, <strong>at</strong>tention has been raised by OSPARto dense, habit<strong>at</strong>-forming sponge<br />
associ<strong>at</strong>ions(Figure9).<br />
Akvaplan-niva AS, 9296 Tromsø<br />
14 www.akvaplan.niva.no
Figure9. Generaldistribution of habit<strong>at</strong>-forming spongesin the NEAtlantic and NordicSeasas indic<strong>at</strong>edby<br />
recordsin the OSPAR[…]d<strong>at</strong>abase.Concentr<strong>at</strong>ionof spongesvaryconsiderablywithin theseareas.<br />
In the BarentsSea,spongec<strong>at</strong>chesin trawls(fisheriesandresearch)havebeennoted (Figure10). The<br />
following is an extract from OSPAR(2010). "The western Barents Sea is well known for mass<br />
occurrencesof spongesfrom numerousscientificand fishermen sources(reviewedby Klitgaard&<br />
Tendal2004).Between150and 350m depth,spongesof up to 1 m diameterandcontributingup to<br />
95-98 %of the localtotal biomasssamplesand up to 5-6 kg*m-2 were found to occuron sandyand<br />
sandy-silty bottom with good w<strong>at</strong>er movement. The speciescomposition correspondsto the<br />
“Atlantic“ band group as describedby Klitgaardand Tendal(2004,seeabove)and includesGeodia<br />
barretti, G.macandrewi,Geodia(former Isops)phlegraei,I. pyriformes, andother species."<br />
<strong>Detailed</strong> <strong>site</strong> <strong>survey</strong> <strong>at</strong> PL531 Darwin<br />
Akvaplan-niva AS Rapport 6051 - 1 15
Figure10. BarentsSea.Spongebyc<strong>at</strong>chin researchbottom trawling 1982-97 superimposedon fishing<br />
effort 2004(asdensityof VMSd<strong>at</strong>a points,NorwayMin. Env.2005-2006).Redstar indic<strong>at</strong>esthe approxim<strong>at</strong>e<br />
positionof Salina, JuksaandDarwin.<br />
3.3 About sponges in general<br />
Spongesare filter-feeders,and therefore act asa direct link betweenthe w<strong>at</strong>er columnand benthic<br />
fauna. Most feed on m<strong>at</strong>ter dissolvedor suspendedin the w<strong>at</strong>er column, suchas diverseorganic<br />
m<strong>at</strong>erial, algae and bacteria. Their an<strong>at</strong>omy varies from small, simple forms to large complex<br />
structures,but essentiallythe bodyhasone or severalchambersthroughwhichw<strong>at</strong>er is pumped.<br />
Becausespongesare sessile,and they dependon w<strong>at</strong>er flow, they are reputed to be sensitiveto<br />
sediment<strong>at</strong>ion.However,d<strong>at</strong>a basedon experimentalstudiesare spares,and as a result, ongoing<br />
studies in Norway (Akvaplan-niva, IRIS,Institute of Marine Research)and intern<strong>at</strong>ionally, are<br />
addressingsensitivity of spongesto various discharges. This note will not addressthe issue of<br />
sensitivity,but will focuson distribution recordsandchallengesrel<strong>at</strong>ingto assessingdensity.<br />
Akvaplan-niva AS, 9296 Tromsø<br />
16 www.akvaplan.niva.no
Figure <strong>11</strong>. General structure of a hypothetical sponge. Figure from University of Berkeley<br />
(http://www.ucmp.berkeley.edu/porifera/poriferamm.html ).<br />
Insidethe spongeis a densem<strong>at</strong>rix of spicules,whichform a skeletonto allow the animalto retain its<br />
shape (Figure 12). Thesespiculesare of siliceousand/or calcareousm<strong>at</strong>erial, dependingon the<br />
group.<br />
Figure 12. Scanning electron microscope (SEM) image of sponge spicules. Image from<br />
http://www.ucmp.berkeley.edu/porifera/porskel.html.<br />
Sponges,like many large sessile (non-moving) organisms,act as habit<strong>at</strong> for other organisms.<br />
Individualspongescan give shelter to for examplesmallcrustaceansand bristleworms(Figure13).<br />
<strong>Detailed</strong> <strong>site</strong> <strong>survey</strong> <strong>at</strong> PL531 Darwin<br />
Akvaplan-niva AS Rapport 6051 - 1 17
Somespongesform densereefs,and providehabit<strong>at</strong> for a wide rangeof organisms,in a similarway<br />
to coralreefs(seeBuhl-Mortensenet al.2010).<br />
Figure13. Left: unidentifiedspongefrom the deep-w<strong>at</strong>er licenseBønna,home to a popul<strong>at</strong>ion of gammarid<br />
crustaceansand Right: a Geodia colony, offering substr<strong>at</strong>e and shelter for other organisms.Photo left:<br />
Akvaplan-niva/Oceaneering/Eni right: Illustr<strong>at</strong>ionphotograph,unknownloc<strong>at</strong>ion.<br />
All spongesgive habit<strong>at</strong> to other organisms,but the ecosystemimplic<strong>at</strong>ionsvary with scale.Small,<br />
individualspongecoloniesare hometo mainlysmallinvertebr<strong>at</strong>esand bacteria,whereaslargereefformingspongescanoffer<br />
protection alsoto largerinvertebr<strong>at</strong>esandfish.<br />
3.4 Red-listed sponges<br />
The Norwegianred-list for species(Artsd<strong>at</strong>abanken,2010) lists one sponge,Geodiasimplicissima<br />
underc<strong>at</strong>egoryDD(d<strong>at</strong>adeficient).Listedin termsof countiesin Norway,there are no spongeslisted<br />
asbeingthre<strong>at</strong>enedor in declinein northern Norway(Table2).<br />
Table2. Extractfrom Table8 in Kålåset al., 2010.Countydistribution of the numberof thre<strong>at</strong>enedand near<br />
thre<strong>at</strong>ened speciesbased on d<strong>at</strong>a from the Rødlisted<strong>at</strong>abase,and concernsknown current occurrencesor<br />
assumedcurrentoccurrencesbasedon earlierobserv<strong>at</strong>ions.<br />
Akvaplan-niva AS, 9296 Tromsø<br />
18 www.akvaplan.niva.no
Geodia belongs within the Demospongiae, and is an extremely species-rich genus (see<br />
http://www.marinespecies.org/aphia.php?p= taxdetails&id=132005). Differences between species<br />
generallylie in the finer detailsof the skeleton,or spicules,and therefore these usuallycannot be<br />
identified with certainty from pictures or videos.Geodiasimplicissimais regardedas a speciesof<br />
uncertain st<strong>at</strong>us. The following is an extract from the Intern<strong>at</strong>ional Marine SpeciesIdentific<strong>at</strong>ion<br />
Portalhttp://species-identific<strong>at</strong>ion.org/species.php?species_group=s ponges&id=234)<br />
SpeciesOverview<br />
GeodiasimplicissmaBurton (1931)is known only from a few fragmentsfrom Northern Norway.The<br />
differencewith the more commonG.barretti and G.cydoniumis microscopical:it hasan ectosomal<br />
palisadeof smalloxeaslyingperipheralto the crustof sterrasters.<br />
TaxonomicDescription<br />
Colour: Unknown.<br />
Shape,size,surfaceand consistency: Knownonly from a few fragments,so no detailsof the habit<br />
areknown.<br />
Spicules: Megascleres: Huge oxeas:2200 x 32 µm; "microxeas"(= cortical oxeas):250 x 4 µm;<br />
orthotriaenes:shaft1700x 48 µm, cladi320µm; a singlean<strong>at</strong>riaenewith cladiof 150µm wasfound.<br />
Microscleres: Sterrasters,spherical:70 µm; pycnasters:4 µm.<br />
Skeleton: (Geodiasimplicissimaskel) Ectosomal: a palisadeof microxeasis erectedon the sterraster<br />
layer, which in its turn is carriedby the cladi of the orthotriaenes.Choanosomal : radial bundlesof<br />
oxeasandorthotriaenes.<br />
Ecology: In fjords,10-75 m.<br />
Distribution: NorthernNorway.<br />
Etymology: The name presumably refers to the rel<strong>at</strong>ively simple spicule complement.<br />
Typespecimeninform<strong>at</strong>ion: Thetype is in the N<strong>at</strong>uralHistoryMuseum,London:BMNH1913.6.1.36.<br />
Remarks<br />
Thedescriptionis uns<strong>at</strong>isfactoryandthe specificdistinctnessisdoubtful.<br />
3.5 Sponges as ecosystem engineers<br />
Sponges,corals and also sea-pens have long been acknowledgedfor their role as autogenic<br />
(individual-based) ecosystemengineers (Miller et al., 2012 and numerous references therein).<br />
Ecosystem engineersprovide living spacefor other organisms(Figure14), or they may alter the<br />
physicalpropertiesof the immedi<strong>at</strong>ehabit<strong>at</strong> (in the caseof sponges,they filter large quantities of<br />
w<strong>at</strong>er daily, and provide small-scale shelter from bottom currents). Thus they can alter the<br />
biodiversityin areaswhichthey occupy,andhavea role in influencingsea-floor ecosystemfunction.<br />
ThelargeGeodiasponges,andalsoother unidentifiedbranchingforms,in the south-westernBarents<br />
Seaevidentlyprovidehabit<strong>at</strong> for organismssuchassqu<strong>at</strong> lobsters.Thesecanbe seenin burrows<strong>at</strong><br />
the baseof the sponge,with clawsextended.Alsoother invertebr<strong>at</strong>esareexpectedto takeshelterin<br />
this way. During filming, fish were frequently seen to feed from the bases of the sponges<br />
(presumablypreying on the resident invertebr<strong>at</strong>es),but they seldom did damageto the actual<br />
sponges.However,occasionally,fish were seento "accidentally"bite off a chunkof a sponge,and<br />
then l<strong>at</strong>er ejectit from their mouths.Personalobserv<strong>at</strong>ions,S.Cochrane.<br />
<strong>Detailed</strong> <strong>site</strong> <strong>survey</strong> <strong>at</strong> PL531 Darwin<br />
Akvaplan-niva AS Rapport 6051 - 1 19
Figure14. Photosfrom Mercier(2012)showing(left) a sea-penfield and (right) developinglarvaeof the redfish<br />
Sebastestuckedamong the polypsof the seapens.Sizeof the seapensis not given,but the scalebarson the<br />
right are both 1 mm.<br />
The ecologicalrole of sponges,and their responsesto environmentalconditionsare to someextent<br />
documentedfor shallow-w<strong>at</strong>ers (seefor exampleBell & Smith,2004),we have few studieswhich<br />
clarify the role of coralsand spongesas autogenic engineersin deeperw<strong>at</strong>er (Miller et al., 2012).<br />
Thoseauthors further st<strong>at</strong>e"[…]nevertheless,many fishes and macroinvertebr<strong>at</strong>esinhabit deepw<strong>at</strong>er<br />
coral (Rogers,1999, Husebøoet al., 2002, Mortensen & Buhl Mortensen, 2005 and Stone,<br />
2006) and sponge(Beulieu,2001, Marliave et al., 2009) habit<strong>at</strong>s. Unlike shallow-w<strong>at</strong>er systems,<br />
where the processesconnectinghabit<strong>at</strong> with popul<strong>at</strong>ionsand communitiesof dependantorganisms<br />
are rel<strong>at</strong>ively well understood,the role of habit<strong>at</strong> structure, includingth<strong>at</strong> of autogenicecosystem<br />
engineers,in deep-w<strong>at</strong>er communitiesis still uncleardue to lack of small-scaleobserv<strong>at</strong>ionaland<br />
experimentalstudies(Auster,2007).<br />
Obviously,the role of spongesas ecosystemengineersis a question of scale.At a small scale,an<br />
individual spongeprovides a habit<strong>at</strong> for a range of other organisms,but to be significant<strong>at</strong> an<br />
ecosystemscalerequiresth<strong>at</strong> large areasand/or large amountsof spongesare involved. Thisbegs<br />
the question to which we have no clear answer – how many sponges, or how large an area<br />
constitutes a resource of ecosystemsignificance?Further, how can we then assessissuesof<br />
vulnerabilityto humanactivities,or conserv<strong>at</strong>ionst<strong>at</strong>us.<br />
The UK Biodiversity Action plan (http://jncc.defra.gov.uk/pdf/UKBAP_BAPHabit<strong>at</strong>s -12-<br />
DeepSeaSpongeComms.pdf ) contains some interesting remarks, about sponge abundances,<br />
extractedfrom OSPAR(2008). "Densitiesof occurrenceare hard to quantify,but spongesin the class<br />
Hexactinellidahave been reported <strong>at</strong> densities of 4-5 per m², whilst ‘massive’growth forms of<br />
spongesfrom classDemospongiahave been reported <strong>at</strong> densitiesof 0.5-1 per m 2 (B. Bett, pers.<br />
comm.)." In this context,we canassumeth<strong>at</strong> "massivegrowth forms" meanslargeindividuals,such<br />
asthe Geodiaspecimensin the BarentsSea, whichcanmeasure30-40 cm andmorein diameter.<br />
Akvaplan-niva AS, 9296 Tromsø<br />
20 www.akvaplan.niva.no
4 Abundance quantific<strong>at</strong>ion challenges - case study<br />
Salina, Juksa and Darwin<br />
4.1 General<br />
Not only are spongesdifficult to identify, but they alsoare difficult to quantify from the type of d<strong>at</strong>a<br />
usuallycarriedout in connectionwith pre-<strong>drilling</strong> <strong>survey</strong>s.TheCENstandard(CENprEN16260)for<br />
<strong>visual</strong>assessmentsgivesguidanceon an abundancescale,but this requires knowledgeof numbersof<br />
spongesper unit area.During<strong>visual</strong><strong>survey</strong>s,it is not alwayspossibleto uselaserbeamsduringall of<br />
the filming,andalsothe flight heightoften dependson individualconditions.Becausespongesin the<br />
south-westernpart of the BarentsSeaoften are veryp<strong>at</strong>chilydistributed,estim<strong>at</strong>inga standardarea<br />
(m2)from a smaller(or larger)areausuallyisnot represent<strong>at</strong>iveof the realsitu<strong>at</strong>ion.<br />
During<strong>visual</strong>assessmentscarriedout during 2008,a 4-level abundancescalewas devisedby DNV,<br />
basedon minimum to maximumspongedensitiesrepresent<strong>at</strong>ivefor the RegionIX area. Thisscale<br />
alsowasused<strong>at</strong> Salinain 2010(Akvaplan-niva)andJuksaandDarwinin 20<strong>11</strong>(DNV).<br />
Figure15. Abundancescaledefinedby DNV,2008.Upperleft rare,upperright, sc<strong>at</strong>tered,lowerleft, regularand<br />
lowerright, highdensity.<br />
At Salina,six of the imagesselectedfor detailed faunal analyseswere classifiedas havinga high<br />
densityof sponges,accordingto the abovescheme(Figure16).<br />
<strong>Detailed</strong> <strong>site</strong> <strong>survey</strong> <strong>at</strong> PL531 Darwin<br />
Akvaplan-niva AS Rapport 6051 - 1 21
Figure16. Imagefrom Salina,2010,classifiedashavinga high densityof sponges.Thegeneralseafloorpicture<br />
issimilaralsofor both DarwinandJuksa.<br />
When comparingimages,it is clear th<strong>at</strong> scaleplaysa very large part in how rel<strong>at</strong>ive abundanceis<br />
perceived(comparelower two imagesin Figure15 with Figure16). Subjectively,the round Geodia<br />
(?barretti) spongesare estim<strong>at</strong>ed to have a maximum diameter of around 10 cm, but without<br />
consistentlaserscale,we cannotsayfor certain.If the imageabovehadbeentaken<strong>at</strong> a lower zoom<br />
(or higher flight distance),it might havebeen difficult to distinguishbetween "regular abundance"<br />
and"high abundance".<br />
Anothersourceof biasis th<strong>at</strong> there hasbeenno <strong>at</strong>tempt to comparedensitiesreportedby trawl (see<br />
Figure7) with imagesfrom the south-westernpart of the BarentsSea. Intuitively, the phrase'high<br />
density' conjuresimagesof tonnes of sponges(capturedalong an entire trawl route), whereasthe<br />
reality in termsof individualcoloniesper m 2 (or km 2 ) is quite different.<br />
The baseline<strong>survey</strong>scarried out <strong>at</strong> the three fields were not intended to provide a quantit<strong>at</strong>ive<br />
assessmentof sponges,andthereforethe abundancescalesare only of useto comparebetweenthe<br />
five planned <strong>drilling</strong> <strong>site</strong>s documented. Subjectiveabundancescalesalso are notoriously userspecific,and<br />
so it also is not guaranteedth<strong>at</strong> another user would have classedthese imagesin<br />
exactlythe sameway(seealsoour methodologicalexperiencesoutlinedin Section4.2).<br />
4.2 Current approach es – assessing coverage<br />
DuringJuly,2012,CochraneandGeraudiefrom Akvaplan-niva conductedsimilar<strong>site</strong> assessments<strong>at</strong><br />
the nearbyfields Salina(PL533) and Juksa(PL490). Theneed for thesemissionsarose<strong>at</strong> very short<br />
notice,andwe <strong>at</strong>tempted to devisea methodologybasedon practicalpossibility,but asobjective as<br />
possible, and with reference to the intern<strong>at</strong>ional Europeanstandard for <strong>visual</strong> assessmentsof<br />
biodiversity(CENFprEN16260). Coverageof organismsis recommendedto be recordedin terms of<br />
numbersof individuals/coloniesper m 2 , or %coverfor encrustingorganisms(Table3).<br />
Akvaplan-niva AS, 9296 Tromsø<br />
22 www.akvaplan.niva.no
Table3. Extractfrom EuropeanstandardCEN/TC230/WG2/TG7"W<strong>at</strong>er quality— Visual<strong>seabed</strong><strong>survey</strong>susing<br />
remotelyoper<strong>at</strong>edandtowedobserv<strong>at</strong>iongearfor collectionof environmental d<strong>at</strong>a".<br />
The ideal would be to record numbersof spongesper unit area of <strong>seabed</strong>,but this is simply not<br />
possiblewhile the ROVis in motion. Further,unlessthe ROVis set <strong>at</strong> an altimeter andwith standard<br />
pitch androll, suchquantific<strong>at</strong>ionsare difficult. Thereasonwe chosenot to use'fixed' navig<strong>at</strong>ionfor<br />
the ROVis the <strong>survey</strong> programmerequestedth<strong>at</strong> objectsof biologicalinterest are filmed, and this<br />
requireszoomingin or out asappropri<strong>at</strong>e.<br />
Giventhe short mobilis<strong>at</strong>iontime, we constructeda makeshiftsystemto <strong>visual</strong>iseour recordingsin<br />
termsof %coverof sponges(i.e.how muchof the unit of seafloorobservediscoveredby sponges).If<br />
the actualvaluesturned out to be "wrong", we reasonedth<strong>at</strong> we couldadjust them l<strong>at</strong>er; the main<br />
point wasobjectivityandconsistencybetweenthe different observers.Ourfirst improvisedsystemis<br />
shownin Figure17.<br />
Figure17. Improvisedconceptual<strong>visual</strong>is<strong>at</strong>ionof spongecoverage,usedin July,2012<br />
<strong>Detailed</strong> <strong>site</strong> <strong>survey</strong> <strong>at</strong> PL531 Darwin<br />
Akvaplan-niva AS Rapport 6051 - 1 23
It is clear th<strong>at</strong> Cochraneadopted a "biologicallyintuitive" approach,the reasoningbeing th<strong>at</strong> since<br />
spongesare round or irregularlyshaped,even<strong>at</strong> maximalcoverage,there still will be someareasof<br />
sedimentvisible.Duringmobilis<strong>at</strong>ionfor the current <strong>survey</strong><strong>at</strong> Darwin,to two different Akvaplan-niva<br />
observers,Palerudand Hansenconductedthe <strong>survey</strong>. In the interveningtime between<strong>survey</strong>s,we<br />
were ableto givethe m<strong>at</strong>ter considerablygre<strong>at</strong>er<strong>at</strong>tention. Duringefforts to standardiserecording<br />
str<strong>at</strong>egies, they adopted a more precise "m<strong>at</strong>hem<strong>at</strong>ical" approach. A guidance scheme was<br />
developed,andthe precise%coverof spongerel<strong>at</strong>iveto sedimentwasrecordedandprinted out asa<br />
templ<strong>at</strong>e. It is clear th<strong>at</strong> the schemeabovegivesfar higher % cover figures than the m<strong>at</strong>hem<strong>at</strong>ical<br />
approach.<br />
Figure18. M<strong>at</strong>hem<strong>at</strong>icallycalcul<strong>at</strong>ed%coverschemeadoptedby Palerudand Hansenduringthe present<strong>visual</strong><br />
<strong>survey</strong><strong>at</strong> Darwin,August,2012.<br />
Bell& Smith(2004)adopteda m<strong>at</strong>hem<strong>at</strong>icalcoveragesystemto quantify spongesfrom still images<br />
of sponges. Theyprojectedthe photographsonto a grid of 400dots,andcountedthe numberof dots<br />
which landed on a sponge,and from this calcul<strong>at</strong>eda % cover figure. Thisis comp<strong>at</strong>iblewith the<br />
current approach, but in-situ <strong>visual</strong> <strong>survey</strong>spresent the challengeth<strong>at</strong> the oper<strong>at</strong>ors must make<br />
continual, qualit<strong>at</strong>ive decisionson estim<strong>at</strong>ed % cover. There is a clear potential optical illusion –<br />
actual23%coverasshownaboveintuitively seemsdenser.Trainingis required to ensureconsistent<br />
recordings.<br />
Wh<strong>at</strong>everthe classific<strong>at</strong>ionmethod used,it alsois veryclearth<strong>at</strong> we facean urgentchallenge– how<br />
to classifyspongedensitieswith correctmeaning?Thephrase5 %covertendsto provokereactions<br />
of – "th<strong>at</strong>'s not much", whereas<strong>at</strong> the samedensity,a trawl might pick up more than one tonne of<br />
spongesin a singlehaul. If another observeris more 'intuitively' biased,th<strong>at</strong> samedensitymight be<br />
reported<strong>at</strong> higherclassific<strong>at</strong>ions.<br />
We recommenda standardis<strong>at</strong>ionof approachesbetweenoper<strong>at</strong>ors<strong>at</strong> leastin Norway,to makesure<br />
we observeandreport in a similarmanner.Fromthis starting-point, we needfurther studyto be able<br />
to transl<strong>at</strong>e%coverinto vulnerabilityandprotectionst<strong>at</strong>us<strong>at</strong> an ecosystemscale.<br />
Forthe currentassessment,we placeemphasison the following:<br />
Visualimagesof spongeassemblages, to illustr<strong>at</strong>ethe variousabundancec<strong>at</strong>egories;<br />
Holistic and integr<strong>at</strong>ed assessmentof the impacts of <strong>drilling</strong> mud/cuttings on the<br />
environment<br />
o on the sea floor, but also other impacts of the rel<strong>at</strong>ed pressuressuch as energy<br />
consumption(emissionsto air);<br />
o interpret<strong>at</strong>ion of environmentalcostsandbenefitsof variousdischargescenarios.<br />
Assessmentof overallvulnerabilityandsensitivity– canwe answerthe necessary questions?<br />
Akvaplan-niva AS, 9296 Tromsø<br />
24 www.akvaplan.niva.no
5 Results and discussion<br />
5.1 General observ<strong>at</strong>ions<br />
A total of 1950observ<strong>at</strong>ionswere made,and recordedasevent fixeson the <strong>survey</strong>log. Thesewere<br />
distributedwithin c<strong>at</strong>egoriesasgivenin Section2.4.2.<br />
RecordedROVdepths variedfrom approxim<strong>at</strong>ely310 – 335 m (Figure19). Someminor troughsand<br />
depressionsare evident in the central to upper part of the <strong>survey</strong>area, notably also closeto the<br />
SPUDloc<strong>at</strong>ion. We estim<strong>at</strong>ethe ROVflying height to be between 1-2 m abovethe seafloor, such<br />
th<strong>at</strong> the actual w<strong>at</strong>er depths should be adjustedaccordingly.Despitethis, the chart givesa good<br />
represent<strong>at</strong>ionof the rel<strong>at</strong>ivevari<strong>at</strong>ionin bottom topographyacrossthe studyarea.<br />
Figure19. Visualrepresent<strong>at</strong>ionof depthsrecordedduring the <strong>survey</strong>,basedon the <strong>survey</strong>log. Theplanned<br />
<strong>drilling</strong>loc<strong>at</strong>ion<strong>at</strong> Darwinisshownby a yellowstar.<br />
<strong>Detailed</strong> <strong>site</strong> <strong>survey</strong> <strong>at</strong> PL531 Darwin<br />
Akvaplan-niva AS Rapport 6051 - 1 25
5.2 Seafloor conditions<br />
5.2.1 Sediment composition<br />
Thesediment<strong>at</strong> Darwingenerallycomprisedmud, with occasionalsc<strong>at</strong>teredstonesand smallrocks<br />
on the surface(Figure20).<br />
Figure20. Illustr<strong>at</strong>ive imagesshowingtypical sedimentconditions<strong>at</strong> the Darwin field, August,2012.Photos:<br />
OceaneeringAS.<br />
5.2.2 Litter and other human impacts<br />
Twoobserv<strong>at</strong>ionsof litter were made(Figure21 andpossiblyalsoFigure39).<br />
Figure21. Observ<strong>at</strong>ionof marinelitter. Pieceof shapedmetalof unknownorigin.<br />
Akvaplan-niva AS, 9296 Tromsø<br />
26 www.akvaplan.niva.no
5.2.3 Seashore algae and fishfalls<br />
Theoffshoreenvironmentoften is perceivedto be a barrenenvironment,remotefrom the processes<br />
which occur alongthe coast.However,often we find rel<strong>at</strong>ively fresh piecesof seaweedorigin<strong>at</strong>ing<br />
from the shore, andthis indic<strong>at</strong>esa dynamictransport p<strong>at</strong>hwayfrom the coastto the offshorestudy<br />
areas.<br />
Onlyoneobserv<strong>at</strong>ionof macroalgaewasmade(position4<strong>11</strong>675.2/ 8000871; not photographed).<br />
5.3 Distribution maps and selected images<br />
5.3.1 General overview<br />
During the ROV<strong>survey</strong>1366 pictures were taken of the sea bottom. The bottom generallyhad a<br />
smooth surfaceand the depth varied from appr. 310 – 335 m. Thedepth vari<strong>at</strong>ionswere affecting<br />
the angleof the ROVusingduringthe <strong>survey</strong>,resultingin a vari<strong>at</strong>ionof angledpictures.Asa result,it<br />
is difficult to make accur<strong>at</strong>ecalcul<strong>at</strong>ionsof the area of sediment present in each picture. A laser<br />
beam is showinga distanceof 10 cm between the lines, but also the length of the beam varies<br />
accordingto the angleof the ROV.<br />
Further, during periods where fish shoalsare abundantnear the seafloor (from around 4 am and<br />
towardsafternoon),the lights on the ROV<strong>at</strong>tracted largeamountsof curiousfish duringthe <strong>survey</strong>,<br />
mainly coalfish (Pollachiusvirens). Thesemadefilming of spongesdifficult becausethey stir up the<br />
sedimentsurface.<br />
<strong>Detailed</strong> <strong>site</strong> <strong>survey</strong> <strong>at</strong> PL531 Darwin<br />
Akvaplan-niva AS Rapport 6051 - 1 27
5.3.2 Plots of sponge distribution and density<br />
We haveadopted two methods for presentingobserv<strong>at</strong>ionsof spongedensities.First, a 'dot-map'<br />
showingthe actualobserv<strong>at</strong>ionsmadealongthe ROVtrack (Figure22). Becausethis canbe <strong>visual</strong>ly<br />
difficult to interpret, we alsopresentdistribution maps,where the distribution of spongedensities<br />
areinterpol<strong>at</strong>edin-betweenthe actualobserv<strong>at</strong>ionpoints,usingthe SURFERprogramme(Figure23).<br />
Estim<strong>at</strong>edspongedensities(%of sedimentsurfaceoccupiedby sponge)rangedfrom 0 %to 15-25 %,<br />
andgenerallyweredistributedall overthe <strong>survey</strong>area.<br />
Figure22. Visualobserv<strong>at</strong>ionsof estim<strong>at</strong>edspongedensities,Darwin,August2012<br />
Akvaplan-niva AS, 9296 Tromsø<br />
28 www.akvaplan.niva.no
Figure23. Map illustr<strong>at</strong>ing the densityestim<strong>at</strong>ion(%coveragesponges)on the sedimentsurface.Seemethods<br />
sectionfor quantific<strong>at</strong>ionmethod.Blackcrossesindic<strong>at</strong>eobserv<strong>at</strong>ions;d<strong>at</strong>a are interpol<strong>at</strong>edbetweenpointsby<br />
the krigingmethodin SURFERprogramme.<br />
Basedon Figure23, a total of 30 positionswere selectedfor a more detailed analysisof biological<br />
conditions (Figure 24). Thesewere placed in areasrepresent<strong>at</strong>iveof the various spongedensity<br />
assessments,andserveto 'ground-truth' the <strong>visual</strong>assessmentsmadeduringthe field mission.<br />
<strong>Detailed</strong> <strong>site</strong> <strong>survey</strong> <strong>at</strong> PL531 Darwin<br />
Akvaplan-niva AS Rapport 6051 - 1 29
Figure24. Loc<strong>at</strong>ionof the 30 imagesselected for further analysis.<br />
Theselectedimagesareshownin Figure25 to Figure29.<br />
Akvaplan-niva AS, 9296 Tromsø<br />
30 www.akvaplan.niva.no
Position2. 0-1 % coverage Position3. 0-1 % coverage.Geodia Position4. 0-1 % coverage<br />
Position5. 0-1 % coverage Position8. 0-1 % coverage.GeodiaandAplysilla Position10.0-1 % coverage.Geodia<br />
Figure25. Photosfrom selectedpositions,illustr<strong>at</strong>ingthe c<strong>at</strong>egory0-1 %coverage.Darwinfield,August2012.<br />
<strong>Detailed</strong> <strong>site</strong> <strong>survey</strong> <strong>at</strong> PL531 Darwin<br />
Akvaplan-niva AS Rapport 6051 - 1 31
Position16. 0-1 % coverage Position 18. 0-1 % coverage Position 20. 0-1 % coverage<br />
Position25. 0-1 % coverage Position 27. 0-1 % coverage.GeodiaandAplysilla Position 9. 0-1 % coverage.GeodiaandAplysilla<br />
Figure26. Photosfrom selectedpositionswith 0-1 %coverageof sponges<strong>at</strong> Darwinaugust2012.Theseimagestakenearlymorning,whenfishbecameabundant.<br />
Akvaplan-niva AS, 9296 Tromsø<br />
32 www.akvaplan.niva.no
Position1. 1-5 % coverage.GeodiaandAplysilla Position 6. 1-5 % coverage.GeodiaandAplysilla Position 7. 1-5 % coverage.GeodiaandAplysilla<br />
Position <strong>11</strong>. 1-5 % coverage. Aplysilla, Farrea, Geodia, Position 12. 1-5 % coverage.GeodiaandAplysilla Position 14. 1-5 % coverage.Geodia,Aplysilla andFarrea<br />
HymedesmiandPolymastia<br />
Figure27. Photosfrom selectedpositions(seemapin figurex) with 1-5 %coverageof sponges<strong>at</strong> Darwinaugust2012.<br />
<strong>Detailed</strong> <strong>site</strong> <strong>survey</strong> <strong>at</strong> PL531 Darwin<br />
Akvaplan-niva AS Rapport 6051 - 1 33
Position15. 1-5 % coverage.GeodiaandAplysilla Position 19. 1-5 % coverage.GeodiaandAplysilla Position 24. 1-5 % coverage.GeodiaandAplysilla<br />
Position26. 1-5 % coverage.Geodiaand?Mycale. Position29. 1-5 % coverage.Geodia,Aplysilla andFarrea Position13. 1-5 % coverage.GeodiaandAplysilla<br />
Figure28. Photosfrom selectedpositionswith 1-5 %coverageof sponges<strong>at</strong> DarwinAugust2012.<br />
Akvaplan-niva AS, 9296 Tromsø<br />
34 www.akvaplan.niva.no
Position 17. 5-10 % coverage.Geodia, Aplysilla and<br />
Farrea<br />
Position 22. 5-10 % coverage.Geodia, Aplysilla and<br />
Farrea<br />
Position 30. 5-10 % coverage.Aplysilla, Farrea, Geodia, Position 21. 5-10 % coverage.Geodia, Aplysilla and<br />
Hymedesmi andPolymastia<br />
Farrea<br />
Figure29. Photosfrom selected positions with 5-10 %coverageof sponges<strong>at</strong> Darwinaugust2012.<br />
<strong>Detailed</strong> <strong>site</strong> <strong>survey</strong> <strong>at</strong> PL531 Darwin<br />
Akvaplan-niva AS Rapport 6051 - 1 35<br />
Position 23. 5-10 % coverage.Geodia, Aplysilla, Mycale<br />
Position 28. 5-10 % coverage.Farrea
5.3.3 Overall assessment of sponge densities <strong>at</strong> the Darwin <strong>site</strong><br />
Figure30 showsthe proportion of the variousspongedensitiesencounteredacrossthe <strong>survey</strong>area.<br />
Most of the areawasclassedashaving1-5 %coverof sponges,with similarproportionsof areaswith<br />
practically0 %sponges(seefiguretext) and5-10 %coverage.<br />
Figure30. Visual represent<strong>at</strong>ionof frequenciesof spongeabundanceclassesacrossthe study area. Upper:<br />
histogram showingactual numbersof observ<strong>at</strong>ionsand lower: pie chart expressingrel<strong>at</strong>ive frequenciesas<br />
percentages.Note th<strong>at</strong> 0 %abundance(not present)shouldbe consideredas 0-1 %.Seeimagesabove.There<br />
are seldom no spongesover many metres of <strong>seabed</strong>,thus 0 % is a m<strong>at</strong>ter of scale and timing (to the<br />
millisecond)of whenthe observ<strong>at</strong>ionwasmade.<br />
Akvaplan-niva AS, 9296 Tromsø<br />
36 www.akvaplan.niva.no
5.3.4 Integr<strong>at</strong>ed assessment – baseline <strong>survey</strong> and detailed <strong>site</strong> <strong>survey</strong><br />
Figure31showsthe combinedobserv<strong>at</strong>ionsof spongedensitiesmadeduring the baseline<strong>survey</strong>in<br />
20<strong>11</strong>(DNV)andthe current<strong>survey</strong>.<br />
Initially, we aimed to integr<strong>at</strong>e the abundancec<strong>at</strong>egoriesto provide a combinedassessment,but<br />
without re-analysing the original images,we could not integr<strong>at</strong>e these efficiently. A decisionwas<br />
taken to simply use the current recordings,but to work together with DNV in the future, to<br />
standardiserecordingapproaches.<br />
Figure31. Map of observ<strong>at</strong>ionsof spongedensitiescarriedout duringthe 20<strong>11</strong>baseline<strong>survey</strong>and the current<br />
2012detailed<strong>visual</strong><strong>site</strong><strong>survey</strong>.<br />
<strong>Detailed</strong> <strong>site</strong> <strong>survey</strong> <strong>at</strong> PL531 Darwin<br />
Akvaplan-niva AS Rapport 6051 - 1 37
5.3.5 Dominant sponge species recorded in the current <strong>survey</strong><br />
Table4 liststhe mostcommonspongesrecorded<strong>at</strong> the Darwinfield.<br />
Table4. Listof the mostfrequentlyrecordedspongespecies/groups<strong>at</strong> the Darwinfield,August,2012. Simplified<br />
identific<strong>at</strong>ioncharacteristicsareprovidedto assistnon-specialists.<br />
Sponges Simplified identi fic<strong>at</strong>ion characteristics<br />
Aplysilla sp. Yellow lumps<br />
Axinella sp. White funnel<br />
Candelabrum phrygium Pink string<br />
Farrea occa White and bumpy<br />
Geodia sp. White pot<strong>at</strong>o<br />
Hymedesmia sp. Fl<strong>at</strong> and blue<br />
Polymastia sp. Dog's rubber ball (white)<br />
Stylochordyla borealis Stalked tulip (white)<br />
Imagesof eachof these species/groupsare shown in Figure32. Note, figure extendsover several<br />
pages.<br />
Aplysilla Aplysilla<br />
Axinella Axinella<br />
Akvaplan-niva AS, 9296 Tromsø<br />
38 www.akvaplan.niva.no
Candelabrum phrygium Candelabrum phrygium<br />
Farreaocca Farreaocca<br />
Geodia Geodia<br />
<strong>Detailed</strong> <strong>site</strong> <strong>survey</strong> <strong>at</strong> PL531 Darwin<br />
Akvaplan-niva AS Rapport 6051 - 1 39
Hymedesmia Hymedesmia<br />
Polymastia Polymastia<br />
Stylochordyla borealis Stylochordyla borealis<br />
Figure32. Imagesof the mostdominantspongespecies/groupsobserved <strong>at</strong> the Darwinfield. Illustr<strong>at</strong>ionimages<br />
from Akvaplan-nivaarchives.<br />
Akvaplan-niva AS, 9296 Tromsø<br />
40 www.akvaplan.niva.no
Theapproxim<strong>at</strong>edistributionof the pot<strong>at</strong>o spongeGeodiais shownin Figure33.<br />
Figure33. Observ<strong>at</strong>ionsof the pot<strong>at</strong>o spongeGeodia<strong>at</strong> Darwin,August,2012.<br />
This obviously is a common species, and occurs acrossalmost all of the <strong>survey</strong> area. We can<br />
thereforeconsiderit asa keyspeciesfor the area,but it is by no meansrare.<br />
Figure34 showsthe observeddistribution of the yellow spongeAplysilla. It appearsto be somewh<strong>at</strong><br />
more p<strong>at</strong>chily distributed than Geodia, but still can be considereda common and typical sponge<br />
speciesfor the area.<br />
<strong>Detailed</strong> <strong>site</strong> <strong>survey</strong> <strong>at</strong> PL531 Darwin<br />
Akvaplan-niva AS Rapport 6051 - 1 41
Figure34. Observ<strong>at</strong>ionsof the yellowsponge,Aplysilla,<strong>at</strong> Darwin,August2012.<br />
Figure35 and Figure36 showthe distributionsof the glassspongeFarreaoccaand the blue sponge<br />
Hymedesma. Boththesespongesare r<strong>at</strong>her morep<strong>at</strong>chilydistributed than Geodia, but still shouldbe<br />
consideredasdominantspecies/groupswhicharetypicalfor the area.<br />
Akvaplan-niva AS, 9296 Tromsø<br />
42 www.akvaplan.niva.no
Figure35. Observ<strong>at</strong>ionsof the glass-spongeFarreaocca<strong>at</strong> Darwin,August,2012.<br />
<strong>Detailed</strong> <strong>site</strong> <strong>survey</strong> <strong>at</strong> PL531 Darwin<br />
Akvaplan-niva AS Rapport 6051 - 1 43
Figure36. Observ<strong>at</strong>ionsfor the bluespongeHymedesma, Darwin,August2012.<br />
5.3.6 Trawl tracks<br />
Figure 37 shows the distribution of trawl tracks <strong>at</strong> the Darwin field, August,2012. Evidenceof<br />
trawling existsthroughout the area.Trawltrackswere observed<strong>at</strong> almosthalf of all the ROV<strong>survey</strong><br />
lines. A total of 19 observ<strong>at</strong>ionsof trawl tracksweremade.<br />
Akvaplan-niva AS, 9296 Tromsø<br />
44 www.akvaplan.niva.no
Figure37. Observ<strong>at</strong>ionsof trawl tracks<strong>at</strong> the Darwinfield,August,2012.<br />
5.3.7 General impressions (images)<br />
During the course of the <strong>survey</strong>, it becameclear th<strong>at</strong> the Darwin area supports a healthy fish<br />
popul<strong>at</strong>ion (Figure38). Fishspeciesobservedwere saithe (Pollachiusvirens), Atlantic cod (Gadus<br />
morhua), spottedwolfish (Anarhichasminor), redfish(Sebastes) anda variety of others.Fishtend to<br />
become numerous <strong>at</strong> the sea floor, and <strong>at</strong>tracted to the ROVlights from early in the morning,<br />
approxim<strong>at</strong>ely4am (pers. com. Knut Bergen,OceaneeringROVsupervisor),and this also was the<br />
casein the present<strong>survey</strong>.<br />
<strong>Detailed</strong> <strong>site</strong> <strong>survey</strong> <strong>at</strong> PL531 Darwin<br />
Akvaplan-niva AS Rapport 6051 - 1 45
Figure38. Upper:spottedwolffishrestingon the sediment,amongthe glass-spongeFarreaocca.Lower:saithe,<br />
<strong>at</strong>tractedto the lightsof the ROV.<br />
Akvaplan-niva AS, 9296 Tromsø<br />
46 www.akvaplan.niva.no
Figure39. Upper:fish (saithe) and possibly a corrodedmetal fishing flo<strong>at</strong> with somebiologicalgrowth and<br />
(lower)spongeson muddysediment;Geodiaand Aplysillain the foreground,and Farreaoccafarther back(to<br />
the right).<br />
Figure40 showsa typicalexampleof a largestonewith growth.<br />
<strong>Detailed</strong> <strong>site</strong> <strong>survey</strong> <strong>at</strong> PL531 Darwin<br />
Akvaplan-niva AS Rapport 6051 - 1 47
Figure40. Largestonein foreground,with growth of wh<strong>at</strong> appearsto be hydroids.In the backgroundmuddy<br />
sedimentsanderectspongecolonies,frequentedby fish.<br />
5.4 Environmental costs and benefits for disch arge scenarios<br />
5.4.1 Discharge scenarios<br />
Managementof human pressuresto the environment can be consideredwithin an ecosystem<br />
perspective,whereimpactsandremedialactionsoper<strong>at</strong>e<strong>at</strong> a rangeof time-scales(short,middleand<br />
long-term). Environmentalbenefits of remedialaction to one ecosystemcomponentmay result in<br />
neg<strong>at</strong>ive impacts on another, and these need to be evalu<strong>at</strong>edwithin an integr<strong>at</strong>ed assessment<br />
str<strong>at</strong>egy.<br />
Akvaplan-niva AS, 9296 Tromsø<br />
48 www.akvaplan.niva.no
Table5. Extractfrom OSPAR2010,listingthe mainpressureswhichmayaffect spongepopul<strong>at</strong>ions.<br />
Fisheriesand CO2 emissionsare listed as posing large-scale,very high thre<strong>at</strong>s. Fisheriesare not<br />
consideredfurther here. However,CO2 emissionsare consideredto be one of the main causesof<br />
oceanacidific<strong>at</strong>ion,and this inhibits the calcific<strong>at</strong>ionprocesses,which certainly coralsand <strong>at</strong> least<br />
somegroupsof spongesrely upon.Therefore,emissionsto air duringoper<strong>at</strong>ionalactivitiesshouldbe<br />
seen in the ecosystemcontext of managementof spongeand/or coral habit<strong>at</strong>s in the vicinity of<br />
petroleum oper<strong>at</strong>ions.Oceanacidific<strong>at</strong>ionis listed asa pressurerequiringmonitoring within the EU<br />
Marine Str<strong>at</strong>egyFrameworkDirective(MSFD;Directive2008),and also fe<strong>at</strong>uresin the Norwegian<br />
Integr<strong>at</strong>edManagementPlanfor the Barents Sea(availableon www. regjeringen.no).<br />
ThepressuresMineralsexploit<strong>at</strong>ionandDumpingof solidwastecanbe seenwithin the MSFDimpact<br />
c<strong>at</strong>egoriesof habit<strong>at</strong> loss and habit<strong>at</strong> damage,in this case having local impacts (OSPAR,2010).<br />
Obviously, if local impacts become very numerous, there arises an increased risk of habit<strong>at</strong><br />
fragment<strong>at</strong>ion,but in the BarentsSea<strong>at</strong> this time, this appearsto be of minor concern.<br />
Thetime-scaleof impactsshouldalsobe given<strong>at</strong>tention. If spongesrecolonizelocallyaffected areas<br />
during the averagelifecycleof a successfulpetroleum project (perhaps30+ years),these might be<br />
consideredashavinghighimpacts(spongemortality) <strong>at</strong> a localgeographicscaleandshort-term time<br />
scale, but negligible in the long term. Such impacts are consideredwithin the MSFDas being<br />
'reversible'.Of major concernis permanentlossor irreversibleneg<strong>at</strong>iveimpacts.Oceanacidific<strong>at</strong>ion<br />
posessuchanirreversiblethre<strong>at</strong>.<br />
Theenvironmentalcostsandbenefitsof the three maindischargescenariosare givenin Table6.<br />
<strong>Detailed</strong> <strong>site</strong> <strong>survey</strong> <strong>at</strong> PL531 Darwin<br />
Akvaplan-niva AS Rapport 6051 - 1 49
Table 6. Summaryof environmentalcosts and benefits associ<strong>at</strong>edwith the three main types of discharge<br />
scenarios.<br />
Scenario Cost Benefit<br />
Dischargeon sea floor<br />
directly<strong>at</strong> SPUD<strong>site</strong><br />
Discharge<strong>at</strong> seafloor to<br />
another loc<strong>at</strong>ion with<br />
lower spongedensity.<br />
5.4.2 Deposition scenarios rel<strong>at</strong>ed to area of impact to sponges<br />
SINTEFhave previously modelled likely sp<strong>at</strong>ial extent of depositions of <strong>drilling</strong> muds/cuttings,<br />
specified in terms of depositionthicknesses. We havethen compiledthe biologicalobserv<strong>at</strong>ionsof<br />
spongeabundanceswithin eachof the modelled areasof deposition.On this basis,we present an<br />
estim<strong>at</strong>e of area of affected seafloor containing the various c<strong>at</strong>egoriesof sponge abundances<br />
(Section5.4.3, Table7). TheRENASapplic<strong>at</strong>ionfor permit to oper<strong>at</strong>epresentsdifferent altern<strong>at</strong>ives<br />
for handlingof cuttingsreferred to asCase1 – 7. Thedischargescenariospresentedbelow refer to<br />
thesecases.<br />
Note: the dischargescenarioswere workedout usingthe originalSPUDloc<strong>at</strong>ion;but on 21.09.2012,<br />
Case7 wasupd<strong>at</strong>edto a new loc<strong>at</strong>ion.Thepositionsareasfollows(both usingED50Zone34N):<br />
Longitude L<strong>at</strong>itude<br />
Explor<strong>at</strong>ionWell -original 4<strong>11</strong>870 8001215<br />
Explor<strong>at</strong>ionWell - new 4<strong>11</strong>923 8001225<br />
1 CO2 emissionsare seenin the context of beinga major contributor to oceanacidific<strong>at</strong>ionthrough uptaketo<br />
the seafrom air.<br />
Short- to middle-term local mortality to<br />
spongeswithin anareaof between20 – 70 km 2<br />
(dependingon mortality to different particle<br />
sizefractions)<br />
Additional energy consumption (CO 2<br />
emissions 1 ) from vesselsin oper<strong>at</strong>ion using<br />
dynamicpositioning(DP). Averageof 30 m 3 fuel<br />
consumption per day per vessel is not<br />
unrealistic (pers. comm. Captain of Njord<br />
Viking).<br />
Physical damage to sea floor/sponges by<br />
pipeline.<br />
Localimpactsto another areahinderingfuture<br />
(short-to-middle-term) sponge recruitment <strong>at</strong><br />
this loc<strong>at</strong>ion<br />
Dischargefrom rig Additionalenergycosts(seeabove)<br />
Sediment<strong>at</strong>ionpotentially spreadover a wider<br />
area.<br />
Without d<strong>at</strong>a on lethal limits for<br />
exposure to sediment<strong>at</strong>ion, no<br />
guaranteedischargesare abovelethal<br />
limits.<br />
If not, riskof moreextensiveimpacts.<br />
Impact strictly localised.<br />
Minimalhabit<strong>at</strong> fragment<strong>at</strong>ion<br />
Long-term local recolonis<strong>at</strong>ion<br />
is likely (e.g. within the lifetime<br />
of the project– 30years+)<br />
Spongesdirectly <strong>at</strong> the SPUD<br />
<strong>site</strong>minimallyimpacted.<br />
Lower intensity of impacts<br />
immedi<strong>at</strong>ely around the SPUD<br />
loc<strong>at</strong>ion.<br />
Akvaplan-niva AS, 9296 Tromsø<br />
50 www.akvaplan.niva.no
5.4.2.1 Deposition Case 1: to seafloor <strong>at</strong> original SPUD loc<strong>at</strong>ion<br />
Figure41 showsobserved and estim<strong>at</strong>ed spongeabundancesin rel<strong>at</strong>ion to a dischargescenario<br />
where<strong>drilling</strong>cuttingsaredepo<strong>site</strong>d<strong>at</strong> the originalSPUDloc<strong>at</strong>ion.<br />
Figure41. Illustr<strong>at</strong>ion of depositionCase1: discharge<strong>at</strong> the original SPUDloc<strong>at</strong>ion. Upper:observ<strong>at</strong>ionsand<br />
(lower) interpol<strong>at</strong>ed distribution of spongeabundances,with overlayedmodelledsp<strong>at</strong>ial extent of depo<strong>site</strong>d<br />
<strong>drilling</strong> cuttings(asprovidedby SINTEF).<br />
<strong>Detailed</strong> <strong>site</strong> <strong>survey</strong> <strong>at</strong> PL531 Darwin<br />
Akvaplan-niva AS Rapport 6051 - 1 51
5.4.2.2 Deposition Case 2: to seafloor (CTS) and from rig<br />
Figure42 shows observedand estim<strong>at</strong>ed spongeabundancesin rel<strong>at</strong>ion to a dischargescenario<br />
where the <strong>drilling</strong> cuttings from the top section are depo<strong>site</strong>d 200m in a north-north-westerly<br />
directionfrom the originalSPUDloc<strong>at</strong>ion, andthe remainingcuttingsaredischargedfrom the rig.<br />
Figure42. Illustr<strong>at</strong>ionof depositionCase2: dischargefrom both the originalSPUDloc<strong>at</strong>ionand from rig. Upper:<br />
observ<strong>at</strong>ionsand (lower) interpol<strong>at</strong>ed distribution of spongeabundances, with overlayedmodelled sp<strong>at</strong>ial<br />
extentof depo<strong>site</strong>d<strong>drilling</strong> mud/cuttings(asprovidedby SINTEF)<br />
Akvaplan-niva AS, 9296 Tromsø<br />
52 www.akvaplan.niva.no
5.4.2.3 Deposition Case 6: to seafloor 300 m north of original SPUD<br />
Figure42 shows observedand estim<strong>at</strong>ed spongeabundancesin rel<strong>at</strong>ion to a dischargescenario<br />
where<strong>drilling</strong>mudsaredepo<strong>site</strong>d300m north of the originalSPUDloc<strong>at</strong>ion.<br />
Figure 43. Illustr<strong>at</strong>ion of depositionCase6: discharge300 m north of the original SPUDloc<strong>at</strong>ion. Upper:<br />
observ<strong>at</strong>ionsand (lower) estim<strong>at</strong>ions of sponge abundances,with overlayed modelled sp<strong>at</strong>ial extent of<br />
depo<strong>site</strong>d<strong>drilling</strong> mud/cuttings(asprovidedbySINTEF).<br />
<strong>Detailed</strong> <strong>site</strong> <strong>survey</strong> <strong>at</strong> PL531 Darwin<br />
Akvaplan-niva AS Rapport 6051 - 1 53
5.4.2.4 Deposition Case 7: Deposition <strong>at</strong> new, reloc<strong>at</strong>ed SPUD loc<strong>at</strong>ion<br />
Figure44 showsobservedand estim<strong>at</strong>edspongeabundancesin a dischargescenariowhere <strong>drilling</strong><br />
mudsaredepo<strong>site</strong>d<strong>at</strong> the new SPUDloc<strong>at</strong>ion(X:4<strong>11</strong>923mE;Y8001225mN(ED50Zone34N).<br />
Figure44. Illustr<strong>at</strong>ion of depositionCase7: discharge <strong>at</strong> the new SPUDloc<strong>at</strong>ion (upd<strong>at</strong>e21.09.2012)<br />
. Upper:<br />
observ<strong>at</strong>ionsand (lower). Interpol<strong>at</strong>ed estim<strong>at</strong>ionsof spongeabundances,with overlayedmodelledsp<strong>at</strong>ial<br />
extentof depo<strong>site</strong>d<strong>drilling</strong> mud/cuttings(asprovidedbySINTEF).<br />
Akvaplan-niva AS, 9296 Tromsø<br />
54 www.akvaplan.niva.no
5.4.2.5 Deposition Case 6a: depositio n north -east of original SPUD<br />
Figure45 showsobservedand estim<strong>at</strong>ed spongeabundancesin rel<strong>at</strong>ion to a dischargescenario<br />
where <strong>drilling</strong> muds are depo<strong>site</strong>d<strong>at</strong> the seafloor, slightly to the north-east of the original SPUD<br />
loc<strong>at</strong>ion.<br />
Figure45. Illustr<strong>at</strong>ionof depositionCase6a: dischargenorth-eastof the SPUDloc<strong>at</strong>ion.Upper:observ<strong>at</strong>ionsand<br />
(lower) interpol<strong>at</strong>ed estim<strong>at</strong>ionsof spongeabundances,with overlayedmodelledsp<strong>at</strong>ial extent of depo<strong>site</strong>d<br />
<strong>drilling</strong> mud/cuttings(asprovidedbySINTEF).<br />
<strong>Detailed</strong> <strong>site</strong> <strong>survey</strong> <strong>at</strong> PL531 Darwin<br />
Akvaplan-niva AS Rapport 6051 - 1 55
5.4.3 Compar<strong>at</strong>ive assessment<br />
Table7 showsvariousexpressionsof extent of impactsunderthe variousdischargescenarios.Case7<br />
usesthe new SPUDloc<strong>at</strong>ionandis shownin bold.<br />
Table 7. Comparisonof the extent of impacts to the seafloor and spongeassemblages,under 5 different<br />
dischargescenarios.Note Case7 is calcul<strong>at</strong>edfor the new SPUDloc<strong>at</strong>ion (upd<strong>at</strong>ed21.09.2012)whereasthe<br />
otherscenariosarebasedon the originalSPUDloc<strong>at</strong>ion.<br />
Case1 Case2 Case6 Case7 Case6a<br />
Sp<strong>at</strong>ialextent of impacts<br />
Affectedarea1-3 mm (m2) 71426 <strong>11</strong>3031 71928 25341 71928<br />
Affectedarea3-10mm (m2) 44913 57388 45916 12249 45916<br />
Affectedarea10-30 mm (m2) 19767 18289 23587 7289 23587<br />
Numberof observ<strong>at</strong>ionsin affectedareas<br />
No.Observ<strong>at</strong>ions1-3mm0-1 %cover 27 42 19 16 57<br />
No.Observ<strong>at</strong>ions1-3mm1-5 %cover 272 397 233 <strong>11</strong>2 330<br />
No.Observ<strong>at</strong>ions1-3mm5-10 %cover 33 42 26 15 19<br />
No.Observ<strong>at</strong>ions1-3mm10-15 %cover 2 5 3 1 0<br />
No.Observ<strong>at</strong>ions1-3mm>15%cover 0 0 0 0 0<br />
Proportionsof observ<strong>at</strong>ionsin affectedareas<br />
%areaaffected1-3mm0-1%cover 8 % 9 % 7 % <strong>11</strong> % 14 %<br />
%areaaffected1-3mm1-5 %cover 81 % 82 % 83 % 78 % 81 %<br />
%areaaffected1-3mm5-10 %cover 10 % 9 % 9 % 10 % 5 %<br />
%areaaffected1-3mm10-15 %cover 1 % 1 % 1 % 1 % 0 %<br />
%areaaffected1-3mm>15%cover 0 % 0 % 0 % 0 % 0 %<br />
Case7 hasthe lowest sp<strong>at</strong>ialextent of impacts.Note th<strong>at</strong> areasaffected by higher sediment<strong>at</strong>ion<br />
than 30 mm thicknessarenot distinguishedin this exercise.<br />
5.5 Assessing vulnerability of sponge assemblages to <strong>drilling</strong><br />
discharges<br />
5.5.1 Wh<strong>at</strong> do sensitivity and vulnerability mean?<br />
We candefine sensitivityin terms of how muchreactionis causedby specificactions.In the caseof<br />
sponges,we canidentify wh<strong>at</strong> environmentalfactorshavea positiveandneg<strong>at</strong>iveeffect on sponges.<br />
Generally,sponges,likeother benthicorganisms,areaffectedby:<br />
Foodsupplyfrom the upperw<strong>at</strong>er layers<br />
Propertiesof the bottom w<strong>at</strong>er masses<br />
Sediment<strong>at</strong>ionof particles<br />
o Forspongesexcessivesediment<strong>at</strong>ionis assumedto causesmothering<br />
Exposureto chemicalsandphysicaldamage<br />
o May alter the ability to perform basic body functions (respir<strong>at</strong>ion, feeding and<br />
disposalof wasteproducts)<br />
Organismsare vulnerableif any of the abovefactorsare likely to be altered in the areain question,<br />
usuallyby ongoingclim<strong>at</strong>icchangesor humanactivities.<br />
Akvaplan-niva AS, 9296 Tromsø<br />
56 www.akvaplan.niva.no
For example,spongesare sensitiveto physicaldamage(suchas trawling or anchor handling)and<br />
smothering(suchasfrom passingtrawls or depositionof <strong>drilling</strong> muds),but they are only vulnerable<br />
in areaswheretheseactivitiesactuallyoccur.<br />
Assessingsensitivity to <strong>drilling</strong> cuttings requires further research on sponge metabolism and<br />
responsesto various disturbances(see below). Sensitivity and vulnerability can therefore be<br />
measured<strong>at</strong> an individual scale,but for environmentalmanagementand conserv<strong>at</strong>ionissues,an<br />
ecosystemperspectiveusuallyis adopted.<br />
Arisingquestionsaretherefore:<br />
Howmuchimpactswill be causedby plannedactivities<br />
Amountof spongeseradic<strong>at</strong>edor reducedin function;<br />
Howlongwill the effectsremainvisibleon the sea-floor<br />
Arethe impactsshort,middleor long-term?<br />
Will remedialactionshaveother undesirableenvironmentalside-effects<br />
Disposalin marinehabit<strong>at</strong>sversustransportto coastalor terrestrialzone<br />
Disposalof solidwasteversusemissionsto air<br />
To d<strong>at</strong>e, we do not havereal answersto these questionsin rel<strong>at</strong>ion to spongeassemblagesin the<br />
Barents Sea.In responseto emerging needs, a number of researchiniti<strong>at</strong>ives are taking place<br />
(Akvaplan-niva,Institute for MarineResearchandIRIS;seealsobelow).<br />
5.5.2 Ongoing and planned experimental and in situ work on assessing<br />
sensitivit y of sponges to <strong>drilling</strong> cuttings.<br />
Recently(05.09.2012),Akvaplan-niva submitted a researchproposal to the NorwegianResearch<br />
CouncilPROOFNYprogramme,on the impacts of <strong>drilling</strong> cuttings on spongeassemblagesin the<br />
south-westernBarentsSea.RENAS, together with EniNorgeand Lundin,hasgivenan expressionof<br />
interest to function as an end-user to this research. In addition, these companieswill guide the<br />
selectionof experimentalexposureparameters,and, where possibleor practical,offer assistancein<br />
collection/ in-situ studyof sponges,shouldan opportunity ariseduringanyfuture <strong>visual</strong>surveillance<br />
or stand-by missionswhereROVservicescanbe usedto mutual benefit.<br />
Thisreal link betweenexperimentalresearchand industrialneedsis a major stepforwards,towards<br />
answeringsomeof the urgentquestionsraisedduringthis, andrel<strong>at</strong>eddetailed<strong>site</strong> <strong>survey</strong>s.<br />
Howmuchsediment<strong>at</strong>ionislethal to sponges?<br />
o Andwhichsedimentfractioncausesmost stressto sponges?<br />
How do spongesreact to exposureof someof the substancesusedduring oper<strong>at</strong>ions(e.g.<br />
BariteandBentonite)?<br />
How is the metabolism/respir<strong>at</strong>ion/ generalperformanceof spongesaffectedby sub-lethal<br />
exposureto <strong>drilling</strong>discharges?<br />
How fast do spongesgrow, and therefore wh<strong>at</strong> is the expected recovery period after<br />
depositionof <strong>drilling</strong>mud/cuttings?<br />
o note – another question arises- do spongesreadily recolonize,despitechangesin<br />
the grainsizecomposition<strong>at</strong> the sedimentsurface?<br />
<strong>Detailed</strong> <strong>site</strong> <strong>survey</strong> <strong>at</strong> PL531 Darwin<br />
Akvaplan-niva AS Rapport 6051 - 1 57
6 References<br />
Auster, P.J. 2007. Linking deep-w<strong>at</strong>er corals and fish popul<strong>at</strong>ions. Conserv<strong>at</strong>ionand Adaptive<br />
Managementof Seamountand Deep-w<strong>at</strong>er coral ecosystems.Rosensteilschoolof marine<br />
and<strong>at</strong>mosphericsciences.Miami, FL.USA.Pp93-99.<br />
Bett, B.J.and Rice,A.L.1992.Theinfluenceof hexactinellidsponge(Pheronemacarpenteri)spicules<br />
on the p<strong>at</strong>chydistribution of macrobenthosin the PorcupineSeabight(b<strong>at</strong>hyalNEAtlantic).<br />
Ophelia,36:217–226.<br />
Beulieu,S.E.,2001.Life on glasshouses.Spongestalk communitiesin the deepsea.Marine Biology<br />
138:803-817.<br />
CENFprEN16260 W<strong>at</strong>er quality - Visual<strong>seabed</strong><strong>survey</strong>susing remotely oper<strong>at</strong>ed and/or towed<br />
observ<strong>at</strong>iongearfor collectionof environmentald<strong>at</strong>a.<br />
DNV20<strong>11</strong>a. Baseline<strong>survey</strong>Darwin20<strong>11</strong>.ReportNo.2012-0448<br />
DNV20<strong>11</strong>b. Visualbaseline<strong>survey</strong>in the BarentsSea20<strong>11</strong>.ReportNo.20<strong>11</strong>-1695.<br />
DNV2012.Spongeassessment<strong>at</strong> Darwin.ReportNo.14L2KD5-2012.<br />
Gubbay, S.,2002. OffshoreDirectory:Reviewof a selectionof habit<strong>at</strong>s,communtiesand speciesof<br />
the North-EastAtlantic. WWF-UK:North-EastAtlantic Programme.<br />
Husebøo,A., Nøttestad,L.,Fosså,J.,Furevik,D., Jørgensen,S.2002.Distribution and abundanceof<br />
fish in deep-seacoralhabit<strong>at</strong>s.Hydrobiologia471:91–99.<br />
ICES2002.Reportof the WorkingGroupon EcosystemEffectsof Fisheries.Advisory Committeeon<br />
Ecosystems. ICESCM2002/ACE:03.<br />
Klitgaard,A.B. & Tendal,O.S.(2001).“Ostur”-“cheesebottoms”-spongedomin<strong>at</strong>edareasin Faroese<br />
shelf and slope areas. In Marine biological investig<strong>at</strong>ionsand assemblagesof benthic<br />
invertebr<strong>at</strong>esfrom the FaroeIsland,pp. 13–21. Ed.by G.Gruntseand O.S.Tendal.Kaldbak<br />
Marine BiologicalLabor<strong>at</strong>ory,the FaroeIslands.<br />
Klitgaard,A.B. (1995). The fauna associ<strong>at</strong>edwith outer shelf and upper slope sponges(Porifera,<br />
Demospongiae)<strong>at</strong> the FaroeIslands,northeasternAtlantic.Sarsia,80:1–22.<br />
Konnecker,G. (2002) SpongeFields.In: Gubbay,S. Offshore Directory. Reviewof a selection of<br />
habit<strong>at</strong>s,communitiesandspeciesof the North-EastAtlantic.WWF-UK.North-EastAtlantic<br />
Programme.<br />
Marliave, J.B., Conway, K.W., Gibbs, D.M., Lamb, A., Gibbs, C. 2009. Biodiversity and rockfish<br />
recruitment in spongegardensandbiohermsof southernBritishColumbia,Canada.Marine<br />
Biology156:2247–2254.<br />
Miller, R.J.,Hocevar,J.,Stone,R.,Fedorov,D. 2012.Structure-forming CoralsandSpongesand their<br />
use as Fish Habit<strong>at</strong> in Bering Sea Submarine Canyons. PLoS ONE 7(3): e33885.<br />
doi:10.1371/journal.pone.0033885 .<br />
Mortensen, P.B.,Buhl-Mortensen, L. 2005. Morphology and growth of the deepw<strong>at</strong>er gorgonians<br />
PrimnoaresedaeformisandParagorgiaarborea. MarineBiology147:775–788.<br />
OSPARCommission,2008:Descriptionsof habit<strong>at</strong>son the OSPARlist of thre<strong>at</strong>enedand/or declining<br />
speciesandhabit<strong>at</strong>s. Reference2008-07.<br />
OSPARCommission,2010. Backgrounddocument for deep sea sponge aggreg<strong>at</strong>ions.Public<strong>at</strong>ion<br />
Number: 485/2010, ISBN 978-1-907390-26-5. Available <strong>at</strong><br />
http://www.ospar.org/documents/dbase/public<strong>at</strong>ions/p00485_deep_sea_sp onge_aggrega<br />
tions.pdf<br />
Rogers, A. 1999.Thebiologyof Lopheliapertusa(Linnaeus1758)and other deepw<strong>at</strong>erreef-forming<br />
coralsand impactsfrom human activities.Intern<strong>at</strong>ional Reviewof Hydrobiology.pp 315–<br />
406.<br />
Akvaplan-niva AS, 9296 Tromsø<br />
58 www.akvaplan.niva.no
Stone, R.P. 2006.Coralhabit<strong>at</strong> in the Aleutian Islandsof Alaska:depth distribution, fine-scalespecies<br />
associ<strong>at</strong>ions,andfisheriesinteractions.CoralReefs25:229–238.<br />
<strong>Detailed</strong> <strong>site</strong> <strong>survey</strong> <strong>at</strong> PL531 Darwin<br />
Akvaplan-niva AS Rapport 6051 - 1 59
Appendices<br />
Anelectronicsupplement(on externalharddisk)isgivento RENAS, includingall d<strong>at</strong>aandthis report.<br />
Akvaplan-niva AS, 9296 Tromsø<br />
60 www.akvaplan.niva.no