

Forensic analysis of phone call networks Salvatore Catanese, Emilio ...
Forensic analysis of phone call networks Salvatore Catanese, Emilio ...
Forensic analysis of phone call networks Salvatore Catanese, Emilio ...

You also want an ePaper? Increase the reach of your titles
YUMPU automatically turns print PDFs into web optimized ePapers that Google loves.
28 S. <strong>Catanese</strong> et al.<br />
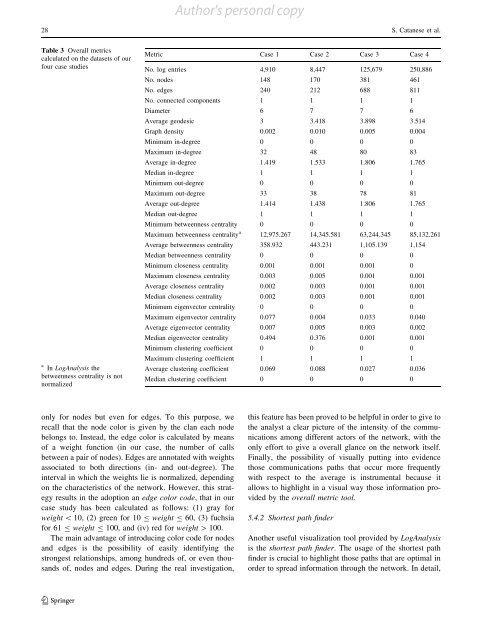
Table 3 Overall metrics<br />
calculated on the datasets <strong>of</strong> our<br />
four case studies<br />
a In LogAnalysis the<br />
betweenness centrality is not<br />
normalized<br />
only for nodes but even for edges. To this purpose, we<br />
re<strong>call</strong> that the node color is given by the clan each node<br />
belongs to. Instead, the edge color is calculated by means<br />
<strong>of</strong> a weight function (in our case, the number <strong>of</strong> <strong>call</strong>s<br />
between a pair <strong>of</strong> nodes). Edges are annotated with weights<br />
associated to both directions (in- and out-degree). The<br />
interval in which the weights lie is normalized, depending<br />
on the characteristics <strong>of</strong> the network. However, this strategy<br />
results in the adoption an edge color code, that in our<br />
case study has been calculated as follows: (1) gray for<br />
weight \ 10, (2) green for 10 B weight B 60, (3) fuchsia<br />
for 61 B weight B 100, and (iv) red for weight [ 100.<br />
The main advantage <strong>of</strong> introducing color code for nodes<br />
and edges is the possibility <strong>of</strong> easily identifying the<br />
strongest relationships, among hundreds <strong>of</strong>, or even thousands<br />
<strong>of</strong>, nodes and edges. During the real investigation,<br />
123<br />
Author's personal copy<br />
Metric Case 1 Case 2 Case 3 Case 4<br />
No. log entries 4,910 8,447 125,679 250,886<br />
No. nodes 148 170 381 461<br />
No. edges 240 212 688 811<br />
No. connected components 1 1 1 1<br />
Diameter 6 7 7 6<br />
Average geodesic 3 3.418 3.898 3.514<br />
Graph density 0.002 0.010 0.005 0.004<br />
Minimum in-degree 0 0 0 0<br />
Maximum in-degree 32 48 80 83<br />
Average in-degree 1.419 1.533 1.806 1.765<br />
Median in-degree 1 1 1 1<br />
Minimum out-degree 0 0 0 0<br />
Maximum out-degree 33 38 78 81<br />
Average out-degree 1.414 1.438 1.806 1.765<br />
Median out-degree 1 1 1 1<br />
Minimum betweenness centrality 0 0 0 0<br />
Maximum betweenness centrality a<br />
12,975.267 14,345.581 63,244.345 85,132.261<br />
Average betweenness centrality 358.932 443.231 1,105.139 1,154<br />
Median betweenness centrality 0 0 0 0<br />
Minimum closeness centrality 0.001 0.001 0.001 0<br />
Maximum closeness centrality 0.003 0.005 0.001 0.001<br />
Average closeness centrality 0.002 0.003 0.001 0.001<br />
Median closeness centrality 0.002 0.003 0.001 0.001<br />
Minimum eigenvector centrality 0 0 0 0<br />
Maximum eigenvector centrality 0.077 0.004 0.033 0.040<br />
Average eigenvector centrality 0.007 0.005 0.003 0.002<br />
Median eigenvector centrality 0.494 0.376 0.001 0.001<br />
Minimum clustering coefficient 0 0 0 0<br />
Maximum clustering coefficient 1 1 1 1<br />
Average clustering coefficient 0.069 0.088 0.027 0.036<br />
Median clustering coefficient 0 0 0 0<br />
this feature has been proved to be helpful in order to give to<br />
the analyst a clear picture <strong>of</strong> the intensity <strong>of</strong> the communications<br />
among different actors <strong>of</strong> the network, with the<br />
only effort to give a overall glance on the network itself.<br />
Finally, the possibility <strong>of</strong> visually putting into evidence<br />
those communications paths that occur more frequently<br />
with respect to the average is instrumental because it<br />
allows to highlight in a visual way those information provided<br />
by the overall metric tool.<br />
5.4.2 Shortest path finder<br />
Another useful visualization tool provided by LogAnalysis<br />
is the shortest path finder. The usage <strong>of</strong> the shortest path<br />
finder is crucial to highlight those paths that are optimal in<br />
order to spread information through the network. In detail,
