

Forensic analysis of phone call networks Salvatore Catanese, Emilio ...
Forensic analysis of phone call networks Salvatore Catanese, Emilio ...
Forensic analysis of phone call networks Salvatore Catanese, Emilio ...

Create successful ePaper yourself
Turn your PDF publications into a flip-book with our unique Google optimized e-Paper software.
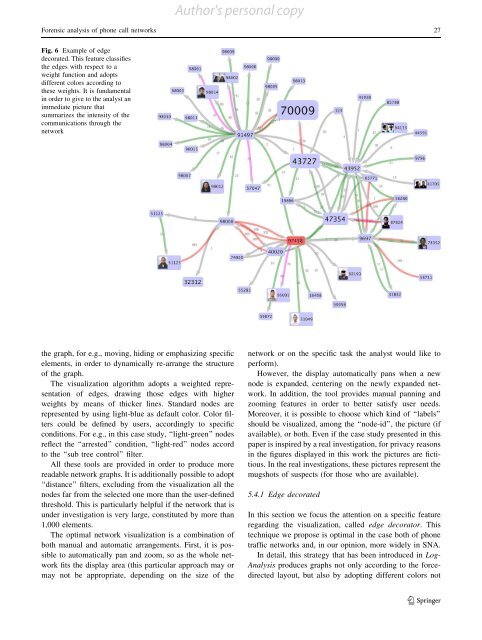
Fig. 6 Example <strong>of</strong> edge<br />
decorated. This feature classifies<br />
the edges with respect to a<br />
weight function and adopts<br />
different colors according to<br />
these weights. It is fundamental<br />
in order to give to the analyst an<br />
immediate picture that<br />
summarizes the intensity <strong>of</strong> the<br />
communications through the<br />
network<br />
the graph, for e.g., moving, hiding or emphasizing specific<br />
elements, in order to dynami<strong>call</strong>y re-arrange the structure<br />
<strong>of</strong> the graph.<br />
The visualization algorithm adopts a weighted representation<br />
<strong>of</strong> edges, drawing those edges with higher<br />
weights by means <strong>of</strong> thicker lines. Standard nodes are<br />
represented by using light-blue as default color. Color filters<br />
could be defined by users, accordingly to specific<br />
conditions. For e.g., in this case study, ‘‘light-green’’ nodes<br />
reflect the ‘‘arrested’’ condition, ‘‘light-red’’ nodes accord<br />
to the ‘‘sub tree control’’ filter.<br />
All these tools are provided in order to produce more<br />
readable network graphs. It is additionally possible to adopt<br />
‘‘distance’’ filters, excluding from the visualization all the<br />
nodes far from the selected one more than the user-defined<br />
threshold. This is particularly helpful if the network that is<br />
under investigation is very large, constituted by more than<br />
1,000 elements.<br />
The optimal network visualization is a combination <strong>of</strong><br />
both manual and automatic arrangements. First, it is possible<br />
to automati<strong>call</strong>y pan and zoom, so as the whole network<br />
fits the display area (this particular approach may or<br />
may not be appropriate, depending on the size <strong>of</strong> the<br />
Author's personal copy<br />
<strong>Forensic</strong> <strong>analysis</strong> <strong>of</strong> <strong>phone</strong> <strong>call</strong> <strong>networks</strong> 27<br />
network or on the specific task the analyst would like to<br />
perform).<br />
However, the display automati<strong>call</strong>y pans when a new<br />
node is expanded, centering on the newly expanded network.<br />
In addition, the tool provides manual panning and<br />
zooming features in order to better satisfy user needs.<br />
Moreover, it is possible to choose which kind <strong>of</strong> ‘‘labels’’<br />
should be visualized, among the ‘‘node-id’’, the picture (if<br />
available), or both. Even if the case study presented in this<br />
paper is inspired by a real investigation, for privacy reasons<br />
in the figures displayed in this work the pictures are fictitious.<br />
In the real investigations, these pictures represent the<br />
mugshots <strong>of</strong> suspects (for those who are available).<br />
5.4.1 Edge decorated<br />
In this section we focus the attention on a specific feature<br />
regarding the visualization, <strong>call</strong>ed edge decorator. This<br />
technique we propose is optimal in the case both <strong>of</strong> <strong>phone</strong><br />
traffic <strong>networks</strong> and, in our opinion, more widely in SNA.<br />
In detail, this strategy that has been introduced in Log-<br />
Analysis produces graphs not only according to the forcedirected<br />
layout, but also by adopting different colors not<br />
123
