Andhra Pradesh - Ministry of Environment and Forests
Andhra Pradesh - Ministry of Environment and Forests
Andhra Pradesh - Ministry of Environment and Forests

Create successful ePaper yourself
Turn your PDF publications into a flip-book with our unique Google optimized e-Paper software.
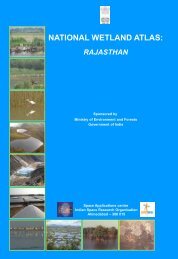
NATIONAL WETLAND ATLAS:<br />
ANDHRA PRADESH<br />
Sponsored by<br />
<strong>Ministry</strong> <strong>of</strong> <strong>Environment</strong> <strong>and</strong> <strong>Forests</strong><br />
Government <strong>of</strong> India<br />
Space Applications centre<br />
Indian Space Research Organisation<br />
Ahmedabad – 380 015
This publication deals with the updated database <strong>and</strong><br />
status <strong>of</strong> wetl<strong>and</strong>s, compiled in Atlas format. Increasing<br />
concern about how our wetl<strong>and</strong>s are being influenced has<br />
led to formulation <strong>of</strong> a project entitled “National Wetl<strong>and</strong><br />
Inventory <strong>and</strong> Assessment (NWIA)” to create an updated<br />
database <strong>of</strong> the wetl<strong>and</strong>s <strong>of</strong> India. The wetl<strong>and</strong>s are<br />
categorised under 19 classes <strong>and</strong> mapped using satellite<br />
remote sensing data from Indian Remote Sensing<br />
Satellite: IRS P6- LISS III sensor. The results are<br />
organised at 1: 50, 000 scales at district, state <strong>and</strong><br />
topographic map sheet (Survey <strong>of</strong> India reference) level<br />
using Geographic Information System (GIS). This<br />
publication is a part <strong>of</strong> this national work <strong>and</strong> deals with<br />
the wetl<strong>and</strong> status <strong>of</strong> a particular State/Union Territory <strong>of</strong><br />
India, through text, statistical tables, satellite images,<br />
maps <strong>and</strong> ground photographs.<br />
The atlas comprises wetl<strong>and</strong> information arranged into<br />
nine sections. How the NWIA project work has been<br />
executed highlighted in the first six sections viz:<br />
Introduction, NWIA project, Study area, Data used,<br />
Methodology, <strong>and</strong> Accuracy. This is the first time that high<br />
resolution digital remote sensing data has been used to<br />
map <strong>and</strong> decipher the status <strong>of</strong> the wetl<strong>and</strong>s at national<br />
scale. The methodology highlights how the four spectral<br />
b<strong>and</strong>s <strong>of</strong> LISS III data (green, red, near infra red <strong>and</strong> short<br />
wave infra red) have been used to derive various indices<br />
<strong>and</strong> decipher information regarding water spread,<br />
turbidity <strong>and</strong> aquatic vegetation. Since, the aim was to<br />
generate a GIS compatible database, details <strong>of</strong> the<br />
st<strong>and</strong>ards <strong>of</strong> database are also highlighted in the<br />
methodology.<br />
The results <strong>and</strong> finding are organised in three sections;<br />
viz: Maps <strong>and</strong> Statistics, Major wetl<strong>and</strong> types, <strong>and</strong><br />
Important Wetl<strong>and</strong>s <strong>of</strong> the area. The Maps <strong>and</strong> Statistics<br />
are shown for state <strong>and</strong> district level. It gives details <strong>of</strong><br />
what type <strong>of</strong> wetl<strong>and</strong>s exists in the area, how many<br />
numbers in each type, their area estimates in hectare.<br />
Since, the hydrology <strong>of</strong> wetl<strong>and</strong>s are influenced by<br />
monsoon performance, extent <strong>of</strong> water spread <strong>and</strong> their<br />
turbidity (qualitative) in wet <strong>and</strong> dry season (postmonsoon<br />
<strong>and</strong> pre-monsoon period) are also given.<br />
Similarly the status <strong>of</strong> aquatic vegetation (mainly floating<br />
<strong>and</strong> emergent types) in two seasons is also accounted for.<br />
Status <strong>of</strong> small wetl<strong>and</strong>s are also accounted as numbers<br />
<strong>and</strong> depicted in maps as points. Wetl<strong>and</strong> map also show<br />
important ancillary information like roads/rail, relevant<br />
habitations. False Colour Composite (FCC) <strong>of</strong> the satellite<br />
image used (any one season) is shown along with the<br />
derived wetl<strong>and</strong> map to give a feeling <strong>of</strong> manifestation <strong>of</strong><br />
wetl<strong>and</strong>s in remote sensing data <strong>and</strong> synoptic view <strong>of</strong> the<br />
area. The status <strong>of</strong> some <strong>of</strong> the important wetl<strong>and</strong>s like<br />
Ramsar sites, National Parks are shown with recent field<br />
photographs.<br />
For further details contact:<br />
Director,<br />
Space Applications Centre, ISRO,<br />
Ambawadi Vistar (P.O.)<br />
Ahmedabad – 380 015<br />
director@sac.isro.gov.in
Atlas SAC/EPSA/AFEG/NWIA/ATLAS/33/2011<br />
NATIONAL WETLAND ATLAS<br />
ANDHRA PRADESH<br />
Sponsored by<br />
<strong>Ministry</strong> <strong>of</strong> <strong>Environment</strong> <strong>and</strong> <strong>Forests</strong>, Government <strong>of</strong> India<br />
As a part <strong>of</strong> the project on National Wetl<strong>and</strong> Inventory <strong>and</strong> Assessment (NWIA)<br />
Space Applications Centre (ISRO), Ahmedabad<br />
And<br />
A.P. State Remote Sensing Application Centre, Hyderabad<br />
March 2011
First Publication: March 2011, Space Applications Centre (ISRO), Ahmedabad<br />
Copyright: 2011, SAC, ISRO<br />
This publication may be produced in whole or in part <strong>and</strong> in any form for education or non-pr<strong>of</strong>it uses,<br />
without special permission from the copyright holder, provided acknowledgement <strong>of</strong> source is made. SAC<br />
will appreciate a copy <strong>of</strong> any publication which uses this publication as a source.<br />
Citation: National Wetl<strong>and</strong> Atlas: <strong>Andhra</strong> <strong>Pradesh</strong>, SAC/EPSA/AFEG/NWIA/ATLAS/33/2010, Space Applications<br />
Centre (ISRO), Ahmedabad, India, 172p.<br />
Available from: Space Applications Centre, ISRO, Ahmedabad – 380 015, India<br />
Production: SAC carried out the work jointly with A.P. State Remote Sensing Application Centre, Hyderabad, <strong>and</strong> M.G.<br />
Science Institute, Ahmedabad, Sponsored by <strong>Ministry</strong> <strong>of</strong> <strong>Environment</strong> <strong>and</strong> <strong>Forests</strong>, Govt. <strong>of</strong> India.
MESSAGE<br />
It gives me great pleasure to introduce this Atlas, the latest in a series, prepared by Space Applications<br />
Centre, Ahmedabad in connection with the National Wetl<strong>and</strong> Inventory <strong>and</strong> Assessment Project.<br />
This Atlas maps <strong>and</strong> catalogues information on Wetl<strong>and</strong>s across India using the latest in satellite imaging,<br />
one <strong>of</strong> the first <strong>of</strong> its kind. Wetl<strong>and</strong>s are areas <strong>of</strong> l<strong>and</strong> critical ecological significance that support a large<br />
variety <strong>of</strong> plant <strong>and</strong> animal species adapted to fluctuating water levels. Their identification <strong>and</strong> protection<br />
becomes very important.<br />
Utility-wise, wetl<strong>and</strong>s directly <strong>and</strong> indirectly support millions <strong>of</strong> people in providing services such as food,<br />
fiber <strong>and</strong> raw materials. They play important roles in storm <strong>and</strong> flood control, in supply <strong>of</strong> clean water, along<br />
with other educational <strong>and</strong> recreational benefits. Despite these benefits, wetl<strong>and</strong>s are the first target <strong>of</strong><br />
human interference <strong>and</strong> are among the most threatened <strong>of</strong> all natural resources. Around 50% <strong>of</strong> the<br />
earth’s wetl<strong>and</strong>s are estimated to already have disappeared worldwide over the last hundred years through<br />
conversion to industrial, agricultural <strong>and</strong> residential purposes. Even in current scenario, when the<br />
ecosystem services provided by wetl<strong>and</strong>s are better understood - degradation <strong>and</strong> conversion <strong>of</strong> wetl<strong>and</strong>s<br />
continues.<br />
Aware <strong>of</strong> their importance, the Government <strong>of</strong> India has formulated several policies <strong>and</strong> plans for the<br />
conservation <strong>and</strong> preservation <strong>of</strong> these crucial ecosystems. Realising the need <strong>of</strong> an updated geospatial<br />
data base <strong>of</strong> these natural resources as the pre-requisite for management <strong>and</strong> conservation planning,<br />
National Wetl<strong>and</strong> Inventory <strong>and</strong> Assessment (NWIA) project was formulated as a joint vision <strong>of</strong> <strong>Ministry</strong> <strong>of</strong><br />
<strong>Environment</strong> & Forestry, Govt. India, <strong>and</strong> Space Applications Centre (ISRO). I am told that the latest<br />
remote sensing data from Indian Remote Sensing satellite (IRS P6) have been used to map the wetl<strong>and</strong>s.<br />
The present atlas is part <strong>of</strong> this project <strong>and</strong> highlights the results <strong>of</strong> the study state in terms <strong>of</strong> statistics <strong>of</strong><br />
various types <strong>of</strong> wetl<strong>and</strong>s, extent <strong>of</strong> water, aquatic vegetation <strong>and</strong> turbidity in pre <strong>and</strong> post monsoon period.<br />
I also note that special efforts are made to provide detailed information <strong>of</strong> important wetl<strong>and</strong>s like Ramsar<br />
sites, National Parks etc.<br />
I am certain that this Atlas will raise the bar in developing such database <strong>and</strong> will be <strong>of</strong> great use for<br />
researchers, planners, policy makers, <strong>and</strong> also members <strong>of</strong> the general public.
Wetl<strong>and</strong>s defined as areas <strong>of</strong> l<strong>and</strong> that are either temporarily or permanently covered by water exhibit<br />
enormous diversity according to their genesis, geographical location, water regime <strong>and</strong> chemistry. Wetl<strong>and</strong>s<br />
are one <strong>of</strong> the most productive ecosystems <strong>and</strong> play crucial role in hydrological cycle. Utility wise, wetl<strong>and</strong>s<br />
directly <strong>and</strong> indirectly support millions <strong>of</strong> people in providing services such as storm <strong>and</strong> flood control, clean<br />
water supply, food, fiber <strong>and</strong> raw materials, scenic beauty, educational <strong>and</strong> recreational benefits. The<br />
Millennium Ecosystem Assessment estimates conservatively that wetl<strong>and</strong>s cover seven percent <strong>of</strong> the earth’s<br />
surface <strong>and</strong> deliver 45% <strong>of</strong> the world’s natural productivity <strong>and</strong> ecosystem services. However, the very<br />
existence <strong>of</strong> these unique resources is under threat due to developmental activities, <strong>and</strong> population pressure.<br />
This calls for a long term planning for preservation <strong>and</strong> conservation <strong>of</strong> these resources. An updated <strong>and</strong><br />
accurate database that will support research <strong>and</strong> decision is the first step towards this. Use <strong>of</strong> advanced<br />
techniques like Satellite remote sensing, Geographic Information System (GIS) is now essential for accurate<br />
<strong>and</strong> timely spatial database <strong>of</strong> large areas. Space Applications Centre (ISRO) took up this challenging task<br />
under the project “NWIA” (National Wetl<strong>and</strong> Inventory <strong>and</strong> Assessment) sponsored by <strong>Ministry</strong> <strong>of</strong><br />
<strong>Environment</strong> & <strong>Forests</strong>. To account for numerous small yet important wetl<strong>and</strong>s found in the country, mapping<br />
at 1:50,000 scales has been taken up. Two date IRS LISS III data acquired during pre <strong>and</strong> post monsoon<br />
season are used for inventory to account for wet <strong>and</strong> dry season hydrology <strong>of</strong> wetl<strong>and</strong>s. The map outputs<br />
include the status <strong>of</strong> water spread, aquatic vegetation <strong>and</strong> turbidity. Ancillary layers like road/rail, habitations<br />
are also created. Very small wetl<strong>and</strong>s below the mappable unit are also identified <strong>and</strong> shown points. The<br />
results are complied as Atlases <strong>of</strong> wetl<strong>and</strong>s for states/Union Territories <strong>of</strong> India. This Atlas highlights results<br />
for a particular state/UT <strong>and</strong> hopes to improve our underst<strong>and</strong>ing <strong>of</strong> the dynamics <strong>and</strong> distribution <strong>of</strong> wetl<strong>and</strong>s<br />
<strong>and</strong> their status in the area.<br />
I congratulate the team for bringing out this informative atlas <strong>and</strong> sincerely hope that this will serve as a<br />
useful source <strong>of</strong> information to researchers, planners <strong>and</strong> general public.<br />
January 25, 2010<br />
FOREWORD
ACKNOWLEDGEMENTS<br />
The project “National Wetl<strong>and</strong> Inventory & Assessment (NWIA)”, is sponsored by <strong>Ministry</strong> <strong>of</strong> <strong>Environment</strong> &<br />
Forestry (MoEF), Govt. <strong>of</strong> India <strong>and</strong> executed by Space Applications Centre, ISRO, Ahmedabad. We are<br />
grateful to Dr. Ranganath R. Navalgund, Director, Space Applications Centre, for his encouragement to take<br />
up this challenging task <strong>and</strong> formulation <strong>of</strong> the project team for timely implementation. Earnest thanks are<br />
also due to Dr. Jai Singh Parihar, Dy. Director, Earth, Ocean, Atmosphere, Planetary Sciences <strong>and</strong><br />
Applications Area, Space Applications Centre, for providing overall guidance <strong>and</strong> support to the project. The<br />
present Atlas for the state <strong>of</strong> <strong>Andhra</strong> <strong>Pradesh</strong> is a part <strong>of</strong> the “National Wetl<strong>and</strong> Atlas.<br />
This project has benefited from the wisdom <strong>of</strong> many people. It is a pleasure to acknowledge the contributions<br />
made by the wetl<strong>and</strong> experts especially to Pr<strong>of</strong>. C.K. Varshney, Former Dean, School <strong>of</strong> <strong>Environment</strong>al<br />
Sciences, Jawaharlal Nehru University, New Delhi, Pr<strong>of</strong>. A.R. Yousuf, The University <strong>of</strong> Kashmir, Srinagar,<br />
Pr<strong>of</strong>. Pradeeep Shrivastava, Head, Wetl<strong>and</strong> Research Centre, Barakatullah University, Bhopal, Dr. Prikshit<br />
Gautam, Director, WWF-India, Dr. S. Narendra Prasad, Salim Ali Centre for Ornithology <strong>and</strong> Nature,<br />
Coimbtore <strong>and</strong> Dr. R.K. Suri, Additional Director, <strong>Ministry</strong> <strong>of</strong> <strong>Environment</strong> <strong>and</strong> <strong>Forests</strong>, Govt. <strong>of</strong> India, New<br />
Delhi, <strong>and</strong> the database experts from ISRO who participated in the peer Review meeting to finalise the<br />
“Wetl<strong>and</strong> Classification System” followed in this project<br />
We acknowledge the positive role played by 16 th SC-B (St<strong>and</strong>ing Committee on Bioresources <strong>and</strong><br />
<strong>Environment</strong>) <strong>of</strong> NNRMS (National Natural Resources Management System) meeting in formulating this<br />
project. We are extremely thankful to the members <strong>of</strong> the“Steering Committee” <strong>of</strong> the project, under the<br />
chairmanship <strong>of</strong> Dr E J James, Director – Water Institute, Karunya University, for their periodical review,<br />
critical comments <strong>and</strong> appreciation <strong>of</strong> the efforts by the project team. We are thankful to SC-B under the<br />
chairmanship <strong>of</strong> Secretary, MoEF, for periodic review <strong>of</strong> the progress <strong>of</strong> the project <strong>and</strong> guidance towards<br />
timely completion <strong>of</strong> the work. We acknowledge the valuable contributions made by Dr J K Garg, the then<br />
scientist <strong>of</strong> SAC for his active role in formulation <strong>of</strong> this project, co-authoring the procedure manual document.<br />
We are grateful to Dr G V Subramanyam, Adviser, MoEF, for his very active <strong>and</strong> positive role for<br />
implementation <strong>of</strong> the project. We are thankful to Dr Jag Ram, Director, MoEF <strong>and</strong> Dr Harendra Kharwal,<br />
MoEF for their support in budget <strong>and</strong> project management related issues. We acknowledge the support<br />
received from Dr P S Roy, Dy Director, NRSC <strong>and</strong> Dr S Sudhakar, Head, LRD, NRSC in terms <strong>of</strong> valuable<br />
suggestions <strong>and</strong> providing the geo-referenced image <strong>of</strong> NRC-LU&LC project for use as master image in this<br />
project. We are thankful to the “Technical Review” team <strong>of</strong> SAC for critical comments <strong>and</strong> suggestion to<br />
finalise the Atlas.
Space Applications Centre, ISRO, Ahmedabad<br />
Shri T. V. R. Murthy<br />
Shri J. G. Patel<br />
Dr T. S. Singh<br />
PROJECT TEAM<br />
Project Director: Dr. (Mrs) Sushma Panigrahy<br />
A.P. State Remote Sensing Application Centre, Hyderabad<br />
Dr. K. Mruthyunjaya Reddy<br />
Dr. A.V. Subba Rao<br />
M.G. Science Institute, Ahmedabad<br />
Dr. R. D. Shah<br />
Shri Pragnesh Vaishnav<br />
Mrs Yatisha P Vaishnav
1.0 INTRODUCTION<br />
1.1 Wetl<strong>and</strong>s<br />
1.2 Mapping <strong>and</strong> geospatial techniques<br />
1.3 Wetl<strong>and</strong> Inventory <strong>of</strong> India<br />
CONTENTS<br />
2.0 NATIONAL WETLAND INVENTORY AND ASSESSMENT<br />
2.1 Wetl<strong>and</strong> Classification System<br />
2.2 Spatial framework <strong>and</strong> GIS database<br />
3.0 STUDY AREA<br />
4.0 DATA USED<br />
5.0 METHODOLOGY<br />
5.1 Creation <strong>of</strong> spatial framework<br />
5.2 Geo-referencing <strong>of</strong> satellite data<br />
5.3 Mapping <strong>of</strong> wetl<strong>and</strong>s<br />
5.4 Conversion <strong>of</strong> raster (indices) into a vector layer<br />
5.5 Generation <strong>of</strong> reference layers<br />
5.6 Coding <strong>and</strong> attribute scheme<br />
5.7 Map composition <strong>and</strong> output<br />
6.0 ACCURACY ASSESSMENT<br />
6.1 Data verification <strong>and</strong> quality assurance <strong>of</strong> out put digital data files<br />
7.0 WETLANDS OF ANDHRA PRADESH: MAPS AND STATISTICS<br />
7.1 District-wise Wetl<strong>and</strong> Maps <strong>and</strong> Statistics<br />
7.1.1 Adilabad<br />
7.1.2 Nizamabad<br />
7.1.3 Karimnagar<br />
7.1.4 Medak<br />
7.1.5 Hyderabad<br />
7.1.6 Rangareddi<br />
7.1.7 Mehbubnagar<br />
7.1.8 Nalgonda<br />
7.1.9 Warangal<br />
7.1.10 Khammam<br />
7.1.11 Srikakulam<br />
7.1.12 Vizianagaram<br />
7.1.13 Visakhapatnam<br />
7.1.14 East Godavari<br />
7.1.15 West Godavari<br />
7.1.16 Krishna<br />
7.1.17 Guntur<br />
7.1.18 Prakasam<br />
7.1.19 Nellore<br />
7.1.20 Cuddapah<br />
7.1.21 Kurnool<br />
7.1.22 Anantapur<br />
7.1.23 Chittoor<br />
8.0 MAJOR WETLAND TYPES OF ANDHRA PRADESH<br />
9.0 IMPORTANT WETLANDS OF ANDHRA PRADESH<br />
10.0 SOI SHEET-WISE WETLAND MAPS (selected sheets)<br />
References<br />
Annexure–I: Definitions <strong>of</strong> wetl<strong>and</strong> categories used in the project.<br />
Annexure–II: Details <strong>of</strong> district information followed in the atlas
List <strong>of</strong> Figures<br />
Figure 1: Spectral Signature <strong>of</strong> various targets<br />
Figure 2: Various l<strong>and</strong> features as they appear in four spectral b<strong>and</strong>s <strong>and</strong> in a typical three b<strong>and</strong> FCC<br />
Figure 3: Location map<br />
Figure 4: Spatial framework <strong>of</strong> <strong>Andhra</strong> <strong>Pradesh</strong><br />
Figure 5: IRS P6 LISS-III coverage (path-row) <strong>of</strong> <strong>Andhra</strong> <strong>Pradesh</strong><br />
Figure 6: Part <strong>of</strong> <strong>Andhra</strong> <strong>Pradesh</strong> state as seen on IRS P6 LISS-III FCC<br />
Figure 7: Flow chart <strong>of</strong> the methodology used<br />
Figure 8: Steps in the extraction <strong>of</strong> wetl<strong>and</strong> components<br />
Figure 9: Various combinations <strong>of</strong> the indices/spectral b<strong>and</strong>s used to identify wetl<strong>and</strong> component<br />
Figure 10: Type-wise wetl<strong>and</strong> distribution in <strong>Andhra</strong> <strong>Pradesh</strong><br />
Figure 11: District-wise graphical distribution <strong>of</strong> wetl<strong>and</strong>s<br />
List <strong>of</strong> Tables<br />
Table 1: Wetl<strong>and</strong> Classification System <strong>and</strong> coding<br />
Table-2: Satellite data used<br />
Table 3: Qualitative turbidity ratings<br />
Table 4: Summary statistics <strong>of</strong> aerial estimates <strong>of</strong> wetl<strong>and</strong>s in <strong>Andhra</strong> <strong>Pradesh</strong><br />
Table 5: Area estimates <strong>of</strong> wetl<strong>and</strong>s in <strong>Andhra</strong> <strong>Pradesh</strong><br />
Table-6: District-wise wetl<strong>and</strong> area<br />
Table 7: Area estimates <strong>of</strong> wetl<strong>and</strong>s in Adilabad<br />
Table 8: Area estimates <strong>of</strong> wetl<strong>and</strong>s in Nizamabad<br />
Table 9: Area estimates <strong>of</strong> wetl<strong>and</strong>s in Karimnagar<br />
Table 10: Area estimates <strong>of</strong> wetl<strong>and</strong>s in Medak<br />
Table 11: Area estimates <strong>of</strong> wetl<strong>and</strong>s in Hyderabad<br />
Table 12: Area estimates <strong>of</strong> wetl<strong>and</strong>s in Rangareddi<br />
Table 13: Area estimates <strong>of</strong> wetl<strong>and</strong>s in Mehbubnagar<br />
Table 14: Area estimates <strong>of</strong> wetl<strong>and</strong>s in Nalgonda<br />
Table 15: Area estimates <strong>of</strong> wetl<strong>and</strong>s in Warangal<br />
Table 16: Area estimates <strong>of</strong> wetl<strong>and</strong>s in Khammam<br />
Table 17: Area estimates <strong>of</strong> wetl<strong>and</strong>s in Srikakulam<br />
Table 18: Area estimates <strong>of</strong> wetl<strong>and</strong>s in Vizianagaram<br />
Table 19: Area estimates <strong>of</strong> wetl<strong>and</strong>s in Visakhapatnam<br />
Table 20: Area estimates <strong>of</strong> wetl<strong>and</strong>s in East Godavari<br />
Table 21: Area estimates <strong>of</strong> wetl<strong>and</strong>s in West Godavari<br />
Table 22: Area estimates <strong>of</strong> wetl<strong>and</strong>s in Krishna<br />
Table 23: Area estimates <strong>of</strong> wetl<strong>and</strong>s in Guntur<br />
Table 24: Area estimates <strong>of</strong> wetl<strong>and</strong>s in Prakasam<br />
Table 25: Area estimates <strong>of</strong> wetl<strong>and</strong>s in Nellore<br />
Table 26: Area estimates <strong>of</strong> wetl<strong>and</strong>s in Cuddapah<br />
Table 27: Area estimates <strong>of</strong> wetl<strong>and</strong>s in Kurnool<br />
Table 28: Area estimates <strong>of</strong> wetl<strong>and</strong>s in Anantapur<br />
Table 29: Area estimates <strong>of</strong> wetl<strong>and</strong>s in Chittoor<br />
List <strong>of</strong> Plates<br />
Plate 1a-1b : Major wetl<strong>and</strong> types <strong>of</strong> <strong>Andhra</strong> <strong>Pradesh</strong><br />
Plate 2a-2b : Field photographs <strong>and</strong> ground truth data <strong>of</strong> different wetl<strong>and</strong> types in <strong>Andhra</strong> <strong>Pradesh</strong><br />
Plate 3 : Wetl<strong>and</strong> map - 5 km buffer area <strong>of</strong> Kolleru Lake<br />
Plate 4 : IRS LISS-III FCC - 5 km buffer area <strong>of</strong> Kolleru Lake<br />
Plate 5 : Wetl<strong>and</strong> map - 5 km buffer area <strong>of</strong> Krishna Mangroves<br />
Plate 6 : IRS LISS-III FCC - 5 km buffer area <strong>of</strong> Krishna Mangroves<br />
Plate 7 : Wetl<strong>and</strong> map - 5 km buffer area <strong>of</strong> Pakhal Lake<br />
Plate 8 : IRS LISS-III FCC - 5 km buffer area <strong>of</strong> Pakhal Lake<br />
Plate 9 : Wetl<strong>and</strong> map - 5 km buffer area <strong>of</strong> Pulicat Lagoon<br />
Plate 10 : IRS LISS-III FCC - 5 km buffer area <strong>of</strong> Pulicat Lagoon<br />
Plate 11 : Wetl<strong>and</strong> map - 5 km buffer area <strong>of</strong> Hussain Sagar Lake<br />
Plate 12 : IRS LISS-III FCC - 5 km buffer area <strong>of</strong> Hussain Sagar Lake<br />
Plate 13 : Wetl<strong>and</strong> map - 5 km buffer area <strong>of</strong> Nagarjuna Sagar Reservoir<br />
Plate 14 : IRS LISS-III FCC - 5 km buffer area <strong>of</strong> Nagarjuna Sagar Reservoir
1.0 INTRODUCTION<br />
It is increasingly realized that the planet earth is facing grave environmental problems with fast depleting<br />
natural resources <strong>and</strong> threatening the very existence <strong>of</strong> most <strong>of</strong> the ecosystems. Serious concerns are voiced<br />
among scientists, planners, sociologists, politicians, <strong>and</strong> economists to conserve <strong>and</strong> preserve the natural<br />
resources <strong>of</strong> the world. One <strong>of</strong> the difficulties most frequently faced for decision making is lack <strong>of</strong> scientific<br />
data <strong>of</strong> our natural resources. Often the data are sparse or unconvincing, rarely in the form <strong>of</strong> geospatial<br />
database (map), thus open to challenges. Thus, the current thrust <strong>of</strong> every country is to have an appropriate<br />
geospatial database <strong>of</strong> natural resources that is based on unambiguous scientific methods. The wetl<strong>and</strong> atlas<br />
<strong>of</strong> <strong>Andhra</strong> <strong>Pradesh</strong>, which is part <strong>of</strong> the National Wetl<strong>and</strong> Atlas <strong>of</strong> India, is an attempt in this direction.<br />
1.1 Wetl<strong>and</strong>s<br />
Wetl<strong>and</strong>s are one <strong>of</strong> the crucial natural resources. Wetl<strong>and</strong>s are areas <strong>of</strong> l<strong>and</strong> that are either temporarily or<br />
permanently covered by water. This means that a wetl<strong>and</strong> is neither truly aquatic nor terrestrial; it is possible<br />
that wetl<strong>and</strong>s can be both at the same time depending on seasonal variability. Thus, wetl<strong>and</strong>s exhibit<br />
enormous diversity according to their genesis, geographical location, water regime <strong>and</strong> chemistry, dominant<br />
plants <strong>and</strong> soil or sediment characteristics. Because <strong>of</strong> their transitional nature, the boundaries <strong>of</strong> wetl<strong>and</strong>s<br />
are <strong>of</strong>ten difficult to define. Wetl<strong>and</strong>s do, however, share a few attributes common to all forms. Of these,<br />
hydrological structure (the dynamics <strong>of</strong> water supply, throughput, storage <strong>and</strong> loss) is most fundamental to<br />
the nature <strong>of</strong> a wetl<strong>and</strong> system. It is the presence <strong>of</strong> water for a significant period <strong>of</strong> time which is principally<br />
responsible for the development <strong>of</strong> a wetl<strong>and</strong>. One <strong>of</strong> the first widely used classifications systems, devised by<br />
Cowardin et al, (1979), was associated to its hydrological, ecological <strong>and</strong> geological aspects, such as: marine<br />
(coastal wetl<strong>and</strong>s including rock shores <strong>and</strong> coral reefs, estuarine (including deltas, tidal marshes, <strong>and</strong><br />
mangrove swamps), lacustarine (lakes), riverine (along rivers <strong>and</strong> streams), palustarine ('marshy'- marshes,<br />
swamps <strong>and</strong> bogs). Given these characteristics, wetl<strong>and</strong>s support a large variety <strong>of</strong> plant <strong>and</strong> animal species<br />
adapted to fluctuating water levels, making the wetl<strong>and</strong>s <strong>of</strong> critical ecological significance. Utility wise,<br />
wetl<strong>and</strong>s directly <strong>and</strong> indirectly support millions <strong>of</strong> people in providing services such as food, fiber <strong>and</strong> raw<br />
materials, storm <strong>and</strong> flood control, clean water supply, scenic beauty <strong>and</strong> educational <strong>and</strong> recreational<br />
benefits. The Millennium Ecosystem Assessment estimates conservatively that wetl<strong>and</strong>s cover seven percent<br />
<strong>of</strong> the earth’s surface <strong>and</strong> deliver 45% <strong>of</strong> the world’s natural productivity <strong>and</strong> ecosystem services <strong>of</strong> which the<br />
benefits are estimated at $20 trillion a year (Source : www.MAweb.org). The Millennium Assessment (MA)<br />
uses the following typology to categories ecosystem services:<br />
Provisioning services: The resources or products provided by ecosystems, such as food, raw materials<br />
(wood), genetic resources, medicinal resources, ornamental resources (skin, shells, flowers).<br />
Regulating services: Ecosystems maintain the essential ecological processes <strong>and</strong> life support systems, like<br />
gas <strong>and</strong> climate regulation, water supply <strong>and</strong> regulation, waste treatment, pollination, etc.<br />
Cultural <strong>and</strong> Amenity services: Ecosystems are a source <strong>of</strong> inspiration to human culture <strong>and</strong> education<br />
throughout recreation, cultural, artistic, spiritual <strong>and</strong> historic information,<br />
science <strong>and</strong> education.<br />
Supporting services: Ecosystems provide habitat for flora <strong>and</strong> fauna in order to maintain biological <strong>and</strong><br />
genetic diversity.<br />
Despite these benefits, wetl<strong>and</strong>s are the first target <strong>of</strong> human interference <strong>and</strong> are among the most<br />
threatened <strong>of</strong> all natural resources. Around 50% <strong>of</strong> the earth’s wetl<strong>and</strong>s is estimated to already have<br />
disappeared worldwide over the last hundred years through conversion to industrial, agricultural <strong>and</strong><br />
residential developments. Even in current scenario, when the ecosystem services provided by wetl<strong>and</strong>s are<br />
better understood - degradation <strong>and</strong> conversion <strong>of</strong> wetl<strong>and</strong>s continues. This is largely due to the fact that the<br />
‘full value’ <strong>of</strong> ecosystem functions is <strong>of</strong>ten ignored in policy-making, plans <strong>and</strong> corporate evaluations <strong>of</strong><br />
development projects.<br />
1.2 Mapping <strong>and</strong> Geospatial technique<br />
To conserve <strong>and</strong> manage wetl<strong>and</strong> resources, it is important to have inventory <strong>of</strong> wetl<strong>and</strong>s <strong>and</strong> their<br />
catchments. The ability to store <strong>and</strong> analyse the data is essential. Digital maps are very powerful tools to<br />
achieve this. Maps relating the feature to any given geographical location has a strong visual impact. Maps<br />
are thus essential for monitoring <strong>and</strong> quantifying change over time scale, assist in decision making. The<br />
technique used in the preparation <strong>of</strong> map started with ground survey. The Survey <strong>of</strong> India (SOI) topographic<br />
maps are the earliest true maps <strong>of</strong> India showing various l<strong>and</strong> use/cover classes including wetl<strong>and</strong>s. Recent<br />
years have seen advances in mapping technique to prepare maps with much more information. Of particular<br />
importance is the remote sensing <strong>and</strong> geographic information system (GIS) technique. Remote sensing is<br />
1
now recognized as an essential tool for viewing, analyzing, characterizing, <strong>and</strong> making decisions about l<strong>and</strong>,<br />
water <strong>and</strong> atmospheric components.<br />
From a general perspective, remote sensing is the science <strong>of</strong> acquiring <strong>and</strong> analyzing information about<br />
objects or phenomena from a distance (Jensen, 1986; Lilles<strong>and</strong> <strong>and</strong> Keifer, 1987). Today, we define satellite<br />
remote sensing as the use <strong>of</strong> satellite borne sensors to observe, measure, <strong>and</strong> record the electromagnetic<br />
radiation (EMR) reflected or emitted by the earth <strong>and</strong> its environment for subsequent analysis <strong>and</strong> extraction<br />
<strong>of</strong> information. EMR sensors includes visible light, near-, mid- <strong>and</strong> far-infrared (thermal), microwave, <strong>and</strong><br />
long-wave radio energy. The capability <strong>of</strong> multiple sources <strong>of</strong> information is unique to remote sensing. Of<br />
specific advantage is the spectral, temporal, <strong>and</strong> spatial resolution. Spectral resolution refers to the width or<br />
range <strong>of</strong> each spectral b<strong>and</strong> being recorded. Since each target affects different wavelengths <strong>of</strong> incident<br />
energy differently, they are absorbed, reflected or transmitted in different proportions. Currently, there are<br />
many l<strong>and</strong> resource remote sensing satellites that have sensors operating in the green, red, near infrared<br />
<strong>and</strong> short wave Infra red regions <strong>of</strong> the electromagnetic spectrum giving a definite spectral signature <strong>of</strong><br />
various targets due to difference in radiation absorption <strong>and</strong> reflectance <strong>of</strong> targets. These sensors are <strong>of</strong><br />
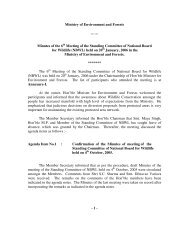
common use for l<strong>and</strong> cover studies, including wetl<strong>and</strong>s. Figure 1 shows typical spectral signature <strong>of</strong> few<br />
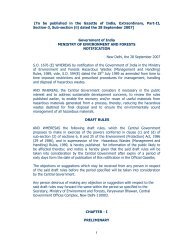
targets from green to SWIR region. Converted to image, in a typical false colour composite (FCC) created<br />
using NIR, red <strong>and</strong> green b<strong>and</strong>s assigned as red, green <strong>and</strong> blue colour, the features become very distinct as<br />
shown in Figure 2. In FCC, the vegetation thus appears invariably red (due to high reflection in NIR from<br />
green leaves).<br />
Since the early 1960s, numerous satellite sensors have been launched into orbit to observe <strong>and</strong> monitor the<br />
earth <strong>and</strong> its environment. Most early satellite sensors acquired data for meteorological purposes. The advent<br />
<strong>of</strong> earth resources satellite sensors (those with a primary objective <strong>of</strong> mapping <strong>and</strong> monitoring l<strong>and</strong> cover)<br />
occurred, when the first L<strong>and</strong>sat satellite was launched in July 1972. Currently, more than a dozen orbiting<br />
satellites <strong>of</strong> various types provide data crucial to improving our knowledge <strong>of</strong> the earth’s atmosphere, oceans,<br />
ice <strong>and</strong> snow, <strong>and</strong> l<strong>and</strong>. Of particular interest to India is the indigenous series <strong>of</strong> satellites called Indian<br />
Remote Sensing satellites (IRS-Series). Since the launch <strong>of</strong> the first satellite IRS 1A in 1987, India has now a<br />
number <strong>of</strong> satellites providing data in multi-spectral b<strong>and</strong>s with different spatial resolution. IRS<br />
P6/RESOURCESAT 1 is the current generation satellite that provides multi-spectral images in spatial<br />
resolution <strong>of</strong> 5.8 m (LISS IV), 23.5 m (LISS III) <strong>and</strong> 56m (AWiFS). Over the past few decades, Indian remote<br />
sensing data has been successfully used in various fields <strong>of</strong> natural resources ( Navalgund et al, 2002 ).<br />
Development <strong>of</strong> technologies like Geographic Information System (GIS) has enhanced the use <strong>of</strong> RS data to<br />
obtain accurate geospatial database. GIS specialises in h<strong>and</strong>ling related, spatially referenced data, combining<br />
mapped information with other data <strong>and</strong> acts as analytical tool for research <strong>and</strong> decision making. During the<br />
past few decades, technological advances in the field <strong>of</strong> satellite remote sensing (RS) sensors, computerized<br />
mapping techniques, global positioning system (GPS) <strong>and</strong> geographic information system (GIS) has<br />
enhanced the ability to capture more detailed <strong>and</strong> timely information about the natural resources at various<br />
scales catering to local, regional, national <strong>and</strong> global level study.<br />
Figure 1: Spectral Signature <strong>of</strong> various targets<br />
2
B-1: Green B-2: Red<br />
LISS III FCC (G R NIR)<br />
B-3: NIR B-4: SWIR<br />
Figure 2: Various l<strong>and</strong> features as they appear in four spectral b<strong>and</strong>s <strong>and</strong> in a typical three b<strong>and</strong> FCC<br />
3
1.3 Wetl<strong>and</strong> Inventory <strong>of</strong> India<br />
India with its large geographical spread supports large <strong>and</strong> diverse wetl<strong>and</strong> classes, some <strong>of</strong> which are<br />
unique. Wetl<strong>and</strong>s, variously estimated to be occupying 1-5 per cent <strong>of</strong> geographical area <strong>of</strong> the country,<br />
support about a fifth <strong>of</strong> the known biodiversity. Like any other place in the world, there is a looming threat to<br />
the aquatic biodiversity <strong>of</strong> the Indian wetl<strong>and</strong>s as they are <strong>of</strong>ten under a regime <strong>of</strong> unsustainable human<br />
pressures. Sustainable management <strong>of</strong> these assets therefore is highly relevant. Realising this, Govt. <strong>of</strong> India<br />
has initiated many appropriate steps in terms <strong>of</strong> policies, programmes <strong>and</strong> plans for the preservation <strong>and</strong><br />
conservation <strong>of</strong> these ecosystems. India is a signatory to the Ramsar Convention for management <strong>of</strong><br />
wetl<strong>and</strong>, for conserving their biodiversity <strong>and</strong> wise use extending its scope to a wide variety <strong>of</strong> habitats,<br />
including rivers <strong>and</strong> lakes, coastal lagoons, mangroves, peatl<strong>and</strong>s, coral reefs, <strong>and</strong> numerous human-made<br />
wetl<strong>and</strong>, such as fish <strong>and</strong> shrimp ponds, farm ponds, irrigated agricultural l<strong>and</strong>, salt pans reservoirs, gravel<br />
pits, sewage farms, <strong>and</strong> canals. The <strong>Ministry</strong> <strong>of</strong> <strong>Environment</strong> <strong>and</strong> <strong>Forests</strong> has identified a number <strong>of</strong> wetl<strong>and</strong>s<br />
for conservation <strong>and</strong> management under the National Wetl<strong>and</strong> Conservation Programme <strong>and</strong> some financial<br />
assistance is being provided to State Governments for various conservation activities through approval <strong>of</strong> the<br />
Management Action Plans. The need to have an updated map database <strong>of</strong> wetl<strong>and</strong>s that will support such<br />
actions has long been realized.<br />
Mapping requires a st<strong>and</strong>ard classification system. Though there are many classification systems for<br />
wetl<strong>and</strong>s in the world, the Ramsar classification system is the most preferred one. The 1971 Ramsar<br />
Convention on Wetl<strong>and</strong>s <strong>of</strong> International Importance especially as Waterfowl Habitat is the oldest<br />
conservation convention. It owes its name to its place <strong>of</strong> adoption in Iran. It came into being due to serious<br />
decline in populations <strong>of</strong> waterfowl (mainly ducks) <strong>and</strong> conservation <strong>of</strong> habitats <strong>of</strong> migratory waterfowl.<br />
Convention provides framework for the conservation <strong>and</strong> ‘wise use’ <strong>of</strong> wetl<strong>and</strong> biomes. Ramsar convention is<br />
the first modern global intergovernmental treaty on conservation <strong>and</strong> wise use <strong>of</strong> natural resources<br />
(www.ramsar.org). Ramsar convention entered into force in 1975. Under the text <strong>of</strong> the Convention (Article<br />
1.1) wetl<strong>and</strong>s are defined as:<br />
“areas <strong>of</strong> marsh, fen, peatl<strong>and</strong> or water, whether natural or artificial, permanent or temporary, with water that<br />
is static or flowing, fresh, brackish or salt, including areas <strong>of</strong> marine water the depth <strong>of</strong> which at low tide does<br />
not exceed six meters”.<br />
In addition, the Convention (Article 2.1) provides that wetl<strong>and</strong>s:<br />
“may incorporate riparian <strong>and</strong> coastal zones adjacent to the wetl<strong>and</strong>s, <strong>and</strong> isl<strong>and</strong>s or bodies <strong>of</strong> marine water<br />
deeper than six meters at low tide lying within the wetl<strong>and</strong>s”.<br />
The first scientific mapping <strong>of</strong> wetl<strong>and</strong>s <strong>of</strong> India was carried out during1992-93 by Space Applications Centre<br />
(ISRO), Ahmedabad, at the behest <strong>of</strong> the <strong>Ministry</strong> <strong>of</strong> <strong>Environment</strong> <strong>and</strong> <strong>Forests</strong> (MoEF), Govt. <strong>of</strong> India using<br />
remote sensing data from Indian Remote Sensing satellites (IRS-Series). The mapping was done at<br />
1:250,000 scale using IRS 1A LISS-I/II data <strong>of</strong> 1992-93 timeframe under the Nation-wide Wetl<strong>and</strong> Mapping<br />
Project. Since, no suitable wetl<strong>and</strong> classification existed for comprehensive inventory <strong>of</strong> wetl<strong>and</strong>s in the<br />
country at that time, the project used a classification system based on Ramsar Convention definition <strong>of</strong><br />
wetl<strong>and</strong>s. The classification considers all parts <strong>of</strong> a water mass including its ecotonal area as wetl<strong>and</strong>. In<br />
addition, fish <strong>and</strong> shrimp ponds, saltpans, reservoirs, gravel pits were also included as wetl<strong>and</strong>s.<br />
This inventory put the wetl<strong>and</strong> extent (inl<strong>and</strong> as well as coastal) at about 8.26 million ha. (Garg et al, 1998).<br />
These estimates (24 categories) do not include rice/paddy fields, rivers, canals <strong>and</strong> irrigation channels.<br />
Further updating <strong>of</strong> wetl<strong>and</strong> maps <strong>of</strong> India was carried out by SAC using IRS P6/Resourcesat AWiFS data <strong>of</strong><br />
2004-05 at 1:250000 scale. In recent years, a conservation atlas has been brought out by Salim Ali Centre for<br />
Ornithology <strong>and</strong> Natural History (SACON, 2004), which provide basic information required by stakeholders in<br />
both wetl<strong>and</strong> habitat <strong>and</strong> species conservation. Space Applications Centre has carried out many pilot projects<br />
for development <strong>of</strong> GIS based wetl<strong>and</strong> information system (Patel et al, 2003) <strong>and</strong> Lake Information system<br />
(Singh et al, 2003).<br />
4
2.0 NATIONAL WETLAND INVENTORY AND ASSESSMENT (NWIA) PROJECT<br />
Realising the importance <strong>of</strong> many small wetl<strong>and</strong>s that dot the Indian l<strong>and</strong>scape, it has been unanimously felt<br />
that inventory <strong>of</strong> the wetl<strong>and</strong>s at 1:50,000 scale is essential. The task seemed challenging in view <strong>of</strong> the vast<br />
geographic area <strong>of</strong> our country enriched with diverse wetl<strong>and</strong> classes. Space Applications Centre with its<br />
experience in use <strong>of</strong> RS <strong>and</strong> GIS in the field <strong>of</strong> wetl<strong>and</strong> studies, took up this challenging task. This is further<br />
strengthened by the fact that guidelines to create geospatial framework, codification scheme, data base<br />
structure etc. for natural resources survey has already been well established by the initiative <strong>of</strong> ISRO under<br />
various national level mapping projects. With this strength, the National Wetl<strong>and</strong> Inventory <strong>and</strong> Assessment<br />
(NWIA) project was formulated by SAC, which was approved <strong>and</strong> funded by MoEF.<br />
The main objectives <strong>of</strong> the project are:<br />
• To map the wetl<strong>and</strong>s on 1:50000 scale using two date (pre <strong>and</strong> post monsoon) IRS LISS III digital data<br />
following a st<strong>and</strong>ard wetl<strong>and</strong> classification system.<br />
• Integration <strong>of</strong> ancillary theme layers ( road, rail, settlements, drainage, administrative boundaries)<br />
• Creation <strong>of</strong> a seamless database <strong>of</strong> the states <strong>and</strong> country in GIS environment.<br />
• Preparation <strong>of</strong> State-wise wetl<strong>and</strong> atlases<br />
The project was initiated during 2007. The first task was to have a classification system that can be used by<br />
different types <strong>of</strong> users while amenable to database. An expert/peer group was formed <strong>and</strong> the peer review<br />
was held at SAC on June 2007 where wetl<strong>and</strong> experts <strong>and</strong> database experts participated <strong>and</strong> finalized the<br />
classification system. It was agreed to follow the classification system that has been used for the earlier<br />
project <strong>of</strong> 1:250,000 scale, with slight modification. Modified National Wetl<strong>and</strong> Classification system for<br />
wetl<strong>and</strong> delineation <strong>and</strong> mapping comprise 19 wetl<strong>and</strong> classes which are organized under a Level III<br />
hierarchical system. The definition <strong>of</strong> each wetl<strong>and</strong> class <strong>and</strong> its interpretation method was finalized. The<br />
technical/procedure manual was prepared as the st<strong>and</strong>ard guideline for the project execution across the<br />
country (Garg <strong>and</strong> Patel, 2007). The present atlas is part <strong>of</strong> the national level data base <strong>and</strong> deals with the<br />
state <strong>of</strong> <strong>Andhra</strong> <strong>Pradesh</strong>.<br />
2.1 Wetl<strong>and</strong> Classification System<br />
In the present project, Modified National Wetl<strong>and</strong> Classification system is used for wetl<strong>and</strong> delineation <strong>and</strong><br />
mapping comprising 19 wetl<strong>and</strong> classes which are organized under a Level III hierarchical system (Table 1).<br />
Level one has two classes: inl<strong>and</strong> <strong>and</strong> coastal, these are further bifurcated into two categories as: natural <strong>and</strong><br />
man-made under which the 19 wetl<strong>and</strong> classes are suitably placed. Two date data pertaining to pre-monsoon<br />
<strong>and</strong> post monsoon was used to confirm the classes. Wetl<strong>and</strong>s put to agriculture use in any <strong>of</strong> the two dates<br />
are not included as wetl<strong>and</strong> class. Definitions <strong>of</strong> wetl<strong>and</strong> categories used in the project is given in Annexure-I.<br />
2.2.1 Spatial Framework <strong>and</strong> GIS Database<br />
The National Spatial Framework) (NSF) has been used as the spatial framework to create the database<br />
(Anon. 2007). The database design <strong>and</strong> creation st<strong>and</strong>ard suggested by NRDB/NNRMS guidelines is<br />
followed. Feature codification scheme for every input element has been worked out keeping in view the<br />
nationwide administrative as well as natural hierarchy (State-district- within the feature class for each <strong>of</strong> the<br />
theme. All data elements are given a unique name, which are self explanatory with short forms.<br />
Following wetl<strong>and</strong> layers are generated for each inl<strong>and</strong> wetl<strong>and</strong>:<br />
Wetl<strong>and</strong> extent: As wetl<strong>and</strong>s encompass open water, aquatic vegetation (submerged, floating <strong>and</strong><br />
emergent), the wetl<strong>and</strong> boundary should ideally include all these. Satellite image gives a clear signature <strong>of</strong><br />
the wetl<strong>and</strong> extent from the imprint <strong>of</strong> water spread over the years.<br />
Water spread: There are two layers representing post-monsoon <strong>and</strong> pre-monsoon water spread during the<br />
year <strong>of</strong> data acquisition.<br />
5
Aquatic vegetation spread: The presence <strong>of</strong> vegetation in wetl<strong>and</strong>s provides information about its tropic<br />
condition. As is known, aquatic vegetation is <strong>of</strong> four types, viz. benthic, submerged, floating, <strong>and</strong><br />
emergent. It is possible to delineate last two types <strong>of</strong> vegetation using optical remote sensing data.<br />
A qualitative layer pertaining to presence <strong>of</strong> vegetation is generated for each season (as manifested on<br />
pre-monsoon <strong>and</strong> post-monsoon imagery).<br />
Turbidity level <strong>of</strong> open water: A layer pertaining to a qualitative turbidity rating is generated. Three<br />
qualitative turbidity ratings ( low, medium <strong>and</strong> high) is followed for pre <strong>and</strong> post-monsoon turbidity <strong>of</strong> lakes,<br />
reservoirs, barrages <strong>and</strong> other large wetl<strong>and</strong>s.<br />
Small wetl<strong>and</strong>s (smaller than minimum mappable unit) are mapped as point features.<br />
Base layers like major road network, railway, settlements, <strong>and</strong> surface drainage are created (either from<br />
the current image or taken from other project data base).<br />
Table 1: Wetl<strong>and</strong> Classification System <strong>and</strong> coding<br />
Wettcode* Level I Level II Level III<br />
1000 Inl<strong>and</strong> Wetl<strong>and</strong>s<br />
1100 Natural<br />
1101 Lakes<br />
1102 Ox-Bow Lakes/ Cut-Off Me<strong>and</strong>ers<br />
1103 High altitude Wetl<strong>and</strong>s<br />
1104 Riverine Wetl<strong>and</strong>s<br />
1105 Waterlogged<br />
1106 River/stream<br />
1200 Man-made<br />
1201 Reservoirs/ Barrages<br />
1202 Tanks/Ponds<br />
1203 Waterlogged<br />
1204 Salt pans<br />
2000 Coastal Wetl<strong>and</strong>s<br />
2100 Natural<br />
2101 Lagoons<br />
2102 Creeks<br />
2103 S<strong>and</strong>/Beach<br />
2104 Intertidal mud flats<br />
2105 Salt Marsh<br />
2106 Mangroves<br />
2107 Coral Reefs<br />
2200 Man-made<br />
2201 Salt pans<br />
2202 Aquaculture ponds<br />
* Wetl<strong>and</strong> type code<br />
6
3.0 STUDY AREA<br />
The state <strong>of</strong> <strong>Andhra</strong> <strong>Pradesh</strong> lies between 12 0 41’ 00” <strong>and</strong> 23 0 00’ 00” N latitudes <strong>and</strong> 77 0 00’ 00” <strong>and</strong><br />
84 0<br />
40’ 00” E longitudes. It is bounded by Maharashtra, Chhattisgarh <strong>and</strong> Orissa in the north, the Bay <strong>of</strong><br />
Bengal in the east, Tamil Nadu in the south <strong>and</strong> Karanataka in the west (Figure 3). It is situated on the<br />
Deccan plateau in south India. As per the 2001 census, the state population is 76.21 million <strong>and</strong> the<br />
geographical area is 275045 hectares. It is ranked fourth in population <strong>and</strong> fifth in area in India. The state is<br />
largely dependent on agriculture. About 70 % <strong>of</strong> the total population depends on farming <strong>and</strong> it is one <strong>of</strong><br />
India’s main rice producing states.<br />
Figure 3: Location Map<br />
The state has twenty three districts broadly divided into three geographic regions – the coastal region<br />
generally called <strong>Andhra</strong> comprises <strong>of</strong> nine districts, the interior region known as Rayalaseema comprises <strong>of</strong><br />
four districts <strong>and</strong> Telangana region comprises <strong>of</strong> ten districts.<br />
The state has three main physiographic regions namely; a) the coastal plain to the east extending from the<br />
Bay <strong>of</strong> Bengal to the mountain ranges, the mountain ranges themselves, b) the Eastern Ghats which form the<br />
western flank <strong>of</strong> the coastal plain, <strong>and</strong> c) the plateau to the west <strong>of</strong> the Ghats. The coastal plain runs almost<br />
the entire length <strong>of</strong> the state <strong>and</strong> is watered by several rivers, flowing from west to east through the hills into<br />
the bay. The deltas formed by the Rivers Godavari <strong>and</strong> Krishna make up the central part <strong>of</strong> the plains, an<br />
area <strong>of</strong> fertile alluvial soil.<br />
A wide variety <strong>of</strong> geological formations occur in <strong>Andhra</strong> <strong>Pradesh</strong>. All kinds <strong>of</strong> rocks from the oldest Archean to<br />
the recent Alluvium are found in the state. Major portion <strong>of</strong> the peninsular shield lies in the state. The<br />
stratigraphic units found in the state are Peninsular Gneiss complex, Dharwars, Eastern Ghats, Kadapa super<br />
group, Pakhals, Bhimas, Pengana, Kurnool group, Gondwana super group, Deccan Traps, Tertiary<br />
formations <strong>and</strong> Quartenary. The types <strong>of</strong> rocks found in state are volcanic rocks, charnacolites, granite rocks,<br />
Kurnool formations, dolomites <strong>and</strong> Kadapa stones.<br />
<strong>Andhra</strong> <strong>Pradesh</strong> is endowed with a variety <strong>of</strong> soils ranging from coastal s<strong>and</strong>s to highly fertile deltaic alluvium.<br />
The six major soil groups present in the state are red soils, black soils, alluvial soils, coastal s<strong>and</strong>s, laterite<br />
<strong>and</strong> lateritic soils, <strong>and</strong> problem soils which include saline <strong>and</strong> alkali soils. Red soils occupy over 66 % <strong>of</strong> the<br />
cultivated area <strong>and</strong> are mostly situated in Rayalaseema districts. These soils have a low nutrient status. Red<br />
soils can be sub-classified as Dubba soils (loamy soils to s<strong>and</strong>y loams), Chalkas (s<strong>and</strong>y loam soils), S<strong>and</strong>y<br />
7
clay loams, Loams including silty soils, Deep loamy soils <strong>and</strong> S<strong>and</strong>y loams with clay subsoil. Chalkas occur<br />
mostly in Telangana districts while red loams combined with s<strong>and</strong>s occur in the upl<strong>and</strong> regions <strong>of</strong> coastal<br />
districts. Black soils cover nearly 25 % <strong>of</strong> the cultivated area <strong>and</strong> are generally associated with poor drainage.<br />
They are also called as Regurs or vertisols <strong>and</strong> are <strong>of</strong> two types - in-situ <strong>and</strong> transported. The in-situ soils<br />
occur in the coastal districts <strong>and</strong> parts <strong>of</strong> Telangana <strong>and</strong> Rayalaseema districts <strong>and</strong> the transported soils<br />
occur in the valley regions <strong>of</strong> the slopes with calcareous concentrations. The in-situ soils are generally heavy<br />
in texture <strong>and</strong> high in salt concentration. The alluvial loamy soils found in Krishna <strong>and</strong> Godavari deltas cover 5<br />
% <strong>of</strong> the cultivated area. The coastal s<strong>and</strong>s occupy only 3 % while the remaining 1 % is covered by laterite<br />
soils in certain pockets <strong>of</strong> the state.<br />
The state has a tropical climate with moderate diffusion to sub-tropical weather. Semi humid conditions<br />
prevail in the coastal areas. The average annual rainfall for the state is 940 mm that varies considerably from<br />
715 mm in Rayalaseema, 907 mm in Telangana <strong>and</strong> 1078 mm in <strong>Andhra</strong>. The average annual temperature is<br />
29 0<br />
C. The state is divided into seven zones based on agro-climatic conditions. These are: Krishna-Godavari<br />
Zone, North Coastal Zone, Southern Zone, Northern Telangana Zone, Southern Telangana Zone, Scarce<br />
Rainfall Zone <strong>of</strong> Rayalaseema <strong>and</strong> High Altitude Tribal Areas.<br />
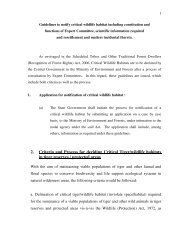
As mentioned earlier, the <strong>Andhra</strong> <strong>Pradesh</strong> state has 23 districts <strong>and</strong> is covered by 462 Survey <strong>of</strong> India (SOI)<br />
topographical maps on 1:50,000 scale that form the spatial frame work for mapping (Figure 4) prepared using<br />
15’ x 15’ grid. A detail <strong>of</strong> district information followed in the atlas is given in Annexure-II.<br />
Figure 4: Spatial framework <strong>of</strong> <strong>Andhra</strong> <strong>Pradesh</strong><br />
Figure 4 : Spatial Framework <strong>of</strong> <strong>Andhra</strong> <strong>Pradesh</strong><br />
8
4.0 DATA USED<br />
Remote sensing data<br />
IRS P6 LISS III data was used to map the wetl<strong>and</strong>s. IRS P6 LISS III provides data in 4 spectral b<strong>and</strong>s; green,<br />
red, Near Infra Red (NIR) <strong>and</strong> Short wave Infra Red (SWIR), with 23.5 m spatial resolution <strong>and</strong> 24 day repeat<br />
cycle. The spatial resolution is suitable for 1:50,000 scale mapping. The state <strong>of</strong> <strong>Andhra</strong> <strong>Pradesh</strong> is covered<br />
in 27 IRS LISS III scene (Figure 5). Two-date data, one acquired during October/November <strong>and</strong> another<br />
during April/May were used to capture the post-monsoon <strong>and</strong> pre-monsoon hydrological variability <strong>of</strong> the<br />
wetl<strong>and</strong>s respectively (Table-2). Figure 6 shows the overview <strong>of</strong> the part <strong>of</strong> <strong>Andhra</strong> <strong>Pradesh</strong> as seen in the<br />
LISS III FCC <strong>of</strong> post- monsoon pre-monsoon data respectively.<br />
Ground truth data<br />
99-62<br />
99-63<br />
99-61<br />
99-60<br />
100-58<br />
100-59<br />
100-60<br />
100-61<br />
100-62<br />
100-63<br />
100-64<br />
99-59<br />
99-58<br />
101-59<br />
101-60<br />
101-61<br />
101-62<br />
101-63<br />
101-64<br />
102-59<br />
102-60<br />
102-61<br />
102-62<br />
102-63<br />
102-64<br />
103-59<br />
103-60<br />
103-61<br />
100-62<br />
104-59<br />
104-60<br />
100-61<br />
Figure 5: IRS P6 LISS-III coverage (path-row) <strong>of</strong> <strong>Andhra</strong> <strong>Pradesh</strong><br />
105-59<br />
105-60<br />
Remote sensing techniques require certain amount <strong>of</strong> field observation called “ground truth” in order to<br />
deduce meaningful information. Such work involves visiting a number <strong>of</strong> test sites, usually taking the satellite<br />
data. The location <strong>of</strong> the features is recorded using the GPS. The st<strong>and</strong>ard pr<strong>of</strong>orma as per the NWIA manual<br />
was used to record the field data. Field photographs are also taken to record the water quality (qualitative),<br />
status <strong>of</strong> aquatic vegetation <strong>and</strong> water spread. All field data collection work has been done during October<br />
<strong>and</strong> November 2008.<br />
Other data<br />
Survey <strong>of</strong> India (SOI) topographical maps were used for reference purpose. Lineage data <strong>of</strong> National Wetl<strong>and</strong><br />
Mapping at 1:250,000 scale was used for reference.<br />
9
Sr. No Resourcesat LISS III<br />
Table-2: Satellite data used<br />
Post-monsoon Pre-monsoon<br />
1 099-58 October 25, 2006 May 05, 2007<br />
2 099-59 October 25, 2006 April 11, 2007<br />
3 099-60 October 25, 2006<br />
4 099-61 January 05, 2007 April 11, 2007<br />
5 099-62 - March 08, 2007<br />
5 099-63 January 05, 2007 April 11, 2007<br />
6 100-59 January 10, 2007 June 03, 2007<br />
7 100-60 February 27, 2007 March 23, 2007<br />
8 100-61 February 27, 2007 May 10, 2007<br />
9 100-62 February 27, 2007 May 10, 2007<br />
10 100-63 February 27, 2007 May 10, 2007<br />
11 100-64 - May 23, 2007<br />
12 101-59 February 13, 2006 May 15, 2007<br />
13 101-60 February 13, 2006 June 06, 2007<br />
14 101-61 October 11, 2006 March 28, 2007<br />
15 101-62 October 11, 2006 May 15, 2007<br />
16 101-63 February 13, 2006 April 02, 2006<br />
17 101-64 February 08, 2007 May 15,2007<br />
18 102-60 December 27, 2006 May 20, 2007<br />
19 102-61 December 27, 2006 May 20, 2007<br />
20 102-62 January 25, 2006 April 07, 2006<br />
21 102-63 January 25, 2006 June 26, 2007<br />
22 102-64 January 25, 2006 May 20, 2007<br />
23 103-60 December 08, 2006 April 12, 2006<br />
24 103-61 December 08, 2006 March 08, 2008<br />
25 104-59 November 19, 2006 April 12, 2007<br />
26 104-60 November 19, 2006 April 12, 2007<br />
27 105-59 December 18, 2006 April 22, 2006<br />
28 105-60 December 18, 2006 April 04, 2007<br />
10
May 20, 2007<br />
November 11, 2006<br />
Figure 6: Part <strong>of</strong> <strong>Andhra</strong> <strong>Pradesh</strong> state as seen on IRS P6 LISS-III FCC<br />
11
5.0 METHODOLOGY<br />
The methodology to create the state level atlas <strong>of</strong> wetl<strong>and</strong>s is adhered to NWIA technical guidelines <strong>and</strong><br />
procedure manual (Garg <strong>and</strong> Patel, 2007). The overview <strong>of</strong> the steps used is shown in Figure 6. Salient<br />
features <strong>of</strong> methodology given as under:<br />
• Generation <strong>of</strong> spatial framework in GIS environment for database creation <strong>and</strong> organisation.<br />
• Geo-referencing <strong>of</strong> satellite data<br />
• Identification <strong>of</strong> wetl<strong>and</strong> classes as per the classification system given in NWIA manual <strong>and</strong> mapping <strong>of</strong><br />
the classes using a knowledge based digital classification <strong>and</strong> on-screen interpretation<br />
• Generation <strong>of</strong> base layers (rail, road network, settlements, drainage, administrative boundaries) from<br />
satellite image <strong>and</strong> ancillary data.<br />
• Mosaicing/edge matching to create district <strong>and</strong> state level database.<br />
• Coding <strong>of</strong> the wetl<strong>and</strong>s following the st<strong>and</strong>ard classification system <strong>and</strong> codification as per NWIA<br />
manual.<br />
• Preparation <strong>of</strong> map compositions <strong>and</strong> generation <strong>of</strong> statistics<br />
• Outputs on A3 size prints <strong>and</strong> charts for atlas.<br />
Work was carried out using ERDAS Imagine, Arc/Info <strong>and</strong> Arcgis s<strong>of</strong>twares.<br />
5.1 Creation <strong>of</strong> spatial framework<br />
This is the most important task as the state forms a part <strong>of</strong> the national frame work <strong>and</strong> is covered in multiple<br />
map sheets. To create NWIA database, NNRMS/NRDB st<strong>and</strong>ards are followed <strong>and</strong> four corners <strong>of</strong> the<br />
1:50,000 (15’ x 15’) grids are taken as the tics or registration points to create each map taking master grid as<br />
the reference. Spatial framework details are given in NWIA manual (Garg <strong>and</strong> Patel 2007). The spatial<br />
framework for <strong>Andhra</strong> <strong>Pradesh</strong> state is shown in Figure 4.<br />
5.2 Geo-referencing <strong>of</strong> satellite data<br />
In this step the raw satellite images were converted to specific map projection using geometric correction.<br />
This is done using archived geometrically corrected LISS III data (ISRO-NRC-l<strong>and</strong> use / l<strong>and</strong> cover project ).<br />
St<strong>and</strong>ard image processing s<strong>of</strong>tware was used for geo-referencing. First one date data was registered with<br />
the archived image. The second date data was then registered with the first date data.<br />
5.3 Mapping <strong>of</strong> wetl<strong>and</strong>s<br />
The delineation <strong>of</strong> wetl<strong>and</strong>s through image analysis forms the foundation for deriving all wetl<strong>and</strong> classes <strong>and</strong><br />
results. Consequently, a great deal <strong>of</strong> emphasis has been placed on the quality <strong>of</strong> the image Interpretation.<br />
In the present study, the mapping <strong>of</strong> wetl<strong>and</strong>s was done following digital classification <strong>and</strong> on-screen visual<br />
interpretation. Wetl<strong>and</strong>s were identified based on vegetation, visible hydrology <strong>and</strong> geography. There are<br />
various methods for extraction <strong>of</strong> water information from remote sensing imagery, which according to the<br />
number <strong>of</strong> b<strong>and</strong>s used, are generally divided into two categories, i.e. single-b<strong>and</strong> <strong>and</strong> multi-b<strong>and</strong> methods.<br />
Single-b<strong>and</strong> method usually involves choosing a b<strong>and</strong> from multi-spectral image to distinguish water from<br />
l<strong>and</strong> by subjective threshold values. It may lead to over- or under-estimation <strong>of</strong> open water area. Multi-b<strong>and</strong><br />
method takes advantage <strong>of</strong> reflective differences <strong>of</strong> each b<strong>and</strong>. In this project, five indices known in literature<br />
that enhances various wetl<strong>and</strong> characteristics were used (McFeetres, 1986; Xu Hanqiu, 2006; Lacaux et al,<br />
2007; Townshend <strong>and</strong> Justice, 1986; Tucker <strong>and</strong> Sellers, 1986) as given below:<br />
i) Normalised Difference Water Index (NDWI) = (Green-NIR) / (Green + NIR)<br />
ii) Modified Normalised Difference Water Index (MNDWI) = (Green - MIR) / (Green + MIR)<br />
iii) Normalised Difference Vegetation Index (NDVI) = (NIR - Red) / (NIR + Red)<br />
iv) Normalised Difference Pond Index (NDPI) = (MIR - Green / MIR + Green)<br />
v) Normalised Difference Turbidity Index (NDTI) = (Red - Green) / (Red + Green)<br />
12
The indices were generated using st<strong>and</strong>ard image processing s<strong>of</strong>tware, stacked as layers (Figure 7). Various<br />
combinations <strong>of</strong> the indices/spectral b<strong>and</strong>s were used to identify the wetl<strong>and</strong> features as shown in Figure 8.<br />
The following indices were used for various layer extractions:<br />
• Extraction <strong>of</strong> wetl<strong>and</strong> extent :<br />
MNDWI, NDPI <strong>and</strong> NDVI image was used to extract the wetl<strong>and</strong> boundary through suitable hierarchical<br />
thresholds.<br />
• Extraction <strong>of</strong> open water :<br />
MNDWI was used within the wetl<strong>and</strong> mask to delineate the water <strong>and</strong> no-water areas.<br />
• Extraction <strong>of</strong> wetl<strong>and</strong> vegetation :<br />
NDPI <strong>and</strong> NDVI image was used to delineate the vegetation areas within a wetl<strong>and</strong> using a suitable<br />
threshold.<br />
• Turbidity information extraction :<br />
MNDWI image was used to generate qualitative turbidity level (high, moderate <strong>and</strong> low) based on<br />
signature statistics <strong>and</strong> st<strong>and</strong>ard deviations. In the False Colour Composite (FCC) these generally<br />
appear in different hues (Table-3).<br />
Table 3: Qualitative turbidity ratings<br />
Sr. No. Qualitative Turbidity Conditional criteria Hue on FCC<br />
1. Low > +1σ Dark blue/blackish<br />
2. Moderate > -1σ to
Spatial frame work<br />
Admin. Boundaries<br />
(State, District)<br />
Morphometric<br />
(Wetl<strong>and</strong> extent)<br />
Quality Check<br />
Physical<br />
(Wetl<strong>and</strong> type)<br />
IRS P6 LISS III<br />
pre <strong>and</strong> post-monsoon data<br />
Geo-referenced images<br />
On-screen interpretation/<br />
Digital analysis<br />
Biological<br />
(Wetl<strong>and</strong> vegetation)<br />
GIS DATABASE<br />
(Wetl<strong>and</strong> layers, Base layers)<br />
NWIA Database Organisation<br />
(District, State, Country)<br />
Analysis<br />
Atlases/Report<br />
Figure 7: Flow chart <strong>of</strong> the methodology used<br />
Figure 8: Steps in the extraction <strong>of</strong> wetl<strong>and</strong> components<br />
Legacy data<br />
SOI topographic maps<br />
Ground truth<br />
Base layers<br />
(Road, Settlement, drainage)<br />
Accuracy Assessment/<br />
Quality Check<br />
14
LISS-III FCC (Green Red NIR)<br />
LISS-III FCC (Green Red SWIR)<br />
LISS-III FCC <strong>of</strong> Indices (MNDWI NDVI NDTI) is<br />
useful for delineation <strong>of</strong> wetl<strong>and</strong> boundary.<br />
LISS-III FCC <strong>of</strong> Indices (MNDWI NDPI NDVI) is<br />
useful for delineation <strong>of</strong> extent <strong>of</strong> open water <strong>and</strong><br />
wetl<strong>and</strong> vegetation.<br />
MNDWI is useful for classification open water into<br />
various levels <strong>of</strong> qualitative turbidity based on the σ<br />
derived from signature statistics.<br />
Aquatic<br />
Vegetation<br />
LISS-III FCC <strong>of</strong> Indices<br />
(MNDWI NDVI NDTI)<br />
LISS-III FCC <strong>of</strong> Indices<br />
(MNDWI NDPI NDVI)<br />
Open Water<br />
Classified MNDWI image based on σ<br />
Figure 9: Various combinations <strong>of</strong> the indices/spectral b<strong>and</strong>s used to identify wetl<strong>and</strong> components<br />
15
6.0 ACCURACY ASSESSMENT<br />
A comprehensive accuracy assessment protocol has been followed for determining the quality <strong>of</strong> information<br />
derived from remotely sensed data. Accuracy assessment involves determination <strong>of</strong> thematic (classification)<br />
as well as locational accuracy. In addition, GIS database(s) contents have been also evaluated for accuracy.<br />
To ensure the reliability <strong>of</strong> wetl<strong>and</strong> status data, the project adhered to established quality assurance <strong>and</strong><br />
quality control measures for data collection, analysis, verification <strong>and</strong> reporting.<br />
This study used well established, time-tested, fully documented data collection conventions. It employed<br />
skilled <strong>and</strong> trained personnel for image interpretation, processing <strong>and</strong> digital database creation. All interpreted<br />
imageries were reviewed by technical expert team for accuracy <strong>and</strong> code. The reviewing analyst adhered to<br />
all st<strong>and</strong>ards, quality requirements <strong>and</strong> technical specifications <strong>and</strong> reviewed 100 percent <strong>of</strong> the work. The<br />
various stages <strong>of</strong> quality check include:<br />
1. Image-to-Image Geo-referencing/Data generation<br />
2. Reference layer preparation using NWIA post monsoon <strong>and</strong> pre-monsoon LISS-III data.<br />
3. Wetl<strong>and</strong> mapping using visual/digital interpretation techniques.<br />
4. Geo-data base creation <strong>and</strong> organization<br />
5. Output products.<br />
6.1 Data verification <strong>and</strong> quality assurance <strong>of</strong> output digital data files<br />
All digital data files were subjected to rigorous quality control inspections. Digital data verification included<br />
quality control checks that addressed the geospatial correctness, digital integrity <strong>and</strong> some cartographic<br />
aspects <strong>of</strong> the data. Implementation <strong>of</strong> quality checks ensured that the data conformed to the specified<br />
criteria, thus achieving the project objectives. There were tremendous advantages in using newer<br />
technologies to store <strong>and</strong> analyze the geographic data. The geospatial analysis capability built into this study<br />
provided a complete digital database to better assist analysis <strong>of</strong> wetl<strong>and</strong> change information. All digital data<br />
files were subjected to rigorous quality control inspections. Automated checking modules incorporated in the<br />
geographic information system (Arc/GIS) were used to correct digital artifacts including polygon topology.<br />
Additional customized data inspections were made to ensure that the changes indicated at the image<br />
interpretation stage were properly executed.<br />
16
MAPS AND STATISTICS<br />
17
7.0 WETLANDS OF ANDHRA PRADESH: MAPS AND STATISTICS<br />
Area estimates <strong>of</strong> various wetl<strong>and</strong> categories for <strong>Andhra</strong> <strong>Pradesh</strong> have been carried out using GIS layers <strong>of</strong><br />
wetl<strong>and</strong> boundary, water-spread, aquatic vegetation <strong>and</strong> turbidity. In the state <strong>of</strong> <strong>Andhra</strong> <strong>Pradesh</strong> 20477<br />
wetl<strong>and</strong>s have been delineated, in addition to 18037 wetl<strong>and</strong>s smaller than 2.25 ha, which have been shown<br />
as point features. Total wetl<strong>and</strong> area is estimated to be 1447133 ha, which is 5.26 per cent <strong>of</strong> state<br />
geographical area (Table 4). Inl<strong>and</strong> wetl<strong>and</strong>s dominated in terms <strong>of</strong> aerial extent (1020750 ha) comprising<br />
about 70.5 per cent <strong>of</strong> wetl<strong>and</strong> area in the state. Of this, man-made wetl<strong>and</strong>s accounted for about 42 per cent<br />
<strong>of</strong> total wetl<strong>and</strong> extent. Coastal wetl<strong>and</strong>s were estimated to be about 28 per cent besides the small wetl<strong>and</strong>s<br />
(
In terms <strong>of</strong> vegetation specific to wetl<strong>and</strong>s, has shown an increase from 126187 ha in post-monsoon to<br />
268267 ha in pre-monsoon. This accounts for about 9 <strong>and</strong> 19 % in post- <strong>and</strong> pre-monsoon seasons<br />
respectively out <strong>of</strong> the total wetl<strong>and</strong> area <strong>of</strong> 1429096 ha (Table 5). Qualitative turbidity estimated for open<br />
water shows that moderate turbidity is predominant in wetl<strong>and</strong>s <strong>of</strong> <strong>Andhra</strong> <strong>Pradesh</strong> in both the seasons. Out <strong>of</strong><br />
887143 ha <strong>of</strong> open water in post-monsoon, about 60 per cent is moderately turbid followed by low (33 %) <strong>and</strong><br />
high (7%). In case <strong>of</strong> pre-monsoon the there is change in the trend. Out <strong>of</strong> 610668 ha <strong>of</strong> open water in<br />
pre-monsoon, about 57 per cent is under moderate turbidity followed by low (37 %) <strong>and</strong> high (5 %).<br />
The decrease in the aerial extent under high turbidity may be attributed to the settling <strong>of</strong> sediments received<br />
by the wetl<strong>and</strong>s during monsoon. On the other h<strong>and</strong> the increase in extent under low turbid zones from post-<br />
to pre-monsoon may be attributed to churning <strong>of</strong> bottom sediments in shallower parts <strong>of</strong> open water.<br />
Sr. No. Wettcode Wetl<strong>and</strong> Category<br />
Table 5: Area estimates <strong>of</strong> wetl<strong>and</strong>s in <strong>Andhra</strong> <strong>Pradesh</strong><br />
Number<br />
<strong>of</strong><br />
wetl<strong>and</strong>s<br />
Total<br />
wetl<strong>and</strong><br />
area<br />
% <strong>of</strong><br />
wetl<strong>and</strong><br />
area<br />
Area in ha<br />
Open Water<br />
Postmonsoon <br />
Premonsoon<br />
1100 Inl<strong>and</strong> Wetl<strong>and</strong>s - Natural<br />
1 1101 Lakes/Ponds 8 21843 1.51 3368 4334<br />
2 1105 Waterlogged 54 2714 0.19 902 609<br />
3 1106 River/Stream 353 385839 26.66 168137 123927<br />
1200 Inl<strong>and</strong> Wetl<strong>and</strong>s -Man-made<br />
4 1201 Reservoirs/Barrages 4527 404499 27.95 340275 200496<br />
5 1202 Tanks/Ponds 13708 201677 13.94 155503 71456<br />
6 1203 Waterlogged 51 4178 0.29 914 558<br />
Total - Inl<strong>and</strong> 18701 1020750 70.54 669099 401380<br />
2100 Coastal Wetl<strong>and</strong>s - Natural<br />
7 2101 Lagoons 2 47407 3.28 47306 47407<br />
8 2102 Creeks 80 9594 0.66 9103 8946<br />
9 2103 S<strong>and</strong>/Beach 70 15891 1.10 - -<br />
10 2104 Intertidal mud flats 131 31767 2.20 - -<br />
11 2105 Salt Marsh 28 4002 0.28 - -<br />
12 2106 Mangroves 254 41486 2.87 - -<br />
2200 Coastal Wetl<strong>and</strong>s - Man-made<br />
13 2201 Salt pans 57 17725 1.22 7551 7064<br />
14 2202 Aquaculture ponds 1154 240474 16.62 154084 145871<br />
Total - Coastal 1776 408346 28.22 218044 209288<br />
Sub-Total 20477 1429096 98.75 887143 610668<br />
Wetl<strong>and</strong>s (
7.1 DISTRICT-WISE WETLAND MAPS AND STATISTICS<br />
<strong>Andhra</strong> <strong>Pradesh</strong> comprises <strong>of</strong> 23 districts <strong>and</strong> over all the extent <strong>of</strong> wetl<strong>and</strong>s accounts for 5.3 per cent <strong>of</strong><br />
geographical area <strong>of</strong> the state (Table 6). District-wise distribution <strong>of</strong> wetl<strong>and</strong>s shown that Krishna district<br />
ranked first in the extent in terms per cent to the geographical area <strong>of</strong> the district registering 19 % (Table 6)<br />
followed by Nellore (16.47) <strong>and</strong> West Godavari (11.81). On the other h<strong>and</strong> Rangareddy district constitute least<br />
(1.37 %). Rest <strong>of</strong> them range in between 2 to 9 per cent. In terms <strong>of</strong> extent during post-monsoon, Hyderabad<br />
has least extent <strong>of</strong> wetl<strong>and</strong>s (685 ha) while Nellore has registered highest area (141494 ha). Overall there is a<br />
reduction <strong>of</strong> about 31 per cent area in the open water from post-monsoon (887143 ha) to pre-monsoon<br />
(610668 ha). The seasonal change is least in East Godavari (4.68 %) while highest in Chittoor (76.56 %).<br />
Nellore district ranked first in terms <strong>of</strong> open water spread (41254 ha) in post- as well as in pre-monsoon<br />
(114398 ha). Wetl<strong>and</strong> statistics followed by wetl<strong>and</strong> map <strong>and</strong> corresponding satellite data for each district is<br />
given to have a fairly good idea about the distribution pattern <strong>and</strong> density <strong>of</strong> wetl<strong>and</strong>s in the district.<br />
District-wise distribution <strong>of</strong> wetl<strong>and</strong>s is depicted graphically in figure 10.<br />
Table-6: District-wise wetl<strong>and</strong> area<br />
Sr.<br />
No.<br />
District<br />
Area <strong>of</strong><br />
district<br />
(km 2 )<br />
Wetl<strong>and</strong><br />
area (ha)<br />
% <strong>of</strong><br />
total<br />
wetl<strong>and</strong><br />
area<br />
% <strong>of</strong><br />
district<br />
area<br />
Open water extent<br />
Seasonal<br />
(ha)<br />
change<br />
PostPre- (%)<br />
monsoonmonsoon 1 Adilabad 16105 68907 4.76 4.28 44355 21557 51.40<br />
2 Nizamabad 7956 69213 4.78 8.70 55961 27030 51.70<br />
3 Karimnagar 11823 67017 4.63 5.67 37710 21283 43.56<br />
4 Medak 9699 47639 3.29 4.91 39574 21476 45.73<br />
5 Hyderabad 217 935 0.06 4.31 685 626 8.61<br />
6 Rangareddi 7493 10257 0.71 1.37 6914 4417 36.12<br />
7 Mehbubnagar 18432 52327 3.62 2.84 32655 20367 37.63<br />
8 Nalgonda 14240 66606 4.60 4.68 44338 32498 26.70<br />
9 Warangal 12846 51046 3.53 3.97 35760 13092 63.39<br />
10 Khammam 16029 63422 4.38 3.96 33552 21795 35.04<br />
11 Srikakulam 5837 34849 2.41 5.97 14645 11079 24.35<br />
12 Vizianagaram 6539 23674 1.64 3.62 14741 6461 56.17<br />
13 Visakhapatnam 11161 24988 1.73 2.24 16984 11185 34.14<br />
14 East Godavari 10807 99057 6.85 9.17 54716 52154 4.68<br />
15 West Godavari 7742 91447 6.32 11.81 67601 51421 23.93<br />
16 Krishna 8727 165818 11.46 19.00 87097 74772 14.15<br />
17 Guntur 11391 67652 4.67 5.94 31185 29031 6.91<br />
18 Prakasam 17626 52565 3.63 2.98 25489 18743 26.47<br />
19 Nellore 13076 215404 14.88 16.47 141494 114398 19.15<br />
20 Cuddapah 15359 56470 3.90 3.68 34973 27073 22.59<br />
21 Kurnool 17658 38479 2.66 2.18 26782 13972 47.83<br />
22 Anantapur 19130 38400 2.65 2.01 10481 9334 10.94<br />
23 Chittoor 15152 40961 2.83 2.70 29451 6904 76.56<br />
Total 275045 1447133 100.00 5.26 887143 610668 31.16<br />
21
Figure 11: District-wise graphical distribution <strong>of</strong> wetl<strong>and</strong>s<br />
22
7.1.1 Adilabad<br />
This district is bounded on the north by Yeovatmal <strong>and</strong> Ch<strong>and</strong>rapur districts <strong>of</strong> Maharastra, on the east by<br />
Gadchiroli district <strong>of</strong> Maharastra, on the south by Karimnagar <strong>and</strong> Nizamabad districts <strong>and</strong> on the west by<br />
N<strong>and</strong>ed district <strong>of</strong> Maharashtra. The population <strong>of</strong> the district according to 2001 census is 24, 88,003.<br />
Major part <strong>of</strong> the district is hilly <strong>and</strong> densely forest. The western half <strong>of</strong> the district is characterized by plateaus<br />
in the north <strong>and</strong> gently undulating topography in the south, while the eastern half is covered by NW-SE<br />
trending structural ridges <strong>and</strong> plains. Sahyadri Parvat or Satnala range traverses the district from the<br />
north-west to the south-east for about 281.5 km. Important rivers that drain the district are the river Godavari.<br />
Penganga, Wardha <strong>and</strong> Pranahita. Penganga forms part <strong>of</strong> the northern boundary <strong>of</strong> the district, while Wardha<br />
<strong>and</strong> Pranahita form the northern <strong>and</strong> eastern boundaries <strong>of</strong> the district. Then these three rivers merge in to the<br />
river Godavari. Kadam <strong>and</strong> Peddavagu, the tributaries <strong>of</strong> the river Godavari, are also drain the district. Besides<br />
these, there are also rivulets like Satnala, Swarna vagu <strong>and</strong> Suddavagu, which drain the district.<br />
The climate <strong>of</strong> Adilabad district is characterized by hot summer <strong>and</strong> is generally dry except during the<br />
south-west monsoon season. During summer, the mean daily maximum temperature is at about 46 0 C <strong>and</strong> the<br />
minimum daily is 30 0 C. December is generally the coldest month; with the mean daily maximum temperature<br />
at about 29 0 C <strong>and</strong> the minimum daily is 15 0 C. The rainfall in the district, in general increases from the<br />
south-west towards the north-east. About 85% <strong>of</strong> annual rainfall is received during the south-west monsoon<br />
season. The annual normal rainfall <strong>of</strong> the district is 1153 mm, which ranges from 995 mm at Tiryani m<strong>and</strong>al to<br />
1348 mm at Indervally m<strong>and</strong>als. The relative humidity is high, generally during the south-west monsoon<br />
season <strong>and</strong> the air is generally dry during the rest <strong>of</strong> the year.<br />
The district comprises <strong>of</strong> 866 wetl<strong>and</strong>s, which were mapped besides 361 small wetl<strong>and</strong>s (
7.1.2 Nizamabad<br />
It is bounded on the north by Adilabad district, on the east by Karimnagar district, on the south by Medak<br />
district <strong>and</strong> on the west by N<strong>and</strong>ed district <strong>of</strong> Maharashtra. The district has an undulating terrain partially cover<br />
with forests. Godavari river flows along the northern boundary <strong>of</strong> the district <strong>and</strong> enters Karimnagar district.<br />
The two tributaries <strong>of</strong> river Godavari namely Manjeera <strong>and</strong> Maneru are the next important rivers, which drain<br />
this district. The climatic condition <strong>of</strong> the district is tropical <strong>and</strong> temperature fluctuations. The normal mean<br />
minimum temperature is 13.7º C <strong>and</strong> mean maximum is 39.9º C. Annual rainfall ranges from 878 mm to 1220<br />
mm.<br />
The district comprises <strong>of</strong> 1064 wetl<strong>and</strong>s, which were mapped besides 530 small wetl<strong>and</strong>s (
7.1.3 Karimnagar<br />
Karimnagar district is situated between 78 o 40' <strong>and</strong> 80 o 00' east longitudes <strong>and</strong> 18 o 00' <strong>and</strong> 19 o 00' north<br />
latitudes. This district is bounded on the north by Adilabad district, on the east by Gadchiroli district <strong>of</strong><br />
Maharastra, on the south by Warangal <strong>and</strong> Medak districts <strong>and</strong> on the west by Nizamabad district. The district<br />
can be divided physiographically into two regions viz., hills <strong>and</strong> plateau. Three ranges from Balughat are<br />
spread over the district while the rest is plateau. The river Godavari, the largest river in the peninsular India,<br />
enters the district at K<strong>and</strong>ukurthi village, runs for a distance <strong>of</strong> 283 km forming the northern <strong>and</strong> eastern<br />
boundary <strong>of</strong> the district <strong>and</strong> leaves the district at Muknur village. The entire district is mainly drained by<br />
Maneru River, a tributary <strong>of</strong> river Godavari. The climate <strong>of</strong> the district is characterized by hot summer <strong>and</strong> is<br />
generally dry except during the south-west monsoon season. The average annual rainfall <strong>of</strong> the district is<br />
968.6 mm. The rainfall increases from south to northern part varying from 950 to 1100 mm. The southwest<br />
monsoon contributes about 83% <strong>of</strong> the annual rainfall. The relative humidity is high, generally during the<br />
south-west monsoon season <strong>and</strong> the air is generally dry during the rest <strong>of</strong> the year.<br />
The district comprises <strong>of</strong> 1872 wetl<strong>and</strong>s, out <strong>of</strong> which, the mapped ones are 1274 besides 598 small wetl<strong>and</strong>s<br />
(
7.1.4 Medak<br />
Medak district is situated between 77 o 28' <strong>and</strong> 79 o 10' East Longitudes <strong>and</strong> 17 o 27' <strong>and</strong> 18 o 19' North Latitudes.<br />
This district is bounded on the north by Nizamabad <strong>and</strong> Karimnagar districts on the east by Karimnagar <strong>and</strong><br />
Warangal districts, on the south by Nalgonda <strong>and</strong> Rangareddy districts <strong>and</strong> on the west by Bidar district <strong>of</strong><br />
Karnataka. The district has a population <strong>of</strong> 26,70,097 as per 2001 census. The population density <strong>of</strong> the<br />
district is 275 persons per sq. km. The major crops grown here are Rice, Jowar, Cotton, Turmeric, Maize,<br />
Arhar, Chillies, Sugarcane <strong>and</strong> Sesame. The district forms a part <strong>of</strong> the Deccan Plateau crossed by different<br />
hill ranges. Manjeera, the tributary <strong>of</strong> the river Godavari, Haldi (Pasupuyeru) <strong>and</strong> Kudliar the tributaries <strong>of</strong><br />
Manjeera drain the district. Medak has tropical climate <strong>and</strong> the summer is very hot <strong>and</strong> dry. The summer<br />
season extends from March to May. From December to February it is winter. The mean maximum <strong>and</strong><br />
minimum temperature vary from 40 0 C to 26 0 C. The south-west monsoon brings heavy rains. The rainy<br />
season extends from June to September. The district receives an average rainfall <strong>of</strong> 873 mm.<br />
The district comprises <strong>of</strong> 1756 wetl<strong>and</strong>s, out <strong>of</strong> which, the mapped ones are 1092 besides 664 small wetl<strong>and</strong>s<br />
(
7.1.5 Hyderabad<br />
The geographical area <strong>of</strong> the district is 217 km 2 , out <strong>of</strong> which wetl<strong>and</strong>s constitute 4.31 per cent <strong>of</strong> area. The<br />
district comprises 31 wetl<strong>and</strong>s, out <strong>of</strong> which, the mapped ones are 18 besides 13 small wetl<strong>and</strong>s (
7.1.6 Rangareddi<br />
The district is located at the heart <strong>of</strong> Dakshinapatha or the Deccan plateau <strong>of</strong> the Indian subcontinent <strong>and</strong> lies<br />
between 16 0 19’ ad 18 0 20’ North latitude <strong>and</strong> 77 0 30’ East longitude bounded on the north by Medak district,<br />
on the east by Nalgonda District on the south by Mahaboobnagar District <strong>and</strong> on the west by Gulbarga District<br />
<strong>of</strong> Karnataka State. The district is situated at an elevation <strong>of</strong> 500-600 m above sea level in the Deccan<br />
Plateau. Scattered hillocks <strong>and</strong> outcrops <strong>of</strong> black stone are ubiquitous in the district. The general slope <strong>of</strong> the<br />
l<strong>and</strong> is from west to east <strong>and</strong> south-east. Musi is the main river flowing from west to east in the district. The<br />
Climate <strong>of</strong> the district is characterized by hot summer <strong>and</strong> is generally dry except during the South west<br />
monsoon season. The year may be divided into four seasons. March to May is the summer season, June to<br />
September constitutes the South West monsoon season, October to December from the North East monsoon<br />
season <strong>and</strong> January to February is the winter season. The District has a normal rainfall <strong>of</strong> 781.5 MM. the bulk<br />
<strong>of</strong> which is received through the South West Monsoon during the period from June to September. The mean<br />
maximum temperature begins to rise from the middle <strong>of</strong> February <strong>and</strong> reaches a maximum <strong>of</strong> about 30 0 C in<br />
May. December is the coldest month with the mean daily maximum temperature at 28.6 0 C <strong>and</strong> the mean<br />
daily minimum Temperature at 13.6 0 C.<br />
Wetl<strong>and</strong>s in this constitute 1.37 per cent <strong>of</strong> the geographical area. The number <strong>of</strong> wetl<strong>and</strong>s in this district are<br />
749 wetl<strong>and</strong>s, out <strong>of</strong> which, the mapped ones are 348 besides 401 small wetl<strong>and</strong>s (
7.1.7 Mahbubnagar<br />
Mahabubnagar is the largest district in Telangana Region <strong>and</strong> the second largest in <strong>Andhra</strong> <strong>Pradesh</strong> State.<br />
Mahbubnagar is located at 16.73° N 77.98° E. It is bounded on the north by Rangareddy <strong>and</strong> Nalgonda, on<br />
the east by Nalgonda <strong>and</strong> Guntur districts <strong>and</strong> on the south by rivers Krishna <strong>and</strong> Tungabhadra <strong>and</strong> on the<br />
west by Raichur <strong>and</strong> Gulbarga districts <strong>of</strong> Karnataka states. The district may be physiographically divided into<br />
more or less two distinct regions, the plain region with low lying scattered hills <strong>and</strong> the extensive Amarabad-<br />
Farhabad plateau, a continuous range <strong>of</strong> hills, <strong>of</strong> an average elevation <strong>of</strong> about 800 meters, extending more or<br />
less, east-west along the Krishna river on the southern boundary <strong>of</strong> the district. The hill range is interspersed<br />
by several deep valleys, which are almost inaccessible from the plains. Mahabubnagar district has abundant<br />
resources <strong>of</strong> many minerals like diamonds, gold, semiprecious stones, abrasive, asbestos, clays, quartz,<br />
limestones etc. Climate is Tropical. May <strong>and</strong> June are the hottest months with the highest maximum<br />
temperatures recorded. November, December <strong>and</strong> January months record low temperatures. The<br />
temperatures in summer are max 40 °C <strong>and</strong> min 26 °C <strong>and</strong> in winter max 28 °C <strong>and</strong> min 18 °C. Rains are<br />
heavy in the north <strong>of</strong> the district. Average rainfall is 754mm.<br />
The geographical area <strong>of</strong> this district is 10257 km 2 , out <strong>of</strong> which Wetl<strong>and</strong>s constitute 2.84 per cent <strong>of</strong> area.<br />
The district comprises 1021 wetl<strong>and</strong>s, out <strong>of</strong> which, the mapped ones are 595 besides 606 small wetl<strong>and</strong>s<br />
(
7.1.8 Nalgonda<br />
The district is in the southern part <strong>of</strong> the Telangana region between 16 0 25' <strong>and</strong> 17 0 -50' <strong>of</strong> the Northern Latitude<br />
<strong>and</strong> 78 0 -40' <strong>and</strong> 80 0 -05' <strong>of</strong> Eastern longitude. The District is bounded by Medak <strong>and</strong> Warangal districts in the<br />
North, Guntur <strong>and</strong> Mahabubnagar districts in the South, Khammam <strong>and</strong> Krishna districts in the East <strong>and</strong><br />
Mahabubnagar <strong>and</strong> Rangareddy district in the West. The total population <strong>of</strong> the district is 32.48 lakhs <strong>and</strong><br />
density <strong>of</strong> population is 229 per Sq. Km as per 2001 census. Agriculture is the main occupation for 70% <strong>of</strong> the<br />
population <strong>of</strong> the district. The major irrigation source is the Left Bank Canal <strong>of</strong> the Nagarjunasagar Reservoir.<br />
The district is undulating in terrain <strong>and</strong> the general slope <strong>of</strong> the terrain is from west <strong>and</strong> north-west to<br />
south-east. Apart from the four ranges <strong>of</strong> hills spanning across the district, there are a number <strong>of</strong> isolated hills.<br />
The main rivers draining the district are Krishna, Musi, Aler, Dindi, Hallia, Kongal <strong>and</strong> Peddavagu. The region<br />
experiences hot <strong>and</strong> dry summer throughout the year except during the South West Monsoon season. The<br />
year may broadly be divided into four seasons. It experiences cold season from December to mid February,<br />
summer season from mid February to first week <strong>of</strong> June. South West monsoon season from June to<br />
September <strong>and</strong> retreating monsoon or the past monsoon season during October to November. Cold season<br />
extending from December to February is followed by summer when both day <strong>and</strong> night temperatures increase<br />
sharply. May being the hottest month, the mean daily maximum temperature is about 40 0 C <strong>and</strong> the mean<br />
daily minimum is about 28 0 C sometimes the day temperature crosses 44 0 C during this period. December is<br />
the coldest month with the mean daily maximum <strong>and</strong> minimum temperatures being 35 0 C <strong>and</strong> 20 0 C<br />
respectively. The average rainfall in the district is 772 mm.<br />
The geographical area <strong>of</strong> this district is 14240 km 2 , out <strong>of</strong> which Wetl<strong>and</strong>s constitute 4.68 per cent <strong>of</strong> area.<br />
The district comprises 1422 wetl<strong>and</strong>s, out <strong>of</strong> which, the mapped ones are 886 besides 536 small wetl<strong>and</strong>s<br />
(
7.1.9 Warangal<br />
Warangal district is situated between 78 o 49' <strong>and</strong> 80 o 43' east longitudes <strong>and</strong> 17 o 19' <strong>and</strong> 18 o 36' north latitudes.<br />
It is bounded on the north by Karimnagar district, on the east by Khammam district, on the south by Nalgonda<br />
<strong>and</strong> Khammam districts <strong>and</strong> on the west by Medak district. The population <strong>of</strong> the district according to 2001<br />
census is 32, 46,004. The density <strong>of</strong> population per sq km is 252 persons. Warangal district falls in the<br />
drainage basins <strong>of</strong> both Godavari <strong>and</strong> Krishna rivers. The river Godavari, the largest river in the peninsular<br />
India flows through the eastern part <strong>of</strong> the district. Pedavagu <strong>and</strong> Lakhnavaram are the two main tributaries <strong>of</strong><br />
the Godavari, which drain the district. In the southern <strong>and</strong> south-western part <strong>of</strong> the district, the tributaries <strong>of</strong><br />
river Krishna namely Aleru, Paleru <strong>and</strong> Munneru flow towards southern direction.<br />
The geographical area <strong>of</strong> this district is 12846 km 2 , out <strong>of</strong> which Wetl<strong>and</strong>s constitute 3.97 per cent <strong>of</strong> area.<br />
The district comprises 2085 wetl<strong>and</strong>s, out <strong>of</strong> which, the mapped ones are 709 besides 606 small wetl<strong>and</strong>s<br />
(
7.1.10 Khammam<br />
Khammam district lies between 16 0 45’ <strong>and</strong> 18 0 35’ north latitudes <strong>and</strong> between 79 0 47’ <strong>and</strong> 81 0 47 ’ east<br />
longitudes. It is bounded on the north by Madhya <strong>Pradesh</strong> <strong>and</strong> Orissa States, on the south by Krishna district,<br />
on the east by East <strong>and</strong> west Godavari districts <strong>and</strong> on the west by Nalgonda <strong>and</strong> Warangal districts. The total<br />
population <strong>of</strong> the district as per 2001 census is 25.79 lakhs. The density <strong>of</strong> population per sq km is 161<br />
persons. The district can be broadly divided into three physiographic units viz, hills, upl<strong>and</strong>s, plains. A range<br />
<strong>of</strong> hill stretches from Singareni to Ashwaropet in the South east bounding the lower Godavari valley. The<br />
important rivers which flow through this district are the Godavari, Sabari, Kinnerasani, Muner (Muneru),<br />
Palleru, Akeru <strong>and</strong> Wira. The climate <strong>of</strong> this district is characterized by a hot summer <strong>and</strong> good seasonal<br />
rainfall. The summer season is from about the middle <strong>of</strong> February to about the first week <strong>of</strong> June.<br />
The temperature during summer shoots up to 43 0 C. The south-west monsoon season which follows, lasts up<br />
to the end <strong>of</strong> September. October <strong>and</strong> November constitute the post-monsoon season. December to the<br />
middle <strong>of</strong> February is the season <strong>of</strong> generally fine weather. The normal annual rainfall is 1157mm.<br />
The geographical area <strong>of</strong> this district is 16029 km 2 , out <strong>of</strong> which Wetl<strong>and</strong>s constitute 3.96 per cent <strong>of</strong> area.<br />
The district comprises 1635 wetl<strong>and</strong>s, out <strong>of</strong> which, the mapped ones are 743 besides 892 small wetl<strong>and</strong>s<br />
(
7.1.11 Srikakulam<br />
Srikakulam district is the extreme North-eastern district <strong>of</strong> <strong>Andhra</strong> <strong>Pradesh</strong> situated within the geographic coordinates<br />
<strong>of</strong> 18° 20’ <strong>and</strong> 19° 10’ <strong>of</strong> Northern latitude <strong>and</strong> 83° 50’ <strong>and</strong> 84° 50’ <strong>of</strong> Eastern longitude. The district<br />
has varied l<strong>and</strong>scape with hills, rivers, forests, tanks <strong>and</strong> a long coastline <strong>of</strong> 193 kms. The important rivers are<br />
Nagavalli, Vamsadhara, Mahendratanaya, Champavathi, Bahuda <strong>and</strong> Kumbikotagedda. The rivers have the<br />
origin in the Eastern Ghats <strong>of</strong> Orissa state. The climate in the district is characterized by humidity. April to<br />
June are the hottest months. The south-west-monsoon which follows the summer season lasts up to<br />
September. The north-east monsoon starts from October <strong>and</strong> extends up to end <strong>of</strong> November. The normal<br />
annual average rainfall in the district is 1162 mm.<br />
The geographical area <strong>of</strong> this district is 5837 km 2 , out <strong>of</strong> which Wetl<strong>and</strong>s constitute 5.97 per cent <strong>of</strong> area.<br />
The district comprises 2063 wetl<strong>and</strong>s, out <strong>of</strong> which, the mapped ones are 654 besides 1409 small wetl<strong>and</strong>s<br />
(
7.1.12 Vizianagaram<br />
Vizianagaram district is one <strong>of</strong> the northern coastal districts <strong>of</strong> <strong>Andhra</strong> <strong>Pradesh</strong>. The district is situated within<br />
the geographical co-ordinates <strong>of</strong> 17˚ 15 ’ <strong>and</strong> 19˚ 15’ <strong>of</strong> the northern latitude <strong>and</strong> 83˚ 00 ' <strong>and</strong> 83˚ 45’ <strong>of</strong> the<br />
eastern longitude. The district is bounded on the east by Srikakulam District on the west <strong>and</strong> south by<br />
Visakhapatnam district, on the south east by the Bay <strong>of</strong> Bengal <strong>and</strong> North West by Orissa State. The areas<br />
transferred from Visakhapatnam district are mostly picturesque especially in the north. The agency track<br />
mostly consists <strong>of</strong> the hilly regions covered by the Eastern Ghats which run parallel to the coast from the North<br />
- East to the South West. The average height <strong>of</strong> these hills is over 914 meters, although there are several<br />
peaks <strong>of</strong> even 1,219 meters high. The climate <strong>of</strong> Vizianagaram district is characterized by high humidifies<br />
nearly all the year round with oppressive summer <strong>and</strong> good seasonal rainfall. The summer season is from<br />
March to May. This is followed by South West monsoon season, which continues up to September, October<br />
<strong>and</strong> November constitute the post monsoon or retreating monsoon season. December to February is the<br />
season <strong>of</strong> generally fine weather. The climate <strong>of</strong> the hill parts <strong>of</strong> the district is different from that <strong>of</strong> the plain.<br />
The normal rainfall <strong>of</strong> the district for the year is 1,131 mm. The district gets the benefit <strong>of</strong> both the South-west<br />
<strong>and</strong> North-east monsoon.<br />
The geographical area <strong>of</strong> this district is 6539 km 2 , out <strong>of</strong> which Wetl<strong>and</strong>s constitute 3.62 per cent <strong>of</strong> area.<br />
The district comprises 3984 wetl<strong>and</strong>s, out <strong>of</strong> which, the mapped ones are 1721 besides 2263 small wetl<strong>and</strong>s<br />
(
7.1.13 Visakhapatnam<br />
Visakhapatnam district is one <strong>of</strong> the North Eastern Coastal districts <strong>of</strong> <strong>Andhra</strong> <strong>Pradesh</strong> <strong>and</strong> it lies between<br />
17 0 15' <strong>and</strong> 18 0 32' Northern latitude <strong>and</strong> 18 0 54' <strong>and</strong> 83 0 30' in Eastern longitude. It is bounded on the North<br />
partly by the Orissa State <strong>and</strong> partly by Vizianagaram District, on the South by East Godavari District, on the<br />
West by Orissa State <strong>and</strong> on the East by Bay <strong>of</strong> Bengal. Physiographically the district can be divided into two<br />
parts: coastal plains <strong>and</strong> hilly tracts <strong>of</strong> the Eastern Ghats. It is drained by rivers Sarada, Varaha, T<strong>and</strong>ava,<br />
Meghadrigedda <strong>and</strong> Gambhiramgedda. Along the shore lie a series <strong>of</strong> salt <strong>and</strong> s<strong>and</strong>y swamps. The coastline<br />
is broken by a number <strong>of</strong> bald head l<strong>and</strong>s, the important <strong>of</strong> them being the Dolphin's Nose which had enabled<br />
the establishment <strong>of</strong> Natural Harbour at Visakhapatnam, Rushikonda, Polavaram Rock <strong>and</strong> the Narasimha<br />
Hill at Bheemunipatnam. The district has varied climatic conditions in across the area. Near the coast the air<br />
is moist, but gets warmer towards the interior <strong>and</strong> cools down in the hilly areas on account <strong>of</strong> elevation <strong>and</strong><br />
vegetation. April to June is warmest period. The mean minimum <strong>and</strong> maximum temperatures recorded at<br />
Visakhapatnam airport are about 17.5 0 C <strong>and</strong> 34 0 C during January <strong>and</strong> May respectively. The district<br />
receives annual normal rainfall <strong>of</strong> 1202 mm. <strong>of</strong> which south-west monsoon accounts for 54% <strong>of</strong> the normal<br />
while North-East monsoon contributes 25 % <strong>and</strong> the rest is shared by summer showers <strong>and</strong> winter rains.<br />
The geographical area <strong>of</strong> this district is 11161 km 2 , out <strong>of</strong> which Wetl<strong>and</strong>s constitute 2.24 per cent <strong>of</strong> area.<br />
The district comprises 1335 wetl<strong>and</strong>s, out <strong>of</strong> which, the mapped ones are 678 besides 657 small wetl<strong>and</strong>s<br />
(
7.1.14 East Godavari<br />
It is bounded by Visakhapatnam on the north, West Godavari on the south, Khammam on the west <strong>and</strong> Bay <strong>of</strong><br />
Bengal on the east. The District is located between northern latitudes <strong>of</strong> 16 0 30' <strong>and</strong> 18 0 20' <strong>and</strong> between the<br />
eastern longitudes <strong>of</strong> 81 0 30' <strong>and</strong> 82 0 30'. The district can be broadly classified into three natural divisions, the<br />
delta, the upl<strong>and</strong>, <strong>and</strong> hill tracts. Godavari is the major river draining the district. Yelleru is the second<br />
important river in the district. The temperature reaches a maximum <strong>of</strong> 48 degrees Celsius from April to June<br />
<strong>and</strong> is moderate the rest <strong>of</strong> the year. The average rainfall <strong>of</strong> the district is around 1280.0 mm. More than half<br />
<strong>of</strong> the rainfall is from southwest monsoons <strong>and</strong> the rest is from the northeast monsoon during October <strong>and</strong><br />
November. The average annual rainfall in the district is 1076.20 mm. The rainfall during south-west monsoon<br />
season (June-September) contributes 64% <strong>of</strong> the annual rainfall, while the retrieving monsoon season<br />
accounts for about 36%.<br />
The geographical area <strong>of</strong> this district is 10807 km 2 , out <strong>of</strong> which Wetl<strong>and</strong>s constitute 9.17 per cent <strong>of</strong> area.<br />
The district comprises 1972 wetl<strong>and</strong>s, out <strong>of</strong> which, the mapped ones are 800 besides 1172 small wetl<strong>and</strong>s<br />
(
7.1.15 West Godavari<br />
The district lies between 16 0 15'<strong>and</strong>17 0 30' northern latitudes <strong>and</strong> 80 0 55' <strong>and</strong> 81 0 55' eastern longitudes. It is<br />
surrounded by Khammam district on the north, Krishna district <strong>and</strong> the Bay <strong>of</strong> Bengal on the south <strong>and</strong> on the<br />
east by river Godavari <strong>and</strong> Krishna district on the West. West Godavari is popular for its intensive agriculture<br />
<strong>and</strong> it is known as "Annapurna" <strong>of</strong> <strong>Andhra</strong> <strong>Pradesh</strong>. The irrigation system <strong>of</strong> the river Godavari irrigates a large<br />
part <strong>of</strong> the district. The district can be divided into three natural regions i.e. Delta, Upl<strong>and</strong> <strong>and</strong> Agency areas.<br />
The soils are mostly composed <strong>of</strong> red s<strong>and</strong>y, red loamy <strong>and</strong> lateritic in the middle <strong>of</strong> the district <strong>and</strong> alluvial<br />
<strong>and</strong> s<strong>and</strong>y in coastal region.<br />
The geographical area <strong>of</strong> this district is 7742 km 2 , out <strong>of</strong> which Wetl<strong>and</strong>s constitute 11.81 per cent <strong>of</strong> area.<br />
The district comprises 1743 wetl<strong>and</strong>s, out <strong>of</strong> which, the mapped ones are 741 besides 1002 small wetl<strong>and</strong>s<br />
(
7.1.16 Krishna<br />
Krishna district lies between 15° 43’ <strong>and</strong> 17° 10’ north latitudes <strong>and</strong> 80° 0’ <strong>and</strong> 81° 33’ east longitudes. It is<br />
bounded on the north by Khammam district, on the south by Bay <strong>of</strong> Bengal, on the east by Bay <strong>of</strong> Bengal <strong>and</strong><br />
West Godavari district <strong>and</strong> on the west by Guntur <strong>and</strong> Nalgonda districts. The district is naturally divided into<br />
delta <strong>and</strong> upl<strong>and</strong> zones. All the m<strong>and</strong>als existing in B<strong>and</strong>ar, Gudivada divisions <strong>and</strong> part <strong>of</strong> Vijayawada<br />
division comprise delta <strong>and</strong> all the M<strong>and</strong>als existing in Nuzvid division <strong>and</strong> the remaining m<strong>and</strong>als <strong>of</strong><br />
Vijayawada Division constitute upl<strong>and</strong>. The upl<strong>and</strong> consists <strong>of</strong> an undulating terrain broken by low ranges <strong>of</strong><br />
Eastern Ghats. The climatic conditions <strong>of</strong> the district are <strong>of</strong> extreme kind with hot summers <strong>and</strong> cold winters<br />
<strong>and</strong> may be classified as tropical. April to June are the hottest months with high temperature in May.<br />
The monsoon usually breaks in the middle <strong>of</strong> June <strong>and</strong> bring good rains up to middle <strong>of</strong> October, The normal<br />
annual rainfall <strong>of</strong> this district is 1034 mm <strong>and</strong> 2/3 rd <strong>of</strong> which is received in the south-west monsoon period.<br />
The geographical area <strong>of</strong> this district is 8727 km 2 , out <strong>of</strong> which wetl<strong>and</strong>s constitute 19 per cent <strong>of</strong> area.<br />
The district comprises 1764 wetl<strong>and</strong>s, out <strong>of</strong> which, the mapped ones are 831 besides 933 small wetl<strong>and</strong>s<br />
(
7.1.17 Guntur<br />
Guntur District is situated between 15˚ 18’ <strong>and</strong> 16˚ 50’ <strong>of</strong> the North Latitude is 79˚ 10’ <strong>and</strong> 80˚ 55’ <strong>of</strong> the<br />
Eastern Longitude. River Krishna bound it on the North. On the South by Prakasham Districts, on the East<br />
Bay <strong>of</strong> Bengal on the west by Mahabubnagar <strong>and</strong> Nalgonda districts. The district may be broadly divided into<br />
three regions: the delta, the stony upl<strong>and</strong> <strong>and</strong> hills <strong>and</strong> the black cotton plains. River Krishna washes the<br />
northern <strong>and</strong> a portion <strong>of</strong> eastern boundaries <strong>of</strong> the district. The Gundlakamma, Naguleru <strong>and</strong> Ch<strong>and</strong>ravanka<br />
are the other important rivers in the district. The climate in this district is generally very warm in summer.<br />
The summer which is oppressive during April <strong>and</strong> May is severe in the upl<strong>and</strong> areas especially in the tracks<br />
adjoining the hills.<br />
The geographical area <strong>of</strong> the district is 11391 km 2 , out <strong>of</strong> which wetl<strong>and</strong>s constitute 5.94 per cent <strong>of</strong> area.<br />
The district comprises 1408 wetl<strong>and</strong>s, out <strong>of</strong> which, the mapped ones are 639 besides 769 small wetl<strong>and</strong>s<br />
(
7.1.18 Prakasam<br />
Prakasam district is situated in tropical region between 14˚ 57’ <strong>and</strong> 16˚ 17’ Northern latitude <strong>and</strong> 78˚ 43’ <strong>and</strong><br />
80˚ 25’ Eastern longitude. The district is bounded on East by Bay <strong>of</strong> Bengal, on the West by Kurnool district,<br />
on the North partly by Guntur <strong>and</strong> Mahaboobnagar Districts, on the south partly by Nellore <strong>and</strong> Kadapa<br />
district. The important hill ranges in the district are the Nallamalas <strong>and</strong> the Veligondas. These hills separate<br />
this district from Kurnool <strong>and</strong> kadapa districts. The district on the whole has a dry climate. The normal<br />
maximum <strong>and</strong> minimum temperature recorded in the district are 38.2 0 C <strong>and</strong> 19.7 0 C respectively. The district<br />
receives its rainfall mostly from South-West <strong>and</strong> North-East monsoon. The annual normal rainfall is 872 mm.<br />
Gundlakamma, Musi, Maneru <strong>and</strong> Paleru are the important principal rivers that watered the district. There are<br />
also other minor rivers like the Tammileru, Sagileru <strong>and</strong> Gudisaeru <strong>and</strong> streams like Vagara vagu, Nallavagu,<br />
Vedimangala vagu which flow in some parts <strong>of</strong> the district.<br />
The geographical area <strong>of</strong> the district is 17626 km 2 , out <strong>of</strong> which wetl<strong>and</strong>s constitute 2.98 per cent <strong>of</strong> area.<br />
The district comprises 2126 wetl<strong>and</strong>s, out <strong>of</strong> which, the mapped ones are 892 besides 1234 small wetl<strong>and</strong>s<br />
(
7.1.19 Nellore<br />
Nellore is the southern most coastal district <strong>of</strong> <strong>Andhra</strong> <strong>Pradesh</strong>. It lies between 13 0 25’<strong>and</strong> 15 0 55’ N <strong>of</strong> the<br />
Northern latitude <strong>and</strong> 79 0 9’<strong>and</strong> 80 0 14’ <strong>of</strong> the Eastern Longitude. It is bounded on the north by Prakasam<br />
District on the East by Bay <strong>of</strong> Bengal on the South by Chittoor District <strong>and</strong> Chengalpattu district <strong>of</strong> Tamilnadu<br />
<strong>and</strong> on the West by Veligonda Hills which separate it from Kadapa district. The eastern side consists <strong>of</strong> area<br />
<strong>of</strong> low lying l<strong>and</strong> extending from the base <strong>of</strong> the Eastern Ghats to the sea. The west side <strong>of</strong> the district is<br />
separated from Kadapa district by Veligonda hills. The climate <strong>of</strong> the district is generally dry <strong>and</strong> salubrious.<br />
May <strong>and</strong> June are the hottest months with highest maximum temperature recorded at 39 0 C. The temperature<br />
is low in the months <strong>of</strong> November, December <strong>and</strong> January <strong>and</strong> the mean minimum temperature is above 20 0 C<br />
In January. The Annual Normal Rainfall <strong>of</strong> the District is 1080 mm. River Pennar flows from west to east <strong>and</strong><br />
splits the district into two halves. The other rivers flowing in the district are K<strong>and</strong>aleru <strong>and</strong> Swarnamukhi.<br />
The geographical area <strong>of</strong> the district is 13076 km 2 , out <strong>of</strong> which wetl<strong>and</strong>s constitute 16.47 per cent <strong>of</strong> area.<br />
The district comprises 2998 wetl<strong>and</strong>s, out <strong>of</strong> which, the mapped ones are 2318 besides 680 small wetl<strong>and</strong>s<br />
(
100
101
7.1.20 Cuddapah<br />
The Cuddapah district is bounded by the Latitude 13˚ 43’ to 15˚ 14’N <strong>and</strong> Longitude 77˚ 51’E to 79˚ 29’E The<br />
district is bounded by Kurnool on the north, Chittoor district on the south, Nellore on the east <strong>and</strong> Anantapur<br />
on the west. The district is said to be the heart <strong>of</strong> Rayalaseema as it is centrally located <strong>and</strong> well connected<br />
with the four districts <strong>of</strong> Rayalaseema. The area in general forms an undulating topography with hills <strong>and</strong><br />
plains. The eastern, western <strong>and</strong> southern parts <strong>of</strong> the district form high hilly terrains with plains in between<br />
them. The area experiences humid tropical climate. The summer months are very hot <strong>and</strong> winter months are<br />
pleasant, when the night temperature is about 28 0 C to 30 0 C. The district falls under southern <strong>and</strong> scarce<br />
rainfall is mainly influenced by the South-west monsoon. The normal rainfall <strong>of</strong> the district is 700 mm as<br />
against the state average rainfall <strong>of</strong> 940 mm.<br />
The geographical area <strong>of</strong> the district is 15359 km 2 , out <strong>of</strong> which wetl<strong>and</strong>s constitute 3.68 per cent <strong>of</strong> area.<br />
The district comprises 901 wetl<strong>and</strong>s, out <strong>of</strong> which, the mapped ones are 541 besides 360 small wetl<strong>and</strong>s<br />
(
103
104
105
7.1.21 Kurnool<br />
Kurnool district is situated on 14 0 15’ - 16 0 11’ Northern latitude <strong>and</strong> 76 0 58’-78 0 25’ Eastern longitude <strong>and</strong> the<br />
altitude varies from 1000 m above sea level. The district is surrounded by Prakassam, Cuddapah,<br />
Ananthapur, Mahaboobnagar districts <strong>and</strong> Karnataka state. Nallamalas <strong>and</strong> Erramalas are the two<br />
important mountain ranges in the district running parallel from North to South. May <strong>and</strong> June are the<br />
hottest months with the highest maximum temperatures recorded. November, December <strong>and</strong> January months<br />
record low temperatures. The maximum temperature in summer is 46°C <strong>and</strong> minimum in winter 14°C.<br />
The normal rainfall in the district is 630 mm.<br />
The geographical area <strong>of</strong> the district is 17658 km 2 , out <strong>of</strong> which wetl<strong>and</strong>s constitute 2.18 per cent <strong>of</strong> area.<br />
The district comprises 591 wetl<strong>and</strong>s, out <strong>of</strong> which, the mapped ones are 302 besides 289 small wetl<strong>and</strong>s<br />
(
107
108
109
7.1.22 Anantapur<br />
The district lies between North Latitudes 13° 40’ <strong>and</strong> 15° 15’ <strong>and</strong> East Longitudes 76°50’ <strong>and</strong> 78°30’. While<br />
the northern boundary <strong>of</strong> the district is bound by Bellary (Karnataka) <strong>and</strong> Kurnool districts, the eastern, south<br />
eastern <strong>and</strong> south western boundaries are bound by Kadapa, Chittoor <strong>and</strong> Kolar districts respectively. The<br />
district can be divided into three natural regions, northern black cotton, central semi-arid with scarce<br />
vegetation <strong>and</strong> southern high level connecting Mysore plateau. In general the district has gradient from South<br />
to North with few hill ranges. Several major <strong>and</strong> minor rivers drain the district; most <strong>of</strong> them originating in<br />
Karnataka. Among them Pennar <strong>and</strong> its tributaries Chitravati, Kushavati, Jayamangala, Papagni are the main<br />
rivers flowing in the district. The months <strong>of</strong> March, April <strong>and</strong> May are dry <strong>and</strong> warm with daily temperature<br />
ranging between 29° C to 40° C. November, December <strong>and</strong> January are the cooler months with the<br />
temperatures falling to about 15° C. The average annual rainfall <strong>of</strong> the district is 553 mm.<br />
The geographical area <strong>of</strong> the district is 19130 km 2 , out <strong>of</strong> which wetl<strong>and</strong>s constitute 2 per cent <strong>of</strong> area.<br />
The district comprises 1141 wetl<strong>and</strong>s, out <strong>of</strong> which, the mapped ones are 641 besides 500 small wetl<strong>and</strong>s<br />
(
111
112
113
7.1.23 Chittoor<br />
Chittoor district which forms the southern most district <strong>of</strong> <strong>Andhra</strong> <strong>Pradesh</strong> lies between north Latitudes 12 0 37’<br />
<strong>and</strong> 14 0 08 <strong>and</strong> East longitudes 78 0 33’ <strong>and</strong> 79 0 55’. The district is bound by Anantapur <strong>and</strong> Kadapa Districts<br />
on the north, Nellore District on the east, Chengalpattu <strong>and</strong> North Arcot <strong>and</strong> Dharmapuri Districts <strong>of</strong> Tamil<br />
Nadu in the south <strong>and</strong> Kolar District <strong>of</strong> Karnataka State on the West. The district can be broadly divisible into<br />
two parts: Hilly areas <strong>of</strong> western part comprising mainly the Eastern Ghats <strong>and</strong> eastern plains. Chittoor<br />
experiences a moderate climate. The average annual rainfall for the district is 934 mm.<br />
The main rivers/streams flowing through the district are Ponnai a tributary <strong>of</strong> River Palar, Swarnamukhi, Arani,<br />
Bahuda <strong>and</strong> Pincha.<br />
The geographical area <strong>of</strong> the district is 15152 km 2 , out <strong>of</strong> which wetl<strong>and</strong>s constitute 2.7 per cent <strong>of</strong> area.<br />
The district comprises 3191 wetl<strong>and</strong>s, out <strong>of</strong> which, the mapped ones are 1732 besides 1459 small wetl<strong>and</strong>s<br />
(
115
116
117
118
MAJOR WETLAND TYPES<br />
119
120
8.0 MAJOR WETLAND TYPES OF ANDHRA PRADESH<br />
Major wetl<strong>and</strong> types observed in the state are<br />
Reservoirs/Barrages, River/Streams, Aquaculture ponds, Tanks/ponds <strong>and</strong> Lagoons. Details are given in<br />
Plate-1a <strong>and</strong> 1b. Ground truth data was collected for selected wetl<strong>and</strong> sites. The st<strong>and</strong>ard Performa was<br />
used to record the field data. Field photographs are also taken to record the water quality (subjective), status<br />
<strong>of</strong> aquatic vegetation <strong>and</strong> water spread. The location <strong>of</strong> the features was recorded using GPS. Field<br />
photographs <strong>of</strong> different wetl<strong>and</strong> types are shown in Plates 2a-2b..<br />
A<br />
B<br />
C<br />
B B<br />
C C<br />
A<br />
(IRS-P6 LISS-III FCC, January 25, 2006) (IRS-P6 LISS-III FCC, May 20, 2007)<br />
Lagoon<br />
Reservoir<br />
Tanks/Ponds<br />
Plate 1a: Major wetl<strong>and</strong> types <strong>of</strong> <strong>Andhra</strong> <strong>Pradesh</strong><br />
A<br />
121
A<br />
B<br />
C<br />
A<br />
B<br />
C<br />
(IRS-P6 LISS-III FCC, January 25, 2006) (IRS-P6 LISS-III FCC, April 04, 2007)<br />
Aquaculture Ponds<br />
River/Stream<br />
Mangrove<br />
Plate 1b: Major wetl<strong>and</strong> types <strong>of</strong> <strong>Andhra</strong> <strong>Pradesh</strong><br />
A<br />
B<br />
C<br />
122
Sl. No. Description Field photograph<br />
1.<br />
2.<br />
3.<br />
4.<br />
Wetl<strong>and</strong> Type : Reservoir<br />
(Musi Reservoir : Nalgonda)<br />
Location :<br />
Longitude: 79° 51' 53" E<br />
Latitude : 17° 23' 27" N<br />
Wetl<strong>and</strong> Type : Lake/Pond<br />
(Pakhal Lake)<br />
Location :<br />
Longitude: 79° 59' 59" E<br />
Latitude : 17° 57' 21" N<br />
Wetl<strong>and</strong> Type : Mangroves<br />
(Coringa mangroves)<br />
Location :<br />
Longitude: 82° 19' 41" E<br />
Latitude : 16° 49' 10" N<br />
Wetl<strong>and</strong> Type : River/Stream<br />
Location :<br />
Longitude: 80° 00' 36" E<br />
Latitude : 13° 40' 57" N<br />
Plate 2a: Field photographs <strong>and</strong> ground truth data <strong>of</strong> different wetl<strong>and</strong> types in <strong>Andhra</strong> <strong>Pradesh</strong><br />
123
Sl. No. Description Field photograph<br />
5.<br />
6.<br />
7.<br />
8.<br />
Wetl<strong>and</strong> Type : Aquaculture Pond<br />
(West Godavari District)<br />
Location :<br />
Longitude: 81° 16' 43" E<br />
Latitude : 16° 40' 50" N<br />
Wetl<strong>and</strong> Type : Intertidal Mudflat<br />
Location :<br />
Longitude: 81° 06' 54" E<br />
Latitude : 15° 57' 28" N<br />
Wetl<strong>and</strong> Type : Lake/Pond<br />
(District : West Godavari)<br />
Location :<br />
Longitude: 81° 12' 46" E<br />
Latitude : 16° 38' 10" N<br />
Wetl<strong>and</strong> Type : S<strong>and</strong>/Beach<br />
Location :<br />
Longitude: 81° 07' 00" E<br />
Latitude : 15° 57' 20" N<br />
Plate 2b: Field photographs <strong>and</strong> ground truth data <strong>of</strong> different wetl<strong>and</strong> types in <strong>Andhra</strong> <strong>Pradesh</strong><br />
124
IMPORTANT WETLANDS OF ANDHRA PRADESH<br />
125
126
9.0 IMPORTANT WETLANDS OF ANDHRA PRADESH<br />
<strong>Andhra</strong> <strong>Pradesh</strong> has large number <strong>of</strong> wetl<strong>and</strong>s both in coastal <strong>and</strong> inl<strong>and</strong> categories. The Krishna<br />
mangroves, Kolleru lake, Pulicat lake, Pakhal Lake, Hussain Sagar Lake <strong>and</strong> Nagarjuna Sagar Reservoirs<br />
are some <strong>of</strong> the important wetl<strong>and</strong>s <strong>of</strong> <strong>Andhra</strong> <strong>Pradesh</strong> State. Extensive field work was carried out for these<br />
wetl<strong>and</strong> areas. Wetl<strong>and</strong> maps have been prepared for 5 km buffer area <strong>of</strong> each wetl<strong>and</strong> sites. Details <strong>of</strong> each<br />
wetl<strong>and</strong> <strong>and</strong> wetl<strong>and</strong> map <strong>of</strong> 5 km buffer area are shown in plates 3 to 14.<br />
127
9.1 Kolleru Lake<br />
Kolleru Lake is located 60-km away from Vijayawada near Eluru, West Godavari district. It is the largest fresh<br />
Water Lake in the country. The lake is extends over 83501 ha (depending on water spread) <strong>of</strong> wetl<strong>and</strong> <strong>and</strong><br />
marshes surrounding the Kolleru Lake, between the Krishna <strong>and</strong> Godavari deltas. It is described as "Peerless<br />
Fisherman's Paradise <strong>and</strong> Birds heaven" in the Imperial Gazetteer. Geologically the lake is said to be formed<br />
by siltation from Krishna <strong>and</strong> Godavari Rivers the water spread <strong>of</strong> the lake is purely dependent upon the<br />
intensity <strong>of</strong> monsoon run<strong>of</strong>f. The maximum depth <strong>of</strong> lake is 3 m during monsoon period <strong>and</strong> the water spread<br />
in the lake goes upto 90,000 ha; at 2 m contour the water spread will be about 13,500 ha; over thirty canals<br />
<strong>and</strong> streams enter the lake from the adjoining cultivated farm l<strong>and</strong>s. Major streams that contribute fresh water<br />
to the lake are (a) Budameru, (b) Thammileru, <strong>and</strong> (c) Ramileru. Upputeru is the only outlet which drains the<br />
lake waters into Bay <strong>of</strong> Bengal. The lake shows high values <strong>of</strong> total alkalinity, hardness, <strong>and</strong> nitrates as<br />
compared to similar water bodies located elsewhere in India.<br />
The flora mainly consists <strong>of</strong> aquatic weeds like Ipomoea aquatica, Scripus sp., Pharagmites sp., Ottelia sp.,<br />
Typha sp. etc. <strong>and</strong> certain trees species like Albezzia, Rain tree, Palmyrah, Prosopis <strong>and</strong> coconut. The lake<br />
supports a rich biodiversity <strong>and</strong> high biomass <strong>of</strong> fish, plankton that forms the source <strong>of</strong> food for birds.<br />
Pelicans arrive here during the nesting season to raise their young. In winter great activity can be seen here.<br />
The babble <strong>of</strong> Pelicans can be heard a quarter <strong>of</strong> a mile away. Apart from pelicans, one can find grey herons,<br />
white ibis, pond herons, egrets <strong>and</strong> many migratory ducks <strong>and</strong> water birds. Birds like Teals <strong>and</strong> Pintails are<br />
the main species. Other species include painted storks, open bill storks, grey Herons, cormorants, white<br />
Ibises, glossy Ibises, egrets, Reef Herons, Ducks, Coots, Shovellers, Terns, Jacanas, Moorhens etc can be<br />
seen here. Migratory Birds from Australia, Siberia, Egypt <strong>and</strong> Philippines assemble near the Kolleru Lake in<br />
search <strong>of</strong> a suitable place for their survival. These birds include some <strong>of</strong> the exclusive varieties like the Open<br />
Billed Stork, Shovellers, Painted Stork, Pintails, Glossy Ibises, Teals <strong>and</strong> Red Chested Podchards. Numerous<br />
other varieties <strong>of</strong> birds are also found in the Kolleru Lake Bird Sanctuary.<br />
Principal threat to the lake is from increased expansion <strong>of</strong> agricultural activities in the area. Further the lake is<br />
also being used as a dumping yard for industrial pollutants also, <strong>and</strong> a spurt in this activity is observed<br />
leading to severe eutrophication conditions in the lake. Water inlets into the lake are bonded thus reducing<br />
the inflows during summer <strong>and</strong> when water requirements for agriculture purpose are high <strong>and</strong> availability <strong>of</strong><br />
water is low.<br />
Field photographs <strong>of</strong> Kolleru lake<br />
IRS P6 LISS-III image : Part <strong>of</strong> Kolleru lake<br />
128
Plate 3: Wetl<strong>and</strong> map - 5 km buffer area <strong>of</strong> Kolleru Lake<br />
129
130
Plate 4: IRS LISS-III FCC - 5 km buffer area <strong>of</strong> Kolleru Lake<br />
131
9.2 Krishna Mangroves<br />
The mangrove area lies between latitude 16° 0’ - 16° 15’N <strong>and</strong> Longitude 81° 10’ - 81°- 15’ E. The northern<br />
tributary <strong>of</strong> the Krishna river drains in this area <strong>and</strong> this tributary brings in a lot <strong>of</strong> sediments <strong>and</strong> freshwater<br />
which has enabled the luxuriant mangrove growth. Mangrove in Krishna delta includes numerous species that<br />
help maintain the balance <strong>of</strong> coastal ecosystem. The most notable <strong>of</strong> Mangrove are species <strong>of</strong> Acanthaceae,<br />
Avicenniaceae or Verbenaceae (Black mangrove), Combretaceae (Buttonwood, White mangrove), Arecaceae<br />
(Mangrove palm), Rhizophoraceae (Red mangrove), Lythraceae (Mangrove apple) etc. families. The families<br />
considered as the minor components <strong>of</strong> Mangrove in India include the Acanthaceae, Bombacaceae,<br />
Cyperaceae, Euphorbiaceae, Lecythidaceae, Lythraceae, Meliaceae, Myrsinaceae, Myrtaceae,<br />
Pellicieraceae, Plumbaginaceae, Pteridaceae, Rubiaceae, Sterculiaceae, etc.<br />
The mangroves <strong>of</strong> Krishna delta occupy an area <strong>of</strong> around 27,661 ha. The second largest patch <strong>of</strong><br />
mangroves in <strong>Andhra</strong> <strong>Pradesh</strong>, the Krishna River emerges from the hills at Vijayawada, flows for about 96 km<br />
downstream by forming a delta before it eventually empties into the sea. The Hamsaladevi distributary is the<br />
first to branch out 60 km downstream from Vijayawada near Avanigadda <strong>and</strong> flows northward into the sea<br />
near Machilipatnam. Mangroves have been reported to be less abundant there. The Gollamattapaya <strong>and</strong><br />
Nadimeru distributaries branch out 25 km downstream from Avanigadda, <strong>and</strong> flow northward to join the sea.<br />
The main Krishna channel flows southward to join the sea near False Divi point. The abundance <strong>of</strong><br />
mangroves is more along the main Krishna River than the other distributaries. Mangroves are mainly<br />
prevalent around these three distributaries in tidal creeks, channels, lagoons, tidal flats <strong>and</strong> mudflats.<br />
The area has a warm, humid <strong>and</strong> tropical climate with an annual rainfall <strong>of</strong> around 110 cm. Thirty two species<br />
<strong>of</strong> mangrove <strong>and</strong> mangrove-associated plants belonging to 26 genera <strong>and</strong> 18 families are recorded in<br />
Godavari <strong>and</strong> Krishna mangrove ecosystems. Two species i.e., Scyphiphora hydrophyllacea (Godavari<br />
mangroves) <strong>and</strong> Aegialites rotundifolia (Krishna mangroves) are regarded as rare species. The areas are rich<br />
in plankton, various types <strong>of</strong> benthic organisms.<br />
Degraded Mangroves along Hamsaladeevi point Degraded Mangroves along River Krishna<br />
Mangroves along tidal creeks in Sorlagondi, Krishna District<br />
132
Plate 5: Wetl<strong>and</strong> map - 5 km buffer area <strong>of</strong> Krishna Mangroves<br />
133
134
Plate 6: IRS LISS-III FCC - 5 km buffer area <strong>of</strong> Krishna Mangroves<br />
135
9.3 Pakhal Lake<br />
Location: 79° 59' 59" E <strong>and</strong> 17° 57' 21" N<br />
District: Warangal District<br />
Area : 1836 ha<br />
The Pakhal Lake is located in Pakhal village <strong>of</strong> Warangal District. The lake was built by the Kakateeya king<br />
for supporting irrigation activities in the region, the environment around the lake is very serene. The lake lies<br />
between hills <strong>and</strong> deep forest provides a picturesque environment. Keeping in view the above said<br />
environmental beauty the Tourism Department <strong>of</strong> <strong>Andhra</strong> <strong>Pradesh</strong> had converted <strong>and</strong> promoted this lake as<br />
Eco-tourism spot. Due to excess erosion in the catchment areas an increased siltation activity is noticed in<br />
the lake bed, resulting in poor storage levels. The lake receives its waters from the hills located in the<br />
Narsampet Reserve Forest. The lake is categorised as protected under the wild life act <strong>and</strong> an area <strong>of</strong><br />
86,205 ha falls under this act which was established in the year 1952. Tourist facilities are being provided by<br />
the <strong>Andhra</strong> <strong>Pradesh</strong> Forest Department under Eco-tourism concept which is represented in the picture given<br />
below.<br />
Pakhal Wildlife Sanctuary:<br />
Field photographs <strong>of</strong> Pakhal Wildlife Sanctuary<br />
Pakhal Wildlife Sanctuary, covers an area <strong>of</strong> 860 sq. km. The natural beauty <strong>and</strong> the fresh ambience<br />
rejuvenate every visitor’s mind. Bamboo, Techtona gr<strong>and</strong>is, Adina cordifolia, Bombax ceiba, Bridelia retusa,<br />
Flacourtia indica <strong>and</strong> Garuga pinnata are the main vegetation. Tropical deciduous forest with evergreen<br />
species, woody herbs, climbers, shrubs <strong>and</strong> monsoon herbs are common in this sanctuary.<br />
With respect to fauna, this evergreen forest is the home ground for animals like; Spotted Deer, Sambar,<br />
Bluebull, Wild Boar, Hyena, Sloth Bear, Panther, Tiger, Leopard, Teals, Spoon Bills <strong>and</strong> Storks are the<br />
common that can be located in this Sanctuary. During winter’s season, migratory birds make their stay.<br />
136
Plate 7: Wetl<strong>and</strong> map - 5 km buffer area <strong>of</strong> Pakhal Lake<br />
137
138
Plate 8: IRS LISS-III FCC - 5 km buffer area <strong>of</strong> Pakhal Lake<br />
139
9.4 Pulicat Lagoon<br />
The lagoon’s boundary limits range between 13.33° to 13.66° N <strong>and</strong> 80.23° to 80.25°E, with a dried part <strong>of</strong><br />
the lagoon extending up to 14.0°N.; with about 84% <strong>of</strong> the lagoon in <strong>Andhra</strong> <strong>Pradesh</strong> <strong>and</strong> 16% in Tamil Nadu.<br />
The lagoon is aligned parallel to the coast line with its western <strong>and</strong> eastern parts covered with s<strong>and</strong> ridges.<br />
Area <strong>of</strong> the lake varies with the tide; 450 sq. km in high tide <strong>and</strong> 250 sq. km in low tide. Its length is about<br />
60 km with width varying from 0.2 km to 17.5 km. Climate <strong>of</strong> the lagoon coast line is dominated by Tropical<br />
monsoons. Air temperature varies from 15 °C to 45 °C. The large spindle-shaped barrier isl<strong>and</strong> named<br />
Sriharikota separates the lake from the Bay <strong>of</strong> Bengal. The s<strong>and</strong>y barrier isl<strong>and</strong>s <strong>of</strong> Irkam <strong>and</strong> Venad <strong>and</strong><br />
smaller isl<strong>and</strong>s in the north are aligned north–south <strong>and</strong> divide the lagoon into eastern <strong>and</strong> western sectors.<br />
The morphology <strong>of</strong> the lagoons is categorized under four types with large areas under mudflats <strong>and</strong> s<strong>and</strong>flats.<br />
The fishing village <strong>of</strong> Pulicat is at the south end <strong>of</strong> the lake. Three major rivers which feed the lagoon are the<br />
Arani River at the southern tip, the Kalangi River from the northwest <strong>and</strong> the Swarnamukhi River at the<br />
northern end, in addition to some smaller streams. The Buckingham Canal, a navigation channel, is part <strong>of</strong><br />
the lagoon on its western side. The lagoon's water exchange with the Bay <strong>of</strong> Bengal is through an inlet<br />
channel at the north end <strong>of</strong> Sriharikota <strong>and</strong> out flow channel <strong>of</strong> about 200 m width at its southern end, both <strong>of</strong><br />
which carry flows only during the rainy season.<br />
The lagoon has rich flora <strong>and</strong> fauna diversity, which supports active commercial fisheries <strong>and</strong> a large <strong>and</strong><br />
varied bird population. Fishing is the major occupation in the many villages located around the lake periphery<br />
<strong>and</strong> on the isl<strong>and</strong>s. The lake has rich fish diversity, mostly marine species, some truly brackish water <strong>and</strong> a<br />
few freshwater species. Mullets <strong>and</strong> Catfish are the major brackish water fish, which have supported<br />
sustenance fishing for the lake fishermen. The lake is a nursery for several species <strong>of</strong> fish. Two thirds <strong>of</strong> the<br />
settlements in the lake area are in Tamil Nadu <strong>and</strong> the balance in <strong>Andhra</strong> <strong>Pradesh</strong>. finfish <strong>and</strong> live lagoon<br />
Green crabs are also economic benefits from the lagoon. 168 total fish species are reported. The frequently<br />
found ones are the Mullets: M. cunnesius, M. jerdoni, M. dussumieri, M. cephalus, M. bornensis <strong>and</strong> Blowfish<br />
T. nigropunctatus, T. leopardus, Barbus dorsalis, Catfish Macrones vittatus, Sardines, Sardinella fimbriata<br />
<strong>and</strong> milk fish. Finfish, Green crabs, Clams <strong>and</strong> Prawns are the most commercially exploited fishes <strong>of</strong> the<br />
lagoon. Endangered Green sea turtles are found on the beaches <strong>of</strong> Sriharikota beach.<br />
The shallow lake is known for its diversity <strong>of</strong> aquatic birds <strong>and</strong> is an important stopover on migration routes<br />
<strong>and</strong> is reported to be the third most important wetl<strong>and</strong> on the eastern coast <strong>of</strong> India for migratory shorebirds,<br />
particularly during the spring <strong>and</strong> autumn migration seasons. Every year approximately 15,000 Greater<br />
Flamingos are reported to visit the lake along with pelicans, kingfishers, herons, painted storks, spoonbills<br />
<strong>and</strong> ducks. The highest concentrations <strong>of</strong> flamingo are found in the periphery <strong>of</strong> the lagoon where the water<br />
level is below 40 centimeters. The concentrations <strong>of</strong> flamingos are also associated with high algal, fish <strong>and</strong><br />
benthic diversity. Other water birds in the area include Spot-billed Pelican, seven species <strong>of</strong> herons <strong>and</strong><br />
egrets, Painted Stork, Greater Flamingos, ducks, 20 species <strong>of</strong> shorebirds, gulls, terns, Little Grebe, Indian<br />
Cormorant, Little Cormorant, Asian Openbill Stork, Black-headed Ibis, Eurasian Spoonbill, Lesser Whistling<br />
Teal, Spotbill Duck, Great Thick-knee <strong>and</strong> Stone Curlew. Several species <strong>of</strong> wintering waterfowl have been<br />
noted including Bar-headed Goose, Ruddy Shelduck, Eurasian Wigeon, Gadwall, Common Teal, Northern<br />
Pintail, Garganey, Northern Shoveler, Common Pochard, Brown-headed Gull, Black-headed Gull, Whiskered<br />
Tern, Gull-billed Tern <strong>and</strong> Caspian Tern. Birds <strong>of</strong> prey which appear in winter are the: White-bellied Sea<br />
Eagle, Osprey, Harriers <strong>and</strong> Peregrine Falcons. The largest concentrations <strong>of</strong> Flamingos occur in the <strong>Andhra</strong><br />
<strong>Pradesh</strong> part <strong>of</strong> the sanctuary, around the isl<strong>and</strong>s <strong>of</strong> Vendadu <strong>and</strong> Irukkam.<br />
Aquatic vegetation reported is 59 species, including eight Cyanophyceae, seven Chlorphyceae <strong>and</strong> two<br />
Rhodophyceae. Patches <strong>of</strong> residual, dry, evergreen forest <strong>and</strong> large areas <strong>of</strong> littoral scrub in woodl<strong>and</strong>s in<br />
fishing villages bordering the lagoon are seen. Invasive phytoplankton species <strong>of</strong> Prosopis juliflora, Spirulina<br />
major, Oscillatoria spp., Anabaena spp., Rhizosolenia castracanei, Eucampia cornuta <strong>and</strong> Climacodium<br />
fravenfeldianum in the plains on the periphery <strong>of</strong> the lake have been recorded.<br />
Field photographs <strong>of</strong> Pulicat Lagoon<br />
140
Plate 9: Wetl<strong>and</strong> map - 5 km buffer area <strong>of</strong> Pulicat Lagoon<br />
141
142
Plate 10: IRS LISS-III FCC - 5 km buffer area <strong>of</strong> Pulicat Lagoon<br />
143
9.5 Hussain Sagar Lake<br />
Hussain Sagar is one <strong>of</strong> the oldest man-made water-body constructed in mid-16 th centaury. It is fed by<br />
streams originated by Musi river, Faulksagar <strong>and</strong> Kukatpally tanks. It was a quiet <strong>and</strong> placid lake <strong>of</strong> 497 ha.<br />
The lake was originally constructed to cater to supply drinking water but it is not used as a drinking water<br />
source since 1930. The lake protects the lives <strong>and</strong> properties in the low lying areas around the lake from<br />
floods. The water temperature ranges from 25 0 C to 35 0 C. The pH value range from 7.4 to 8.7. The lake is<br />
recorded for Tendepis sp. <strong>and</strong> molluscs like; Bellamya bengalensis, Pila virens, Thiara scabra, T. lineate,<br />
Lymnaea acuminata <strong>and</strong> Indopolanorbis exustus. The avifauna include, Anas crecca, A. Penelope, A.<br />
poecilorhyncha, A. querquedula, Ardea cinera, A. gyayii, Aythya farina, Ceryle rudis, Cypsiurus parvus,<br />
Egretta alba, E. garzetta, Fulica atra, Hirundo rustica, Nettapus corom<strong>and</strong>elianus, Phalacrocorax niger <strong>and</strong><br />
Podiceps ruficollis. The main threat to the lake is encroachment by both private <strong>and</strong> public agencies.<br />
In addition to the encroachment the lake also faces the problem <strong>of</strong> pollution due to the continuous discharge<br />
<strong>of</strong> untreated domestic sewage <strong>and</strong> toxic industrial chemicals for several years. Although several Central<br />
Effluent Treatment Plant <strong>and</strong> Sewage Treatment Plant have grown up to restrict the pollution yet a<br />
considerable amount <strong>of</strong> sewage flows into the lake.<br />
Field photograph <strong>of</strong> Hussain Sagar Lake<br />
144
Plate 11: Wetl<strong>and</strong> map - 5 km buffer area <strong>of</strong> Hussain Sagar Lake<br />
145
146
Plate 12: IRS LISS-III FCC - 5 km buffer area <strong>of</strong> Hussain Sagar Lake<br />
147
9.6 Nagarjuna Sagar Reservoir<br />
Nagarjuna Sagar reservoir across the river Krishna is a major multipurpose river valley project built after the<br />
independence. Its major uses are irrigation <strong>and</strong> generation <strong>of</strong> electricity. It is located in the Nallamalai forests<br />
spanning across four districts (Nalgonda, Guntoor, Prakasam <strong>and</strong> Mahbubnagar) with central coordinates<br />
being 79°12' 33" E <strong>and</strong> 16° 32' 45" N covering an area <strong>of</strong> 28478 ha. The area came under protection <strong>and</strong><br />
was declared as Nagarjunasagar Wildlife Sanctuary in 1973,. Later it came under the Tiger Project, during<br />
1983. The Nagarjunasagar -Srisailam sanctuary was renamed the Rajiv G<strong>and</strong>hi Wildlife Sanctuary in the year<br />
1992, which include both Nagarjunasagar as well as Srisailam reservoir areas. The forest is mainly <strong>of</strong><br />
Tropical Dry Deciduous type. It experience very hot summers with temperatures reaching as high as 40° C,<br />
especially during March <strong>and</strong> June. The winters are comparatively pleasant <strong>and</strong> cool. The winter temperatures<br />
fall down to 10 ° C. The area experiences heavy rainfall caused by the south west monsoons, from the<br />
months <strong>of</strong> June to October.<br />
The Nagarjunasagar Tiger Reserve in <strong>Andhra</strong> <strong>Pradesh</strong> is the largest Tiger Reserve in India. It sprawls over<br />
an area <strong>of</strong> 3568 sq km. The flora in Nagarjunasagar is varied, with herbs, shrubs, trees <strong>and</strong> a few marshes<br />
with sedges. The scrubl<strong>and</strong> <strong>and</strong> the climbers are mainly found at the foothills while the well drained hill slopes<br />
in the Nagarjunasagar supports the thorn forest vegetation <strong>of</strong> the region. The rare plants <strong>of</strong> the region are<br />
Niebuhria apetala, Cissus vitiginea, Peterolobium indicum, Ziziphus xylopyrus. Spread over an area <strong>of</strong><br />
6 sq km is the Rollerpadu grassl<strong>and</strong>s near Srisailam. Dotted with dry, thorny bushes, a natural habitat for<br />
blackbucks. Other main species <strong>of</strong> flora in Nagarjunasagar are Anogeissus latifolia,<br />
Cleisthanthus collinus, Terminalia, Pterocarpus marsupium, Hardwickia binata, Boswellia serrara,<br />
Tectona gr<strong>and</strong>is etc.<br />
Tigers are an integral part <strong>of</strong> the fauna in Nagarjunasagar <strong>and</strong> otherwise also numerous <strong>and</strong> diverse.<br />
Apart from tigers, animals like leopard, jungle cat, wild dog, wolf, jackal, Bengal fox, sloth bear, four-horned<br />
antelope, sambar, spotted deer, bluebull, blackbuck, chinkara, Indian pangolin, langoor, bonnet macaque,<br />
smooth-coated otter, palm civet, striped hyena, wild boar, Indian spotted chevrotain, Indian muntjac, giant<br />
flying squirrel, Indian porcupine <strong>and</strong> Indian tree shrew at the sanctuary. Among the several reptiles, few are<br />
the Indian s<strong>of</strong>t-shelled turtle, Indian python, cobra, monitor lizard, <strong>and</strong> the marsh crocodile.<br />
Wildlife in Nagarjunasagar also includes nearly 150 species <strong>of</strong> avifauna. Common birds like the grey hornbill<br />
<strong>and</strong> peafowl. Other birds spotted by tourists in the sanctuary are Green Bee-eater, Hoopoe, White-bellied<br />
Drongo, Indian Treepie, etc.<br />
148
Plate 13: Wetl<strong>and</strong> map - 5 km buffer area <strong>of</strong> Nagarjuna Sagar Reservoir<br />
149
150
Plate 14: IRS LISS-III FCC - 5 km buffer area <strong>of</strong> Nagarjuna Sagar Reservoir<br />
151
152
SOI MAP SHEET-WISE WETLAND MAPS<br />
(Selected)<br />
153
154
155
156
157
158
159
160
161
162
163
164
165
166
REFERENCES<br />
1. Anon. 2005, NNRMS St<strong>and</strong>ards. A National St<strong>and</strong>ards for EO images, thematic & cartographic<br />
maps, GIS databases <strong>and</strong> spatial outputs. ISRO:NNRMS: TR:112:2005. A Committee Report:<br />
National Natural Resources Management System, Bangalore<br />
2. Anon. 1993. Directory <strong>of</strong> Indian Wetl<strong>and</strong>s, 1993. WWF India, New Delhi <strong>and</strong> AWB Kuala Limpur,<br />
xvi+264pp., 32 maps.<br />
3. Clark, John R. (1977). Coastal Ecosystem Management, A Wiley Interscience Publication, John<br />
Wiley & Sons, New York,.<br />
4. Cowardin, L.M., Carter, V., Golet, E.C. <strong>and</strong> La Roe (1979). Classification <strong>of</strong> wetl<strong>and</strong>s <strong>and</strong> deep water<br />
habitats. USFWS/085-79/31, Office <strong>of</strong> the Biological Services, U.S. Fish <strong>and</strong> Wildlife Service,<br />
Washington, D.C.<br />
5. Encyclopaedic Directory <strong>of</strong> <strong>Environment</strong> (1988). (Ed. By G.R. Chatwal, D.K. P<strong>and</strong>ey, <strong>and</strong> K.K.<br />
N<strong>and</strong>a). Vol. I-IV, Anmol Publications, New Delhi.<br />
6. Garg, J.K., Singh, T.S. <strong>and</strong> Murthy, T.V.R. (1998). Wetl<strong>and</strong>s <strong>of</strong> India. Project Report:<br />
RSAM/sac/resa/pr/01/98, June 1998, 240 p. Space Applications Centre, Ahmedabad,<br />
7. Garg J.K. <strong>and</strong> Patel J. G., 2007. National Wetl<strong>and</strong> Inventory <strong>and</strong> Assessment, Technical Guidelines<br />
<strong>and</strong> Procedure Manual, Technical Report, SAC/EOAM/AFEG/NWIA/TR/01/2007, June 2007, Space<br />
Applications Centre, Ahmedabad,<br />
8. Glossary <strong>of</strong> Geology (1974). (Ed. By Margarate G., Robbert, M. Jr. <strong>and</strong> Wolf, C.L), American<br />
Geological Institute, Washington, D.C..<br />
9. Jensen, J.R. (1986). Introductory Digital Image Processing: A Remote Sensing Perspective, Prentice<br />
Hall, Englewoods Cliff, NJ.<br />
10. Lacaux, J.P., Tourre, Y.M., Vignolles, C., Ndione, J.A. <strong>and</strong> Lafaye, M. 2007. Classification <strong>of</strong> ponds<br />
from high-spatial resolution remote sensing: Application to Rift valley fever epidemics in Senegal.<br />
Remote Sensing <strong>of</strong> <strong>Environment</strong>, 106, pp. 66-74<br />
11. Lilles<strong>and</strong>, T.M. <strong>and</strong> Keifer, R.W. 1987. Remote Sensing <strong>and</strong> Image Interpretation. John Wliey <strong>and</strong><br />
Sons, New York.<br />
12. Manorama Yearbook 2007<br />
13. McGraw - Hill Encyclopaedia <strong>of</strong> <strong>Environment</strong>al Science (1974). (Ed. Sybil P. Parkar), McGraw-Hill<br />
Book Company, New York.<br />
14. McFeeters, S.K. 1996. The use <strong>of</strong> Normalised Difference Water Index (NDWI) in the delineation <strong>of</strong><br />
open water features. International Journal <strong>of</strong> remote Sensing, 7, pp. 1425-1432.<br />
15. Millennium Ecosystem Assessment. 2005, Ecosystems <strong>and</strong> Human Well-being: A Framework for<br />
Assessment, http://www.MAweb.org<br />
16. Mitsch, William J. <strong>and</strong> Gosselink, James G. (1986). Wetl<strong>and</strong>s, Van Nostr<strong>and</strong> Reinhold Company,<br />
New York.<br />
17. Navalgund, R.R., Nayak, S.R., Sudarshana, R., Nagaraja, R. <strong>and</strong> Ravindran, S. 2002. Proceedings<br />
<strong>of</strong> the ISPRS Commission VII. Symposium on Resource <strong>and</strong> <strong>Environment</strong>al Monitoring, IAPRS &<br />
SIS, Vol.35, Part-7, NRSA, Hyderabad.<br />
18. Patel J.G., Singh T.S., Garg J.K. et al, Wetl<strong>and</strong> Information System, West Bengal,<br />
SAC/RSAM/RESA/FLPG/WIS/01/2003, A Technical report: Space Applications Centre, Ahmedabad<br />
19. Ramsar Convention (2007). www.ramsar.org<br />
20. Reid, George K <strong>and</strong> Wood, Richard D. (1976). Ecology <strong>of</strong> Inl<strong>and</strong> Waters <strong>and</strong> Estuaries. D. Van<br />
Nostr<strong>and</strong> Company, New York.<br />
21. SACON, 2004, Inl<strong>and</strong> Wetl<strong>and</strong>s <strong>of</strong> India : Conservation Atlas. Coimbatore, Salim Ali Centre for<br />
Ornithology <strong>and</strong> Natural History, 2004, ISBN 81-902136-1-X. ,Vedams eBooks (P) Ltd. Vardhaman<br />
Charve Plaza IV, Building # 9, K.P Block, Pitampura,<br />
22. Singh T.S., Patel J.G., Garg J.K. et al. Loktak Lake Resources Information System (LRIS),<br />
SAC/RSAM/RESIPA/FLPG/WIS/02/2003, A Technical report: Space Applications Centre,<br />
Ahmedabad<br />
23. Townshend, J.R., <strong>and</strong> Justice, C.O. 1986. Analysis <strong>of</strong> dynamics <strong>of</strong> African vegetation using the<br />
Normalised difference Vegetation Index. International Journal <strong>of</strong> Remote Sensing, 7, pp. 1435-1445.<br />
24. Tucker, C.J. <strong>and</strong> Sellers, P.J. 1986. Satellite remote sensing <strong>of</strong> primary productivity. International<br />
Journal <strong>of</strong> Remote Sensing, 7, pp. 1395-1416.<br />
25. Xu Hanqiu, 2006. Modification <strong>of</strong> normalised difference water index (NDWI) to enhance open water<br />
features in remotely sensed imagery. International Journal <strong>of</strong> Remote Sensing, 7, pp. 3025-3033.<br />
167
168
Annexure I<br />
Definitions <strong>of</strong> wetl<strong>and</strong> categories used in the project<br />
For ease <strong>of</strong> underst<strong>and</strong>ing, definitions <strong>of</strong> wetl<strong>and</strong> categories <strong>and</strong> their typical appearance on satellite imagery is given<br />
below:<br />
Wetl<strong>and</strong><br />
Definition <strong>and</strong> description<br />
type code<br />
1000 Inl<strong>and</strong> Wetl<strong>and</strong>s<br />
1100 Natural<br />
1101 Lakes: Larger bodies <strong>of</strong> st<strong>and</strong>ing water occupying distinct basins (Reid et al, 1976). These wetl<strong>and</strong>s<br />
occur in natural depressions <strong>and</strong> normally fed by streams/rivers. On satellite images lakes appear in<br />
different hues <strong>of</strong> blue interspersed with pink (aquatic vegetation), isl<strong>and</strong>s (white if unvegetated, red in<br />
case <strong>of</strong> terrestrial vegetation). Vegetation if scattered make texture rough.<br />
1102 Ox-bow lakes/ Cut <strong>of</strong>f me<strong>and</strong>ers: A me<strong>and</strong>ering stream may erode the outside shores <strong>of</strong> its broad<br />
bends, <strong>and</strong> in time the loops may become cut-<strong>of</strong>f, leaving basins. The resulting shallow crescentshaped<br />
lakes are called oxbow lakes (Reid et al, 1976). On the satellite image Ox-bow lakes occur<br />
near the rivers in plain areas. Some part <strong>of</strong> the lake normally has aquatic vegetation (red/pink in<br />
colour) during pre-monsoon season.<br />
1103 High Altitude lakes: These lakes occur in the Himalayan region. L<strong>and</strong>scapes around high lakes are<br />
characterized by hilly topography. Otherwise they resemble lakes in the plain areas. For keeping<br />
uniformity in the delineation <strong>of</strong> these lakes contour line <strong>of</strong> 3000 m above msl will be taken as<br />
reference <strong>and</strong> all lakes above this contour line will be classified as high altitude lakes.<br />
1104 Riverine Wetl<strong>and</strong>s: Along the major rivers, especially in plains water accumulates leading to<br />
formation <strong>of</strong> marshes <strong>and</strong> swamp. Swamps are ‘Wetl<strong>and</strong> dominated by trees or shrubs’ (U.S.<br />
Definition). In Europe, a forested fen (a peat accumulating wetl<strong>and</strong> that has no significant inflows or<br />
outflows <strong>and</strong> supports acidophilic mosses, particularly Sphagnum) could be called a swamp. In some<br />
areas reed grass - dominated wetl<strong>and</strong>s are also called swamps). (Mitsch <strong>and</strong> Gosselink, 1986).<br />
Marsh: A frequently or continually inundated wetl<strong>and</strong> characterised by emergent herbaceous<br />
vegetation adapted to saturated soil conditions. In European terminology a marsh has a mineral soil<br />
substrate <strong>and</strong> does not accumulate peat (Mitsch <strong>and</strong> Gosselink, 1986). Tone is grey blue <strong>and</strong> texture<br />
is smooth.<br />
Comment: Using satellite data it is difficult to differentiate between swamp <strong>and</strong> marsh. Hence, both<br />
have been clubbed together.<br />
1105 Waterlogged: Said <strong>of</strong> an area in which water st<strong>and</strong>s near, at, or above the l<strong>and</strong> surface, so that the<br />
roots <strong>of</strong> all plants except hydrophytes are drowned <strong>and</strong> the plants die (Margarate et al, 1974). Floods<br />
or unlined canal seepage <strong>and</strong> other irrigation network may cause waterlogging. Spectrally, during the<br />
period when surface water exists, waterlogged areas appear more or less similar to lakes/ponds.<br />
However, during dry season large or all parts <strong>of</strong> such areas dry up <strong>and</strong> give the appearance <strong>of</strong><br />
mud/salt flats (grey bluish).<br />
1106 River/stream: Rivers are linear water features <strong>of</strong> the l<strong>and</strong>scape. Rivers that are wider than the<br />
mapping unit will be mapped as polygons. Its importance arises from the fact that many stretches <strong>of</strong><br />
the rivers in Indo-Gangetic Plains <strong>and</strong> peninsular India are declared important national <strong>and</strong><br />
international wetl<strong>and</strong>s (Ex. The river Ganga between Brajghat <strong>and</strong> Garh Mukteshwar, is a Ramsar site,<br />
Ranganthattu on the Cavery river is a bird sanctuary etc.). Wherever, rivers are wide <strong>and</strong> features like<br />
s<strong>and</strong> bars etc. are visible, they will be mapped.<br />
1200 Man-made<br />
1201<br />
Reservoir: A pond or lake built for the storage <strong>of</strong> water, usually by the construction <strong>of</strong> a dam across a<br />
river (Margarate et al, 1974). On RS images, reservoirs have irregular boundary behind a prominent<br />
dyke. Wetl<strong>and</strong> boundary in case <strong>of</strong> reservoir incorporates water, aquatic vegetation <strong>and</strong> footprint <strong>of</strong><br />
water as well. In the accompanying images aquatic vegetation in the reservoir is seen in bright pink<br />
tone. Tone is dark blue in deep reservoirs while it is ink blue in case <strong>of</strong> shallow reservoirs or reservoirs<br />
with high silt load. These will be annotated as Reservoirs/Dam.<br />
Barrage: Dykes are constructed in the plain areas over rivers for creating Irrigation/water facilities.<br />
Such water storage areas develop into wetl<strong>and</strong>s (Harike Barrage on Satluj – a Ramsar site, Okhla<br />
barrage on the Yamuna etc. – a bird sanctuary). Water appears in dark blue tone with a smooth<br />
texture. Aquatic vegetation appears in pink colour, which is scattered, or contiguous depending on the<br />
density. Reservoirs formed by barrages will be annotated as reservoir/barrage.<br />
169
1202 Tanks/Ponds: A term used in Ceylon <strong>and</strong> the drier parts <strong>of</strong> Peninsular India for an artificial pond, pool<br />
or lake formed by building a mud wall across the valley <strong>of</strong> a small stream to retain the monsoon<br />
(Margarate et al, 1974). Ponds Generally, suggest a small, quiet body <strong>of</strong> st<strong>and</strong>ing water, usually<br />
shallow enough to permit the growth <strong>of</strong> rooted plants from one shore to another (Reid et al, 1976).<br />
Tanks appear in light blue colour showing bottom reflectance.<br />
In this category Industrial ponds/mining pools mainly comprising Ab<strong>and</strong>oned Quarries are also<br />
included (Quarry is defined as "An open or surface working or excavation for the extraction <strong>of</strong> stone,<br />
ore, coal, gravel or minerals." In such pits water accumulate (McGraw Hill Encyclopaedia <strong>of</strong><br />
<strong>Environment</strong>al Sciences, 1974), Ash pond/Cooling pond (The water body created for discharging<br />
effluents in industry, especially in thermal power plants (Encyclopaedic Directory <strong>of</strong> <strong>Environment</strong>,<br />
1988) <strong>and</strong> Cooling pond: An artificial lake used for the natural cooling <strong>of</strong> condenser-cooling water<br />
serving a conventional power station (Encyclopaedic Directory <strong>of</strong> <strong>Environment</strong>, 1988). These ponds<br />
can be <strong>of</strong> any shape <strong>and</strong> size. Texture is rough <strong>and</strong> tonal appearance light (quarry) to blue shade<br />
(cooling pond).<br />
1203 Waterlogged : Man-made activities like canals cause waterlogging in adjacent areas due to seepage<br />
especially when canals are unlined. Such areas can be identified on the images along canal network.<br />
Tonal appearance is in various hues <strong>of</strong> blue. Sometimes, such waterlogged areas dry up <strong>and</strong> leave<br />
white scars on the l<strong>and</strong>. Texture is smooth.<br />
1204 Salt pans: Inl<strong>and</strong> salt pans in India occur in Rajasthan (Sambhar lake). These are shallow rectangular<br />
man-made depressions in which saline water is accumulated for drying in the sun for making salt.<br />
2000 Coastal Wetl<strong>and</strong>s<br />
2100 Natural<br />
2101 Lagoons/Backwaters: Such coastal bodies <strong>of</strong> water, partly separated from the sea by barrier<br />
beaches or bass <strong>of</strong> marine origin, are more properly termed lagoons. As a rule, lagoons are elongate<br />
<strong>and</strong> lie parallel to the shoreline. They are usually characteristic <strong>of</strong>, but not restricted to, shores <strong>of</strong><br />
emergence. Lagoons are generally shallower <strong>and</strong> more saline than typical estuaries (Reid et al, 1976).<br />
Backwater: A creek, arm <strong>of</strong> the sea or series <strong>of</strong> connected lagoons, usually parallel to the coast,<br />
separated from the sea by a narrow strip <strong>of</strong> l<strong>and</strong> but communicating with it through barred outlets<br />
(Margarate et al, 1974).<br />
2102 Creek: A notable physiographic feature <strong>of</strong> salt marshes, especially low marshes. These creeks<br />
develop as do rivers "with minor irregularities sooner or later causing the water to be deflected into<br />
definite channels" (Mitsch <strong>and</strong> Gosselink, 1986). Creeks will be delineated, however, their area will<br />
not be estimated.<br />
2103 S<strong>and</strong>/Beach: Beach is an unvegetated part <strong>of</strong> the shoreline formed <strong>of</strong> loose material, usually s<strong>and</strong><br />
that extends from the upper berm (a ridge or ridges on the backshore <strong>of</strong> the beach, formed by the<br />
deposit <strong>of</strong> material by wave action, that marks the upper limit <strong>of</strong> ordinary high tides <strong>and</strong> wave wash to<br />
low water mark(Clark,1977).Beach comprising rocky material is called rocky beach.<br />
2104 Intertidal mudflats: Most unvegetated areas that are alternately exposed <strong>and</strong> inundated by the<br />
falling <strong>and</strong> rising <strong>of</strong> the tide. They may be mudflats or s<strong>and</strong> flats depending on the coarseness <strong>of</strong> the<br />
material <strong>of</strong> which they are made (Clark, 1977).<br />
2105 Salt Marsh: Natural or semi-natural halophytic grassl<strong>and</strong> <strong>and</strong> dwarf brushwood on the alluvial<br />
sediments bordering saline water bodies whose water level fluctuates either tidally or non- tidally<br />
(Mitsch <strong>and</strong> Gosselink, 1986). Salt marshes look in grey blue shade when wet.<br />
2106 Mangroves: The mangrove swamp is an association <strong>of</strong> halophytic trees, shrubs, <strong>and</strong> other plants<br />
growing in brackish to saline tidal waters <strong>of</strong> tropical <strong>and</strong> sub-tropical coastlines (Mitsch <strong>and</strong> Gosselink,<br />
1986). On the satellite images mangroves occur in red colour if in contiguous patch. When mangrove<br />
associations are scattered or are degraded then instead <strong>of</strong> red colour, brick red colour may be seen.<br />
2107 Coral reefs: Consolidated living colonies <strong>of</strong> microscopic organisms found in warm tropical waters. The<br />
term coral reef, or organic reef is applied to the rock- like reefs built-up <strong>of</strong> living things, principally<br />
corals. They consist <strong>of</strong> accumulations <strong>of</strong> calcareous deposits <strong>of</strong> corals <strong>and</strong> corraline algae with the<br />
intervening space connected with s<strong>and</strong>, which consists largely <strong>of</strong> shells <strong>of</strong> foraminefera. Present reefs<br />
are living associations growing on this accumulation <strong>of</strong> past (Clark, 1977). Reefs appear in light blue<br />
shade.<br />
2200 Man-made<br />
2201 Salt pans: An undrained usually small <strong>and</strong> shallow rectangular, man-made depression or hollow in<br />
which saline water accumulates <strong>and</strong> evaporates leaving a salt deposit (Margarate et al, 1974). Salt<br />
pans are square or rectangular in shape. When water is there appearance is blue while salt is formed<br />
tone is white.<br />
2202 Aquaculture ponds: Aquaculture is defined as "The breeding <strong>and</strong> rearing <strong>of</strong> fresh-water or marine<br />
fish in captivity. Fish farming or ranching". The water bodies used for the above are called aquaculture<br />
ponds (Encyclopaedic Directory <strong>of</strong> <strong>Environment</strong>, 1988). Aquaculture ponds are geometrical in shape<br />
usually square or rectangular. Tone is blue.<br />
170
Annexure – II<br />
Details <strong>of</strong> District information followed in the atlas<br />
Source : Survey <strong>of</strong> India (Surveyed in 2004 <strong>and</strong> published in 2005)<br />
Source : Survey <strong>of</strong> India (Surveyed in 2004 <strong>and</strong> published in 2005)<br />
171
172
Space Applications Centre (SAC) is one <strong>of</strong> the major<br />
centres <strong>of</strong> the Indian Space Research Organisation<br />
(ISRO). It is a unique centre dealing with a wide variety <strong>of</strong><br />
disciplines comprising design <strong>and</strong> development <strong>of</strong><br />
payloads, societal applications, capacity building <strong>and</strong><br />
space sciences, thereby creating a synergy <strong>of</strong><br />
technology, science <strong>and</strong> applications. The Centre is<br />
responsible for the development, realisation <strong>and</strong><br />
qualification <strong>of</strong> communication, navigation, earth &<br />
planetary observation, meteorological payloads <strong>and</strong><br />
related data processing <strong>and</strong> ground systems. Several<br />
national level application programmes in the area <strong>of</strong><br />
natural resources, weather <strong>and</strong> environmental studies,<br />
disaster monitoring/mitigation, etc are also carried out. It<br />
is playing an important role in harnessing space<br />
technology for a wide variety <strong>of</strong> applications for societal<br />
benefits.<br />
SAC is a host institution for the training programmes<br />
related to Satellite Communication, Satellite Meteorology<br />
<strong>and</strong> global change under the Centre for Space Science &<br />
Technology Education in Asia <strong>and</strong> the Pacific (CSSTEAP)<br />
affiliated to the United Nations (UN).<br />
http://www.isro.org
Space Applications centre<br />
Indian Space Research Organisation<br />
Ahmedabad – 380 015