Registration document 2007 - Total.com
Registration document 2007 - Total.com
Registration document 2007 - Total.com

Create successful ePaper yourself
Turn your PDF publications into a flip-book with our unique Google optimized e-Paper software.
2<br />
42<br />
Business overview<br />
Downstream<br />
Downstream<br />
The Downstream segment conducts<br />
TOTAL’s refining, marketing, trading and<br />
shipping activities.<br />
No. 1 in Western European refining/marketing (1)<br />
No. 1 in African marketing (2)<br />
Refining capacity of approximately 2.7 Mb/d at year-end 2006<br />
Nearly 17,000 retail stations at year-end 2006<br />
Approximately 3.8 Mb/d of products sold in 2006<br />
One of the leading worldwide traders of oil and refined<br />
products<br />
1.78 B€ invested in 2006<br />
34,467 employees<br />
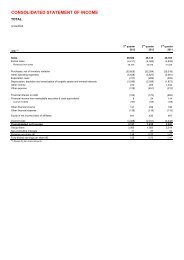
Downstream segment financial data<br />
(in M€) 2006 2005 2004<br />
Non-Group sales 113,887 99,934 86,896<br />
Adjusted operating in<strong>com</strong>e 3,644 3,899 3,235<br />
Adjusted net operating in<strong>com</strong>e 2,784 2,916 2,331<br />
Conditions in the oil market remained globally favorable in<br />
2006. Refinery margins, while lower than in 2005, remained<br />
on average at satisfactory level.<br />
In 2006, the downstream net operating in<strong>com</strong>e averaged<br />
2,784 M€ <strong>com</strong>pared to 2,916 M€ in 2005, down from 5%.<br />
Expressed in dollars, the downstream adjusted net operating<br />
in<strong>com</strong>e averaged $3.5 billion, down from $0.1 billion<br />
<strong>com</strong>pared to 2005. This evolution is notably due to the impact<br />
of the weaker refining environment, partially offset by favorable<br />
market effects (-$0.65 billion), the impact of performance<br />
improvement (approximately $0.3 billion) and the positive<br />
effect (an estimated $0.25 billion) of the recovery after the<br />
disruption of activities in 2005 (strikes in France and<br />
consequences of Hurricane Katrina in the United States).<br />
(1) Company sources, Oil and Gas Journal of December 18, 2006.<br />
(2) Company sources, PFC Energy, December 2006.<br />
TOTAL – <strong>Registration</strong> Document 2006<br />
Refinery throughput (kb/d) *<br />
2004<br />
313<br />
2 183<br />
* Including Group’s share in CEPSA.<br />
In 2006, refinery throughput averaged 2,454 kb/d <strong>com</strong>pared to<br />
2,410 kb/d in 2005, up 2%. Refinery utilization rate was 88% in<br />
2006.<br />
2006 refined products sales by geographical area:<br />
3,786 kb/d*<br />
15%<br />
Americas<br />
9%<br />
Africa<br />
2005<br />
313<br />
2 097<br />
Europe Rest of world<br />
Rest of world<br />
5%<br />
2006<br />
* Including trading activities and Group’s share in CEPSA.<br />
297<br />
2 157<br />
71%<br />
Europe