Registration document 2007 - Total.com
Registration document 2007 - Total.com
Registration document 2007 - Total.com

Create successful ePaper yourself
Turn your PDF publications into a flip-book with our unique Google optimized e-Paper software.
Appendix 1 – Consolidated financial statements<br />
Notes to the consolidated financial statement<br />
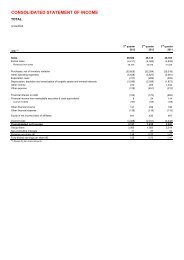
STATEMENT OF INCOME<br />
For the year ended December 31 (in M€) 2006 2005 2004<br />
Revenues from sales 1,497 5,561 5,156<br />
Purchases and other operating expenses (1,377) (5,274) (4,869)<br />
Depreciation of tangible assets (53) (404) (627)<br />
Operating in<strong>com</strong>e 67 (117) (340)<br />
Equity in in<strong>com</strong>e (loss) of affiliates, others (42) (325) (325)<br />
Taxes (30) (19) (33)<br />
Net In<strong>com</strong>e (5) (461) (698)<br />
BALANCE SHEET<br />
As of December 31 (in M€) 2006 (a) 2005 2004<br />
Non-current assets 1,995 2,011 2,160<br />
Working capital 1,501 1,337 1,129<br />
Provisions and other non-current liabilities (1,090) (1,116) (1,230)<br />
Capital employed 2,406 2,232 2 059<br />
Net debt (144) (551) (1,221)<br />
Shareholders' equity 2,262 1,681 838<br />
(a) Detailed assets and liabilities which have been spun-off as of May 12, 2006.<br />
STATEMENT OF CASH FLOW<br />
For the year ended December 31 (in M€) 2006 2005 2004<br />
Cash flow from operating activities 53 (348) (41)<br />
Cash flow used in investing activities (76) (263) (261)<br />
Cash flow from financing activities (109) (18) (17)<br />
Net increase/decrease in cash and cash equivalents (132) (629) (319)<br />
Effect of exchange rates and changes in reporting entities 113 622 327<br />
Cash and cash equivalents at the beginning of the period 84 91 83<br />
Cash and cash equivalent at the end of the period 65 84 91<br />
Earnings per share and diluted earnings per share are presented below for continuing and discontinued operations<br />
EARNINGS PER SHARE<br />
(in euros) 2006 2005 2004<br />
Earnings per share of continuing operations 5.13 5.42 4.78<br />
Earnings per share of discontinued operations 0.00 (0.19) (0.28)<br />
Earnings per share 5.13 5.23 4.50<br />
DILUTED EARNINGS PER SHARE<br />
(In euros) 2006 2005 2004<br />
Diluted earnings per share of continuing operations 5.09 5.39 4.76<br />
Diluted earnings per share of discontinued operations 0.00 (0.19) (0.28)<br />
Diluted earnings per share 5.09 5.20 4.48<br />
9<br />
TOTAL – <strong>Registration</strong> Document 2006 233