Revised Eburnean geodynamic evolution of the ... - Tectonique.net
Revised Eburnean geodynamic evolution of the ... - Tectonique.net Revised Eburnean geodynamic evolution of the ... - Tectonique.net
S. Perrouty et al. / Precambrian Research 204– 205 (2012) 12– 39 25 Fig. 7. Histograms showing the range of measured susceptibility for each rock type found in the area. Several samples were remeasured under laboratory condition to confirm the field based data. The susceptibility of sediments is commonly ten times lower than volcanic rocks. Granitoid susceptibilities are variable with the highest values obtained from dioritic composition. Late doleritic dykes display high magnetic susceptibility values. 4.2.1. D1 (Eoeburnean) Our D1 corresponds to N-S shortening that produced kilometric scale folds within the Sefwi Group. Near Shama village in the SE of the Ashanti Belt, rare field evidence of D1 deformation exists as highly deformed micaschists that alternate with basaltic layers. The relatively competent basalts are strongly boudinaged and define a bedding parallel S1 foliation. In other regions, S1 is oriented approximately E-W (Fig. 10A) and is defined by the alignment of biotite (Fig. 11A). Large-scale F1 folds are imaged using high-resolution radar revealing major F1 folds within volcanoclastic units (S0) of the Sefwi Group that are refolded by F3 folds (Fig. 6). Two discrete generations of quartz veins and pegmatite intrusions are distinguished. Early veins and intrusions are sub-parallel to bedding and often strongly boudinaged. According to their extension direction (subvertical at the time of formation for veins parallel to bedding), they should have formed pre or syn-D1. Second Table 5 Ranges of density values measured on 26 samples of the main lithologies in Ghana (this study) and in Burkina Faso (Baratoux et al., 2011). Unit Density ranges (g/cm 3 ) This study Baratoux et al. (2011) Hasting (1978) a Dolerite (Sill and Dykes) 2.87–2.90 2.92–2.93 Mpohor Mafic Complex (Gabbro, Diorite) 2.65–3.03 Eburnean granitoids 2.58–2.75 2.60–3.25 2.41–2.76 Eoeburnean granitoids 2.76–2.89 Tarkwa Group (Conglomerates, Quartzites, Phyllites) 2.68–2.99 2.71–2.77 2.45–2.84 Kumasi Group (Birimian Phyllites) 2.69 2.71–2.74 Sefwi Group (Birimian) Cape Coast Mica Schists 2.65 Volcanoclastics 2.70–2.84 2.66–2.99 2.74–3.00 Basalts/Andesites 2.84–2.93 2.72–2.97 Gabbros 3.01 3.07–3.11 a Density ranges after Hasting (1978, unpublished report referenced in Barritt and Kuma (1998)). generation veins and pegmatites cross-cut this composite S0–S1 fabric and were developed during D1. Both generations are refolded during subsequent D3 shortening. D1 deforms only the Sefwi Group basement, and is not observed in the overlying Kumasi and Tarkwa groups. This relationship suggests that these younger sedimentary packages were deposited after D1 and before subsequent deformation events (D3–D6). 4.2.2. D2 D2 corresponds to an extensional phase associated with the opening of the Kumasi and Akyem basins into which the Kumasi Group was deposited (Fig. 1). On the western side of the Ashanti Belt at the Prestea and Bogoso mines, the west-dipping Ashanti Fault marks the contact between Sefwi Group basement and Kumasi Group sediments. The early history of this fault contact is obscured by significant thrust and shear reactivation during D3 and D4. On the eastern side of the belt, in Damang, the Sefwi/Tarkwa Group contact has been faulted and sheared during later deformation. This sheared contact is represented by a 2 cm thick anastomosed fabric that was probably created during D3/D4 shear reactivation of an original sedimentary contact (erosion surface), or by reactivation of an existing faulted contact that was controlling the development of the Tarkwa Basin in the eastern Ashanti Belt. As a consequence of a strong overprinting of the original sedimentary contacts during Eburnean deformation, the tectonic context of the Tarkwa Group deposition remains unclear. 4.2.3. D3 (Eburnean) D3 deformation is conspicuous within both the Birimian and Tarkwaian units in the study area. NW-SE shortening produced km scale folds and a strong sub vertical crenulation cleavage within the Birimian and Tarkwaian units (striking around N040; Fig. 10A). Stereonets of bedding from the Kumasi Group and Tarkwa Group define a single major folding event associated with NW-SE shortening. However, the orientation of bedding within the Sefwi Group reflects the interference between D1 and D3 folds (Fig. 10A). The overprinting between F1 and F3 fold occurs across the region at multiple scales. In the Sefwi Group near Shama village, a composite S0–S1 foliation is crenulated and partially transposed along the S3 cleavage (Fig. 11A). Ptygmatic F3 folds are also found where they
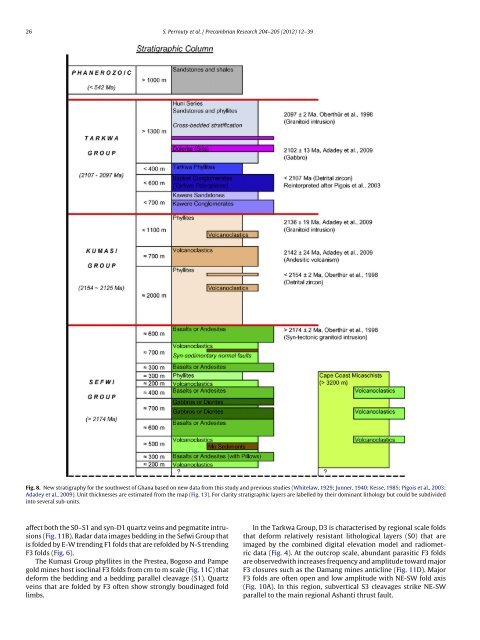
26 S. Perrouty et al. / Precambrian Research 204– 205 (2012) 12– 39 Fig. 8. New stratigraphy for the southwest of Ghana based on new data from this study and previous studies (Whitelaw, 1929; Junner, 1940; Kesse, 1985; Pigois et al., 2003; Adadey et al., 2009). Unit thicknesses are estimated from the map (Fig. 13). For clarity stratigraphic layers are labelled by their dominant lithology but could be subdivided into several sub-units. affect both the S0–S1 and syn-D1 quartz veins and pegmatite intrusions (Fig. 11B). Radar data images bedding in the Sefwi Group that is folded by E-W trending F1 folds that are refolded by N-S trending F3 folds (Fig. 6). The Kumasi Group phyllites in the Prestea, Bogoso and Pampe gold mines host isoclinal F3 folds from cm to m scale (Fig. 11C) that deform the bedding and a bedding parallel cleavage (S1). Quartz veins that are folded by F3 often show strongly boudinaged fold limbs. In the Tarkwa Group, D3 is characterised by regional scale folds that deform relatively resistant lithological layers (S0) that are imaged by the combined digital elevation model and radiometric data (Fig. 4). At the outcrop scale, abundant parasitic F3 folds are observedwith increases frequency and amplitude toward major F3 closures such as the Damang mines anticline (Fig. 11D). Major F3 folds are often open and low amplitude with NE-SW fold axis (Fig. 10A). In this region, subvertical S3 cleavages strike NE-SW parallel to the main regional Ashanti thrust fault.
- Page 1 and 2: Precambrian Research 204- 205 (2012
- Page 3 and 4: Table 1 Comparison between the tect
- Page 5 and 6: 16 S. Perrouty et al. / Precambrian
- Page 7 and 8: Table 3 Synthesis of structural and
- Page 9 and 10: Table 4 Summary table of the lithol
- Page 11 and 12: 22 S. Perrouty et al. / Precambrian
- Page 13: 24 S. Perrouty et al. / Precambrian
- Page 17 and 18: 28 S. Perrouty et al. / Precambrian
- Page 19 and 20: 30 S. Perrouty et al. / Precambrian
- Page 21 and 22: 32 S. Perrouty et al. / Precambrian
- Page 23 and 24: 34 S. Perrouty et al. / Precambrian
- Page 25 and 26: 36 S. Perrouty et al. / Precambrian
- Page 27 and 28: 38 S. Perrouty et al. / Precambrian
26 S. Perrouty et al. / Precambrian Research 204– 205 (2012) 12– 39<br />
Fig. 8. New stratigraphy for <strong>the</strong> southwest <strong>of</strong> Ghana based on new data from this study and previous studies (Whitelaw, 1929; Junner, 1940; Kesse, 1985; Pigois et al., 2003;<br />
Adadey et al., 2009). Unit thicknesses are estimated from <strong>the</strong> map (Fig. 13). For clarity stratigraphic layers are labelled by <strong>the</strong>ir dominant lithology but could be subdivided<br />
into several sub-units.<br />
affect both <strong>the</strong> S0–S1 and syn-D1 quartz veins and pegmatite intrusions<br />
(Fig. 11B). Radar data images bedding in <strong>the</strong> Sefwi Group that<br />
is folded by E-W trending F1 folds that are refolded by N-S trending<br />
F3 folds (Fig. 6).<br />
The Kumasi Group phyllites in <strong>the</strong> Prestea, Bogoso and Pampe<br />
gold mines host isoclinal F3 folds from cm to m scale (Fig. 11C) that<br />
deform <strong>the</strong> bedding and a bedding parallel cleavage (S1). Quartz<br />
veins that are folded by F3 <strong>of</strong>ten show strongly boudinaged fold<br />
limbs.<br />
In <strong>the</strong> Tarkwa Group, D3 is characterised by regional scale folds<br />
that deform relatively resistant lithological layers (S0) that are<br />
imaged by <strong>the</strong> combined digital elevation model and radiometric<br />
data (Fig. 4). At <strong>the</strong> outcrop scale, abundant parasitic F3 folds<br />
are observedwith increases frequency and amplitude toward major<br />
F3 closures such as <strong>the</strong> Damang mines anticline (Fig. 11D). Major<br />
F3 folds are <strong>of</strong>ten open and low amplitude with NE-SW fold axis<br />
(Fig. 10A). In this region, subvertical S3 cleavages strike NE-SW<br />
parallel to <strong>the</strong> main regional Ashanti thrust fault.


