EIGHTH KHAZANAH ANNuAl REvIEw - Khazanah Nasional Berhad
EIGHTH KHAZANAH ANNuAl REvIEw - Khazanah Nasional Berhad
EIGHTH KHAZANAH ANNuAl REvIEw - Khazanah Nasional Berhad

Create successful ePaper yourself
Turn your PDF publications into a flip-book with our unique Google optimized e-Paper software.
6<br />
7<br />
2012: EXECuTING STRATEGIC INITIATIvES<br />
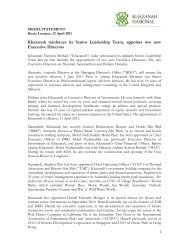
New economy investments (“Neis”)<br />
Total committed<br />
investments of<br />
RM84.8bn from<br />
2006 to Dec 2011, of<br />
which 45% has been<br />
actualised<br />
Price ↑ by ~ 400%<br />
since listing in<br />
Nov 2008<br />
Source: Iskandar Regional Development Authority (“IRDA”); Bloomberg<br />
Selected Neis<br />
iskandar Malaysia leisure & tourism khazanah - temasek<br />
Joint investments<br />
Supporting the National transformation Policy<br />
X Corporate<br />
Responsibility<br />
FLAGSHIP A<br />
JOHOR BAHRU CITY CENTRE<br />
• Central Business District<br />
• Danga Bay Integrated<br />
Waterfront City<br />
• Upgrading of Central Business District<br />
• Tebrau-Plentong Mixed Development<br />
• Customs, Immigration and<br />
Quarantine Complex (CIQ)<br />
• Johor-Singapore Causeway<br />
• Lido Boulevard<br />
• Conservation and Heritage Zones<br />
FLAGSHIP B<br />
NUSAJAYA<br />
FLAGSHIP C<br />
WESTERN GATE DEVELOPMENT<br />
• Port of Tanjung Pelepas<br />
• Tanjung Bin Power Plant<br />
• Malaysia - Singapore Second Link<br />
• RAMSAR World Heritage<br />
• Tanjung Piai - Southernmost Tip<br />
of Mainland Asia<br />
• Free Trade Zone<br />
FLAGSHIP D<br />
EASTERN GATE DEVELOPMENT<br />
• Tanjung Langsat Industrial Complex<br />
• Tanjung Langsat Port<br />
• Johor Port<br />
• Pasir Gudang Industrial Park<br />
• APTEC (Lakehill Resort City)<br />
X Knowledge Development<br />
Barefoot leadership<br />
Complexity of FTAs<br />
8 Summary and focus for 2012<br />
Summary for 2011<br />
X Steady financial performance: Net sellers, Markedto-Market<br />
portfolio dragged by regulated companies<br />
and soft markets, contrasted with record Profit<br />
Before Tax and dividend payout and stronger<br />
balance sheet covers<br />
X Significant on-going strategic progress: Defining<br />
year from various strategic and key transactions<br />
<strong>Khazanah</strong> and investee companies coverage across the region<br />
M+S Pte. Ltd.<br />
Urban Wellness and Resort<br />
Wellness developments in<br />
Iskandar Malaysia<br />
FLAGSHIP E<br />
SENAI DAI<br />
• Senai International Aiport<br />
• Senai Cargo Hub<br />
• Senai High-Tech Park<br />
• Sedenak Industrial Park<br />
• MSC Cyberport City<br />
• Johor Technology Park<br />
• Johor Premium Outlets®<br />
Healthcare<br />
X Support of National<br />
Transformation Initiatives<br />
ISKANDAR MALAYSIA - FIVE YEAR PROGRESS REPORT 1<br />
Outlook for 2012: Building True Value<br />
X Cautious investment outlook<br />
X On-going 5++ transformation strategy (GLCT, Regionalisation, NEIs, Collaboration<br />
and Co-investment, Core focus and strategic divestment)<br />
X Continuing support of National Transformation Policy<br />
X Institutionalisation<br />
THE JOURNEY CONTINUES<br />
5/2004 2005 2006 2007 2010 2015<br />
Phase 1: Mobilisation, Phase 2: Generate Phase 3: Tangible Phase 4:<br />
Diagnosis & Planning Momentum<br />
Results<br />
Full National Benefit<br />
14 months 12-17 months<br />
2-5 years<br />
5-10 years onwards<br />
5/2004<br />
1/2005<br />
2004 Measures PCG formed<br />
KPI and PLCs Performance 29th July 2005<br />
Transformation<br />
Manual Launch<br />
Targeted outcomes:<br />
The GLCT Programme was established as<br />
a 10-year journey over four phases. The<br />
Programme is now in its 7th year, just having<br />
entered Phase 4, which anticipates reaping<br />
the full national benefit by 2015. As such,<br />
it is timely to undertake this review of the<br />
performance and direction of the Programme,<br />
notwithstanding the financial and strategic<br />
achievements thus far.<br />
Given Malaysia’s aspirations to achieve<br />
developed nation status by 2020, the target of<br />
producing regional and domestic champions<br />
from amongst the ranks of the GLCs remains<br />
highly critical.<br />
Hence GLCs must relentlessly stay the course<br />
set out by the programme, and pursue the<br />
need to become champions and regionalise,<br />
while playing their roles in support of national<br />
development. These are among the roles<br />
required of GLCs in support of the New<br />
Economic Model.<br />
GLCs are clearly establishing their positions<br />
as domestic leaders and competitive at<br />
the regional level. Maybank and CIMB have<br />
branch networks across ASEAN which are on<br />
par with regional banking groups. Axiata has<br />
a subscriber base of 160 million across nine<br />
countries. Sime Darby derives more than 90% 31 of the 135 Entry Point Projects announced<br />
of its profits from global businesses spanning under the ETP, and must be accountable for<br />
20 countries. Tabung Haji’s operational delivery of these.<br />
efficiency have made it a recognised brand<br />
across the world.<br />
Thus while GLCs have made great strides<br />
forward, there is still much work to be<br />
In terms of national development, GLCs have done. The journey must continue, since the<br />
actively contributed to the national efforts in destination - a high income, inclusive and<br />
NKRAs and NKEAs. The G20 are involved in sustainable nation - is worth enduring the<br />
challenges.<br />
contracts<br />
Monitoring Phase<br />
Regular PCG Meetings<br />
Board composition reform<br />
Revamp of <strong>Khazanah</strong><br />
Policy Guidelines<br />
GLC leadership changes Ten 2005/6 Initiatives<br />
Diagnosis of GLCs<br />
2005/6 Initiatives<br />
Maintain momentum<br />
Several regional champions<br />
conducted<br />
implemented<br />
Tangible & sustained benefits Most GLCs performing at par<br />
Determination of Policy Full roll-out in place<br />
across GLCs<br />
with competitors<br />
Principles<br />
Key policies endorsed Visible benefits to all<br />
Initial 2004 Initiatives<br />
and executed upon<br />
stakeholders, e.g., customers,<br />
launched<br />
Early fruits of<br />
vendors, employees, etc.<br />
sustainable<br />
Large scale strategic and<br />
improvements<br />
financial changes made<br />
Material changes to Boards<br />
Source: GLC Transformation Manual, July 2005; PCG Analysis<br />
TODAY<br />
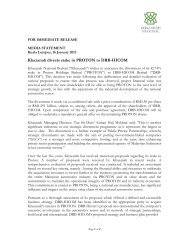
CHART 5: G20 asset distribution by<br />
geography<br />
1,000,000 Domestic Overseas<br />
900,000<br />
800,000<br />
23%<br />
700,000<br />
1,000,000 Domestic Overseas<br />
600,000<br />
900,000<br />
500,000<br />
800,000<br />
23%<br />
400,000<br />
700,000<br />
14%<br />
300,000<br />
77%<br />
600,000<br />
200,000<br />
500,000<br />
86%<br />
100,000<br />
400,000<br />
0<br />
14%<br />
300,000<br />
77%<br />
FY2004 FY2010<br />
200,000<br />
86%<br />
100,000<br />
0<br />
180,000 FY2004<br />
Domestic Overseas<br />
FY2010<br />
160,000<br />
140,000<br />
31%<br />
180,000 120,000<br />
Domestic Overseas<br />
160,000 100,000<br />
140,000 80,000<br />
25%<br />
31%<br />
120,000 60,000<br />
100,000 40,000<br />
75% 69%<br />
80,000 20,000<br />
25%<br />
60,0000<br />
FY2004 FY2010<br />
40,000<br />
75% 69%<br />
20,000<br />
0<br />
FY2004 FY2010<br />
24,927<br />
22,093<br />
24,927<br />
19,307<br />
22,093<br />
17,292<br />
19,307<br />
14,696<br />
17,292<br />
11,635<br />
10,617<br />
14,696<br />
9,602<br />
7,628<br />
11,635<br />
10,617<br />
9,602<br />
7,628<br />
CHART 6: G20 revenue distribution by<br />
geography<br />
RM bn<br />
24,000<br />
22,000<br />
RM bn<br />
24,000<br />
20,000<br />
22,000<br />
18,000<br />
20,000 16,000<br />
18,000<br />
14,000<br />
16,000<br />
12,000<br />
14,000 10,000<br />
12,000<br />
8,000<br />
10,000<br />
6,000<br />
FY2004 FY2005 FY2006 FY2007 FY2008 FY2009 FY2010 FY2011F FY2012F<br />
8,000<br />
6,000<br />
FY2004 FY2005 FY2006 FY2007 FY2008 FY2009 FY2010 FY2011F FY2012F<br />
31%<br />
OVERSEAS<br />
REVENUE<br />
in 2010, up from 25% in<br />
2004, pointing to the<br />
growth of the G20’s<br />
regional footprint<br />
participating companies<br />
(423858-X)<br />
www.pcg.gov.my<br />
TH Plantations <strong>Berhad</strong><br />
For further information,<br />
please visit our website at<br />
GLCs PERFORMANCE<br />
REPORT CARD<br />
2004 - 2010<br />
www.glcopenday.com.my<br />
2012: EXECUTING STRATEGIC INITIATIVES<br />
6 New Economy Investments (“NEIs”)<br />
7 Supporting the National Transformation Policy<br />
Summary for 2011<br />
portfolio dragged by regulator companies and soft<br />
markets, contrasted with record PBT and dividend<br />
payout and stronger balance sheet covers<br />
year from various strategic and key transactions<br />
Outlook for 2012: Building True Value<br />
and Co-investment, Core focus and strategic divestment)<br />
X Corporate<br />
X Knowledge Development<br />
X Support of National<br />
Responsibility<br />
8 Summary and Focus for 2012<br />
X Steady financial performance: Net sellers, MTM<br />
X Significant on-going strategic progress: Defining<br />
<strong>Khazanah</strong> and investee companies coverage across the region<br />
Total committed<br />
investments of<br />
RM84.8bn from<br />
2006 to Dec 2011, of<br />
which 45% has been<br />
actualised<br />
Price ↑ by ~400%<br />
since listing in<br />
Nov 2008<br />
Source: Iskandar Regional Development Authority (“IRDA”)<br />
Selected NEIs<br />
THE JOURNEY CONTINUES<br />
The GLCT Programme was established as<br />
a 10-year journey over four phases. The<br />
Programme is now in its 7th year, just having<br />
entered Phase 4, which anticipates reaping<br />
the full national benefit by 2015. As such,<br />
it is timely to undertake this review of the<br />
performance and direction of the Programme,<br />
notwithstanding the financial and strategic<br />
achievements thus far.<br />
Given Malaysia’s aspirations to achieve<br />
developed nation status by 2020, the target of<br />
producing regional and domestic champions<br />
from amongst the ranks of the GLCs remains<br />
highly critical.<br />
Hence GLCs must relentlessly stay the course<br />
set out by the programme, and pursue the<br />
need to become champions and regionalise,<br />
while playing their roles in support of national<br />
development. These are among the roles<br />
required of GLCs in support of the New<br />
Economic Model.<br />
GLCs are clearly establishing their positions<br />
as domestic leaders and competitive at<br />
the regional level. Maybank and CIMB have<br />
branch networks across ASEAN which are on<br />
par with regional banking groups. Axiata has<br />
a subscriber base of 160 million across nine<br />
countries. Sime Darby derives more than 90% 31 of the 135 Entry Point Projects announced<br />
of its profits from global businesses spanning under the ETP, and must be accountable for<br />
20 countries. Tabung Haji’s operational delivery of these.<br />
efficiency have made it a recognised brand<br />
across the world.<br />
Thus while GLCs have made great strides<br />
forward, there is still much work to be<br />
In terms of national development, GLCs have done. The journey must continue, since the<br />
actively contributed to the national efforts in destination - a high income, inclusive and<br />
NKRAs and NKEAs. The G20 are involved in sustainable nation - is worth enduring the<br />
challenges.<br />
Source: GLC Transformation Manual, July 2005; PCG Analysis<br />
X Cautious investment outlook<br />
X On-going 5++ transformation strategy (GLCT, Regionalisation, NEIs, Collaboration<br />
X Continuing support of National Transformation Policy<br />
X Institutionalisation<br />
FLAGSHIP A<br />
JOHOR BAHRU CITY CENTRE<br />
• Central Business District<br />
• Danga Bay Integrated<br />
Waterfront City<br />
• Upgrading of Central Business District<br />
• Tebrau-Plentong Mixed Development<br />
• Customs, Immigration and<br />
Quarantine Complex (CIQ)<br />
• Johor-Singapore Causeway<br />
• Lido Boulevard<br />
• Conservation and Heritage Zones<br />
TM<br />
FLAGSHIP B<br />
NUSAJAYA<br />
Iskandar Malaysia Leisure & Tourism <strong>Khazanah</strong> - Temasek JVs Healthcare<br />
Barefoot leadership<br />
Complexity of FTAs<br />
5/2004 2005 2006 2007 2010 2015<br />
Phase 1: Mobilisation, Phase 2: Generate Phase 3: Tangible Phase 4:<br />
Diagnosis & Planning Momentum<br />
Results<br />
Full National Benefit<br />
CHART 5: G20 asset distribution by<br />
geography<br />
CHART 6: G20 revenue distribution by<br />
geography<br />
in 2010, up from 25% in<br />
2004, pointing to the<br />
growth of the G20’s<br />
regional footprint<br />
14 months 12-17 months<br />
2-5 years<br />
5-10 years onwards<br />
5/2004<br />
1/2005<br />
2004 Measures PCG formed<br />
KPI and PLCs Performance 29th July 2005<br />
Transformation<br />
Manual Launch<br />
Targeted outcomes:<br />
contracts<br />
Monitoring Phase<br />
Regular PCG Meetings<br />
Board composition reform<br />
Revamp of <strong>Khazanah</strong><br />
GLC leadership changes<br />
Diagnosis of GLCs<br />
conducted<br />
Determination of Policy<br />
Principles<br />
Initial 2004 Initiatives<br />
launched<br />
Policy Guidelines<br />
Ten 2005/6 Initiatives<br />
2005/6 Initiatives<br />
Maintain momentum<br />
Several regional champions<br />
Tangible & sustained benefits Most GLCs performing at par<br />
across GLCs<br />
with competitors<br />
Visible benefits to all<br />
stakeholders, e.g., customers,<br />
vendors, employees, etc.<br />
Large scale strategic and<br />
financial changes made<br />
Material changes to Boards<br />
implemented<br />
Full roll-out in place<br />
Key policies endorsed<br />
and executed upon<br />
Early fruits of<br />
sustainable<br />
improvements<br />
participating companies<br />
1,000,000 Domestic Overseas<br />
900,000<br />
800,000<br />
23%<br />
700,000<br />
1,000,000 Domestic Overseas<br />
600,000<br />
900,000<br />
500,000<br />
800,000<br />
23%<br />
400,000<br />
700,000<br />
14%<br />
300,000<br />
77%<br />
600,000<br />
200,000<br />
500,000<br />
86%<br />
100,000<br />
400,000<br />
0<br />
14%<br />
300,000<br />
77%<br />
FY2004 FY2010<br />
200,000<br />
86%<br />
100,000<br />
0<br />
180,000 FY2004<br />
Domestic Overseas<br />
FY2010<br />
160,000<br />
140,000<br />
31%<br />
180,000 120,000<br />
Domestic Overseas<br />
160,000 100,000<br />
140,000 80,000<br />
25%<br />
31%<br />
120,000 60,000<br />
100,000 40,000<br />
75% 69%<br />
80,000 20,000<br />
25%<br />
60,0000<br />
FY2004 FY2010<br />
40,000<br />
75% 69%<br />
20,000<br />
0<br />
FY2004 FY2010<br />
24,927<br />
22,093<br />
24,927<br />
19,307<br />
22,093<br />
17,292<br />
19,307<br />
14,696<br />
17,292<br />
11,635<br />
10,617<br />
14,696<br />
9,602<br />
7,628<br />
11,635<br />
10,617<br />
9,602<br />
7,628<br />
RM bn<br />
24,000<br />
22,000<br />
RM bn<br />
24,000<br />
20,000<br />
22,000<br />
18,000<br />
20,000 16,000<br />
18,000<br />
14,000<br />
16,000<br />
12,000<br />
14,000 10,000<br />
12,000<br />
8,000<br />
10,000<br />
6,000<br />
FY2004 FY2005 FY2006 FY2007 FY2008 FY2009 FY2010 FY2011F FY2012F<br />
8,000<br />
6,000<br />
FY2004 FY2005 FY2006 FY2007 FY2008 FY2009 FY2010 FY2011F FY2012F<br />
31%<br />
OVERSEAS<br />
REVENUE<br />
TODAY<br />
GLCs PERFORMANCE<br />
REPORT CARD<br />
2004 - 2010<br />
TH Plantations <strong>Berhad</strong><br />
For further information,<br />
please visit our website at<br />
www.pcg.gov.my<br />
www.glcopenday.com.my<br />
ISKANDAR MALAYSIA - FIVE YEAR PROGRESS REPORT 1<br />
Urban Wellness and Resort<br />
Wellness developments in<br />
Iskandar Malaysia<br />
TM<br />
CHAPTER 2 - STRATEGIC POSITIONING<br />
Transformation Initiatives<br />
FLAGSHIP C<br />
WESTERN GATE DEVELOPMENT<br />
• Port of Tanjung Pelepas<br />
• Tanjung Bin Power Plant<br />
• Malaysia - Singapore Second Link<br />
• RAMSAR World Heritage<br />
• Tanjung Piai - Southernmost Tip<br />
of Mainland Asia<br />
• Free Trade Zone<br />
FLAGSHIP D<br />
• Tanjung Langsat Industrial Complex<br />
• Tanjung Langsat Port<br />
• Johor Port<br />
• Pasir Gudang Industrial Park<br />
• APTEC (Lakehill Resort City)<br />
M+S Pte. Ltd.<br />
EASTERN GATE DEVELOPMENT<br />
JOHOR<br />
FLAGSHIP E<br />
SENAI DAI<br />
• Senai International Aiport<br />
• Senai Cargo Hub<br />
• Senai High-Tech Park<br />
• Sedenak Industrial Park<br />
• MSC Cyberport City<br />
• Johor Technology Park<br />
• Johor Premium Outlets®<br />
ISKANDAR MALAYSIA - FIVE YEAR PROGRESS REPORT 1<br />
This brochure is printed on environmentally friendly paper.<br />
Please recycle and help save our planet.<br />
January 2012<br />
TM<br />
CHAPTER 2 - STRATEGIC POSITIONING<br />
JOHOR<br />
CHAPTER 2 - STRATEGIC POSITIONING<br />
www.khazanah.com.my<br />
<strong>EIGHTH</strong><br />
<strong>KHAZANAH</strong> ANNUAL REVIEW<br />
18 JANUARY 2012<br />
REVIEW OF 2011 & OUTLOOK FOR 2012<br />
TM<br />
CHAPTER 2 - STRATEGIC POSITIONING<br />
ISKANDAR MALAYSIA - FIVE YEAR PROGRESS REPORT 1<br />
2012<br />
January 2012<br />
This brochure is printed on environmentally friendly paper.<br />
Please recycle and help save our planet.<br />
<strong>EIGHTH</strong><br />
<strong>KHAZANAH</strong> <strong>ANNuAl</strong> <strong>REvIEw</strong><br />
Review of 2011 & outlook foR 2012<br />
18 JaNuaRy 2012<br />
www.khazanah.com.my<br />
2012
1<br />
(33.5%)<br />
• 2,148 families including in East Malaysia<br />
Building Award FIABCI Malaysia<br />
FIG FINANCIAl PERFORMANCE have received benefits<br />
Property Award 2009’<br />
Property<br />
FINANCIAl PERFORMANCE 140<br />
1.6%<br />
• CATAlYSING RM1.5bn (1.4) (37.4%) of procurement GROwTH & vAluE CREATION<br />
financial & portfolio performance<br />
.4% Listed Portfolio TSR<br />
.3%<br />
KLCI<br />
.9%<br />
SET Index<br />
.4% Straits Times Index<br />
.3% Jakarta Stock Price Index<br />
Hang Seng Index<br />
Shanghai Composite Index<br />
.3%<br />
SENSEX<br />
8% MSCI Emerging Markets<br />
5% MSCI Asia ex-Japan<br />
8% MSCI AC World<br />
10% 20% 30% 40% 50%<br />
K-9 TSR<br />
KLCI<br />
Jakarta<br />
Composite<br />
Index<br />
SE<br />
ailand<br />
Index<br />
SENSEX<br />
3<br />
Technology Life<br />
Sciences<br />
0.4%<br />
Agriculture Leisure Automotive<br />
0.4% 0.5% & Tourism 1.0%<br />
0.8%<br />
Sustainable<br />
Transportation<br />
G-20 and K-9 have<br />
Development<br />
& Logistics<br />
0.2%<br />
CAGR* outperformed the other<br />
4.7%<br />
• Higher service delivery and quality<br />
• >5,000 graduates placed in 638<br />
290<br />
Total Economic Profit for G-20 Total Economic Profit for K-9<br />
levels<br />
constituents of the KLCI<br />
Education<br />
Healthcare<br />
companies; 72% have secured jobs<br />
G-20 Index 14.5%<br />
Total Economic Loss for G-20 Total Economic Loss for K-9<br />
by 1.1% and 2.0%<br />
0.1%<br />
5.1%<br />
• ‘Skytrax 2010 World Airport Awards’<br />
FBM KLCI ex G-20 13.4%<br />
• 207 schools adopted by 25 GLCs, covering<br />
respectively<br />
3.5<br />
Infrastructure &<br />
• ‘The Edge Malaysia's Developers<br />
more than 103,000 students<br />
240<br />
Construction<br />
K-9 Index<br />
Awards No.1 property company in<br />
15.1%<br />
Media &<br />
9.7%<br />
Others<br />
FBM KLCI ex K-9 13.1%<br />
1.8<br />
• ‘Straight As’ UPSR results exceeded<br />
Malaysia’ 2009<br />
Comms<br />
10.4%<br />
national average for 2007, 2008 and<br />
• ‘World's Leading Airline to Asia’<br />
22.8%<br />
190<br />
0.3<br />
2009<br />
Utilities<br />
• The Curve – ‘Best Commercial<br />
10.8%<br />
• 2,148 families including in East Malaysia<br />
Building Award FIABCI Malaysia<br />
FIG<br />
have received benefits<br />
Property Award 2009’<br />
Property<br />
140<br />
(1.4)<br />
19.1%<br />
31 Dec-11<br />
(1.7)<br />
14.0%<br />
(1.9)<br />
(1.8)<br />
COMMUNITY AND CSR CUSTOMERS<br />
(3.0)<br />
100=14/5/04<br />
VENDORS AND SUPPLIERS EMPLOYEES & HUMAN CAPITAL<br />
(3.7)<br />
90<br />
May Jan Sep May Jan Sep May Jan Sep May Jan Sep (4.6)<br />
-04 -05 -05 -06 -07 -07 -08 -09 -09 -10 -11 -11<br />
2005 2006 2007 2008 2009<br />
• 130 graduates of ‘Vendor Development<br />
* Compounded Annual Growth Rate for the period of 14 May 2004 to 31 December 2011<br />
Programme’ since 2004<br />
• G-GLC Cross Fertilisation Programme –<br />
2nd cycle, 30 participants cross assigned<br />
• Assisting Bumiputera vendors to<br />
to increase public-private cooperation<br />
develop Halal products<br />
• Collaboration with universities:<br />
• HSBB – Contracts to Bumiputeras >53%<br />
by value<br />
Middle East<br />
Aggregate earnings have increased for G20 by<br />
343<br />
Others<br />
1.0%<br />
RM7.7bn and for K9 by RM5.3bn from ‘04 to ‘10<br />
1.0%<br />
India<br />
• 70% of procurement spend awarded to<br />
1.5% Bumiputera vendors<br />
23.1<br />
293<br />
China<br />
G-20<br />
273<br />
1.6%<br />
• RM1.5bn (37.4%) of procurement<br />
G-20<br />
19.3<br />
Singapore directed to 60% Bumi vendors<br />
19.0<br />
K-9<br />
K-9<br />
224<br />
4.9%<br />
17.3<br />
204<br />
Malaysia<br />
14.7<br />
181<br />
172<br />
159<br />
155<br />
90.0%<br />
152<br />
11.7<br />
136<br />
10.6<br />
9.6<br />
97<br />
108<br />
101<br />
7.6 10.8<br />
10.8<br />
11.6<br />
8.5<br />
7.4<br />
Stay the course in executing<br />
6.5 6.5<br />
5.5<br />
the 10 year GLCT<br />
Programme<br />
3.3<br />
14 May 31 Dec 31 Dec 31 Dec 31 Dec 31 Dec 31 Dec<br />
Continue<br />
focus on core<br />
1<br />
2004 2005 2006 2007 2008 2009 2010 2011F 2012F 2004 2005 2006 2007 2008 2009 2010<br />
operations: level<br />
Relentless<br />
playing 5<br />
drive to<br />
field and<br />
2<br />
GLIC/GLC become<br />
exit non-core/<br />
non-competitive<br />
regional<br />
roles in NEM<br />
assets<br />
champions<br />
4<br />
3<br />
RM bn<br />
111.6<br />
120<br />
91.2<br />
Collaborate and Pursue new economy<br />
100<br />
co-invest with investments in line<br />
private sector with NEM<br />
80<br />
60<br />
50.9<br />
40<br />
<strong>Khazanah</strong>’s<br />
NWA growth 20<br />
31 Dec<br />
31 Dec<br />
0.4%<br />
0<br />
2010<br />
14 May<br />
2009<br />
2004<br />
4.1%<br />
74.8<br />
RM bn<br />
80<br />
39.1%<br />
70<br />
53.8<br />
60<br />
124.6%<br />
6.5%<br />
50<br />
40<br />
33.3<br />
1.2%<br />
30<br />
20<br />
10<br />
31 Dec<br />
31 Dec<br />
0<br />
2010<br />
14 May<br />
2009<br />
2004<br />
MSCI<br />
Emerging Markets<br />
%<br />
(7.0%)<br />
(15.7%)<br />
MSCI<br />
AC World (3.7%)<br />
Straits<br />
Times Index<br />
Shanghai<br />
Composite Index<br />
(11.9%)<br />
(13.6%)<br />
MSCI<br />
Asia ex-Japan (14.4%)<br />
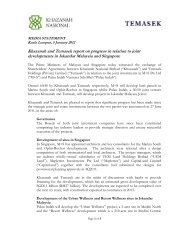
RealiSable aSSet value (“Rav”) Net woRtH aDJuSteD<br />
(RM bn)<br />
108.1<br />
Hang Seng<br />
(14.5%)<br />
Index<br />
1 Based on unaudited accounts<br />
2 NWA: RAV less Total Liabilities and adjusted to measure value created<br />
3 TSR: Total Shareholders’ Return<br />
4 In MYR terms<br />
2 (“Nwa”)<br />
(RM bn)<br />
70.0<br />
RM bn<br />
120<br />
100<br />
80<br />
60<br />
40<br />
20<br />
31 Dec<br />
31 Dec<br />
31 Dec<br />
2011<br />
0 14 May 2009<br />
2010<br />
2004<br />
1<br />
RM bn<br />
75.2<br />
70.0<br />
53.8<br />
33.3<br />
31 Dec<br />
31 Dec<br />
31 Dec<br />
2011<br />
14 May 2009<br />
2010<br />
2004<br />
1<br />
RM bn<br />
120<br />
100<br />
80<br />
60<br />
40<br />
20<br />
31 Dec<br />
31 Dec<br />
31 Dec<br />
2011<br />
0 14 May 2009<br />
2010<br />
2004<br />
112.6<br />
108.1<br />
91.2<br />
50.9<br />
80<br />
70<br />
60<br />
50<br />
40<br />
30<br />
20<br />
10<br />
0<br />
RM bn<br />
90<br />
78<br />
80<br />
69<br />
70<br />
60<br />
56<br />
50<br />
42<br />
40<br />
30 26<br />
20<br />
11<br />
10<br />
0<br />
2006 2007 2008 2009 2010 Sep-11<br />
Manufacturing<br />
Properties<br />
Utilities, Tourism & Others Government<br />
Committed Investment<br />
1<br />
RM bn<br />
75.2<br />
70.0<br />
53.8<br />
33.3<br />
31 Dec<br />
31 Dec<br />
31 Dec<br />
2011<br />
14 May 2009<br />
2010<br />
2004<br />
1<br />
Portfolio value as at 14 May 04 31 Dec 09 31 Dec 10 31 Dec 11<br />
112.6<br />
108.1<br />
91.2<br />
50.9<br />
80<br />
70<br />
60<br />
50<br />
2 Portfolio activity and segmentation<br />
40<br />
30<br />
20<br />
10<br />
0<br />
Technology Life<br />
Sciences<br />
33.4% Listed Portfolio TSR<br />
0.4%<br />
Agriculture Leisure Automotive<br />
0.4% 0.5% & Tourism 1.0%<br />
0.8%<br />
Sustainable<br />
Transportation<br />
23.3%<br />
KLCI Development<br />
RM bn<br />
& Logistics<br />
0.2%<br />
90<br />
4.7%<br />
• Higher service delivery and quality<br />
• >5,000 graduates placed in 638<br />
78<br />
levels<br />
80<br />
69 45.9%<br />
SET Index Education<br />
Healthcare<br />
companies; 72% have secured jobs<br />
70<br />
0.1%<br />
5.1%<br />
• ‘Skytrax 2010 World Airport Awards’<br />
• 207 schools adopted by 25 GLCs, covering<br />
60<br />
56<br />
Infrastructure &<br />
• ‘The Edge Malaysia's Developers<br />
10.4% Straits Times Index<br />
Construction<br />
more than 103,000 students<br />
50<br />
Awards No.1 property company in<br />
42<br />
Media &<br />
9.7%<br />
40<br />
Others<br />
• ‘Straight As’ UPSR results exceeded<br />
Malaysia’ 2009<br />
30 26<br />
41.3% Jakarta Stock Price Index<br />
Comms<br />
10.4%<br />
national average for 2007, 2008 and<br />
• ‘World's Leading Airline to Asia’<br />
22.8%<br />
2009<br />
20<br />
11<br />
Utilities<br />
• The Curve – ‘Best Commercial<br />
10<br />
(3.8%)<br />
Technology Hang Life Seng Index<br />
10.8%<br />
• 2,148 families including in East Malaysia<br />
Building Award FIABCI Malaysia<br />
0<br />
Sciences<br />
2006 33.4% 2007 2008 2009 Listed 2010Portfolio Sep-11 TSR<br />
0.4%<br />
Agriculture Leisure Automotive FIG<br />
have received benefits<br />
Property Award 2009’<br />
0.4%<br />
& Tourism 1.0%<br />
Property<br />
0.5%<br />
(19.7%) Shanghai Composite Index 0.8%<br />
19.1%<br />
14.0%<br />
Manufacturing<br />
Properties<br />
Sustainable<br />
COMMUNITY AND CSR CUSTOMERS<br />
Transportation<br />
23.3%<br />
KLCI Development<br />
Utilities, Tourism & Others Government<br />
& Logistics<br />
0.2%<br />
• Higher service delivery and quality<br />
CAGR*<br />
10.3%<br />
SENSEX<br />
4.7%<br />
VENDORS AND SUPPLIERS EMPLOYEES<br />
• >5,000 graduates placed in 638<br />
290 & HUMAN CAPITA<br />
Committed Investment<br />
levels<br />
Healthcare<br />
45.9%<br />
SET Index Education<br />
companies; 72% have secured jobs<br />
G-20 Index 14.5%<br />
0.1%<br />
5.1%<br />
• 130 graduates of ‘Vendor • Development<br />
‘Skytrax 2010 World Airport Awards’<br />
5.8% MSCI Emerging Markets<br />
FBM KLCI ex G-20 13.4%<br />
• 207 schools adopted by 25 GLCs, covering<br />
Infrastructure &<br />
Programme’ since 2004<br />
• G-GLC Cross Fertilisation Programme –<br />
• ‘The Edge Malaysia's Developers<br />
10.4% Straits Times Index<br />
Construction<br />
more than 103,000 students<br />
2nd cycle, 30 participants 240<br />
K-9 cross Indexassigned Awards No.1 property company in<br />
15.1%<br />
Media &<br />
9.7%<br />
• Assisting Bumiputera vendors to<br />
6.5% MSCI Asia ex-Japan<br />
Others<br />
• ‘Straight As’ UPSR results exceeded<br />
Malaysia’ 2009<br />
to increase public-private FBM cooperation KLCI ex K-9 13.1%<br />
41.3% Jakarta Stock Price Index<br />
Comms<br />
develop Halal products<br />
10.4%<br />
national average for 2007, 2008 and<br />
• ‘World's Leading Airline to Asia’<br />
• Collaboration with universities:<br />
22.8%<br />
190<br />
0.8% MSCI AC World<br />
2009<br />
• HSBB – Contracts to Bumiputeras >53%<br />
Utilities<br />
• The Curve – ‘Best Commercial<br />
by value<br />
(3.8%)<br />
Hang Seng Index<br />
10.8%<br />
• 2,148 families Middle including East in East Malaysia<br />
Building Award FIABCI Malaysia<br />
FIG<br />
Others<br />
have received benefits<br />
Property Award 2009’<br />
(20%) (10%) 0% 10% 20% 30% 40% 50% Property<br />
1.0%<br />
1.0%<br />
India<br />
• 70% of procurement spend awarded to<br />
140<br />
(19.7%) Shanghai Composite Index<br />
19.1%<br />
14.0%<br />
1.5% Bumiputera vendors<br />
COMMUNITY China AND CSR CUSTOMERS<br />
1.6%<br />
• RM1.5bn (37.4%) of procurement<br />
100=14/5/04<br />
10.3%<br />
SENSEX<br />
VENDORS AND Singapore SUPPLIERS directed to 60% Bumi vendors EMPLOYEES & HUMAN CAPITAL<br />
90<br />
4.9%<br />
May Jan Sep May Jan<br />
-04 -05 -05 -06 -07<br />
• 130 graduates of ‘Vendor Development<br />
5.8% MSCI Emerging Markets<br />
* Compounded Annual Growth Rate fo<br />
Malaysia<br />
Programme’ since 2004<br />
• G-GLC Cross Fertilisation Programme –<br />
90.0%<br />
2nd cycle, 30 participants cross assigned<br />
• Assisting Bumiputera vendors to<br />
6.5% MSCI Asia ex-Japan<br />
to increase public-private cooperation<br />
develop Halal products<br />
• Collaboration with universities:<br />
0.8% MSCI AC World<br />
1<br />
Rav (RM bn) 50.9 91.2 112.6 108.1<br />
Nwa2 (RM bn) 33.3 53.8 75.2 70.0<br />
Rav/liability Cover (x) 2.9 2.1 2.6 2.9<br />
Shareholders’ funds (RM bn) 7.7 17.6 21.4 24.6<br />
4 Selected key transactions in 2011<br />
fy ‘04 ‘05 ‘06 ‘07 ‘08 ‘09 ‘10 ‘11<br />
5 Selected progress on regionalisation<br />
1<br />
Profit<br />
before tax 282 (831) 1,014 5,110 128 791 2,081 5,334<br />
(RM m)<br />
Dividends<br />
Declared 30 30 100 1,000 100 100 500 3,000<br />
(RM m)<br />
Total Return 20114 31 Dec<br />
31 Dec<br />
2011<br />
2010<br />
Strategic divestment of <strong>Khazanah</strong>’s 32% stake in POS<br />
Malaysia for RM623m. The two-stage divestment process<br />
sets a template for future transactions<br />
Mitsui acquires a 30% stake in IHH for RM3.3bn.<br />
Subsequently, IHH and <strong>Khazanah</strong> co-invest USD1.0bn for<br />
75% of Acibadem Hospitals in Turkey, resulting in one of the<br />
world’s largest healthcare companies<br />
Three Malaysian airlines enter into a Comprehensive<br />
Collaboration Framework, which will result in increased<br />
choice and improved service quality for consumers<br />
Resolution of PoA leads to joint developments in Iskandar<br />
Malaysia and Singapore, with total Gross Development Value<br />
(“GDV”) estimated at RM30bn<br />
Collaboration with a private sector company in a joint<br />
development in Zone F Medini, with total GDV estimated<br />
at RM12bn<br />
RM23bn privatisation of PLUS by UEM Group and EPF,<br />
concurrent with revised toll concessions to reduce burden<br />
on users<br />
1<br />
75.2<br />
69.9<br />
31 Dec<br />
31 Dec<br />
2011<br />
2010<br />
1<br />
X<br />
s<br />
n<br />
ive<br />
tSR iNDeX fRoM 14 May ‘04 to 31 DeC ‘11<br />
aggRegate eaRNiNgS (RM bn)<br />
d<br />
tion<br />
G-20 and K-9 have<br />
stics112.6<br />
108.1<br />
CAGR* outperformed the other<br />
.7%<br />
• Higher service delivery and quality<br />
• >5,000 graduates placed in 638<br />
290<br />
Total Economic Profit for G-20 Total Economic Profit for K-9<br />
levels<br />
constituents of the KLCI<br />
care<br />
companies; 72% have secured jobs<br />
G-20 Index 14.5%<br />
Total Economic Loss for G-20 Total Economic Loss for K-9<br />
.1%<br />
• ‘Skytrax 2010 World Airport Awards’<br />
by 1.1% and 2.0%<br />
FBM KLCI ex G-20 13.4%<br />
• 207 schools adopted by 25 GLCs, covering<br />
respectively<br />
3.5<br />
• ‘The Edge Malaysia's Developers<br />
more than 103,000 students<br />
240<br />
K-9 Index<br />
Awards No.1 property company in<br />
15.1%<br />
1.8<br />
• ‘Straight As’ UPSR results exceeded<br />
Malaysia’ 2009<br />
FBM KLCI ex K-9 13.1%<br />
national average for 2007, 2008 and<br />
• ‘World's Leading Airline to Asia’<br />
190<br />
0.3<br />
2009<br />
• The Curve – ‘Best Commercial<br />
• 2,148 families including in East Malaysia<br />
Building Award FIABCI Malaysia<br />
have received benefits<br />
Property Award 2009’<br />
140<br />
(1.4)<br />
31 Dec-11<br />
(1.7)<br />
(1.9)<br />
(1.8)<br />
COMMUNITY AND CSR CUSTOMERS<br />
(3.0)<br />
100=14/5/04<br />
VENDORS AND SUPPLIERS EMPLOYEES & HUMAN CAPITAL<br />
(3.7)<br />
90<br />
May Jan Sep May Jan Sep May Jan Sep May Jan Sep (4.6)<br />
-04 -05 -05 -06 -07 -07 -08 -09 -09 -10 -11 -11<br />
2005 2006 2007 2008 2009<br />
• 130 graduates of ‘Vendor Development<br />
* Compounded Annual Growth Rate for the period of 14 May 2004 to 31 December 2011<br />
Programme’ since 2004<br />
• G-GLC Cross Fertilisation Programme –<br />
2nd cycle, 30 participants cross assigned<br />
• Assisting Bumiputera vendors to<br />
to increase public-private cooperation<br />
develop Halal products<br />
• Collaboration with universities:<br />
• HSBB – Contracts to Bumiputeras >53%<br />
by value<br />
Aggregate earnings have increased for G20 by<br />
343<br />
• 70% of procurement spend awarded to<br />
RM7.7bn and for K9 by RM5.3bn from ‘04 to ‘10<br />
Bumiputera vendors<br />
23.1<br />
293<br />
na<br />
G-20<br />
273<br />
%<br />
• RM1.5bn (37.4%) of procurement<br />
G-20<br />
19.3<br />
ingapore directed to 60% Bumi vendors<br />
19.0<br />
K-9<br />
K-9<br />
224<br />
4.9%<br />
17.3<br />
204<br />
14.7<br />
181<br />
172<br />
159<br />
155<br />
78<br />
152<br />
11.7<br />
136<br />
69 track record of profitability and dividend to shareholders<br />
10.6<br />
9.6<br />
97<br />
108<br />
101<br />
56<br />
7.6 10.8<br />
10.8<br />
11.6<br />
K-9 TSR<br />
8.5<br />
7.4<br />
Stay the course in executing<br />
6.5 6.5<br />
KLCI<br />
5.5<br />
the 10 year GLCT<br />
Programme<br />
3.3<br />
14 May 31 Dec 31 Dec 31 Dec 31 Dec 31 Dec 31 Dec<br />
Continue<br />
2004 2005 2006 2007 2008 2009 2010<br />
2009 2010 Sep-11<br />
focus on core<br />
1<br />
2004 2005 2006 2007 2008 2009 2010 2011F 2012F<br />
Jakarta operations: level<br />
Relentless<br />
Properties<br />
Composite<br />
playing 5<br />
drive to<br />
field and<br />
2<br />
Others Government<br />
Index GLIC/GLC become<br />
exit non-core/<br />
regional<br />
ent<br />
SE non-competitive roles in NEM<br />
ailand assets<br />
champions<br />
Index<br />
NWA Movement<br />
4<br />
3<br />
RM bn<br />
111.6<br />
(RM bn)<br />
120<br />
91.2<br />
Collaborate and Pursue new economy<br />
100<br />
co-invest with investments in line<br />
private sector with NEM<br />
80<br />
75.2 Excluding companies with<br />
50.9<br />
regulatory constraints and within<br />
60<br />
challenging industries, <strong>Khazanah</strong>’s<br />
40<br />
NWA movement was RM2.3bn<br />
(3.1% growth)<br />
20<br />
31 Dec<br />
31 Dec<br />
0<br />
2010<br />
14 May<br />
2009<br />
(2.3)<br />
2004<br />
2.3 70.0<br />
74.8<br />
RM bn<br />
(1.5)<br />
80<br />
39.1%<br />
70<br />
53.8<br />
60<br />
124.6%<br />
50<br />
t Before Tax<br />
(3.7)<br />
40<br />
33.3<br />
5.3<br />
dend Declared<br />
30<br />
20<br />
NWA CIMB TNB Aviation Remaining NWA<br />
10<br />
31 Dec<br />
31 Dec<br />
3.0 2010<br />
Portfolio 2011<br />
0<br />
2010<br />
14 May<br />
2009<br />
2004<br />
3<br />
VENDORS AND SUPPLIERS<br />
• 130 graduates of ‘Vendor Development<br />
Programme’ since 2004<br />
EMPLOYEES & HUMAN CAPITAL<br />
90<br />
May Jan Sep May Jan Sep May Jan Sep May Jan Sep<br />
-04 -05 -05 -06 -07 -07 -08 -09 -09 -10 -11 -11<br />
* Compounded Annual Growth Rate for the period of 14 May 2004 to 31 December 2011<br />
• G-GLC Cross Fertilisation Programme –<br />
2nd cycle, 30 participants cross assigned<br />
(4.6)<br />
2005 2006 2007 2008 2009<br />
• Assisting Bumiputera vendors to<br />
to increase public-private cooperation<br />
develop Halal products<br />
• Collaboration with universities:<br />
• HSBB – Contracts to Bumiputeras >53%<br />
by value<br />
Middle East<br />
Aggregate earnings have increased for G20 by<br />
343<br />
Others<br />
1.0%<br />
RM7.7bn and for K9 by RM5.3bn from ‘04 to ‘10<br />
1.0%<br />
India<br />
• 70% of procurement spend awarded to<br />
1.5% Bumiputera vendors<br />
23.1<br />
293<br />
China<br />
G-20<br />
273<br />
1.6%<br />
• RM1.5bn (37.4%) of procurement<br />
G-20<br />
19.3<br />
Singapore directed to 60% Bumi vendors<br />
19.0<br />
K-9<br />
K-9<br />
224<br />
4.9%<br />
17.3<br />
204<br />
Malaysia<br />
14.7<br />
181<br />
172<br />
159<br />
155<br />
90.0%<br />
152<br />
11.7<br />
136<br />
10.6<br />
9.6<br />
97<br />
108<br />
101<br />
7.6 10.8<br />
10.8<br />
11.6<br />
8.5<br />
7.4<br />
Stay the course in executing<br />
6.5 6.5<br />
5.5<br />
the 10 year GLCT<br />
Programme<br />
3.3<br />
14 May 31 Dec 31 Dec 31 Dec 31 Dec 31 Dec 31 Dec<br />
Continue<br />
focus on core<br />
1<br />
2004 2005 2006 2007 2008 2009 2010 2011F 2012F 2004 2005 2006 2007 2008 2009 2010<br />
operations: level<br />
Relentless<br />
playing 5<br />
drive to<br />
field and<br />
2<br />
GLIC/GLC become<br />
exit non-core/<br />
non-competitive<br />
regional<br />
roles in NEM<br />
assets<br />
champions<br />
4<br />
3<br />
RM bn<br />
111.6<br />
120<br />
91.2<br />
Collaborate and Pursue new economy<br />
100<br />
co-invest with investments in line<br />
private sector with NEM<br />
80<br />
60<br />
50.9<br />
40<br />
nah’s<br />
owth 20<br />
31 Dec<br />
31 Dec<br />
0.4%<br />
0<br />
2010<br />
14 May<br />
2009<br />
2004<br />
4.1%<br />
74.8<br />
RM bn<br />
80<br />
39.1%<br />
70<br />
53.8<br />
60<br />
124.6%<br />
6.5%<br />
50<br />
40<br />
33.3<br />
1.2%<br />
30<br />
20<br />
10<br />
31 Dec<br />
31 Dec<br />
0<br />
2010<br />
14 May<br />
2009<br />
2004<br />
(20) (15) (10) (5) 0 5 10<br />
(7.0%)<br />
.7%)<br />
MSCI<br />
C World (3.7%)<br />
glCs continue to show steady outperformance<br />
Source: G-20 Financial Reports; Bloomberg; consensus estimates (as at 31 Dec 2011); PCG analysis<br />
K-9 TSR<br />
KLCI<br />
Jakarta<br />
Composite<br />
Index<br />
SE<br />
ailand<br />
Index<br />
SENSEX<br />
(11.9%)<br />
3.6%)<br />
.5%)<br />
.4%)<br />
3<br />
Malaysia<br />
90.0%<br />
Stay the course in executing<br />
the 10 year GLCT<br />
Programme<br />
Continue<br />
focus on core<br />
1<br />
operations: level<br />
Relentless<br />
playing 5<br />
drive to<br />
field and<br />
2<br />
GLIC/GLC become<br />
exit non-core/<br />
non-competitive<br />
regional<br />
roles in NEM<br />
assets<br />
champions<br />
4<br />
3<br />
Collaborate and Pursue new economy<br />
co-invest with investments in line<br />
private sector with NEM<br />
<strong>Khazanah</strong>’s<br />
NWA growth<br />
0.4%<br />
4.1%<br />
6.5%<br />
1.2%<br />
MSCI<br />
Emerging Markets<br />
%<br />
(7.0%)<br />
(15.7%)<br />
MSCI<br />
AC World (3.7%)<br />
Straits<br />
Times Index<br />
Shanghai<br />
Composite Index<br />
(11.9%)<br />
(13.6%)<br />
MSCI<br />
Asia ex-Japan (14.4%)<br />
(423858-X)<br />
investments No. of transactions investment amount<br />
(RM bn)<br />
2004-2010 76 39.7<br />
2011 13 5.8<br />
TOTAL 89 45.5<br />
Divestments No. of transactions Divestment gains on Divestments<br />
Hang Seng Proceeds (RM bn) (RM bn)<br />
(14.5%)<br />
2004-2010 Index 37 24.0 11.6<br />
2011 8 7.7<br />
5 Total divestment proceeds of RM16.6bn including PLUS shares held indirectly via UEM Group <strong>Berhad</strong><br />
pending<br />
(423858-X)<br />
5 2.0<br />
TOTAL 45 31.7 13.6<br />
bn<br />
.<br />
x<br />
x<br />
x<br />
22.8%<br />
19.1%<br />
+ RM57.2bn<br />
+ RM36.7bn<br />
10.2% p.a.<br />
14.0%<br />
(35) (30) (25) (20) (15) (10) (5) 0 5 10<br />
10.4%<br />
Utilities<br />
10.8%<br />
Source: Bloomberg; <strong>Khazanah</strong> analysis<br />
05 2006 2007 2008 2009 2010 20115 GLCs<br />
BENEFIT<br />
ALL STAKE-<br />
HOLDERS<br />
national average for 2007, 2008 and<br />
2009<br />
+ RM57.2bn<br />
+ RM36.7bn<br />
10.2% p.a.<br />
(20%) (10%) 0% 10% 20% 30% 40% 50%<br />
GLCs<br />
BENEFIT<br />
ALL STAKE-<br />
HOLDERS<br />
COMMUNITY AND CSR CUSTOMERS<br />
GLCs<br />
BENEFIT<br />
ALL STAKE-<br />
HOLDERS<br />
• ‘World's Leading Airline to Asia’<br />
(20%) • (10%) The Curve 0% – ‘Best 10% Commercial 20% 30% 40% 50%<br />
(33.5%)<br />
Others<br />
1.0%<br />
Middle East<br />
1.0% India<br />
1.5%<br />
190<br />
100=14/5/04<br />
(35) (30) (25) (20) (15) (10) (5) 0 5 10<br />
Others<br />
1.0%<br />
Middle East<br />
1.0% India<br />
1.5%<br />
China<br />
• HSBB – Contracts to Bumiputeras >53%<br />
by value<br />
• 70% of procurement spend awarded to<br />
Bumiputera vendors<br />
31 Singapore Dec-11<br />
4.9%<br />
0.3<br />
• 70% of procurement spend awarded to<br />
Bumiputera vendors<br />
(3.7)<br />
directed to 60% (1.9) Bumi vendors<br />
GLCs<br />
BENEFIT<br />
ALL STAKE-<br />
HOLDERS<br />
(1.7) (1.8)<br />
(3.0)<br />
3 <strong>Khazanah</strong> and GLC Transformation drivers<br />
GLCs<br />
BENEFIT<br />
ALL STAKE-<br />
HOLDERS<br />
Stay the course in executing<br />
the 10 year GLCT<br />
Programme<br />
Aggregate earnings have in<br />
RM7.7bn and for K9 by RM5