Review of Emergency Response Provision: <strong>Sevenoaks</strong> Incidents <strong>and</strong> Mobilisations Analysis Table B1: All incidents by station type Primary <strong>Fire</strong>s (of which ADFs) Wholetime WT - Mixed Wholetime day crewed 6,521 (1,310) 3,312 (1,026) 3,174 (743) Retained Totals 4,161 (905) 17,168 (3,984) Secondary <strong>Fire</strong>s 10,001 3,584 3,509 4,386 21,480 Chimney <strong>Fire</strong>s 201 127 226 684 1,238 Malicious False Alarms 4 1,289 785 305 407 2,786 <strong>Fire</strong> Alarm due to Apparatus 11,129 7,169 5,157 5,593 29,048 Good Intent False Alarm 7,391 3,777 3,848 3,715 18,731 Special <strong>Service</strong>s (of which RTCs) Total number of incidents 6,063 (2,045) 4,300 (926) 3,408 (1,399) 3,863 (1,856) 17,634 (6,262) 42,595 23,054 19,627 22,809 108,085 Number of stations 7 6 9 43 65 Average per number of stations within station type Table B2: Incident averages for station type Primary <strong>Fire</strong>s (of which ADFs) 6,085 3,842 2,181 530 1,663 Wholetime WT - Mixed Wholetime day crewed 932 (187) 552 (171) 353 (83) Retained Secondary <strong>Fire</strong>s 1,429 597 390 102 Chimney <strong>Fire</strong>s 29 21 25 16 Malicious False Alarms 5 184 131 34 9 <strong>Fire</strong> Alarm due to Apparatus 1,590 1,195 573 130 Good Intent False Alarm 1,056 630 428 86 Special <strong>Service</strong>s (of which RTCs) All <strong>Fire</strong>s (Primary, Secondary <strong>and</strong> Chimney) Primary <strong>Fire</strong>s (including Chimney 866 (292) 717 (160) 379 (155) 97 (21) 90 (43) 2,389 1,171 768 215 960 573 378 113 4 Malicious False Alarm, Malicious-non fire incident, Malicious by person, Malicious operation of FA by person 5 Malicious False Alarm, Malicious-non fire incident, Malicious by person, Malicious operation of FA by person 4
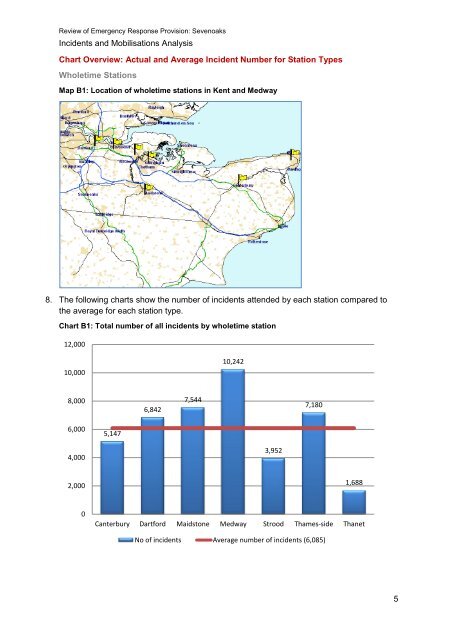
Review of Emergency Response Provision: <strong>Sevenoaks</strong> Incidents <strong>and</strong> Mobilisations Analysis Chart Overview: Actual <strong>and</strong> Average Incident Number for Station Types Wholetime Stations Map B1: Location of wholetime stations in <strong>Kent</strong> <strong>and</strong> Medway 8. The following charts show the number of incidents attended by each station compared to the average for each station type. Chart B1: Total number of all incidents by wholetime station 12,000 10,000 8,000 6,000 4,000 2,000 0 5,147 6,842 7,544 10,242 3,952 7,180 1,688 Canterbury Dartford Maidstone Medway Strood Thames-side Thanet No of incidents Average number of incidents (6,085) 5