RERP TA - Sevenoaks - Kent Fire and Rescue Service
RERP TA - Sevenoaks - Kent Fire and Rescue Service RERP TA - Sevenoaks - Kent Fire and Rescue Service
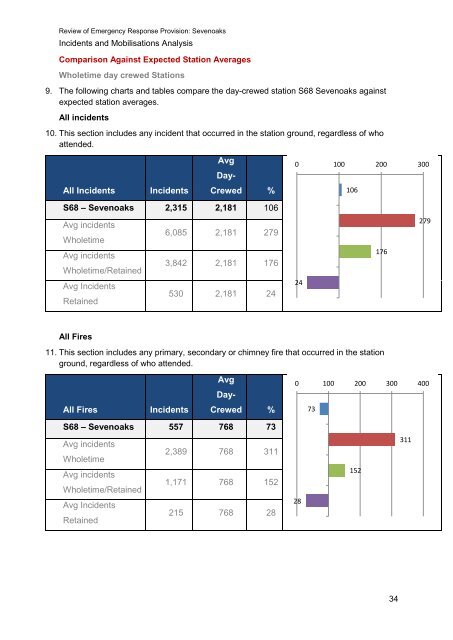
Review of Emergency Response Provision: Sevenoaks Incidents and Mobilisations Analysis Comparison Against Expected Station Averages Wholetime day crewed Stations 9. The following charts and tables compare the day-crewed station S68 Sevenoaks against expected station averages. All incidents 10. This section includes any incident that occurred in the station ground, regardless of who attended. All Incidents Incidents Avg Day- Crewed % S68 – Sevenoaks 2,315 2,181 106 Avg incidents Wholetime Avg incidents Wholetime/Retained Avg Incidents Retained All Fires 6,085 2,181 279 3,842 2,181 176 530 2,181 24 11. This section includes any primary, secondary or chimney fire that occurred in the station ground, regardless of who attended. All Fires Incidents Avg Day- Crewed % S68 – Sevenoaks 557 768 73 Avg incidents Wholetime Avg incidents Wholetime/Retained Avg Incidents Retained 2,389 768 311 1,171 768 152 215 768 28 0 100 200 300 24 28 73 106 152 176 34 311 279 0 100 200 300 400
Review of Emergency Response Provision: Sevenoaks Incidents and Mobilisations Analysis All Primary Fires (including Chimney) 12. This section includes any primary fire (including chimney fires) that occurred in the station ground, regardless of who attended. Primary fires (incl Chimney) Incidents Avg Day- Crewed % S68 – Sevenoaks 374 378 99 Avg incidents Wholetime Avg incidents Wholetime/Retained Avg Incidents Retained All Accidental Dwelling Fires (ADFs) 960 378 254 573 378 152 113 378 30 13. This section includes any ADF that occurred in the station ground, regardless of who attended. ADFs Incidents Avg Day- Crewed % S68 – Sevenoaks 83 83 101 Avg incidents Wholetime Avg incidents Wholetime/Retained Avg Incidents Retained 187 83 227 171 83 207 21 83 25 0 100 200 300 30 25 99 101 152 207 35 227 254 0 100 200 300
- Page 1 and 2: Review of Emergency Response Provis
- Page 3 and 4: Review of Emergency Response Provis
- Page 5 and 6: Review of Emergency Response Provis
- Page 7 and 8: Review of Emergency Response Provis
- Page 9 and 10: Review of Emergency Response Provis
- Page 11 and 12: Review of Emergency Response Provis
- Page 13 and 14: Review of Emergency Response Provis
- Page 15 and 16: Review of Emergency Response Provis
- Page 17 and 18: Review of Emergency Response Provis
- Page 19 and 20: Review of Emergency Response Provis
- Page 21 and 22: Review of Emergency Response Provis
- Page 23 and 24: Review of Emergency Response Provis
- Page 25 and 26: Review of Emergency Response Provis
- Page 27 and 28: Review of Emergency Response Provis
- Page 29 and 30: Review of Emergency Response Provis
- Page 31 and 32: Review of Emergency Response Provis
- Page 33: Review of Emergency Response Provis
- Page 37 and 38: Review of Emergency Response Provis
- Page 39 and 40: Review of Emergency Response Provis
- Page 41 and 42: Review of Emergency Response Provis
- Page 43 and 44: Review of Emergency Response Provis
- Page 45 and 46: Review of Emergency Response Provis
- Page 47 and 48: Review of Emergency Response Provis
- Page 49 and 50: Review of Emergency Response Provis
- Page 51 and 52: Review of Emergency Response Provis
- Page 53 and 54: Review of Emergency Response Provis
- Page 55 and 56: Review of Emergency Response Provis
- Page 57 and 58: Review of Emergency Response Provis
- Page 59 and 60: Review of Emergency Response Provis
- Page 61 and 62: Review of Emergency Response Provis
- Page 63 and 64: Review of Emergency Response Provis
- Page 65 and 66: Review of Emergency Response Provis
- Page 67 and 68: Review of Emergency Response Provis
- Page 69 and 70: Review of Emergency Response Provis
- Page 71 and 72: Review of Emergency Response Provis
- Page 73 and 74: Review of Emergency Response Provis
- Page 75 and 76: Review of Emergency Response Provis
- Page 77 and 78: Review of Emergency Response Provis
- Page 79 and 80: Review of Emergency Response Provis
- Page 81 and 82: Review of Emergency Response Provis
- Page 83 and 84: Review of Emergency Response Provis
Review of Emergency Response Provision: <strong>Sevenoaks</strong><br />
Incidents <strong>and</strong> Mobilisations Analysis<br />
Comparison Against Expected Station Averages<br />
Wholetime day crewed Stations<br />
9. The following charts <strong>and</strong> tables compare the day-crewed station S68 <strong>Sevenoaks</strong> against<br />
expected station averages.<br />
All incidents<br />
10. This section includes any incident that occurred in the station ground, regardless of who<br />
attended.<br />
All Incidents Incidents<br />
Avg<br />
Day-<br />
Crewed %<br />
S68 – <strong>Sevenoaks</strong> 2,315 2,181 106<br />
Avg incidents<br />
Wholetime<br />
Avg incidents<br />
Wholetime/Retained<br />
Avg Incidents<br />
Retained<br />
All <strong>Fire</strong>s<br />
6,085 2,181 279<br />
3,842 2,181 176<br />
530 2,181 24<br />
11. This section includes any primary, secondary or chimney fire that occurred in the station<br />
ground, regardless of who attended.<br />
All <strong>Fire</strong>s Incidents<br />
Avg<br />
Day-<br />
Crewed %<br />
S68 – <strong>Sevenoaks</strong> 557 768 73<br />
Avg incidents<br />
Wholetime<br />
Avg incidents<br />
Wholetime/Retained<br />
Avg Incidents<br />
Retained<br />
2,389 768 311<br />
1,171 768 152<br />
215 768 28<br />
0 100 200 300<br />
24<br />
28<br />
73<br />
106<br />
152<br />
176<br />
34<br />
311<br />
279<br />
0 100 200 300 400


