study on economic partnership projects
study on economic partnership projects
study on economic partnership projects

Create successful ePaper yourself
Turn your PDF publications into a flip-book with our unique Google optimized e-Paper software.
It is assumed that future GDP will grow at an average annual rate of 8.0% from 2010 to<br />
2015. Subsequently, the growth rate will gradually reduce by 0.5% every five years, and will<br />
stabilize at 5.5% growth rate from 2035 to 2040. This growth scenario will be justified c<strong>on</strong>sidering<br />
the potential of the Vietnamese ec<strong>on</strong>omy and based <strong>on</strong> the results of comparis<strong>on</strong>s with other studies.<br />
(d) Forecast of Future OD Matrices<br />
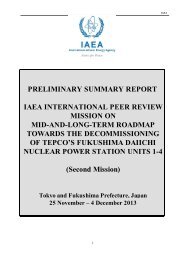
The future traffic growth rates were calculated by inputting the future GDP to the equati<strong>on</strong>s<br />
in Figures 3-10, 3-11 and 3-12 based <strong>on</strong> the existing <str<strong>on</strong>g>study</str<strong>on</strong>g> entitled “Study <strong>on</strong> Da Nang-Quang Ngai<br />
Expressway Project in the Socialist Republic of Vietnam” Car<br />
Source: Study Team<br />
Car Traffic/day<br />
1,600<br />
1,400<br />
1,200<br />
1,000<br />
800<br />
600<br />
400<br />
200<br />
0<br />
y = 0.007x - 1619.4<br />
R 2 = 0.9488<br />
0 100,000 200,000 300,000 400,000 500,000<br />
3-15<br />
GDP<br />
Figure 3-10 Regressi<strong>on</strong> Analysis between GDP and Traffic Demand (Cars)<br />
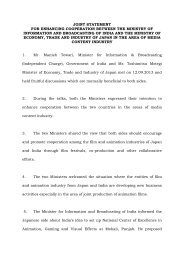
Bus<br />
2,500<br />
2,000<br />
1,500<br />
1,000<br />
500<br />
Source: Study Team<br />
Bus Traffic/day<br />
0<br />
y = 0.0087x - 1754<br />
R 2 = 0.9194<br />
0 50,000 100,000 150,000 200,000 250,000 300,000 350,000 400,000 450,000<br />
GDP<br />
Figure 3-11 Regressi<strong>on</strong> Analysis between GDP and Traffic Demand (Buses)