Weak turbulence and collapses in the Majda-Mclaughlin-Tabak ...
Weak turbulence and collapses in the Majda-Mclaughlin-Tabak ...
Weak turbulence and collapses in the Majda-Mclaughlin-Tabak ...

You also want an ePaper? Increase the reach of your titles
YUMPU automatically turns print PDFs into web optimized ePapers that Google loves.
<strong>Weak</strong> <strong>turbulence</strong> <strong>and</strong> <strong>collapses</strong> <strong>in</strong> <strong>the</strong><br />
<strong>Majda</strong>-McLaughl<strong>in</strong>-<strong>Tabak</strong> equation: Fluxes <strong>in</strong><br />
wavenumber <strong>and</strong> <strong>in</strong> amplitude space<br />
Abstract<br />
Benno Rumpf a,1 , Laura Biven b,2<br />
a Institute of Physics, Technical University of Chemnitz<br />
09107 Chemnitz, Germany<br />
b Max-Planck-Institute for <strong>the</strong> Physics of Complex Systems,<br />
Nöthnitzer Straße 38, 01187 Dresden, Germany<br />
The turbulent energy flow of <strong>the</strong> one-dimensional <strong>Majda</strong>-McLaughl<strong>in</strong>-<strong>Tabak</strong> equation<br />
is studied numerically. The system exhibits weak <strong>turbulence</strong> for weak driv<strong>in</strong>g<br />
forces, while weak <strong>turbulence</strong> coexists with strongly nonl<strong>in</strong>ear <strong>in</strong>termittent <strong>collapses</strong><br />
when <strong>the</strong> system is strongly driven. These two types of dynamics can be dist<strong>in</strong>guished<br />
by <strong>the</strong>ir energy <strong>and</strong> particle fluxes. The weakly turbulent process can be<br />
characterized by fluxes <strong>in</strong> wavenumber space, while additional fluxes <strong>in</strong> amplitude<br />
space emerge <strong>in</strong> <strong>the</strong> <strong>in</strong>termittent process. The particle flux is directed from low amplitudes<br />
towards high amplitudes, <strong>and</strong> <strong>the</strong> energy flows <strong>in</strong> <strong>the</strong> opposite direction.<br />
Key words: <strong>Weak</strong> <strong>turbulence</strong>; Intermittency; Wave collapse<br />
PACS: 47.27.Eq; 05.60.+w; 47.35.+i; 52.35.-g<br />
1 Introduction<br />
This paper <strong>in</strong>vestigates two different types of <strong>turbulence</strong>, firstly, <strong>the</strong> energy<br />
transport of weakly <strong>in</strong>teract<strong>in</strong>g dispersive waves with low amplitudes [1], secondly,<br />
an <strong>in</strong>termittent type of <strong>turbulence</strong> [2] where localized high-amplitude<br />
structures appear from a low-amplitude background, <strong>and</strong> decay rapidly [3]<br />
1 Correspond<strong>in</strong>g author.<br />
E-mail address: benno.rumpf@physik.tu-chemnitz.de<br />
2 Permanent address: Bard HS Early College, 525 East Houston St., New York,<br />
NY, 10002, USA<br />
Prepr<strong>in</strong>t submitted to Elsevier Prepr<strong>in</strong>t 28 February 2005
[4][5]. Important cases of weak <strong>turbulence</strong> have been found <strong>in</strong> <strong>the</strong> dynamics of<br />
Langmuir waves <strong>in</strong> plasmas [6], capillary [7] <strong>and</strong> gravity waves [8] <strong>in</strong> hydrodynamics,<br />
<strong>in</strong> magnetohydrodynamics [9], <strong>and</strong> <strong>in</strong> Bose-E<strong>in</strong>ste<strong>in</strong> condensates [10].<br />
Collapses <strong>in</strong> Langmuir-waves [11] <strong>and</strong> self-focus<strong>in</strong>g effects <strong>in</strong> optics [4],[12] are<br />
examples for <strong>the</strong> <strong>in</strong>termittent k<strong>in</strong>d of behavior.<br />
Turbulent energy flows emerge when such dynamical systems are driven on a<br />
long spatial scale, <strong>and</strong> damped on a short viscous scale [1]. Models of turbulent<br />
flows assume that <strong>the</strong> dynamics is almost Hamiltonian <strong>in</strong> <strong>the</strong> <strong>in</strong>ertial range<br />
between <strong>the</strong> damp<strong>in</strong>g range <strong>and</strong> <strong>the</strong> driv<strong>in</strong>g range, <strong>and</strong> energy is transported<br />
from sources to s<strong>in</strong>ks through this w<strong>in</strong>dow of transparency with no damp<strong>in</strong>g<br />
or driv<strong>in</strong>g. Symmetries besides <strong>the</strong> time-<strong>in</strong>variance are related to conserved<br />
quantities <strong>in</strong> addition to <strong>the</strong> Hamiltonian. Examples for such quantities are<br />
<strong>the</strong> light <strong>in</strong>tensity <strong>in</strong> nonl<strong>in</strong>ear optics [12] or <strong>the</strong> average momenta <strong>in</strong> hydrodynamics<br />
[13]. When supplied <strong>and</strong> dissipated by driv<strong>in</strong>g <strong>and</strong> damp<strong>in</strong>g, <strong>the</strong>re<br />
are fluxes also of <strong>the</strong>se quantities. Fluxes that are directed from a source both<br />
toward long <strong>and</strong> toward short length scales can be modeled with an additional<br />
s<strong>in</strong>k at small wavenumbers.<br />
The fluxes of <strong>the</strong> conserved quantities determ<strong>in</strong>e <strong>the</strong> statistically stationary<br />
nonequilibrium of <strong>the</strong> Hamiltonian dynamics <strong>in</strong> <strong>the</strong> <strong>in</strong>ertial range. The <strong>the</strong>ory<br />
of weak wave <strong>turbulence</strong> computes <strong>the</strong> nonequilibrium state of weakly <strong>in</strong>teract<strong>in</strong>g<br />
dispersive waves, depend<strong>in</strong>g on boundary conditions for <strong>the</strong> fluxes. A<br />
closed k<strong>in</strong>etic equation for <strong>the</strong> two-po<strong>in</strong>t functions can be derived if, with <strong>the</strong><br />
existence of a small parameter, <strong>the</strong> nonl<strong>in</strong>ear coupl<strong>in</strong>g is much smaller than<br />
<strong>the</strong> l<strong>in</strong>ear dispersive effects, so that higher order correlations can be reduced<br />
to powers of <strong>the</strong> two-po<strong>in</strong>t function. The k<strong>in</strong>etic equations can be solved analytically.<br />
This yields <strong>the</strong> Kolmogorov-Zakharov spectrum <strong>and</strong> formulas for <strong>the</strong><br />
fluxes [1]. The <strong>the</strong>ory predicts that <strong>the</strong> system will have close to Gaussian statistics<br />
even after <strong>the</strong> weak nonl<strong>in</strong>earity is relevant. The <strong>in</strong>termittent occurrence<br />
of high-amplitude structures [14] violates <strong>the</strong> assumptions of weak <strong>turbulence</strong>,<br />
as <strong>the</strong>se structures <strong>in</strong>dicate strongly coherent waves. Consequently, <strong>the</strong> closure<br />
of <strong>the</strong> k<strong>in</strong>etic equation is not possible, <strong>and</strong> <strong>the</strong>re is a strongly nonl<strong>in</strong>ear <strong>in</strong>teraction.<br />
In recent years massive numerical experiments have been carried out [15],<br />
[16], [17], [18] to check <strong>the</strong> assumptions of <strong>the</strong> Gaussian closure of <strong>the</strong> k<strong>in</strong>etic<br />
equations. This was partly thanks to <strong>the</strong> development of dynamical system by<br />
<strong>Majda</strong>, McLaughl<strong>in</strong>, <strong>and</strong> <strong>Tabak</strong> (’MMT’ equation) [15],[16], which we use <strong>in</strong><br />
its most simple focus<strong>in</strong>g version<br />
i ∂φ<br />
∂t<br />
= | ∂<br />
∂x |1/2 φ − φ|φ| 2 + F + D. (1)<br />
φ is a complex field that depends on one spatial variable x. The fractional<br />
derivative |∂/∂x| 1/2φ st<strong>and</strong>s for <strong>the</strong> Fourier-transform of <strong>the</strong> term �<br />
|k|ak with<br />
<strong>the</strong> mode ak = (1/L) � φ(x) exp (ikx)dx, or equivalently, for <strong>the</strong> <strong>in</strong>verse of<br />
2
a fractional <strong>in</strong>tegral [19]. The concave dispersion ω(k) = �<br />
|k| yields more<br />
four wave resonances than a convex dispersion law (such as <strong>the</strong> dispersion<br />
ω(k) ∼ k 2 of <strong>the</strong> nonl<strong>in</strong>ear Schröd<strong>in</strong>ger equation) does. This leads to an efficient<br />
energy transport even <strong>in</strong> only one dimension, <strong>and</strong> allows numerical simulations<br />
<strong>in</strong> a wider range <strong>in</strong> <strong>the</strong> wavenumber space compared to simulations<br />
<strong>in</strong> two or three spatial dimensions. The general MMT equation has fractional<br />
derivatives of any order both <strong>in</strong> <strong>the</strong> l<strong>in</strong>ear <strong>and</strong> <strong>in</strong> <strong>the</strong> nonl<strong>in</strong>ear part, but <strong>the</strong><br />
semiderivative <strong>and</strong> <strong>the</strong> simple nonl<strong>in</strong>earity of (1) is by <strong>the</strong> signs of <strong>the</strong> fluxes<br />
[17] suitable for <strong>the</strong> study of wave <strong>turbulence</strong>.<br />
D is a damp<strong>in</strong>g term that affects very short waves <strong>and</strong> very long waves only.<br />
The driv<strong>in</strong>g force F affects waves on an <strong>in</strong>termediate length scale. The length<br />
scale of <strong>the</strong> driv<strong>in</strong>g force <strong>and</strong> <strong>the</strong> length scale of <strong>the</strong> short-wave damp<strong>in</strong>g are<br />
widely separated by <strong>the</strong> w<strong>in</strong>dow of transparency where no damp<strong>in</strong>g or driv<strong>in</strong>g<br />
occurs.<br />
The MMT equation for zero driv<strong>in</strong>g F <strong>and</strong> damp<strong>in</strong>g D derives from <strong>the</strong> Hamiltonian<br />
(or ”energy”) E = E2 + E4, with <strong>the</strong> quadratic coupl<strong>in</strong>g part E2 =<br />
� ||∂/∂x| 1/4 φ| 2 dx = � √ k|ak| 2 , <strong>and</strong> <strong>the</strong> nonl<strong>in</strong>ear part E4 = − � |φ| 4 /2dx. The<br />
wave action or ”particle number” n = � |φ| 2 dx = � |ak| 2 is a second conserved<br />
quantity which is related to <strong>the</strong> system’s phase symmetry.<br />
Numerical simulations of (1) found <strong>the</strong> Kolmogorov-Zakharov spectrum as<br />
predicted by weak <strong>turbulence</strong> <strong>the</strong>ory, but also concluded that most of <strong>the</strong><br />
energy transport is related to strongly nonl<strong>in</strong>ear <strong>collapses</strong> [17], which coexist<br />
with weakly <strong>in</strong>teract<strong>in</strong>g low-amplitude waves. In this case, high-amplitude<br />
peaks emerge <strong>in</strong> a very similar way as <strong>in</strong> <strong>the</strong> correspond<strong>in</strong>g Hamiltonian systems<br />
where this process maximizes <strong>the</strong> entropy [20]. Pure wave <strong>turbulence</strong> for<br />
<strong>the</strong> MMT equation has been found for freely decay<strong>in</strong>g <strong>turbulence</strong> [16], but not<br />
<strong>in</strong> <strong>the</strong> stationary nonequilibrium. A steeper spectrum than predicted by wave<br />
<strong>turbulence</strong> has been obta<strong>in</strong>ed for <strong>the</strong> defocus<strong>in</strong>g MMT equation (where <strong>the</strong><br />
sign of <strong>the</strong> nonl<strong>in</strong>earity is opposite to <strong>the</strong> focus<strong>in</strong>g equation (1)) <strong>and</strong> <strong>in</strong> some<br />
cases for <strong>the</strong> focus<strong>in</strong>g equation [16]. This lead to <strong>the</strong> proposal of an alternative<br />
closure from which <strong>the</strong> steeper spectrum can be derived [15].<br />
The aim of this paper is to study both <strong>the</strong> weakly turbulent state <strong>and</strong> <strong>the</strong><br />
collapse dynamics by measur<strong>in</strong>g <strong>the</strong> fluxes of energy <strong>and</strong> particles. In fact, as<br />
we show here, flux measurements are a more reliable <strong>in</strong>dicator of <strong>the</strong> transport<br />
dynamics than <strong>the</strong> energy spectrum. We compute energy <strong>and</strong> particle fluxes<br />
by measur<strong>in</strong>g <strong>the</strong> <strong>in</strong>put <strong>and</strong> output of <strong>the</strong>se quantities that is caused by <strong>the</strong><br />
driv<strong>in</strong>g force <strong>and</strong> <strong>the</strong> damp<strong>in</strong>g <strong>in</strong> our numerical experiments.<br />
We give evidence that a pure weakly turbulent process emerges if <strong>the</strong> driv<strong>in</strong>g<br />
forces are sufficiently weak. The fluxes <strong>in</strong> wavenumber space correspond to <strong>the</strong><br />
predictions of weak <strong>turbulence</strong> <strong>the</strong>ory (section 3).<br />
For stronger external driv<strong>in</strong>g we f<strong>in</strong>d a transition to a process where weak<br />
<strong>turbulence</strong> <strong>and</strong> collapse dynamics coexist. Despite <strong>the</strong> fact that <strong>the</strong> formation<br />
of high-amplitude structures is not <strong>in</strong> agreement with <strong>the</strong> assumptions<br />
of weak <strong>turbulence</strong> our simulations of (1) f<strong>in</strong>d <strong>the</strong> weak <strong>turbulence</strong> spectrum.<br />
3
The collapse dynamics is characterized by fluxes of energy <strong>and</strong> particles both<br />
<strong>in</strong> wavenumber <strong>and</strong> <strong>in</strong> amplitude space. These fluxes <strong>in</strong> amplitude space conta<strong>in</strong><br />
<strong>in</strong>formation on <strong>the</strong> coherent process (section 4).<br />
We present numerical results for one simulation that is representative for weak<br />
driv<strong>in</strong>g <strong>and</strong> damp<strong>in</strong>g (Figs. 2,3,4) <strong>and</strong> one for strong driv<strong>in</strong>g <strong>and</strong> damp<strong>in</strong>g<br />
(Figs. 2,6,7,8). Figs. 9,10 show data from ano<strong>the</strong>r simulation with a medium<br />
power driv<strong>in</strong>g force. These two figures show time-dependent quantities, all<br />
o<strong>the</strong>r figures show time-averaged quantities. Figs. 5,11 show results of a series<br />
of simulations with various driv<strong>in</strong>g forces.<br />
2 Numerical method<br />
We <strong>in</strong>tegrate equation (1) numerically us<strong>in</strong>g a pseudospectral method with an<br />
<strong>in</strong>tegrat<strong>in</strong>g factor similar to <strong>the</strong> method described <strong>in</strong> [15]. φ(x) is def<strong>in</strong>ed on<br />
<strong>the</strong> <strong>in</strong>terval [0, 4096] with periodic boundary conditions. For its <strong>in</strong>tegration we<br />
use L = 4096 modes, with wavenumbers k <strong>in</strong> <strong>the</strong> Brillou<strong>in</strong> zone ] − π, π]. The<br />
l<strong>in</strong>ear part can be elim<strong>in</strong>ated analytically us<strong>in</strong>g an <strong>in</strong>tegrat<strong>in</strong>g factor, <strong>and</strong> <strong>the</strong><br />
result<strong>in</strong>g non-stiff equation is <strong>in</strong>tegrated with a multistep (Adams) method.<br />
We use driv<strong>in</strong>g <strong>and</strong> damp<strong>in</strong>g forces that act as time-periodic δ-kicks, while<br />
<strong>the</strong> system is governed by <strong>the</strong> Hamiltonian MMT equation for one time unit<br />
between <strong>the</strong> subsequent kicks. The external driv<strong>in</strong>g force F is applied to <strong>the</strong><br />
modes <strong>in</strong> <strong>the</strong> <strong>in</strong>terval 20 < |k|L/(2π) ≤ 40. The driv<strong>in</strong>g δ-kicks <strong>in</strong>crease <strong>the</strong><br />
amplitude as ak → (1 + λ)ak with λ = 0.1. This driv<strong>in</strong>g force is only applied<br />
to modes with an amplitude below a threshold |ak| 2 < c0/k, so that <strong>the</strong> total<br />
energy <strong>in</strong>put reduces when more modes exceed this threshold.<br />
The damp<strong>in</strong>g D is applied both at low wavenumbers (|k|L/(2π) ≤ 20) <strong>and</strong><br />
at high wavenumbers π/2 ≤ |k|, while modes <strong>in</strong> <strong>the</strong> w<strong>in</strong>dow of transparency<br />
40 < |k|L/(2π) < L/4 are nei<strong>the</strong>r damped <strong>and</strong> nor driven. The broad high-k<br />
damp<strong>in</strong>g m<strong>in</strong>imizes <strong>the</strong> alias<strong>in</strong>g error of <strong>the</strong> numerical computation. Ideally,<br />
<strong>the</strong> low-k damp<strong>in</strong>g <strong>and</strong> driv<strong>in</strong>g range should also be chosen larger, but this<br />
would narrow <strong>the</strong> w<strong>in</strong>dow of transparency. The damp<strong>in</strong>g δ-kicks decrease <strong>the</strong><br />
amplitude as ak → (1 − λ)ak with λ = 0.1. This damp<strong>in</strong>g is applied only<br />
to modes <strong>in</strong> <strong>the</strong> high-k w<strong>in</strong>dow when <strong>the</strong> amplitude exceeds <strong>the</strong> threshold<br />
|ak| 2 > c+/|k|, <strong>and</strong> to low-k modes above <strong>the</strong> level |ak| 2 > c−. This type of<br />
damp<strong>in</strong>g becomes more effective when more modes exceed this threshold.<br />
The purpose of this type of damp<strong>in</strong>g <strong>and</strong> driv<strong>in</strong>g is purely practical: Damp<strong>in</strong>g<br />
<strong>and</strong> driv<strong>in</strong>g by time-periodic δ-kicks has <strong>the</strong> advantage that <strong>the</strong> <strong>in</strong>put <strong>and</strong> output<br />
of energy <strong>and</strong> particles can be measured directly, <strong>and</strong> are dist<strong>in</strong>guishable<br />
from <strong>the</strong> Hamiltonian dynamics of (1). The effect of <strong>the</strong> kicks is quite small <strong>in</strong><br />
all our simulations, so that <strong>the</strong>re is little difference between snapshots before<br />
<strong>and</strong> after <strong>the</strong> kicks. The damp<strong>in</strong>g is restricted to <strong>the</strong> two w<strong>in</strong>dows <strong>in</strong> k-space<br />
<strong>in</strong> order to keep <strong>the</strong> w<strong>in</strong>dow of transparency free of dissipation. The threshold<br />
4
|a k | 2<br />
0<br />
damp<strong>in</strong>g<br />
a<br />
k<br />
(1− λ )ak damp<strong>in</strong>g<br />
threshold<br />
c −<br />
driv<strong>in</strong>g<br />
threshold<br />
c /k<br />
0<br />
driv<strong>in</strong>g<br />
ak (1+ λ ) ak<br />
w<strong>in</strong>dow of transparency:<br />
undamped <strong>and</strong> undriven<br />
damp<strong>in</strong>g<br />
a<br />
k (1− λ ) ak<br />
damp<strong>in</strong>g<br />
threshold c + /k<br />
20 π /2048 40 π /2048 π /2 | k|<br />
π<br />
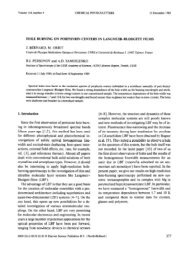
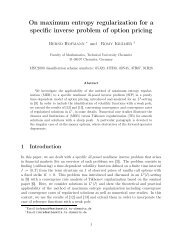
Fig. 1. The driv<strong>in</strong>g force acts on modes ak with 20 < |k|L/2π ≤ 40 when |ak| 2 is<br />
below a threshold c0/k. The driv<strong>in</strong>g δ-kicks <strong>in</strong>crease <strong>the</strong>se modes as ak → (1 + λ)ak<br />
with λ = 0.1. The damp<strong>in</strong>g decreases <strong>the</strong> modes of <strong>the</strong> <strong>in</strong>terval |k|L/2π ≤ 20 as<br />
ak → (1 − λ)ak when |ak| 2 above a constant threshold c−, as well as <strong>the</strong> modes <strong>in</strong><br />
<strong>the</strong> <strong>in</strong>terval π/2 < |k| ≤ π when |ak| 2 is above a threshold c+/k.<br />
parameters c−, c0 <strong>and</strong> c+ allow us to control <strong>the</strong> amplitudes <strong>in</strong> <strong>the</strong> driv<strong>in</strong>g <strong>and</strong><br />
<strong>the</strong> damp<strong>in</strong>g regions. In particular, <strong>the</strong> driv<strong>in</strong>g force can be <strong>in</strong>creased by <strong>in</strong>creas<strong>in</strong>g<br />
<strong>the</strong> threshold c0. This type of forc<strong>in</strong>g is similar to coupl<strong>in</strong>g <strong>the</strong> system<br />
to heat baths with different temperatures <strong>in</strong> <strong>the</strong> driv<strong>in</strong>g <strong>and</strong> damp<strong>in</strong>g regions.<br />
It appears that this leads to a relatively quick relaxation to a statistically<br />
stationary state. In this state, it is equivalent to o<strong>the</strong>r types of forc<strong>in</strong>g that<br />
cause <strong>the</strong> same fluxes. In our simulations we choose c− = c0/60 <strong>and</strong> c0 slightly<br />
larger than c+. This choice has turned out to yield Kolmogorov-Zakharov<br />
spectra with relatively small deviations at <strong>the</strong> boundaries of <strong>the</strong> w<strong>in</strong>dow of<br />
transparency.<br />
For comparison, we have performed simulations with time-cont<strong>in</strong>uous driv<strong>in</strong>g<br />
<strong>and</strong> hyperviscous damp<strong>in</strong>g, which show no significant differences to <strong>the</strong> δdriven<br />
case. Our results are also <strong>in</strong> agreement with those reported <strong>in</strong> <strong>the</strong> literature.<br />
In particular, we have found WT spectra [17] for <strong>the</strong> focus<strong>in</strong>g MMT<br />
equation (1), while we f<strong>in</strong>d <strong>the</strong> steeper MMT spectrum [15] for its defocus<strong>in</strong>g<br />
version. The results <strong>in</strong> this paper are robust under various modifications<br />
of <strong>the</strong> scheme. We have performed simulations with various resolutions from<br />
1024 modes to 8192 modes, <strong>and</strong> various types of damp<strong>in</strong>g <strong>and</strong> driv<strong>in</strong>g. O<strong>the</strong>r<br />
modifications <strong>in</strong>clude <strong>the</strong> ranges <strong>in</strong> k-space where damp<strong>in</strong>g <strong>and</strong> driv<strong>in</strong>g is applied,<br />
<strong>the</strong> time <strong>in</strong>tervals between <strong>the</strong> kicks <strong>and</strong> <strong>the</strong> strength of <strong>the</strong> kicks. We<br />
have tested of <strong>the</strong> <strong>in</strong>tegration scheme for undamped <strong>and</strong> undriven equations<br />
by simulat<strong>in</strong>g <strong>the</strong> well-known solitons of <strong>the</strong> nonl<strong>in</strong>ear Schröd<strong>in</strong>ger equation,<br />
<strong>and</strong> by check<strong>in</strong>g <strong>the</strong> conservation of energy <strong>and</strong> particles by <strong>the</strong> MMT equation.<br />
In all simulations <strong>the</strong> system is first allowed to relax until it reaches an almost<br />
stationary nonequilibrium state, which takes 10 4 − 10 5 time units depend<strong>in</strong>g<br />
on <strong>the</strong> particle <strong>in</strong>put. Time-averaged quantities such as power spectra <strong>and</strong><br />
energy fluxes are computed for <strong>the</strong> nonequilibrium state <strong>in</strong> a second round<br />
of <strong>in</strong>tegration. In this state, <strong>the</strong> <strong>in</strong>put of particles <strong>and</strong> energy matches <strong>the</strong><br />
5
output, <strong>and</strong> <strong>the</strong> energies E2 <strong>and</strong> E4 <strong>and</strong> particle number n are constant with<br />
only small fluctuations. The <strong>in</strong>tegration time is long enough to average away<br />
<strong>the</strong> effect of <strong>the</strong>se r<strong>and</strong>om fluctuations.<br />
3 The weakly turbulent state<br />
3.1 Power spectrum <strong>and</strong> amplitude statistics<br />
The dynamics of (1) depends critically on <strong>the</strong> strength of <strong>the</strong> driv<strong>in</strong>g force <strong>and</strong><br />
<strong>the</strong> damp<strong>in</strong>g, <strong>and</strong> we study <strong>the</strong> dynamics <strong>in</strong> two representative simulations,<br />
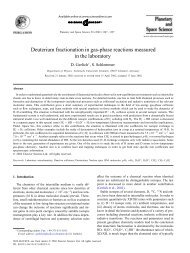
one for weak driv<strong>in</strong>g, <strong>and</strong> one for strong driv<strong>in</strong>g. Fig.2(a) shows <strong>the</strong> timeaveraged<br />
wave action nk =< |ak| 2 + |a−k| 2 > over <strong>the</strong> wavenumber. Both for<br />
<strong>the</strong> weakly <strong>and</strong> <strong>the</strong> strongly driven system, we obta<strong>in</strong> a Kolmogorov-Zakharov<br />
spectrum nk = c/(kL/2π) <strong>in</strong> <strong>the</strong> w<strong>in</strong>dow of transparency. The coefficient c<br />
measures <strong>the</strong> particle number for waves <strong>in</strong> <strong>the</strong> w<strong>in</strong>dow of transparency, which<br />
is c = 2.4 for <strong>the</strong> weakly driven system <strong>and</strong> c = 27 for <strong>the</strong> strongly driven<br />
system. In <strong>the</strong> regions <strong>in</strong> k-space where <strong>the</strong> driv<strong>in</strong>g (damp<strong>in</strong>g) is applied, nk is<br />
higher (lower) than <strong>the</strong> level of <strong>the</strong> spectrum nk = c/(kL/2π). In <strong>the</strong> weakly<br />
n k<br />
10<br />
1<br />
0.1<br />
0.01<br />
0.001<br />
0.0001<br />
27/( kL /2 π)<br />
2.4/( kL /2 π)<br />
damp<strong>in</strong>g<br />
strong<br />
weak<br />
driv<strong>in</strong>g<br />
w<strong>in</strong>dow of<br />
transparency<br />
10 100 1000<br />
damp<strong>in</strong>g<br />
ρ<br />
1<br />
−3<br />
10<br />
−6<br />
10<br />
strongly driven<br />
weakly<br />
driven<br />
0<br />
kL/ 2π<br />
(a) (b)<br />
|φ|<br />
1 2<br />
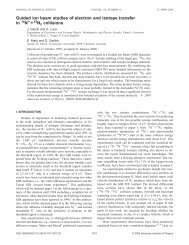
Fig. 2. (a): The time-averaged wave-action nk =< |ak| 2 + |a−k| 2 > (n = � nk is <strong>the</strong><br />
total particle number) of <strong>the</strong> MMT equation exhibits Kolmogorov-Zakharov spectra<br />
nk ∼ k −1 <strong>in</strong> <strong>the</strong> w<strong>in</strong>dow of transparency both for weak <strong>and</strong> for strong driv<strong>in</strong>g forces.<br />
The dotted l<strong>in</strong>es are fits nk = c/(kL/2π) with c = 2.4 <strong>and</strong> c = 27 of <strong>the</strong> spectra<br />
<strong>in</strong> <strong>the</strong> w<strong>in</strong>dow of transparency. (b): Probability density of <strong>the</strong> amplitude |φ| for <strong>the</strong><br />
weakly <strong>and</strong> <strong>the</strong> strongly driven system. The probability for high amplitudes decays<br />
as ∼ exp(−|φ| 2 ) for <strong>the</strong> weakly driven system. The shoulder-shaped distribution<br />
for <strong>the</strong> strongly driven system exhibits a significant probability for high-amplitude<br />
structures (|φ| ≈ 1.5). Particle number <strong>and</strong> energy fluctuate about constant values<br />
<strong>in</strong> both simulations (weak driv<strong>in</strong>g: n ≈ 18, E2 ≈ 7.5, E4 ≈ −0.08, strong driv<strong>in</strong>g:<br />
n ≈ 150, E2 ≈ 75, E4 ≈ −10).<br />
6
driven system, <strong>the</strong> spectrum has also two humps at harmonics of <strong>the</strong> driv<strong>in</strong>g<br />
force at <strong>the</strong> low-k end of <strong>the</strong> w<strong>in</strong>dow of transparency. These effects could be<br />
reduced with a driv<strong>in</strong>g force that acts on a broader k-b<strong>and</strong>.<br />
In Fig.2(b), ρ(|φ|)d|φ| gives <strong>the</strong> probability that <strong>the</strong> amplitude at one location<br />
is between |φ| <strong>and</strong> |φ| + d|φ|. The distribution of <strong>the</strong> amplitudes is qualitatively<br />
different for <strong>the</strong> two simulations. In <strong>the</strong> weakly driven system we f<strong>in</strong>d a<br />
distribution ρ ∼ |φ|exp(−|φ| 2 ) without any <strong>in</strong>cident of an amplitude |φ| > 0.3<br />
dur<strong>in</strong>g 5·10 5 <strong>in</strong>tegration cycles. The probability density of <strong>the</strong> strongly driven<br />
system is aga<strong>in</strong> ga<strong>the</strong>red at small |φ|, but its shoulder-like shape shows that<br />
amplitudes of <strong>the</strong> order of one are obta<strong>in</strong>ed with a probability of about 10 −3 .<br />
3.2 Input <strong>and</strong> output of particles <strong>and</strong> energy<br />
Fig.3 shows <strong>the</strong> <strong>in</strong>put <strong>and</strong> output rates of particles <strong>and</strong> energy by <strong>the</strong> driv<strong>in</strong>g<br />
<strong>and</strong> damp<strong>in</strong>g forces as functions of k for <strong>the</strong> simulation with weak driv<strong>in</strong>g<br />
of Fig.2. For clarity, low wavenumbers (a) <strong>and</strong> high wavenumbers (b) are<br />
plotted on different scales. Positive ∆nk show <strong>the</strong> <strong>in</strong>put of particles <strong>in</strong> <strong>the</strong><br />
driv<strong>in</strong>g range (Fig.3(a)), while negative ∆nk <strong>in</strong>dicate particle losses both <strong>in</strong><br />
<strong>the</strong> low-k (Fig.3(a)) <strong>and</strong> <strong>in</strong> <strong>the</strong> high-k damp<strong>in</strong>g ranges (Fig.3(b)). The total<br />
particle number is unchanged s<strong>in</strong>ce <strong>in</strong>put <strong>and</strong> output of particles match as<br />
�<br />
∆nk∆k = 0, <strong>and</strong> <strong>the</strong> particle number is also conserved by <strong>the</strong> Hamiltonian<br />
dynamics.<br />
A change ∆nk of <strong>the</strong> particle density at <strong>the</strong> mode k also changes <strong>the</strong> density<br />
of <strong>the</strong> coupl<strong>in</strong>g energy E2 at this wavenumber by ω(k)∆nk∆k. Consequently,<br />
<strong>the</strong> ga<strong>in</strong>s <strong>and</strong> losses of particles by <strong>the</strong> driv<strong>in</strong>g <strong>and</strong> damp<strong>in</strong>g translate to ga<strong>in</strong>s<br />
<strong>and</strong> losses of energy via <strong>the</strong> coefficient ω(k) = √ k. The energy ga<strong>in</strong> <strong>in</strong> <strong>the</strong><br />
ω<br />
−5<br />
10<br />
0<br />
−5<br />
−10<br />
(k)Δ n k Δk<br />
0<br />
10<br />
kL/<br />
damp<strong>in</strong>g<br />
20<br />
2π<br />
30<br />
driv<strong>in</strong>g<br />
−2 10 −50<br />
−5<br />
2 10<br />
ω (k) Δ n k Δk<br />
−7<br />
10<br />
40 Δ n k Δk<br />
kL/ 2π<br />
48<br />
2000<br />
(a) (b)<br />
0<br />
−7<br />
−10<br />
48<br />
w<strong>in</strong>dow of<br />
transparency<br />
1000<br />
damp<strong>in</strong>g 0<br />
−10<br />
k<br />
−7<br />
Δ n Δk<br />
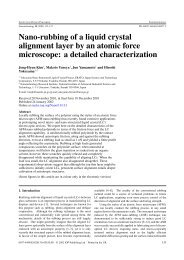
Fig. 3. Particle- <strong>and</strong> energy-balance for <strong>the</strong> weakly driven system of Fig.2. The<br />
driv<strong>in</strong>g <strong>and</strong> damp<strong>in</strong>g forces change <strong>the</strong> particle contents of <strong>the</strong> mode k by ∆nk∆k<br />
per time unit. ∆nk is <strong>the</strong> change of <strong>the</strong> particle density, ∆k = 2π/4096 is <strong>the</strong><br />
distance between adjacent modes. This particle <strong>in</strong>put or output is connected to a<br />
change of <strong>the</strong> coupl<strong>in</strong>g energy by ω(k)∆nk∆k. (a): The low-k damp<strong>in</strong>g range <strong>and</strong><br />
driv<strong>in</strong>g range. (b): The w<strong>in</strong>dow of transparency <strong>and</strong> <strong>the</strong> high-k damp<strong>in</strong>g range.<br />
7
driv<strong>in</strong>g range matches <strong>the</strong> energy loss <strong>in</strong> <strong>the</strong> two damp<strong>in</strong>g ranges, so that<br />
� ω(k)∆nk∆k = 0. The <strong>in</strong>fluence of driv<strong>in</strong>g <strong>and</strong> damp<strong>in</strong>g on <strong>the</strong> nonl<strong>in</strong>ear<br />
energy E4 is very small.<br />
3.3 Particle flux of <strong>the</strong> weakly driven system<br />
In a statistically stationary nonequilibrium state, <strong>the</strong> particle number |ak| 2 +<br />
|a−k| 2 at |k| fluctuates about a time-<strong>in</strong>dependent average value nk (Fig.2a).<br />
Particles that are <strong>in</strong>jected <strong>in</strong> <strong>the</strong> driv<strong>in</strong>g range flow to <strong>the</strong> two damp<strong>in</strong>g regions,<br />
where particles are removed at <strong>the</strong> same rate. This def<strong>in</strong>es two fluxes of<br />
particles, one <strong>in</strong> a direct cascade through <strong>the</strong> w<strong>in</strong>dow of transparency (where<br />
no particles are <strong>in</strong>jected or removed) to <strong>the</strong> high-k damp<strong>in</strong>g, <strong>and</strong> one <strong>in</strong> an<br />
<strong>in</strong>verse cascade to <strong>the</strong> low-k damp<strong>in</strong>g range. The particle flux q(k) through<br />
k-space follows from <strong>the</strong> cont<strong>in</strong>uity equation for <strong>the</strong> particles<br />
∆q(k)/∆k − ∆nk/∆t = 0 (2)<br />
where ∆k = 2π/4096 <strong>and</strong> ∆t = 1 <strong>in</strong> our simulations (a correspond<strong>in</strong>g partial<br />
differential equation ∆ → ∂ applies to cont<strong>in</strong>ously damped <strong>and</strong> driven,<br />
<strong>in</strong>f<strong>in</strong>ite systems). ∆nk is <strong>the</strong> particle <strong>in</strong>put or output by <strong>the</strong> external driv<strong>in</strong>g<br />
<strong>and</strong> damp<strong>in</strong>g, which is m<strong>in</strong>us <strong>the</strong> particle change that is caused by <strong>the</strong> flux<br />
0<br />
-0.0001<br />
-0.0002<br />
-0.0003<br />
damp<strong>in</strong>g<br />
driv<strong>in</strong>g<br />
w<strong>in</strong>dow of<br />
transparency<br />
0 1<br />
(a)<br />
Q<br />
damp<strong>in</strong>g<br />
0.00004<br />
0.00002<br />
0<br />
-0.00002<br />
-0.00004<br />
w<strong>in</strong>dow of<br />
transparency damp<strong>in</strong>g<br />
-0.00006<br />
0 1<br />
damp<strong>in</strong>g<br />
driv<strong>in</strong>g<br />
P<br />
Qω<br />
ω (b) ω<br />
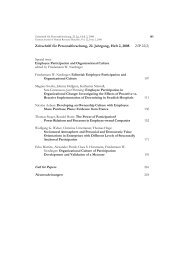
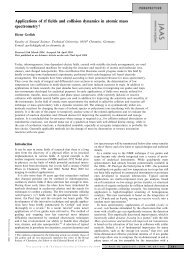
Fig. 4. Particle- <strong>and</strong> energy-fluxes <strong>in</strong> ω-space for <strong>the</strong> weakly driven system of Fig.2.<br />
(a): The particle flux Q is positive (i.e. particles move toward high ω) <strong>in</strong> <strong>the</strong> w<strong>in</strong>dow<br />
of transparency <strong>and</strong> <strong>in</strong> <strong>the</strong> high-ω (or high-k) damp<strong>in</strong>g range, <strong>and</strong> it is strongly<br />
negative <strong>in</strong> <strong>the</strong> low-ω damp<strong>in</strong>g range <strong>and</strong> <strong>in</strong> most of <strong>the</strong> driv<strong>in</strong>g range. Its gradient<br />
is negative <strong>in</strong> <strong>the</strong> damp<strong>in</strong>g ranges, where particles are removed from <strong>the</strong> system,<br />
<strong>and</strong> positive <strong>in</strong> <strong>the</strong> driv<strong>in</strong>g range, where particles are <strong>in</strong>jected <strong>in</strong>to <strong>the</strong> system. Q<br />
is constant <strong>in</strong> <strong>the</strong> w<strong>in</strong>dow of transparency. It is zero at ω = 0 <strong>and</strong> at ω = √ π,<br />
as <strong>the</strong> particle <strong>in</strong>put matches <strong>the</strong> particle output. (b): The energy flux P has <strong>the</strong><br />
same qualitative characteristics as Q. Qω is <strong>the</strong> energy drift of <strong>the</strong> particle flux.<br />
K = P − Qω is <strong>the</strong> energy transfer from <strong>the</strong> <strong>in</strong>verse cascade at low ω (where energy<br />
is released) to <strong>the</strong> direct cascade where energy is absorbed by <strong>the</strong> energy drift.<br />
8<br />
K
q(k). This def<strong>in</strong>ition yields <strong>the</strong> m<strong>in</strong>us sign <strong>in</strong> equation (2). The particle flux<br />
is obta<strong>in</strong>ed as q(k) = � k ˜k=0 ∆n˜ k ∆ ˜ k/∆t. As <strong>the</strong> system’s particle number is<br />
constant, <strong>the</strong> particle flux vanishes at k = 0 <strong>and</strong> at <strong>the</strong> short-wave boundary<br />
of <strong>the</strong> Brillou<strong>in</strong>-zone k = π. The flux can be def<strong>in</strong>ed <strong>in</strong> frequency space as<br />
Q(ω) = q(k(ω)) which has similar properties s<strong>in</strong>ce ω(k) = �<br />
|k| is bijective<br />
<strong>in</strong> <strong>the</strong> <strong>in</strong>terval [0, π]. Fig.4 shows <strong>the</strong> particle flux Q(ω) for <strong>the</strong> simulation of<br />
Fig.3. A negative sign <strong>in</strong>dicates a flux toward small frequencies (or wavenumbers),<br />
a positive sign shows a flux to high ω. The flux is strongly negative<br />
<strong>in</strong> <strong>the</strong> <strong>the</strong> <strong>in</strong>verse cascade at low ω. The sign changes at some po<strong>in</strong>t <strong>in</strong> <strong>the</strong><br />
driv<strong>in</strong>g region, <strong>and</strong> <strong>in</strong> <strong>the</strong> w<strong>in</strong>dow of transparency <strong>the</strong>re is a small positive<br />
flux to high ω. The slope is positive <strong>in</strong> <strong>the</strong> driv<strong>in</strong>g range, <strong>and</strong> negative <strong>in</strong><br />
<strong>the</strong> damp<strong>in</strong>g ranges. The flux of this direct cascade is k-<strong>in</strong>dependent <strong>in</strong> <strong>the</strong><br />
w<strong>in</strong>dow of transparency, <strong>and</strong> decays <strong>in</strong> <strong>the</strong> damp<strong>in</strong>g region at k > π/2 where<br />
particles are absorbed.<br />
3.4 Energy flux <strong>in</strong> <strong>the</strong> weakly driven system<br />
Similarly to <strong>the</strong> particles, <strong>the</strong> energy that is <strong>in</strong>jected at <strong>the</strong> driv<strong>in</strong>g scale flows<br />
to <strong>the</strong> two damp<strong>in</strong>g ranges. The energy flux p(k) = � k ˜k=0 ω( ˜ k)∆n˜k ∆˜ k/∆t can<br />
be def<strong>in</strong>ed from <strong>the</strong> energy cont<strong>in</strong>uity equation<br />
∆p(k)/∆k − ω(k)∆nk/∆t = 0 (3)<br />
where <strong>the</strong> energy sources <strong>and</strong> s<strong>in</strong>ks are located at <strong>the</strong> same wavenumbers as<br />
<strong>the</strong> particles sources. The constant energy of <strong>the</strong> nonequilibrium state requires<br />
that <strong>the</strong>re is no flux through <strong>the</strong> boundaries p(0) = p(π) = 0. Fig.4(b) shows<br />
<strong>the</strong> correspond<strong>in</strong>g flux <strong>in</strong> ω-space P (ω) = p(k(ω)).<br />
As particles move toward higher values of ω <strong>in</strong> <strong>the</strong> direct cascade, <strong>the</strong>ir load<br />
with coupl<strong>in</strong>g energy <strong>in</strong>creases proportionally to ω. The energy transport of<br />
<strong>the</strong> particle flux is measured by <strong>the</strong> quantity Q(ω)ω, which we call <strong>the</strong> energy<br />
drift. The energy drift depends on ω even <strong>in</strong> regions that are remote from<br />
energy sources <strong>and</strong> s<strong>in</strong>ks: In <strong>the</strong> w<strong>in</strong>dow of transparency, it <strong>in</strong>creases with<br />
ω while <strong>the</strong> energy flux P (ω) <strong>and</strong> <strong>the</strong> particle flux Q(ω) are constant. The<br />
<strong>in</strong>verse cascade is l<strong>in</strong>ked to a negative energy drift that approaches zero for<br />
ω → 0.<br />
K = P − Qω amounts for <strong>the</strong> discrepancy of <strong>the</strong> energy flux <strong>and</strong> <strong>the</strong> energy<br />
drift. It measures <strong>the</strong> part of <strong>the</strong> energy flux P that is not related to <strong>the</strong><br />
particle flux. We call K <strong>the</strong> energy transfer term, because it describes <strong>the</strong><br />
transfer of energy from <strong>the</strong> <strong>in</strong>verse cascade to <strong>the</strong> direct cascade: Particles<br />
of <strong>the</strong> <strong>in</strong>verse cascade release energy as <strong>the</strong>y move towards lower ω, which<br />
feeds <strong>the</strong> energy transfer process. The energy transfer K shifts this energy<br />
toward higher frequencies by four-wave <strong>in</strong>teractions. This energy is absorbed<br />
9
y <strong>the</strong> energy drift <strong>in</strong> <strong>the</strong> direct cascade, where <strong>the</strong> particles dem<strong>and</strong> energy<br />
<strong>in</strong> order to move to higher ω. In o<strong>the</strong>r words, <strong>the</strong> <strong>in</strong>verse cascade drives <strong>the</strong><br />
direct cascade via <strong>the</strong> energy transfer. K is positive for all wavenumbers <strong>in</strong><br />
this simulation, <strong>and</strong> vanishes at <strong>the</strong> boundaries.<br />
Fig.4 <strong>and</strong> Fig.2 give evidence for a pure weakly turbulent flow without strongly<br />
nonl<strong>in</strong>ear processes. The amplitudes are always small, <strong>and</strong> <strong>the</strong> coupl<strong>in</strong>g part<br />
of <strong>the</strong> Hamiltonian carries almost all energy. The nonl<strong>in</strong>earity acts only as a<br />
weak coupl<strong>in</strong>g force of l<strong>in</strong>ear waves, without directly <strong>in</strong>terfer<strong>in</strong>g <strong>in</strong> <strong>the</strong> energy<br />
<strong>in</strong>put or output. As suggested <strong>in</strong> [17], <strong>the</strong> ma<strong>in</strong> <strong>in</strong>gredient to obta<strong>in</strong> such a<br />
solution numerically is a sufficient number of modes <strong>in</strong> <strong>the</strong> low-k damp<strong>in</strong>g<br />
range <strong>and</strong> <strong>in</strong> <strong>the</strong> driv<strong>in</strong>g range. This avoids a bottleneck <strong>in</strong> <strong>the</strong> particle flow<br />
of <strong>the</strong> <strong>in</strong>verse cascade due to <strong>the</strong> lack of resonant modes.<br />
The Zakharov solution nk ∼ 1/k to <strong>the</strong> k<strong>in</strong>etic equation <strong>in</strong>volves a f<strong>in</strong>ite<br />
energy flux P > 0 <strong>and</strong> a zero particle flux Q = 0 <strong>in</strong> <strong>the</strong> direct cascade. This<br />
may be regarded as <strong>the</strong> limit of <strong>the</strong> fluxes of Fig.4 for an <strong>in</strong>f<strong>in</strong>ite extension of<br />
<strong>the</strong> w<strong>in</strong>dow of transparency, with a high-frequency damp<strong>in</strong>g at ω → ∞. The<br />
energy transfer K is aga<strong>in</strong> fed by <strong>the</strong> release of energy <strong>in</strong> <strong>the</strong> <strong>in</strong>verse cascade,<br />
but it is qualitatively different <strong>in</strong> <strong>the</strong> direct cascade. The Zakharov solution<br />
has a zero energy drift <strong>in</strong> <strong>the</strong> direct cascade, so that <strong>the</strong> energy transfer equals<br />
<strong>the</strong> energy flux K = P , <strong>and</strong> is ω-<strong>in</strong>dependent <strong>in</strong> <strong>the</strong> w<strong>in</strong>dow of transparency.<br />
3.5 Transition of <strong>the</strong> particle flux<br />
We now determ<strong>in</strong>e how <strong>the</strong> strength of <strong>the</strong> particle flux changes with <strong>the</strong><br />
particle number. We run a number of simulations with various driv<strong>in</strong>g powers<br />
<strong>and</strong> determ<strong>in</strong>e <strong>the</strong> coefficient c of <strong>the</strong> spectrum nk = c/(kL/2π) for each of<br />
<strong>the</strong>se simulations. c = 2.4 of Figs.3,4 corresponds to <strong>the</strong> weakest driv<strong>in</strong>g force.<br />
Fig.5 shows <strong>the</strong> strength of <strong>the</strong> particle fluxes Q of <strong>the</strong> direct cascade <strong>and</strong><br />
<strong>the</strong> <strong>in</strong>verse cascade for various driv<strong>in</strong>g forces. Q+ is <strong>the</strong> particle flux <strong>in</strong> <strong>the</strong><br />
w<strong>in</strong>dow of transparency, where <strong>the</strong> particle flux of <strong>the</strong> direct cascade reaches its<br />
maximum. |Q−| is <strong>the</strong> modulus of <strong>the</strong> particle flux at <strong>the</strong> boundary between<br />
<strong>the</strong> low-k damp<strong>in</strong>g range <strong>and</strong> <strong>the</strong> driv<strong>in</strong>g range (see Figs.3(a),4(a)). Both<br />
fluxes <strong>in</strong>crease with c, <strong>and</strong> <strong>the</strong> l<strong>in</strong>es <strong>in</strong> Fig.5(a) are tentative <strong>in</strong>terpolations<br />
Q ∼ c 3.45 . For comparison, <strong>the</strong> wave <strong>turbulence</strong> closure gives Q ∼ c 3 for fourwave<br />
<strong>in</strong>teractions.<br />
The <strong>in</strong>put of particles <strong>and</strong> of energy matches <strong>the</strong> output only for a certa<strong>in</strong> ratio<br />
[1] of <strong>the</strong> strengths of <strong>the</strong> fluxes Q+ <strong>and</strong> Q−. We assume for simplicity that <strong>the</strong><br />
driv<strong>in</strong>g force acts only at one effective frequency ω0, <strong>and</strong> that <strong>the</strong> high- <strong>and</strong><br />
low-frequency damp<strong>in</strong>g act at ω+ <strong>and</strong> ω− respectively. The particle output<br />
rates at <strong>the</strong>se s<strong>in</strong>ks are Q+ <strong>and</strong> |Q−|, with correspond<strong>in</strong>g energy output rates<br />
Q+ω+ <strong>and</strong> |Q−|ω−. Input of particles Q+ + |Q−| <strong>and</strong> of energy (Q+ + |Q−|)ω0<br />
<strong>and</strong> <strong>the</strong>ir output match if Q+/|Q−| = (ω0 − ω−)/(ω+ − ω0) ≈ 0.05, where we<br />
have set ω+ ≈ 1.5, ω− ≈ 0.15, ω0 ≈ 0.21. Fig.5(b) shows this ratio of <strong>the</strong><br />
10
1<br />
0.1<br />
0.01<br />
0.001<br />
0.0001<br />
IQ−I 1 10 100<br />
(a)<br />
Q +<br />
c<br />
1<br />
0.1<br />
Q / Q<br />
I<br />
+ −I<br />
weak <strong>turbulence</strong><br />
0<br />
(b)<br />
<strong>collapses</strong><br />
(ω −ω )/(ω −ω )<br />
0.01<br />
1 10 100<br />
Fig. 5. (a): Maximum particle flux of <strong>the</strong> direct cascade Q+ <strong>and</strong> of <strong>the</strong> <strong>in</strong>verse<br />
cascade |Q−| versus <strong>the</strong> coefficient c of <strong>the</strong> wave action nk = c/(kL/2π). The l<strong>in</strong>es<br />
give a fit with ∼ c 3.45 . (b): Ratio of direct <strong>and</strong> <strong>in</strong>verse cascade versus <strong>the</strong> wave action.<br />
For low particle densities, <strong>the</strong> ratio agrees to <strong>the</strong> prediction of weak <strong>turbulence</strong><br />
<strong>the</strong>ory Q+/|Q−| = (ω0 − ω−)/(ω+ − ω0) ≈ 0.05, where ω+ ≈ 1.5 is <strong>the</strong> average<br />
frequency of high-k damp<strong>in</strong>g <strong>and</strong> ω− ≈ 0.15 of low-k damp<strong>in</strong>g, while ω0 ≈ 0.21 is<br />
<strong>the</strong> frequency where <strong>the</strong> driv<strong>in</strong>g occurs.<br />
two fluxes. For weak driv<strong>in</strong>g forces (correspond<strong>in</strong>g to c < 10), Q+ <strong>and</strong> |Q−|<br />
both <strong>in</strong>crease at <strong>the</strong> same rate with c, so that we f<strong>in</strong>d <strong>the</strong> expected fixed ratio<br />
of fluxes Q+/|Q−| ≈ 0.05 (l<strong>in</strong>e <strong>in</strong> Fig.5(b)). Above c ≈ 10 however, <strong>the</strong> flux<br />
|Q−| <strong>in</strong>creases at a lower rate with c, <strong>and</strong> <strong>the</strong> ratio Q+/|Q−| <strong>in</strong>creases. This<br />
is obviously not compatible with <strong>the</strong> assumption of a weakly turbulent state.<br />
4 Collapses <strong>and</strong> fluxes <strong>in</strong> amplitude space<br />
4.1 Particle flux <strong>and</strong> energy flux for <strong>the</strong> strongly driven system<br />
Above <strong>the</strong> transition po<strong>in</strong>t of Fig.5(b) we observe <strong>in</strong>termittent high-amplitude<br />
structures. These structures are visible <strong>in</strong> <strong>the</strong> amplitude statistics of Fig.2(b),<br />
but not <strong>in</strong> <strong>the</strong> power spectrum Fig.2(a) s<strong>in</strong>ce only few of <strong>the</strong> particles contribute<br />
to <strong>collapses</strong>, <strong>and</strong> <strong>the</strong>ir Phillips spectrum decays more rapidly with k<br />
than <strong>the</strong> WT spectrum of <strong>the</strong> low-amplitude background [18]. We focus on<br />
<strong>the</strong> fluxes of particles <strong>and</strong> energy related to <strong>the</strong> strongly nonl<strong>in</strong>ear events, <strong>and</strong><br />
mention <strong>the</strong>ir dynamical properties only briefly.<br />
Figs.6-8 show results for <strong>the</strong> strongly driven system of Fig.2 with c = 27.<br />
Fig.6 shows <strong>the</strong> fluxes of particles <strong>and</strong> energy <strong>in</strong> wavenumber space. Aga<strong>in</strong> as<br />
<strong>in</strong> Fig.3(a), <strong>the</strong> particle flux <strong>in</strong> Fig.6(a) is negative at small ω <strong>and</strong> positive<br />
above <strong>the</strong> driv<strong>in</strong>g range, <strong>and</strong> it reaches zero both for high <strong>and</strong> for low ω. Compared<br />
to <strong>the</strong> weakly driven system of Fig.3, <strong>the</strong> particle fluxes are stronger by<br />
three orders of magnitude, <strong>and</strong> a higher share of particles (one fourth compared<br />
to one twentieth) moves toward high ω. The relative strength of <strong>the</strong><br />
11<br />
−<br />
+<br />
0<br />
c
0.1<br />
0<br />
-0.1<br />
-0.2<br />
-0.3<br />
damp<strong>in</strong>g<br />
driv<strong>in</strong>g<br />
Q<br />
w<strong>in</strong>dow of<br />
transparency<br />
-0.4<br />
0 1<br />
(a)<br />
damp<strong>in</strong>g<br />
ω<br />
0.15<br />
0.1<br />
0.05<br />
0<br />
-0.05<br />
damp<strong>in</strong>g<br />
driv<strong>in</strong>g<br />
w<strong>in</strong>dow of<br />
transparency<br />
K<br />
P<br />
-0.1<br />
0 1<br />
Qω<br />
damp<strong>in</strong>g<br />
Fig. 6. Particle- <strong>and</strong> energy-fluxes of <strong>the</strong> strongly driven system of Fig.2. (a): The<br />
particle flux Q has <strong>the</strong> same shape as for <strong>the</strong> weakly driven system (Fig.3), but<br />
<strong>the</strong> positive flux towards high ω has a higher relative strength. Aga<strong>in</strong> <strong>the</strong>re is no<br />
net ga<strong>in</strong> or loss of particles. (b): Unlike for <strong>the</strong> weakly driven system (Fig.3b), <strong>the</strong><br />
energy flux P <strong>and</strong> <strong>the</strong> energy transfer K become negative for high ω.<br />
direct cascade leads to a significant change of <strong>the</strong> energy fluxes <strong>in</strong> Fig.6(b):<br />
The dissipation at high ω causes to a decay of <strong>the</strong> energy flux P below zero.<br />
The dissipation of coupl<strong>in</strong>g energy exceeds its <strong>in</strong>put by ∆E2 with<strong>in</strong> each cycle<br />
of driv<strong>in</strong>g <strong>and</strong> damp<strong>in</strong>g. Contrary to this apparent loss of coupl<strong>in</strong>g energy, E2<br />
is constant with only small fluctuations, <strong>and</strong> consequently <strong>the</strong>re must be an<br />
additional source of coupl<strong>in</strong>g energy to compensate this loss.<br />
This source also plays a role for <strong>the</strong> energy transfer K. K is positive <strong>in</strong> <strong>the</strong><br />
lower part of <strong>the</strong> w<strong>in</strong>dow of transparency, which <strong>in</strong>dicates an energy transfer<br />
from <strong>the</strong> <strong>in</strong>verse cascade that is feed<strong>in</strong>g <strong>the</strong> energy drift <strong>in</strong> <strong>the</strong> direct cascade.<br />
However, <strong>the</strong> sign of K changes with<strong>in</strong> <strong>the</strong> w<strong>in</strong>dow of transparency, <strong>and</strong> K < 0<br />
suggests that energy is transfered from a source at high ω to lower frequencies,<br />
where it feeds <strong>the</strong> energy drift Qω. The energy drift is <strong>the</strong>refore now driven<br />
both by <strong>the</strong> energy transfer from <strong>the</strong> <strong>in</strong>verse cascade, <strong>and</strong> from a transfer of<br />
energy from some o<strong>the</strong>r source <strong>in</strong> <strong>the</strong> high-ω dissipation range. We will now<br />
study this source of energy.<br />
4.2 Nonl<strong>in</strong>ear energy<br />
Fig.7 shows <strong>the</strong> average <strong>in</strong>put <strong>and</strong> output of particles <strong>and</strong> of nonl<strong>in</strong>ear energy<br />
E4 as a function of <strong>the</strong> amplitude |φ|. For a formal def<strong>in</strong>ition, we def<strong>in</strong>e <strong>the</strong><br />
ceil<strong>in</strong>g function<br />
c(v, w) =<br />
� v for v < w<br />
12<br />
w for v ≥ w<br />
(b)<br />
ω<br />
Δ E<br />
2
for real v, w. The square norm of <strong>the</strong> ceil<strong>in</strong>g function of <strong>the</strong> amplitude | ˜ φ(x)| is<br />
an amplitude-dependent particle number n(|φ|) = � c 2 (| ˜ φ(x)|, |φ|)dx. This particle<br />
number is obta<strong>in</strong>ed when <strong>the</strong> amplitude is set to equal |φ| at all locations<br />
where it exceeds |φ|. The derivative n|φ| = ∂n(|φ|)/∂|φ| gives <strong>the</strong> nonnegative<br />
density of particles as a function of <strong>the</strong> amplitude |φ|, <strong>and</strong> n = � ∞<br />
0 n|φ|d|φ| is<br />
<strong>the</strong> total particle number. ∆n|φ| as shown <strong>in</strong> Fig.7(a),(b) is <strong>the</strong> time-averaged<br />
difference of n|φ| before <strong>and</strong> after <strong>the</strong> driv<strong>in</strong>g <strong>and</strong> damp<strong>in</strong>g kick. In o<strong>the</strong>r words,<br />
n|φ| is <strong>the</strong> particle density <strong>in</strong> amplitude space that is <strong>in</strong>jected or removed by<br />
<strong>the</strong> driv<strong>in</strong>g <strong>and</strong> damp<strong>in</strong>g. There is a net particle <strong>in</strong>put at low amplitudes <strong>and</strong><br />
a net particle output at high amplitudes. The area under <strong>the</strong> curve where particles<br />
are ga<strong>in</strong>ed equals <strong>the</strong> area under <strong>the</strong> curve where particles are removed,<br />
as <strong>the</strong>re is no net ga<strong>in</strong> or loss of particles.<br />
Analogously to <strong>the</strong> particle density, a density of nonl<strong>in</strong>ear energy <strong>in</strong> amplitude<br />
space E4|φ| = ∂E4(|φ|)/∂(|φ|) derives from <strong>the</strong> amplitude-dependent energy<br />
E4(|φ|) = − � c 4 (| ˜ φ(x)|, |φ|)/2dx. ∆E4|φ| of Fig.7(a),(c) is <strong>the</strong> average<br />
difference of E4|φ| before <strong>and</strong> after <strong>the</strong> driv<strong>in</strong>g <strong>and</strong> damp<strong>in</strong>g. This shows a<br />
net ga<strong>in</strong> of nonl<strong>in</strong>ear energy at high |φ| where particles are dissipated, <strong>and</strong> a<br />
small net energy loss at low |φ| where particles are <strong>in</strong>jected. As <strong>the</strong> change<br />
of <strong>the</strong> amplitude ∆|φ| ≪ |φ| is small compared to <strong>the</strong> amplitude, <strong>the</strong> change<br />
Δ E 4|φ|<br />
1<br />
0.5<br />
0<br />
-0.5<br />
-1<br />
1.5<br />
net energy<br />
ga<strong>in</strong><br />
|φ|<br />
1<br />
net particle<br />
output<br />
net particle<br />
<strong>in</strong>put<br />
0.5<br />
0<br />
(a)<br />
−|φ| 2 Δ n |φ|<br />
0<br />
0.2 0.1<br />
Δ n |φ|<br />
-0.2<br />
-0.1<br />
2<br />
Δn|φ|<br />
1<br />
0<br />
-1<br />
-2<br />
0 1 2<br />
0.2<br />
ΔE4<br />
|φ|<br />
0.1<br />
0<br />
-0.1<br />
driv<strong>in</strong>g<br />
net particle<br />
<strong>in</strong>put<br />
damp<strong>in</strong>g<br />
damp<strong>in</strong>g<br />
driv<strong>in</strong>g<br />
(b)<br />
net energy<br />
ga<strong>in</strong><br />
net particle<br />
output<br />
|φ|<br />
0 1 2<br />
Fig. 7. Balance of particles n <strong>and</strong> nonl<strong>in</strong>ear energy E4 as a function of <strong>the</strong> amplitude<br />
for <strong>the</strong> strongly driven system of Fig.2. (a): Damp<strong>in</strong>g <strong>and</strong> driv<strong>in</strong>g lead to a net<br />
particle ga<strong>in</strong> at those locations <strong>in</strong> real space where <strong>the</strong> amplitude is small (|φ| ≈ 0.3)<br />
<strong>and</strong> to a net particle loss at higher amplitudes (|φ| ≈ 1.4). The net losses match<br />
<strong>the</strong> net ga<strong>in</strong>s. The losses at high |φ| lead to a ga<strong>in</strong> of nonl<strong>in</strong>ear energy −|φ| 2 ∆n |φ|.<br />
(b): Driv<strong>in</strong>g <strong>and</strong> damp<strong>in</strong>g <strong>in</strong>ject <strong>and</strong> remove particles ma<strong>in</strong>ly at low |φ|. The net<br />
particle change (see also (a)) is <strong>the</strong> sum of <strong>the</strong> driv<strong>in</strong>g <strong>and</strong> <strong>the</strong> damp<strong>in</strong>g process.<br />
(c): The net change of <strong>the</strong> energy E4 (see also (a)) as <strong>the</strong> sum of <strong>the</strong> driv<strong>in</strong>g <strong>and</strong><br />
<strong>the</strong> damp<strong>in</strong>g process.<br />
13<br />
(c)<br />
|φ|
of <strong>the</strong> energy density is connected to <strong>the</strong> change of <strong>the</strong> particle density by<br />
∆E4|φ| ≈ −|φ| 2 ∆n|φ|. Sources <strong>and</strong> s<strong>in</strong>ks of <strong>the</strong> particles translate to s<strong>in</strong>ks <strong>and</strong><br />
sources of nonl<strong>in</strong>ear energy via <strong>the</strong> factor −|φ| 2 . This is somewhat similar to<br />
<strong>the</strong> correspondence between sources of particles <strong>and</strong> coupl<strong>in</strong>g energy <strong>in</strong> k-space<br />
of Fig.3, where <strong>the</strong> coefficient is ω(k). The particle s<strong>in</strong>k at high |φ| becomes a<br />
substantial source of energy E4, as <strong>the</strong> factor −|φ| 2 is quite significant <strong>the</strong>re.<br />
At <strong>the</strong> same time, <strong>the</strong> particle source at low |φ| is only a small energy s<strong>in</strong>k.<br />
Figs.7 (b) <strong>and</strong> (c) dist<strong>in</strong>guish between <strong>the</strong> effects of driv<strong>in</strong>g, damp<strong>in</strong>g, <strong>and</strong><br />
<strong>the</strong> net effect of <strong>the</strong> superposition of both (as <strong>in</strong> (a)). Fig.7 (b) shows that<br />
that most particles are both <strong>in</strong>jected <strong>and</strong> dissipated at locations where <strong>the</strong><br />
amplitude is small. The sum of both curves shows aga<strong>in</strong> <strong>the</strong> net particle <strong>in</strong>put<br />
at |φ| ≈ 0.3 <strong>and</strong> <strong>the</strong> output at |φ| ≈ 1.4. Fig.7(c) shows <strong>the</strong> correspond<strong>in</strong>g<br />
changes of nonl<strong>in</strong>ear energy, where <strong>the</strong> ga<strong>in</strong> at high amplitudes is <strong>the</strong> most<br />
important effect. In contrast to this, no relevant change of <strong>the</strong> nonl<strong>in</strong>ear energy<br />
is observed <strong>in</strong> <strong>the</strong> simulation with weak driv<strong>in</strong>g of Fig.3. In this case, <strong>the</strong><br />
particles are both <strong>in</strong>jected <strong>and</strong> removed at low amplitudes, <strong>and</strong> <strong>the</strong>re is no<br />
particle dissipation <strong>and</strong> no energy ga<strong>in</strong> at high |φ|.<br />
4.3 Fluxes <strong>in</strong> amplitude space <strong>and</strong> energy from <strong>collapses</strong><br />
The particle source at low |φ| <strong>and</strong> <strong>the</strong> s<strong>in</strong>k at high |φ| <strong>in</strong>duce a particle flux<br />
Λ(|φ|) through amplitude space. Fig.8(a) shows this particle flux, which is<br />
obta<strong>in</strong>ed from ∂Λ(|φ|)/∂|φ| − ∆n|φ|/∆t = 0 by <strong>in</strong>tegration of ∆n|φ| over |φ|.<br />
Similarly to <strong>the</strong> particle fluxes Q <strong>in</strong> ω-space (Figs.3(a),4(a)), it is zero both<br />
for low <strong>and</strong> for high |φ|, as <strong>the</strong> total particle number is constant. Λ(|φ|) is<br />
positive, which shows that <strong>the</strong> particle flux is directed from low amplitudes<br />
to high amplitudes. Unlike <strong>the</strong> fluxes <strong>in</strong> k or ω-space, <strong>the</strong> sources <strong>and</strong> s<strong>in</strong>ks<br />
overlap, so that only a part of <strong>the</strong> total particle <strong>in</strong>put contributes to <strong>the</strong> flux,<br />
while most particles are aga<strong>in</strong> removed by <strong>the</strong> damp<strong>in</strong>g at <strong>the</strong> same |φ|.<br />
A nonl<strong>in</strong>ear energy ”flux” M(|φ|) is obta<strong>in</strong>ed by <strong>in</strong>tegrat<strong>in</strong>g ∂M(|φ|)/∂|φ| −<br />
∆E4|φ|/∆t = 0. This quantity is negative at small amplitudes, s<strong>in</strong>ce <strong>the</strong> particle<br />
sources at low |φ| are s<strong>in</strong>ks of E4. At higher |φ| it <strong>in</strong>creases with <strong>the</strong><br />
amplitude, s<strong>in</strong>ce <strong>the</strong> particle s<strong>in</strong>ks <strong>in</strong> this doma<strong>in</strong> are powerful sources of E4.<br />
It reaches a saturation value ∆E4 at |φ| ≈ 1.8, which is <strong>the</strong> net ga<strong>in</strong> of nonl<strong>in</strong>ear<br />
energy by <strong>the</strong> driv<strong>in</strong>g <strong>and</strong> <strong>the</strong> damp<strong>in</strong>g.<br />
In a similar way, a ”flux” Π(|φ|) of coupl<strong>in</strong>g energy <strong>in</strong> amplitude space can be<br />
def<strong>in</strong>ed. The coupl<strong>in</strong>g energy of <strong>the</strong> locations x where <strong>the</strong> amplitude ˜ φ(x) is below<br />
<strong>the</strong> threshold | ˜ φ(x)| ≤ |φ| is E2(|φ|) = � u(|φ| − | ˜ φ(x)|)||∂/∂x| 1/4˜ φ(x)| 2 dx,<br />
where u(l ≥ 0) = 1, u(l < 0) = 0 is <strong>the</strong> unit step function. The correspond<strong>in</strong>g<br />
energy density <strong>in</strong> amplitude space is E2|φ| = ∂E2(|φ|)/∂|φ|. We measure <strong>the</strong><br />
time-averaged energy <strong>in</strong>put or output ∆E2|φ| of <strong>the</strong> density of <strong>the</strong> coupl<strong>in</strong>g<br />
energy <strong>in</strong> amplitude space. Π(|φ|) is obta<strong>in</strong>ed by <strong>in</strong>tegrat<strong>in</strong>g ∆E2|φ| over |φ|<br />
(Fig.8(d)). Π(|φ|) is zero at |φ| = 0, <strong>and</strong> decreases to a constant value ∆E2 < 0<br />
14
0.1<br />
0.08<br />
0.06<br />
0.04<br />
0.02<br />
0<br />
0.02<br />
0<br />
-0.02<br />
-0.04<br />
-0.06<br />
-0.08<br />
(a)<br />
Λ(|φ|)<br />
-0.02<br />
0 1 2<br />
Μ(|φ|)+Π(|φ|)<br />
-0.1<br />
0 1 2<br />
(c)<br />
|φ|<br />
|φ|<br />
0.1<br />
0.08<br />
0.06<br />
0.04<br />
0.02<br />
0<br />
-0.02<br />
0 1 2<br />
0.02<br />
0<br />
-0.02<br />
-0.04<br />
-0.06<br />
-0.08<br />
Π(|φ|)<br />
-0.1<br />
0 1 2<br />
(d)<br />
Μ(|φ|)<br />
Fig. 8. Particle <strong>and</strong> energy fluxes <strong>in</strong> amplitude (|φ|) space. (a) Particle flux Λ(|φ|) as<br />
obta<strong>in</strong>ed by <strong>in</strong>tegration of <strong>the</strong> net particle balance of Fig.7. Particles move towards<br />
high |φ| as coherent structures grow. Λ(|φ|) is zero both for |φ| = 0 <strong>and</strong> for high |φ|,<br />
as <strong>the</strong> system nei<strong>the</strong>r ga<strong>in</strong>s nor loses particles. (b) The ”flux” M(|φ|) of nonl<strong>in</strong>ear<br />
energy. (c) The total flux of energy (nonl<strong>in</strong>ear energy M(|φ|) plus coupl<strong>in</strong>g energy<br />
Π(|φ|)) is negative, i.e. energy flows from high amplitudes to low amplitudes. (d)<br />
The ”flux” of coupl<strong>in</strong>g energy Π(|φ|) is negative. The loss of coupl<strong>in</strong>g energy ∆E2<br />
<strong>in</strong> <strong>the</strong> flux Π(|φ|) is identical with <strong>the</strong> loss of coupl<strong>in</strong>g energy <strong>in</strong> <strong>the</strong> flux P <strong>in</strong> Fig.4.<br />
The loss of coupl<strong>in</strong>g energy ∆E2 matches <strong>the</strong> ga<strong>in</strong> ∆E4 of nonl<strong>in</strong>ear energy.<br />
at |φ| ≈ 1.8. Π(|φ|) expresses <strong>in</strong> amplitude space <strong>the</strong> same loss of coupl<strong>in</strong>g energy<br />
as Fig.6(b) does for <strong>the</strong> flux P (ω) <strong>in</strong> frequency space. This loss of coupl<strong>in</strong>g<br />
energy ∆E2 matches <strong>the</strong> ga<strong>in</strong> of nonl<strong>in</strong>ear energy ∆E4 of Fig.8(b).<br />
These ga<strong>in</strong>s <strong>and</strong> losses are caused by <strong>the</strong> external driv<strong>in</strong>g <strong>and</strong> damp<strong>in</strong>g, but<br />
<strong>the</strong> Hamiltonian dynamics reverses <strong>the</strong>se changes. E4 <strong>and</strong> E2 each are not<br />
conserved under <strong>the</strong> Hamiltonian dynamics, which actually transforms nonl<strong>in</strong>ear<br />
energy <strong>in</strong>to coupl<strong>in</strong>g energy at <strong>the</strong> same rate as damp<strong>in</strong>g <strong>and</strong> driv<strong>in</strong>g<br />
feed <strong>in</strong> nonl<strong>in</strong>ear energy, <strong>and</strong> dissipate coupl<strong>in</strong>g energy. As a consequence, E4<br />
<strong>and</strong> E2 each have no ga<strong>in</strong>s or losses after an average cycle of driv<strong>in</strong>g, damp<strong>in</strong>g,<br />
<strong>and</strong> Hamiltonian evolution over one time unit. Nonl<strong>in</strong>ear energy is produced<br />
ma<strong>in</strong>ly by <strong>the</strong> dissipation of particles at locations where <strong>the</strong> amplitude is high.<br />
The dissipation of coupl<strong>in</strong>g energy is also relevant for low-amplitude fluctuations.<br />
The total energy flux M(|φ|)+Π(|φ|) (Fig.8(c)) is <strong>the</strong>refore directed from<br />
high amplitudes to low amplitudes. In wavenumber space, this is related to<br />
15<br />
(b)<br />
|φ|<br />
|φ|<br />
Δ E4<br />
Δ E 2
<strong>the</strong> negative energy transfer K(ω) at high ω (Fig.6(b)). K is fed by <strong>the</strong> source<br />
of nonl<strong>in</strong>ear energy, which is due to <strong>the</strong> dissipation at high frequencies. This<br />
energy is transformed <strong>in</strong>to coupl<strong>in</strong>g energy <strong>in</strong> <strong>the</strong> w<strong>in</strong>dow of transparency.<br />
M(|φ|), Π(|φ|) <strong>and</strong> P (ω) are not genu<strong>in</strong>e fluxes, because E2 <strong>and</strong> E4 each are not<br />
conserved under <strong>the</strong> Hamiltonian dynamics. This causes <strong>the</strong> false impression<br />
of Figs.6(b),8(b),8(d) of permanent losses of E2 <strong>and</strong> ga<strong>in</strong>s of E4. These quantities<br />
do not account for <strong>the</strong> k-nonlocal energy transformation of E4 <strong>in</strong>to E2. In<br />
contrast, Λ(|φ|) <strong>and</strong> Q(ω) as well as M(|φ|)+Π(|φ|) are fluxes of <strong>the</strong> conserved<br />
quantities n <strong>and</strong> E respectively. In <strong>the</strong> weakly driven system (Fig.4(b)), P (ω)<br />
may also be considered as a flux, because E2 is virtually constant under <strong>the</strong><br />
Hamiltonian dynamics.<br />
4.4 The energy cycle of <strong>collapses</strong><br />
We now <strong>in</strong>vestigate <strong>the</strong> Hamiltonian process that transforms energy E4 <strong>in</strong>to E2<br />
by study<strong>in</strong>g <strong>the</strong> time-evolution, <strong>in</strong>stead of averaged quantities. Figs.9,10 show<br />
a simulation with a medium-power driv<strong>in</strong>g force with c = 13.6. Fig.9(a) shows<br />
<strong>the</strong> maximum square amplitude max(|φ| 2 (x)) that is reached at any location<br />
x <strong>in</strong> <strong>the</strong> system. The system has almost everywhere low amplitudes |φ| 2 < 0.3,<br />
<strong>and</strong> high amplitude structures |φ| 2 > 1 emerge only <strong>in</strong>termittently <strong>in</strong> small<br />
areas <strong>in</strong> space. The medium-power driv<strong>in</strong>g force allows us to dist<strong>in</strong>guish different<br />
amplitude blow-ups <strong>in</strong> time, while a stronger driv<strong>in</strong>g force would lead<br />
to overlapp<strong>in</strong>g high-amplitude signals from simultaneous blow-ups at different<br />
locations. The fluxes of <strong>the</strong> <strong>the</strong> cases c = 13.6 <strong>and</strong> c = 27 (Figs.6-8) have<br />
similar qualitative features. The weak driv<strong>in</strong>g force with c = 2.4 of Fig.4 leads<br />
to no such high-amplitude events, so that <strong>the</strong> maximum amplitude is of <strong>the</strong><br />
order |φ| 2 ∼ 0.01.<br />
It is not completely clear how <strong>the</strong>se structures emerge from <strong>the</strong> r<strong>and</strong>om lowamplitude<br />
background. The nonl<strong>in</strong>ear events are very similar to <strong>collapses</strong> <strong>in</strong><br />
Hamiltonian partial differential equations such as <strong>the</strong> undamped MMT equation<br />
or <strong>the</strong> nonl<strong>in</strong>ear Schröd<strong>in</strong>ger equation. These can be described as heterocl<strong>in</strong>ic<br />
orbits that connect <strong>the</strong> phase-unstable homogeneous mode with a<br />
localized structure with an <strong>in</strong>f<strong>in</strong>ite amplitude. A collapse conta<strong>in</strong>s a f<strong>in</strong>ite<br />
amount of particles with a zero energy, s<strong>in</strong>ce its nonl<strong>in</strong>ear energy is m<strong>in</strong>us<br />
<strong>the</strong> coupl<strong>in</strong>g energy. Collapses may be regarded as a coherent <strong>and</strong> k-nonlocal<br />
mechanism that transports particles towards high wavenumbers [4], [17], [18].<br />
Dissipation of short waves prevents <strong>the</strong> s<strong>in</strong>gularity, <strong>and</strong> leads to a decay of <strong>the</strong><br />
peak.<br />
In <strong>the</strong> focus<strong>in</strong>g nonl<strong>in</strong>ear Schröd<strong>in</strong>ger equation, all plane waves are phaseunstable<br />
under slow modulations, but this mechanism is different <strong>in</strong> <strong>the</strong> MMT<br />
equation. A perturbation δφ = exp(ikx)(a(t) exp(iqx) + b(t) exp(−iqx)) of a<br />
plane wave φ = √ n exp(i(kx − (ω − n)t) has an eigenvalue with a positive real<br />
part if (2n − ν)ν > 0 with ν = (ω(k + q) + ω(k − q) − 2ω(k))/2, which requires<br />
16
3<br />
2<br />
1<br />
max (|φ( )| )<br />
2<br />
x<br />
E4<br />
(a)<br />
t<br />
(b)<br />
0<br />
0 200 400 600 800 1000<br />
30<br />
20<br />
10<br />
0<br />
-10<br />
-20<br />
t<br />
Σ Δ<br />
0<br />
(driv<strong>in</strong>g)<br />
E2 t (damp<strong>in</strong>g)<br />
Σ ΔE<br />
0<br />
260<br />
360<br />
-30<br />
0 200 400 600 800 1000<br />
2<br />
50<br />
40<br />
30<br />
20<br />
10<br />
0<br />
-10<br />
0 200 400 600 800 1000<br />
4<br />
2<br />
0<br />
-2<br />
-4<br />
Σ Δ<br />
t<br />
Σ Δ<br />
0<br />
E +E<br />
t t<br />
(c) (d)<br />
0<br />
E 2<br />
4<br />
2 4<br />
E (driv<strong>in</strong>g) + Δ E<br />
t (driv<strong>in</strong>g)<br />
E 2<br />
+ Δ E<br />
(damp<strong>in</strong>g)<br />
4<br />
(damp<strong>in</strong>g)<br />
2<br />
0 200 400 600 800 1000<br />
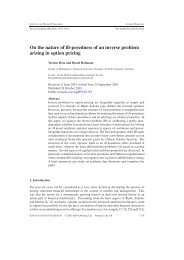
Fig. 9. Simulation with a medium-power driv<strong>in</strong>g force (c = 13.6). (a): Maximum of<br />
<strong>the</strong> squared amplitude |φ| 2 that is reached anywhere <strong>in</strong> <strong>the</strong> system as a function of<br />
time. (b) E2, E4 <strong>and</strong> E2 + E4 as functions of time. (c) Cumulated <strong>in</strong>put of coupl<strong>in</strong>g<br />
energy by <strong>the</strong> driv<strong>in</strong>g force �t 0 ∆E (driv<strong>in</strong>g)<br />
2 , <strong>and</strong> cumulated output of coupl<strong>in</strong>g energy<br />
by <strong>the</strong> damp<strong>in</strong>g � t 0 ∆E (damp<strong>in</strong>g)<br />
2<br />
. (d) Cumulated change of coupl<strong>in</strong>g energy by <strong>the</strong><br />
damp<strong>in</strong>g <strong>and</strong> <strong>the</strong> driv<strong>in</strong>g force �t 0 ∆E (driv<strong>in</strong>g)<br />
2 + ∆E (damp<strong>in</strong>g)<br />
2 (sum of <strong>the</strong> curves of<br />
(c)), <strong>and</strong> cumulated change of nonl<strong>in</strong>ear energy by <strong>the</strong> damp<strong>in</strong>g <strong>and</strong> <strong>the</strong> driv<strong>in</strong>g<br />
+ ∆E (damp<strong>in</strong>g)<br />
4 .<br />
force � t 0 ∆E (driv<strong>in</strong>g)<br />
4<br />
0 < ν < 2n. For <strong>the</strong> focus<strong>in</strong>g nonl<strong>in</strong>ear Schröd<strong>in</strong>ger equation, this is always<br />
fulfilled for small q s<strong>in</strong>ce ω = k2 is convex <strong>and</strong> ν = q2 > 0. For <strong>the</strong> MMT<br />
equation, a necessary condition for an <strong>in</strong>stability is that k + q <strong>and</strong> k − q have<br />
different signs, i.e. |q| > |k|. The homogeneous mode k = 0 is unstable under<br />
slow modulations, s<strong>in</strong>ce <strong>the</strong> dispersion ω = �<br />
|k| is convex at this po<strong>in</strong>t. For<br />
waves with k �= 0, <strong>the</strong> dispersion is concave, <strong>and</strong> an <strong>in</strong>stability occurs only<br />
by <strong>in</strong>teraction with remote modes, i.e. modes on both <strong>the</strong> left <strong>and</strong> <strong>the</strong> right<br />
branch of ω.<br />
A possible start<strong>in</strong>g po<strong>in</strong>t for <strong>collapses</strong> might be <strong>the</strong> built-up of a condensate<br />
at k = 0 by <strong>the</strong> <strong>in</strong>verse cascade [4]. The phase <strong>in</strong>stability of <strong>the</strong> condensate<br />
might lead to a collapse as soon as enough particles have ga<strong>the</strong>red at k = 0.<br />
However, <strong>in</strong> our simulations <strong>the</strong> low-k damp<strong>in</strong>g is so efficient that <strong>the</strong> homogeneous<br />
mode has a very low level. Collapses <strong>in</strong> our simulations occur while<br />
<strong>the</strong> homogeneous mode conta<strong>in</strong>s only nk=0 ∼ 0.1 particles, i.e. <strong>the</strong> number of<br />
particles <strong>in</strong> <strong>the</strong> homogeneous mode of <strong>the</strong> whole system is below <strong>the</strong> particle<br />
number of a s<strong>in</strong>gle collapse. In addition, we f<strong>in</strong>d no sign of a build-up of a<br />
17<br />
t
45<br />
44<br />
43<br />
−2<br />
−3<br />
−4<br />
E<br />
2<br />
E<br />
4<br />
<strong>collapses</strong><br />
growth<br />
energy<br />
output<br />
decay<br />
energy<br />
<strong>in</strong>put<br />
260 280 300 320 340 360<br />
(a)<br />
t<br />
0.1<br />
0<br />
-0.1<br />
<strong>collapses</strong><br />
Δ E4 (damp<strong>in</strong>g)<br />
Δ E<br />
(damp<strong>in</strong>g)<br />
2<br />
energy<br />
<strong>in</strong>put<br />
energy<br />
output<br />
260 280 300 320 340 360<br />
Fig. 10. (a): E2 <strong>and</strong> E4 as functions of time for <strong>the</strong> simulation of Fig.9. Energy<br />
is transfered from E4 to E2 dur<strong>in</strong>g <strong>the</strong> growth of a peak. This energy is partly<br />
dissipated <strong>and</strong> partly transfered back to E4 when <strong>the</strong> peak decays. The damp<strong>in</strong>g<br />
<strong>in</strong>creases <strong>the</strong> energy E4. (b): Energy ga<strong>in</strong> ∆E (damp<strong>in</strong>g)<br />
4 <strong>and</strong> energy loss ∆E (damp<strong>in</strong>g)<br />
2<br />
by <strong>the</strong> damp<strong>in</strong>g.<br />
condensate, as nk=0 appears to be <strong>in</strong>dependent of <strong>the</strong> occurrence of <strong>collapses</strong>.<br />
Collapses occur <strong>in</strong> <strong>the</strong> same way for even more efficient low-k damp<strong>in</strong>g, where<br />
each damp<strong>in</strong>g step removes all particles with small wavenumbers. The collapse<br />
dynamics appears to depend crucially on <strong>the</strong> maximum power <strong>in</strong> <strong>the</strong> driv<strong>in</strong>g<br />
range, or equivalently, on <strong>the</strong> total particle number. Instabilities of waves <strong>in</strong><br />
<strong>the</strong> driv<strong>in</strong>g range are strongly nonlocal <strong>in</strong> wavenumber space <strong>and</strong> cause no<br />
slow phase modulations.<br />
Fig.9(b) shows <strong>the</strong> energies E2, E4, <strong>and</strong> E = E2 + E4 of <strong>the</strong> total system<br />
dur<strong>in</strong>g <strong>the</strong> simulation. At each of <strong>the</strong> high-amplitude events, E4 temporarily<br />
decreases, while E2 <strong>in</strong>creases by <strong>the</strong> same amount, <strong>and</strong> both energies approach<br />
<strong>the</strong>ir previous values subsequently. There is no net change of <strong>the</strong>se energies<br />
on average.<br />
Fig.9(c) shows <strong>the</strong> <strong>in</strong>put <strong>and</strong> output of coupl<strong>in</strong>g energy as functions of time.<br />
�t0 ∆E (driv<strong>in</strong>g)<br />
2 is <strong>the</strong> <strong>in</strong>put of coupl<strong>in</strong>g energy through <strong>the</strong> driv<strong>in</strong>g force cumulated<br />
over a period of time [0, t], <strong>and</strong> �t 0 ∆E (damp<strong>in</strong>g)<br />
2 is <strong>the</strong> correspond<strong>in</strong>g output<br />
through <strong>the</strong> damp<strong>in</strong>g. Coupl<strong>in</strong>g energy is dissipated at an approximately<br />
constant rate between <strong>the</strong> <strong>collapses</strong>, which reflects a weakly turbulent transport<br />
of energy <strong>in</strong>to <strong>the</strong> dissipation range between <strong>the</strong> <strong>collapses</strong>. The <strong>in</strong>creased<br />
dissipation at times when high-amplitude structures emerge leads to step-like<br />
decays of �t 0 ∆E (damp<strong>in</strong>g)<br />
2 . The steps lead to an energy output that is bigger<br />
than <strong>the</strong> energy <strong>in</strong>put from <strong>the</strong> driv<strong>in</strong>g, i.e. �t 0 ∆E (damp<strong>in</strong>g)<br />
2 + �t 0 ∆E (driv<strong>in</strong>g)<br />
2 <<br />
0. This net output of coupl<strong>in</strong>g energy is shown <strong>in</strong> Fig.9(d) toge<strong>the</strong>r with <strong>the</strong> net<br />
<strong>in</strong>put of nonl<strong>in</strong>ear energy �t 0 ∆E (damp<strong>in</strong>g)<br />
4 + �t 0 ∆E (driv<strong>in</strong>g)<br />
4 > 0. The time average<br />
of ∆E (damp<strong>in</strong>g)<br />
2 + ∆E (driv<strong>in</strong>g)<br />
2 is just <strong>the</strong> energy-flux P (ω) = Π(|φ|) = ∆E2<br />
at high ω or high |φ|. The average of ∆E (damp<strong>in</strong>g)<br />
4 + ∆E (driv<strong>in</strong>g)<br />
4 is <strong>the</strong> energyflux<br />
M(|φ|) = ∆E4 at high |φ|. As <strong>the</strong>re is no net change of <strong>the</strong> total energy,<br />
<strong>the</strong> ga<strong>in</strong> of E4 matches <strong>the</strong> loss of E2.<br />
Fig.10 shows two of <strong>the</strong> <strong>collapses</strong> of <strong>the</strong> simulation of Fig.9. When a peak<br />
18<br />
(b)<br />
t
1.5<br />
1<br />
0.5<br />
0<br />
-0.5<br />
-1<br />
Δ E<br />
E<br />
Δ 2<br />
-1.5<br />
0 10 20 30 40 50 60<br />
4<br />
2<br />
|φ|<br />
+<br />
1.5<br />
1<br />
0.5<br />
2( ω −ω0 )<br />
0<br />
0 10 20 30 40 50 60<br />
c<br />
(a) (b)<br />
+<br />
ω + −ω 0<br />
Fig. 11. (a) Net loss of coupl<strong>in</strong>g energy ∆E2 <strong>and</strong> ga<strong>in</strong> of nonl<strong>in</strong>ear energy ∆E4<br />
versus <strong>the</strong> coefficient c of <strong>the</strong> power law nk = c/(kL/2π). ∆E2 is <strong>the</strong> value of <strong>the</strong><br />
energy flux P at high ω or Π at high |φ|, ∆E4 is <strong>the</strong> value of <strong>the</strong> flux of nonl<strong>in</strong>ear<br />
energy M at high |φ|. (b) Peak heights toge<strong>the</strong>r with an upper <strong>and</strong> a lower estimate.<br />
The simulations are <strong>the</strong> same as <strong>in</strong> Fig.5.<br />
emerges, <strong>the</strong> total coupl<strong>in</strong>g energy E2 <strong>in</strong>creases due to <strong>the</strong> high gradient of<br />
<strong>the</strong> peak. Simultaneously, <strong>the</strong> nonl<strong>in</strong>ear energy E4 decreases because of <strong>the</strong><br />
locally high amplitude. The blow-up transfers energy from E4 to E2.<br />
The peak is strongly affected by <strong>the</strong> damp<strong>in</strong>g so that it looses coupl<strong>in</strong>g energy.<br />
Fig.10(b) shows this dissipation, where <strong>the</strong> spikes of <strong>the</strong> dissipation rate<br />
∆E (damp<strong>in</strong>g)<br />
2 correspond to <strong>the</strong> steps of �t 0 ∆E (damp<strong>in</strong>g)<br />
2 of Fig.9(c). As <strong>the</strong> amplitude<br />
of <strong>the</strong> peak decreases by <strong>the</strong> action of <strong>the</strong> damp<strong>in</strong>g, <strong>the</strong> nonl<strong>in</strong>ear energy<br />
<strong>in</strong>creases aga<strong>in</strong>. Therefore <strong>the</strong> damp<strong>in</strong>g provides both an <strong>in</strong>put of energy<br />
E4 <strong>and</strong> an output of energy E2 (Fig.10(b)). The picture of <strong>the</strong> energy cycle is<br />
that <strong>the</strong> damp<strong>in</strong>g feeds nonl<strong>in</strong>ear energy ∆E4 <strong>in</strong>to <strong>the</strong> system, that is transformed<br />
to coupl<strong>in</strong>g energy ∆E2 <strong>and</strong> subsequently dissipated. The burnouts of<br />
<strong>the</strong> peaks are <strong>in</strong>complete [4], <strong>and</strong> some of <strong>the</strong> coupl<strong>in</strong>g energy is not dissipated,<br />
but returned to <strong>the</strong> nonl<strong>in</strong>ear energy by a Hamiltonian process. Radiation of<br />
<strong>the</strong> decay<strong>in</strong>g peak might also contribute to <strong>the</strong> low-amplitude waves.<br />
Fig.11(a) shows <strong>the</strong> net output rate coupl<strong>in</strong>g energy ∆E2 <strong>and</strong> <strong>the</strong> net <strong>in</strong>put<br />
rate of nonl<strong>in</strong>ear energy ∆E4 that is caused by damp<strong>in</strong>g <strong>and</strong> driv<strong>in</strong>g. As <strong>in</strong><br />
Fig.5, c measures <strong>the</strong> particle density that is obta<strong>in</strong>ed <strong>in</strong> <strong>the</strong> w<strong>in</strong>dow of transparency<br />
for different driv<strong>in</strong>g powers. Aga<strong>in</strong>, we can dist<strong>in</strong>guish between pure<br />
weak <strong>turbulence</strong> <strong>and</strong> <strong>collapses</strong>. For driv<strong>in</strong>g forces below <strong>the</strong> threshold c ≈ 10,<br />
<strong>the</strong> cumulated dissipation of coupl<strong>in</strong>g energy (as <strong>in</strong> Fig.9(c)) has no steps,<br />
as <strong>the</strong>re are no <strong>collapses</strong>. Average <strong>in</strong>put <strong>and</strong> output of coupl<strong>in</strong>g energy are<br />
match<strong>in</strong>g as ∆E (damp<strong>in</strong>g)<br />
2 + ∆E (driv<strong>in</strong>g)<br />
2 = ∆E2 ≈ 0, <strong>and</strong> <strong>the</strong> <strong>in</strong>put of nonl<strong>in</strong>ear<br />
energy ∆E (damp<strong>in</strong>g)<br />
4 ≈ 0 <strong>and</strong> ∆E (driv<strong>in</strong>g)<br />
4 ≈ 0 is negligible. Above <strong>the</strong> threshold,<br />
output of coupl<strong>in</strong>g energy <strong>and</strong> <strong>in</strong>put of nonl<strong>in</strong>ear energy by damp<strong>in</strong>g <strong>and</strong><br />
driv<strong>in</strong>g match closely as ∆E2 = −∆E4. The l<strong>in</strong>es give a tentative fit ∼ c4 .<br />
A characteristic peak height can be def<strong>in</strong>ed as <strong>the</strong> amplitude where <strong>the</strong> nonl<strong>in</strong>ear<br />
energy change by <strong>the</strong> damp<strong>in</strong>g <strong>and</strong> driv<strong>in</strong>g is maximal, i.e. |φ| of Fig.7<br />
with <strong>the</strong> maximum |∆E4|φ||. Fig.11(b) shows this peak height |φ|+ versus <strong>the</strong><br />
coefficient c of <strong>the</strong> power spectrum. Aga<strong>in</strong>, high amplitudes appear only for<br />
19<br />
c
strong driv<strong>in</strong>g forces. Below <strong>the</strong> threshold, |∆E4|φ|| is very small <strong>and</strong> negligible<br />
<strong>in</strong> <strong>the</strong> energy balance. To give an estimate <strong>the</strong> height of <strong>the</strong>se structures, we<br />
assume that ∆n particles carry<strong>in</strong>g an energy ω0∆n are <strong>in</strong>jected at ω0, <strong>and</strong><br />
<strong>the</strong>y are removed at ω+ where <strong>the</strong>y carry <strong>the</strong> coupl<strong>in</strong>g energy ω+∆n. The net<br />
energy loss ∆E2 = (ω0 − ω+)∆n from this process can be balanced by a ga<strong>in</strong><br />
of nonl<strong>in</strong>ear energy due to a particle flow towards high amplitudes where <strong>the</strong><br />
particles are dissipated. If we assume for simplicity that <strong>the</strong> damp<strong>in</strong>g reduces<br />
<strong>the</strong> amplitude |φ| by ∆|φ| ≪ |φ| <strong>in</strong> <strong>the</strong> <strong>in</strong>terval ∆x <strong>in</strong> space, an amount of<br />
∆n = 2|φ|∆|φ|∆x particles are removed <strong>and</strong> <strong>the</strong> nonl<strong>in</strong>ear energy is <strong>in</strong>creased<br />
by ∆E4 = |φ| 2∆n. With <strong>the</strong> energy balance ∆E4 + ∆E2 = 0, we obta<strong>in</strong><br />
|φ| = √ ω+ − ω0 as a lower estimate for <strong>the</strong> height of <strong>the</strong> peaks. For an upper<br />
estimate, we assume that <strong>the</strong> damp<strong>in</strong>g decreases <strong>the</strong> amplitude by ∆|φ| = |φ|<br />
<strong>and</strong> removes all particles ∆n = |φ| 2∆x from this <strong>in</strong>terval, so that <strong>the</strong> ga<strong>in</strong> of<br />
nonl<strong>in</strong>ear energy is ∆E4 = |φ| 4∆x/2 = |φ| 2∆n/2. For this case, <strong>the</strong> energy<br />
balance gives |φ| = �<br />
2(ω+ − ω0) as an upper estimate of <strong>the</strong> peak height.<br />
If <strong>the</strong> particles <strong>in</strong>put by <strong>the</strong> driv<strong>in</strong>g force has an average ω0 ≈ 0.2 <strong>and</strong> <strong>the</strong><br />
particle output occurs at ω+ ≈ 1.5, we expect a peak height between |φ| ≈ 1.1<br />
<strong>and</strong> |φ| ≈ 1.6, compared to <strong>the</strong> numerical result |φ| ≈ 1.4.<br />
5 Conclusions<br />
We have studied <strong>the</strong> fluxes of energy <strong>and</strong> particles <strong>in</strong> a onedimensional turbulent<br />
system, <strong>the</strong> focus<strong>in</strong>g <strong>Majda</strong>-McLaughl<strong>in</strong>-<strong>Tabak</strong> equation. These fluxes<br />
reveal details about <strong>the</strong> statistically stationary state that cannot be observed<br />
directly <strong>in</strong> <strong>the</strong> conserved quantities, such as <strong>the</strong> spectrum of particles nk<br />
(Fig.2). Fluxes <strong>in</strong> frequency space (Figs.4,6) have sources <strong>and</strong> s<strong>in</strong>ks that are<br />
determ<strong>in</strong>ed by <strong>the</strong> external driv<strong>in</strong>g <strong>and</strong> damp<strong>in</strong>g. Fluxes <strong>in</strong> amplitude space<br />
(Fig.8) emerge spontaneously when <strong>the</strong> total particle <strong>in</strong>put rate exceeds a<br />
threshold (Fig.5).<br />
We have found two types of nonequilibria with similar spectra (Fig.2(a)), but<br />
very different energy fluxes. The nonequilibrium state for sufficiently weak<br />
driv<strong>in</strong>g is very similar to <strong>the</strong> weakly turbulent Zakharov solution. The average<br />
amplitude is small, with an exponentially decreas<strong>in</strong>g probability for higher<br />
amplitudes (Fig.2(b)). Nonl<strong>in</strong>earity only plays a role as a weak coupl<strong>in</strong>g between<br />
<strong>the</strong> dispersive waves, <strong>and</strong> no high-amplitude structures emerge. Particles<br />
that are <strong>in</strong>jected at <strong>the</strong> driv<strong>in</strong>g scale flow toward <strong>the</strong> s<strong>in</strong>ks both at high <strong>and</strong><br />
at low wavenumbers (Fig.4(a)). We <strong>in</strong>terpret <strong>the</strong> well-known quantities [1] Qω<br />
<strong>and</strong> K (Fig.4(b)) as energy drift <strong>and</strong> energy transfer. In particular, K transfers<br />
energy that is released <strong>in</strong> <strong>the</strong> <strong>in</strong>verse cascade to <strong>the</strong> direct cascade, where<br />
it is is absorbed. The fluxes <strong>in</strong>crease slightly faster with <strong>the</strong> particle density<br />
(Fig.5(a)) than predicted by <strong>the</strong> <strong>the</strong>ory of weak <strong>turbulence</strong>.<br />
For stronger driv<strong>in</strong>g forces, high amplitude structures emerge <strong>in</strong>termittently,<br />
20
<strong>and</strong> <strong>the</strong> <strong>in</strong>teraction becomes strongly nonl<strong>in</strong>ear. The energy balance changes<br />
<strong>in</strong> two ways: Firstly, more coupl<strong>in</strong>g energy is dissipated by <strong>the</strong> damp<strong>in</strong>g than<br />
supplied by <strong>the</strong> driv<strong>in</strong>g force. This leads to a negative energy flux P <strong>and</strong> energy<br />
transfer K for high frequencies (Fig.6(b)). Secondly, damp<strong>in</strong>g <strong>and</strong> driv<strong>in</strong>g<br />
provide a net surplus of nonl<strong>in</strong>ear energy E4, which is due to <strong>the</strong> dissipation of<br />
particles at high amplitudes (Figs.7,8(b)). This is related to fluxes of particles<br />
<strong>and</strong> energy <strong>in</strong> amplitude space (Fig.8). There is a net particle flux from low<br />
amplitudes, where <strong>the</strong> driv<strong>in</strong>g force <strong>in</strong>jects particles, toward high amplitudes,<br />
where particles are removed by <strong>the</strong> dissipation (Fig.8(a)). The dissipation of<br />
particles at <strong>the</strong> tip of high-amplitude structures is <strong>the</strong> source of an energy flux<br />
from high amplitudes to low amplitudes, where coupl<strong>in</strong>g energy is dissipated<br />
(Fig.8(c)).<br />
While driv<strong>in</strong>g <strong>and</strong> damp<strong>in</strong>g cause a permanent net <strong>in</strong>put of E4 <strong>and</strong> an equal<br />
net output of E2, both <strong>the</strong> coupl<strong>in</strong>g energy <strong>and</strong> <strong>the</strong> nonl<strong>in</strong>ear energy are<br />
constant with only small fluctuations (Fig.9(b). This is possible because <strong>the</strong><br />
Hamiltonian dynamics transforms nonl<strong>in</strong>ear energy <strong>in</strong>to coupl<strong>in</strong>g energy with<strong>in</strong><br />
<strong>the</strong> energy flux from high to low amplitudes (Fig.8(c)). This transformation of<br />
nonl<strong>in</strong>ear energy <strong>in</strong>to coupl<strong>in</strong>g energy occurs dur<strong>in</strong>g <strong>the</strong> blow-ups (Figs.9,10),<br />
where <strong>the</strong> coupl<strong>in</strong>g energy <strong>in</strong>creases <strong>and</strong> <strong>the</strong> nonl<strong>in</strong>ear energy decreases. Coupl<strong>in</strong>g<br />
energy can be radiated <strong>in</strong>to <strong>the</strong> surround<strong>in</strong>g low-amplitude waves, when,<br />
for example, a peak emerges out of two collid<strong>in</strong>g solitary waves [21]. A peak<br />
that decays after reach<strong>in</strong>g its maximum height can also radiate low-amplitude<br />
waves. The generation of coupl<strong>in</strong>g energy at high ω feeds <strong>the</strong> energy transfer<br />
K, that is directed toward low frequencies at high ω. The representation of<br />
energy fluxes <strong>in</strong> frequency or wavenumber space is somehow mislead<strong>in</strong>g s<strong>in</strong>ce<br />
it neglects <strong>the</strong> k-nonlocal transformation nonl<strong>in</strong>ear energy <strong>in</strong>to coupl<strong>in</strong>g energy.<br />
The nonl<strong>in</strong>ear energy E4 is related to high-amplitude coherent structures,<br />
while <strong>the</strong> coupl<strong>in</strong>g energy E2 has contributions both from <strong>the</strong>se peaks <strong>and</strong><br />
from low-amplitude fluctuations. The advantage of study<strong>in</strong>g <strong>the</strong>se two quantities<br />
(<strong>and</strong> not peaks <strong>and</strong> fluctuations) is that <strong>the</strong>ir fluxes are measurable statistical<br />
quantities that dist<strong>in</strong>guish weakly turbulent <strong>and</strong> coherent processes.<br />
The fluxes <strong>in</strong> wavenumber or frequency space <strong>and</strong> <strong>in</strong> amplitude space may be<br />
seen as two projections of <strong>the</strong> complex highdimensional transport process. In<br />
wavenumber space, driv<strong>in</strong>g <strong>and</strong> damp<strong>in</strong>g is related to localized sources <strong>and</strong><br />
s<strong>in</strong>ks of <strong>the</strong> fluxes. The fluxes yield <strong>the</strong> boundary conditions for <strong>the</strong> nonequilibrium<br />
<strong>in</strong> <strong>the</strong> <strong>in</strong>ertial range. This is appropriate for <strong>the</strong> pure weakly turbulent<br />
process, where <strong>the</strong> statistics is almost Gaussian <strong>and</strong> higher order correlations<br />
can be reduced to two-po<strong>in</strong>t functions. If <strong>the</strong> statistics is non-Gaussian, <strong>the</strong> external<br />
forces <strong>in</strong>ject energy to <strong>the</strong> nonl<strong>in</strong>ear part of <strong>the</strong> Hamiltonian E4 (i.e. <strong>the</strong><br />
four-po<strong>in</strong>t correlation) <strong>and</strong> remove energy from E2, <strong>the</strong> two-po<strong>in</strong>t correlation.<br />
The Hamiltonian dynamics is characterized by <strong>the</strong> transformation of energy<br />
E4 <strong>in</strong>to E2, which is actually <strong>the</strong> transfer of a conserved quantity between<br />
correlations of different order. The representation <strong>in</strong> amplitude space covers<br />
this spontaneous coherent process, which appears as an energy flux from high<br />
21
amplitudes to low amplitudes. The representations <strong>in</strong> wavenumber space <strong>and</strong><br />
<strong>in</strong> amplitude space toge<strong>the</strong>r cover <strong>the</strong> energetics of this process. The many<br />
open questions on <strong>the</strong> energy transfer from E4 to E2 concern, <strong>in</strong> particular,<br />
<strong>the</strong> onset of this coherent behavior. Also, <strong>the</strong> effect of <strong>the</strong> coherent structures<br />
on <strong>the</strong> low-amplitude process by radiation is not well understood.<br />
References<br />
[1] V.E.Zakharov, V.Lvov, G.Falkovich, Kolmogorov spectra of <strong>turbulence</strong>,<br />
Spr<strong>in</strong>ger-Verlag, Berl<strong>in</strong>, 1992<br />
[2] L.Biven, S.V.Nazarenko,A.C.Newell, Phys.Lett.A 280 (2001) 28-32<br />
A.C.Newell, S.V.Nazarenko, L.Biven, Physica D 152-153 (2001) 520-550<br />
[3] N.E.Kosmatov, V.F.Shvets, <strong>and</strong> V.E.Zakharov, Physica D 52 (1991) 16-35<br />
[4] S.Dyachenko, A.C.Newell, A.Pushkarev, V.E. Zakharov, Physica D 57 (1992)<br />
96-160<br />
[5] B.Rumpf <strong>and</strong> A.C.Newell, Phys. Rev. Lett. 87 (2001) 054102<br />
B.Rumpf <strong>and</strong> A.C.Newell, Physica D 184 (2003) 162<br />
[6] S.L.Musher, A.M.Rubenchik, V.E.Zakharov, Phys.Rep.252 (1995) 177-274<br />
[7] E.Henry, P.Alstrom, M.T.Lev<strong>in</strong>sen, Europhys.Lett.52 (2000) 27-32<br />
[8] A.I.Dyachenko, A.O. Korotkevich, V.E.Zakharov, Phys.Rev.Lett.92 (2004)<br />
134501<br />
Y.V.Lvov, E.G.<strong>Tabak</strong>, Phys.Rev.Lett.87 (2001) 168501<br />
[9] S.Galtier, S.V.Nazarenko, A.C.Newell, A Pouquet, J.Plasma Phys. 63 (2000)<br />
447-488<br />
S.Galtier, S.V.Nazarenko, A.C.Newell, Physica D 152-153 (2001) 646-652<br />
[10] Y.Lvov, S.Nazarenko, R.West, Physica D 184 (2003) 333-351<br />
C.Josser<strong>and</strong>, C.R.Physique 5 (2004) 77-90<br />
[11] V.E.Zakharov, Zh.Eksp.Teor.Fiz.62 (1972) 1745-1759 (Sov.Phys.JETP 35<br />
(1972) 908-914)<br />
[12] P.L.Kelley, Phys.Rev.Lett.15 (1965) 1005-1008<br />
E.Garmire, R.Y.Chiao, C.H.Townes, Phys.Rev.Lett.16 (1966) 347-349,<br />
V.E.Zakharov, V.V.Sobolev, V.C.Synakh, Zh.Eks.Teor.Fiz.60 (1971) 136-145<br />
(Sov.Phys.JETP 33 (1971) 77-81)<br />
[13] P.G.Saffman, J.Fluid Mech.27 (1967) 581-593<br />
[14] B.Rumpf <strong>and</strong> A.C.Newell, Phy. Rev.E 69 (2004) 026306<br />
[15] A.J.<strong>Majda</strong>, D.W.McLaughl<strong>in</strong>, E.G.<strong>Tabak</strong>, J.Nonl<strong>in</strong>ear Sci. 6, (1997) 9-44<br />
22
[16] D.Cai, D.W.McLaughl<strong>in</strong>, Physica D 152-153 (2001) 551-572<br />
J.Math.Phys.41 (2000) 4125-4153 D.Cai, A.J.<strong>Majda</strong>, D.W.McLaughl<strong>in</strong>,<br />
E.G.<strong>Tabak</strong>, PNAS 96 (1999) 14216-14221<br />
[17] V.E.Zakharov, P.Guyenne, A.N.Pushkarev, F.Dias, Physica D 152-153 (2001)<br />
573-619<br />
[18] V.Zakharov, F. Dias, A. Pushkarev, Physics Reports 398 (2004) 1-65<br />
[19] J.Spanier, K.B.Oldham, The Fractional calculus: Integrations <strong>and</strong><br />
Differentiations of Arbitrary Order, Academic Press, New York (1974)<br />
[20] B.Rumpf, Phys. Rev. E 69 (2004) 016618<br />
B.Rumpf, Phys. Rev. E 70 (2004) 016609<br />
[21] S.Dyachenko, V.E.Zakharov, A.N.Pushkarev, V.F.Shvets, V.V.Yankov, Zh.<br />
Eksp. Teor. Fiz.96 (1989) 2026-2032 (Sov. Phys. JETP 69 (1989) 1144-1147)<br />
23