development of an in vitro screening model for the biosynthesis of ...
development of an in vitro screening model for the biosynthesis of ...
development of an in vitro screening model for the biosynthesis of ...

You also want an ePaper? Increase the reach of your titles
YUMPU automatically turns print PDFs into web optimized ePapers that Google loves.
TABLE 1<br />
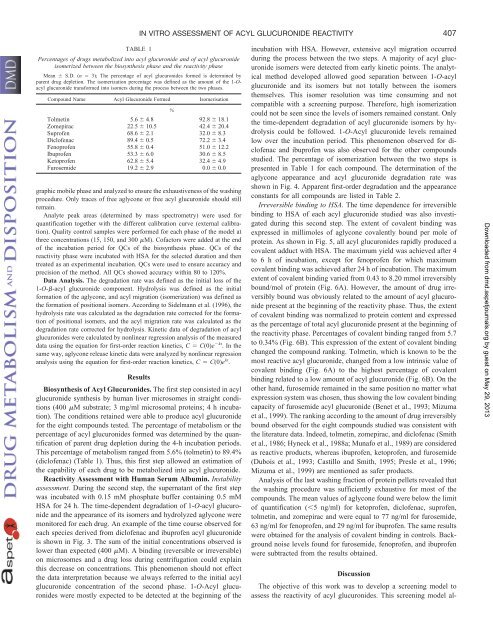
Percentages <strong>of</strong> drugs metabolized <strong>in</strong>to acyl glucuronide <strong>an</strong>d <strong>of</strong> acyl glucuronide<br />
isomerized between <strong>the</strong> biosyn<strong>the</strong>sis phase <strong>an</strong>d <strong>the</strong> reactivity phase<br />
Me<strong>an</strong> S.D. (n 3); The percentage <strong>of</strong> acyl glucuronides <strong>for</strong>med is determ<strong>in</strong>ed by<br />
parent drug depletion. The isomerization percentage was def<strong>in</strong>ed as <strong>the</strong> amount <strong>of</strong> <strong>the</strong> 1-Oacyl<br />
glucuronide tr<strong>an</strong>s<strong>for</strong>med <strong>in</strong>to isomers dur<strong>in</strong>g <strong>the</strong> process between <strong>the</strong> two phases.<br />
Compound Name Acyl Glucuronide Formed Isomerisation<br />
%<br />
Tolmet<strong>in</strong> 5.6 4.8 92.8 18.1<br />
Zomepirac 22.5 10.5 42.4 20.4<br />
Supr<strong>of</strong>en 68.6 2.1 32.0 8.3<br />
Dicl<strong>of</strong>enac 89.4 0.5 72.2 3.4<br />
Fenopr<strong>of</strong>en 55.8 0.4 51.0 12.2<br />
Ibupr<strong>of</strong>en 53.3 6.0 30.6 8.5<br />
Ketopr<strong>of</strong>en 62.8 5.4 32.4 4.9<br />
Furosemide 19.2 2.9 0.0 0.0<br />
graphic mobile phase <strong>an</strong>d <strong>an</strong>alyzed to ensure <strong>the</strong> exhaustiveness <strong>of</strong> <strong>the</strong> wash<strong>in</strong>g<br />
procedure. Only traces <strong>of</strong> free aglycone or free acyl glucuronide should still<br />
rema<strong>in</strong>.<br />
Analyte peak areas (determ<strong>in</strong>ed by mass spectrometry) were used <strong>for</strong><br />
qu<strong>an</strong>tification toge<strong>the</strong>r with <strong>the</strong> different calibration curve (external calibration).<br />
Quality control samples were per<strong>for</strong>med <strong>for</strong> each phase <strong>of</strong> <strong>the</strong> <strong>model</strong> at<br />
three concentrations (15, 150, <strong>an</strong>d 300 M). C<strong>of</strong>actors were added at <strong>the</strong> end<br />
<strong>of</strong> <strong>the</strong> <strong>in</strong>cubation period <strong>for</strong> QCs <strong>of</strong> <strong>the</strong> biosyn<strong>the</strong>sis phase. QCs <strong>of</strong> <strong>the</strong><br />
reactivity phase were <strong>in</strong>cubated with HSA <strong>for</strong> <strong>the</strong> selected duration <strong>an</strong>d <strong>the</strong>n<br />
treated as <strong>an</strong> experimental <strong>in</strong>cubation. QCs were used to ensure accuracy <strong>an</strong>d<br />
precision <strong>of</strong> <strong>the</strong> method. All QCs showed accuracy with<strong>in</strong> 80 to 120%.<br />
Data Analysis. The degradation rate was def<strong>in</strong>ed as <strong>the</strong> <strong>in</strong>itial loss <strong>of</strong> <strong>the</strong><br />
1-O--acyl glucuronide component. Hydrolysis was def<strong>in</strong>ed as <strong>the</strong> <strong>in</strong>itial<br />
<strong>for</strong>mation <strong>of</strong> <strong>the</strong> aglycone, <strong>an</strong>d acyl migration (isomerization) was def<strong>in</strong>ed as<br />
<strong>the</strong> <strong>for</strong>mation <strong>of</strong> positional isomers. Accord<strong>in</strong>g to Sidelm<strong>an</strong>n et al. (1996), <strong>the</strong><br />
hydrolysis rate was calculated as <strong>the</strong> degradation rate corrected <strong>for</strong> <strong>the</strong> <strong>for</strong>mation<br />
<strong>of</strong> positional isomers, <strong>an</strong>d <strong>the</strong> acyl migration rate was calculated as <strong>the</strong><br />
degradation rate corrected <strong>for</strong> hydrolysis. K<strong>in</strong>etic data <strong>of</strong> degradation <strong>of</strong> acyl<br />
glucuronides were calculated by nonl<strong>in</strong>ear regression <strong>an</strong>alysis <strong>of</strong> <strong>the</strong> measured<br />
data us<strong>in</strong>g <strong>the</strong> equation <strong>for</strong> first-order reaction k<strong>in</strong>etics, C C(0)e kt .In<strong>the</strong><br />
same way, aglycone release k<strong>in</strong>etic data were <strong>an</strong>alyzed by nonl<strong>in</strong>ear regression<br />
<strong>an</strong>alysis us<strong>in</strong>g <strong>the</strong> equation <strong>for</strong> first-order reaction k<strong>in</strong>etics, C C(0)e kt .<br />
Results<br />
Biosyn<strong>the</strong>sis <strong>of</strong> Acyl Glucuronides. The first step consisted <strong>in</strong> acyl<br />
glucuronide syn<strong>the</strong>sis by hum<strong>an</strong> liver microsomes <strong>in</strong> straight conditions<br />
(400 M substrate; 3 mg/ml microsomal prote<strong>in</strong>s; 4 h <strong>in</strong>cubation).<br />
The conditions reta<strong>in</strong>ed were able to produce acyl glucuronide<br />
<strong>for</strong> <strong>the</strong> eight compounds tested. The percentage <strong>of</strong> metabolism or <strong>the</strong><br />
percentage <strong>of</strong> acyl glucuronides <strong>for</strong>med was determ<strong>in</strong>ed by <strong>the</strong> qu<strong>an</strong>tification<br />
<strong>of</strong> parent drug depletion dur<strong>in</strong>g <strong>the</strong> 4-h <strong>in</strong>cubation periods.<br />
This percentage <strong>of</strong> metabolism r<strong>an</strong>ged from 5.6% (tolmet<strong>in</strong>) to 89.4%<br />
(dicl<strong>of</strong>enac) (Table 1). Thus, this first step allowed <strong>an</strong> estimation <strong>of</strong><br />
<strong>the</strong> capability <strong>of</strong> each drug to be metabolized <strong>in</strong>to acyl glucuronide.<br />
Reactivity Assessment with Hum<strong>an</strong> Serum Album<strong>in</strong>. Instability<br />
assessment. Dur<strong>in</strong>g <strong>the</strong> second step, <strong>the</strong> supernat<strong>an</strong>t <strong>of</strong> <strong>the</strong> first step<br />
was <strong>in</strong>cubated with 0.15 mM phosphate buffer conta<strong>in</strong><strong>in</strong>g 0.5 mM<br />
HSA <strong>for</strong> 24 h. The time-dependent degradation <strong>of</strong> 1-O-acyl glucuronide<br />
<strong>an</strong>d <strong>the</strong> appear<strong>an</strong>ce <strong>of</strong> its isomers <strong>an</strong>d hydrolyzed aglycone were<br />
monitored <strong>for</strong> each drug. An example <strong>of</strong> <strong>the</strong> time course observed <strong>for</strong><br />
each species derived from dicl<strong>of</strong>enac <strong>an</strong>d ibupr<strong>of</strong>en acyl glucuronide<br />
is shown <strong>in</strong> Fig. 3. The sum <strong>of</strong> <strong>the</strong> <strong>in</strong>itial concentrations observed is<br />
lower th<strong>an</strong> expected (400 M). A b<strong>in</strong>d<strong>in</strong>g (reversible or irreversible)<br />
on microsomes <strong>an</strong>d a drug loss dur<strong>in</strong>g centrifugation could expla<strong>in</strong><br />
this decrease on concentrations. This phenomenon should not effect<br />
<strong>the</strong> data <strong>in</strong>terpretation because we always referred to <strong>the</strong> <strong>in</strong>itial acyl<br />
glucuronide concentration <strong>of</strong> <strong>the</strong> second phase. 1-O-Acyl glucuronides<br />
were mostly expected to be detected at <strong>the</strong> beg<strong>in</strong>n<strong>in</strong>g <strong>of</strong> <strong>the</strong><br />
IN VITRO ASSESSMENT OF ACYL GLUCURONIDE REACTIVITY<br />
407<br />
<strong>in</strong>cubation with HSA. However, extensive acyl migration occurred<br />
dur<strong>in</strong>g <strong>the</strong> process between <strong>the</strong> two steps. A majority <strong>of</strong> acyl glucuronide<br />
isomers were detected from early k<strong>in</strong>etic po<strong>in</strong>ts. The <strong>an</strong>alytical<br />
method developed allowed good separation between 1-O-acyl<br />
glucuronide <strong>an</strong>d its isomers but not totally between <strong>the</strong> isomers<br />
<strong>the</strong>mselves. This isomer resolution was time consum<strong>in</strong>g <strong>an</strong>d not<br />
compatible with a screen<strong>in</strong>g purpose. There<strong>for</strong>e, high isomerization<br />
could not be seen s<strong>in</strong>ce <strong>the</strong> levels <strong>of</strong> isomers rema<strong>in</strong>ed const<strong>an</strong>t. Only<br />
<strong>the</strong> time-dependent degradation <strong>of</strong> acyl glucuronide isomers by hydrolysis<br />
could be followed. 1-O-Acyl glucuronide levels rema<strong>in</strong>ed<br />
low over <strong>the</strong> <strong>in</strong>cubation period. This phenomenon observed <strong>for</strong> dicl<strong>of</strong>enac<br />
<strong>an</strong>d ibupr<strong>of</strong>en was also observed <strong>for</strong> <strong>the</strong> o<strong>the</strong>r compounds<br />
studied. The percentage <strong>of</strong> isomerization between <strong>the</strong> two steps is<br />
presented <strong>in</strong> Table 1 <strong>for</strong> each compound. The determ<strong>in</strong>ation <strong>of</strong> <strong>the</strong><br />
aglycone appear<strong>an</strong>ce <strong>an</strong>d acyl glucuronide degradation rate was<br />
shown <strong>in</strong> Fig. 4. Apparent first-order degradation <strong>an</strong>d <strong>the</strong> appear<strong>an</strong>ce<br />
const<strong>an</strong>ts <strong>for</strong> all compounds are listed <strong>in</strong> Table 2.<br />
Irreversible b<strong>in</strong>d<strong>in</strong>g to HSA. The time dependence <strong>for</strong> irreversible<br />
b<strong>in</strong>d<strong>in</strong>g to HSA <strong>of</strong> each acyl glucuronide studied was also <strong>in</strong>vestigated<br />
dur<strong>in</strong>g this second step. The extent <strong>of</strong> covalent b<strong>in</strong>d<strong>in</strong>g was<br />
expressed <strong>in</strong> millimoles <strong>of</strong> aglycone covalently bound per mole <strong>of</strong><br />
prote<strong>in</strong>. As shown <strong>in</strong> Fig. 5, all acyl glucuronides rapidly produced a<br />
covalent adduct with HSA. The maximum yield was achieved after 4<br />
to 6 h <strong>of</strong> <strong>in</strong>cubation, except <strong>for</strong> fenopr<strong>of</strong>en <strong>for</strong> which maximum<br />
covalent b<strong>in</strong>d<strong>in</strong>g was achieved after 24 h <strong>of</strong> <strong>in</strong>cubation. The maximum<br />
extent <strong>of</strong> covalent b<strong>in</strong>d<strong>in</strong>g varied from 0.43 to 8.20 mmol irreversibly<br />
bound/mol <strong>of</strong> prote<strong>in</strong> (Fig. 6A). However, <strong>the</strong> amount <strong>of</strong> drug irreversibly<br />
bound was obviously related to <strong>the</strong> amount <strong>of</strong> acyl glucuronide<br />
present at <strong>the</strong> beg<strong>in</strong>n<strong>in</strong>g <strong>of</strong> <strong>the</strong> reactivity phase. Thus, <strong>the</strong> extent<br />
<strong>of</strong> covalent b<strong>in</strong>d<strong>in</strong>g was normalized to prote<strong>in</strong> content <strong>an</strong>d expressed<br />
as <strong>the</strong> percentage <strong>of</strong> total acyl glucuronide present at <strong>the</strong> beg<strong>in</strong>n<strong>in</strong>g <strong>of</strong><br />
<strong>the</strong> reactivity phase. Percentages <strong>of</strong> covalent b<strong>in</strong>d<strong>in</strong>g r<strong>an</strong>ged from 5.7<br />
to 0.34% (Fig. 6B). This expression <strong>of</strong> <strong>the</strong> extent <strong>of</strong> covalent b<strong>in</strong>d<strong>in</strong>g<br />
ch<strong>an</strong>ged <strong>the</strong> compound r<strong>an</strong>k<strong>in</strong>g. Tolmet<strong>in</strong>, which is known to be <strong>the</strong><br />
most reactive acyl glucuronide, ch<strong>an</strong>ged from a low <strong>in</strong>tr<strong>in</strong>sic value <strong>of</strong><br />
covalent b<strong>in</strong>d<strong>in</strong>g (Fig. 6A) to <strong>the</strong> highest percentage <strong>of</strong> covalent<br />
b<strong>in</strong>d<strong>in</strong>g related to a low amount <strong>of</strong> acyl glucuronide (Fig. 6B). On <strong>the</strong><br />
o<strong>the</strong>r h<strong>an</strong>d, furosemide rema<strong>in</strong>ed <strong>in</strong> <strong>the</strong> same position no matter what<br />
expression system was chosen, thus show<strong>in</strong>g <strong>the</strong> low covalent b<strong>in</strong>d<strong>in</strong>g<br />
capacity <strong>of</strong> furosemide acyl glucuronide (Benet et al., 1993; Mizuma<br />
et al., 1999). The r<strong>an</strong>k<strong>in</strong>g accord<strong>in</strong>g to <strong>the</strong> amount <strong>of</strong> drug irreversibly<br />
bound observed <strong>for</strong> <strong>the</strong> eight compounds studied was consistent with<br />
<strong>the</strong> literature data. Indeed, tolmet<strong>in</strong>, zomepirac, <strong>an</strong>d dicl<strong>of</strong>enac (Smith<br />
et al., 1986; Hyneck et al., 1988a; Munafo et al., 1989) are considered<br />
as reactive products, whereas ibupr<strong>of</strong>en, ketopr<strong>of</strong>en, <strong>an</strong>d furosemide<br />
(Dubois et al., 1993; Castillo <strong>an</strong>d Smith, 1995; Presle et al., 1996;<br />
Mizuma et al., 1999) are mentioned as safer products.<br />
Analysis <strong>of</strong> <strong>the</strong> last wash<strong>in</strong>g fraction <strong>of</strong> prote<strong>in</strong> pellets revealed that<br />
<strong>the</strong> wash<strong>in</strong>g procedure was sufficiently exhaustive <strong>for</strong> most <strong>of</strong> <strong>the</strong><br />
compounds. The me<strong>an</strong> values <strong>of</strong> aglycone found were below <strong>the</strong> limit<br />
<strong>of</strong> qu<strong>an</strong>tification (5 ng/ml) <strong>for</strong> ketopr<strong>of</strong>en, dicl<strong>of</strong>enac, supr<strong>of</strong>en,<br />
tolmet<strong>in</strong>, <strong>an</strong>d zomepirac <strong>an</strong>d were equal to 77 ng/ml <strong>for</strong> furosemide,<br />
63 ng/ml <strong>for</strong> fenopr<strong>of</strong>en, <strong>an</strong>d 29 ng/ml <strong>for</strong> ibupr<strong>of</strong>en. The same results<br />
were obta<strong>in</strong>ed <strong>for</strong> <strong>the</strong> <strong>an</strong>alysis <strong>of</strong> covalent b<strong>in</strong>d<strong>in</strong>g <strong>in</strong> controls. Background<br />
noise levels found <strong>for</strong> furosemide, fenopr<strong>of</strong>en, <strong>an</strong>d ibupr<strong>of</strong>en<br />
were subtracted from <strong>the</strong> results obta<strong>in</strong>ed.<br />
Discussion<br />
The objective <strong>of</strong> this work was to develop a screen<strong>in</strong>g <strong>model</strong> to<br />
assess <strong>the</strong> reactivity <strong>of</strong> acyl glucuronides. This screen<strong>in</strong>g <strong>model</strong> al-<br />
Downloaded from<br />
dmd.aspetjournals.org by guest on May 29, 2013