Experiment 3: The Rovibrational Spectrum of HCl
Experiment 3: The Rovibrational Spectrum of HCl
Experiment 3: The Rovibrational Spectrum of HCl

You also want an ePaper? Increase the reach of your titles
YUMPU automatically turns print PDFs into web optimized ePapers that Google loves.
Varberg and Kuwata Chemistry 312 Spring 2008<br />
<strong>Experiment</strong> 3: <strong>The</strong> <strong>Rovibrational</strong> <strong>Spectrum</strong> <strong>of</strong> <strong>HCl</strong><br />
(was <strong>Experiment</strong> 4 in the syllabus, but the original <strong>Experiment</strong> 3 was canceled)<br />
Meet for lab on Thursday, April 10, 10:00 a.m., Olin-Rice 386<br />
Report due on Thursday, April 24 (note change from syllabus)<br />
Logistical Basics for Chemistry 312 Lab Work:<br />
• You are not required to keep a notebook.<br />
• You will follow the five Macalester Chemistry cardinal lab safety rules:<br />
1. Always wear goggles whenever you are inside a “wet” or “instrumental” lab.<br />
2. Always wear shoes that cover your feet.<br />
3. Never consume any food or drink in the lab.<br />
4. Always wash your hands whenever you leave the lab.<br />
5. Never work alone in a “wet” or “instrumental” lab, even when “just” using an<br />
instrument.<br />
• Each group will turn in one lab report, and all <strong>of</strong> the members <strong>of</strong> a group will share the<br />
same grade for each lab.<br />
Introduction<br />
In this laboratory, you will record the infrared spectra <strong>of</strong> two <strong>HCl</strong> isotopomers, H 35 Cl and H 37 Cl.<br />
Since the <strong>HCl</strong> is in its gaseous state, where it can freely rotate, this vibrational spectrum will also<br />
contain resolved rotational structure. Such a spectrum is called a rovibrational spectrum. You<br />
will assign quantum numbers to each transition in your spectra and fit an equation to the<br />
measured frequencies to determine values for the principal molecular constants.<br />
<strong>The</strong> energy levels <strong>of</strong> a rotating diatomic molecule in its ground and first excited vibrational states<br />
are given by the equations<br />
v = 1: F'(J) = ~υ 0 + B'J(J + 1) – D'J 2 (J + 1) 2 [1]<br />
v = 0: F"(J) = B"J(J + 1) – D"J 2 (J + 1) 2 [2]<br />
<strong>The</strong> symbols F' and F" (the “rovibrational terms”) signify the energies <strong>of</strong> the upper and lower<br />
energy levels expressed in cm –1 . By convention, spectroscopists use a single prime for quantities<br />
relating to the upper state in a transition, and a double prime (or no prime) for quantities relating<br />
to the lower state. <strong>The</strong> symbol B is the rotational constant, and D is the centrifugal distortion<br />
constant, which takes into account the effects <strong>of</strong> the molecule's vibration on the rotational energy<br />
levels. Note that each vibrational state has its own rotational constant.<br />
<strong>The</strong> selection rules for the rovibrational spectrum <strong>of</strong> <strong>HCl</strong> are ∆v = ±1 and ∆J = ±1. (Overtone<br />
bands, which are bands with ∆v = ±2, ±3, …, are allowed, but are much weaker than the<br />
fundamental band. A general rule <strong>of</strong> thumb is that each successive higher overtone band is a<br />
factor <strong>of</strong> 10 weaker than the previous one.) With these selection rules, the infrared spectrum <strong>of</strong><br />
<strong>HCl</strong> near 2875 cm –1 consists <strong>of</strong> an R “branch” (or set <strong>of</strong> peaks) with ∆J = J' – J" = +1, and a P<br />
Page 1 <strong>of</strong> 5
Varberg and Kuwata Chemistry 312 Spring 2008<br />
branch with ∆J = –1. You will observe absorption only from the ground vibrational level (v = 0)<br />
to the first excited vibrational level (v = 1), because the v = 0 level is the only one significantly<br />
populated at room temperature. Such a band is called a cold band; hot bands originate from<br />
excited vibrational levels <strong>of</strong> the molecule. You will observe both the H 35 Cl and H 37 Cl species in<br />
the 2875 cm –1 region because our FTIR spectrometer has just high enough resolution to resolve<br />
them. <strong>The</strong> 35 Cl: 37 Cl natural abundance ratio is 76:24, so the H 35 Cl will be noticeably stronger.<br />
Since the two Cl isotopomers act like distinct molecules (quantum mechanically speaking), you<br />
will fit their spectra separately.<br />
If we use Eqns. [1] and [2] to determine the energies <strong>of</strong> the generic transitions R(J – 1) and P(J),<br />
we obtain the general expressions<br />
R(J – 1) = F'(J) – F"(J – 1)<br />
= ~υ 0 + (B' + B")J + (B' – B" – D' + D")J 2 + (–2D' – 2D")J 3 + (–D' + D")J 4<br />
P(J) = F'(J – 1) – F"(J)<br />
= ~υ 0 + (–B' – B")J + (B' – B" – D' + D")J 2 + (2D' + 2D")J 3 + (–D' + D")J 4<br />
From the form <strong>of</strong> the above two equations, it is possible to fit an identical equation to both<br />
branches, namely<br />
υ ~ = ~υ 0 + (B' + B")m + (B' – B" – D' + D")m 2 + (–2D' – 2D")m 3 + (–D' + D")m 4 [3]<br />
where m is an integer called the line number that takes the values 1, 2, 3, ... for the R(J) branch<br />
(that is, m = J + 1) and the values –1, –2, –3, ... for the P(J) branch (that is, m = –J).<br />
This is the strategy you should employ. Fit Eqn. [3] to your experimental measurements <strong>of</strong> the<br />
transition frequencies to derive values for the five constants ~υ 0 , B', B", D', and D". Fit each <strong>of</strong><br />
the two isotopomers separately using Excel. Record a minimum <strong>of</strong> six significant figures for<br />
your fitted constants. In Excel, this means that you should select the fitted quartic (or fourth<br />
order) equation in x, then choose Selected Data Labels… under the Format menu, and change the<br />
Number formatting to Scientific notation with at least six significant figures. Using a little<br />
algebra, you will be able to find values for the physically significant constants in Eqn. [3] from<br />
the fitted values <strong>of</strong> the quartic polynomial coefficients. Pr<strong>of</strong>. Varberg and I do not recommend<br />
doing this by hand with a calculator, which is a boring and error-prone process. Type the values<br />
<strong>of</strong> the polynomial coefficients (carefully!) into separate cells and then let Excel carry out the<br />
necessary calculations.<br />
In doing this, you will have determined two values for Bv for each isotopomer <strong>of</strong> <strong>HCl</strong>, namely B0<br />
and B1 (represented by B" and B' in the equation above), the rotational constants in v = 0 and 1<br />
respectively. From these, you can determine the bond lengths in these two vibrational states<br />
using the following formula<br />
Page 2 <strong>of</strong> 5
Varberg and Kuwata Chemistry 312 Spring 2008<br />
B<br />
v<br />
h<br />
π cμR<br />
2 = [4]<br />
8<br />
where μ is the reduced mass and Rv is the bond length in the vibrational state v. For each<br />
isotopomer, you can also determine a value for Be, the equilibrium value <strong>of</strong> the rotational<br />
constant at the minimum <strong>of</strong> the potential well, using the expression<br />
2<br />
v<br />
1<br />
Bv = Be<br />
−α<br />
e v + )<br />
[5]<br />
( 2<br />
where αe is a constant for each isotopomer <strong>of</strong> <strong>HCl</strong>. From Be, you can determine values for Re,<br />
the equilibrium bond length, for each isotopomer. <strong>The</strong>se values should be the same, to within<br />
experimental error (assuming the Born-Oppenheimer approximation holds).<br />
For each isotopomer, the rotational constant, the centrifugal distortion constant, and the<br />
vibrational frequency are related by a formula derived by Kratzer. <strong>The</strong> formula holds exactly<br />
only for a molecule obeying a Morse potential energy curve, but it should work reasonably for a<br />
real diatomic molecule. Note that D0 in this expression is the centrifugal distortion constant for<br />
the v = 0 level, not the dissociation energy.<br />
4B<br />
D = [6]<br />
3<br />
0<br />
0 ~ 2<br />
υ0<br />
<strong>The</strong> force constant k <strong>of</strong> the <strong>HCl</strong> bond can be determined from the expression<br />
ν 0 = 1<br />
2π<br />
where the vibrational frequency ν0 is given in Hz.<br />
<strong>Experiment</strong>al Procedure<br />
k<br />
, [7]<br />
μ<br />
Rob Rossi, the James Brown (i.e. the hardest working man) in Olin-Rice, will have filled a gas<br />
cell with <strong>HCl</strong> and demonstrated the following instructions for operating the Chemistry<br />
Department’s Nicolet Fourier 550 Transform Infrared Spectrometer (in Olin-Rice 386):<br />
Collecting Your Data<br />
1. Turn on the monitor and printer. <strong>The</strong>n launch the program Omnic E.S.P. 5.1.<br />
2. Choose <strong>Experiment</strong> Setup… from the Collect menu. Set the number <strong>of</strong> scans you want<br />
(typically 16) and the resolution (for <strong>HCl</strong>, use the highest resolution available: 0.5 cm –1).<br />
Select Collect background before every sample. Click OK. Set the optimum aperture<br />
automatically, if it asks you to do so.<br />
Page 3 <strong>of</strong> 5
Varberg and Kuwata Chemistry 312 Spring 2008<br />
3. Unlatch and open the central door on the spectrometer and make sure no sample is mounted.<br />
Close the door. <strong>The</strong>n choose Collect Sample… from the Collect menu. Leave the default<br />
spectrum title unchanged and click OK. Click OK again to acquire the background scan.<br />
(You can monitor how many scans have been collected with the status bar at the bottom left<br />
<strong>of</strong> your window.) You should see peaks due to absorption by CO2 and H2O.<br />
4. Next, open the door, mount the sample cell filled with <strong>HCl</strong> in the beam path, close the door,<br />
and click OK to collect the sample spectrum. (<strong>The</strong> cell is stored in a plastic bucket next to<br />
the spectrometer.) Click on Yes to add the spectrum to the window. <strong>The</strong> active spectrum<br />
will appear in red. Each peak should be a doublet, with the more intense member <strong>of</strong> the<br />
doublet being due to the more abundant H- 35 Cl isotopomer.<br />
5. (You can probably skip this step.) For weak spectra it is useful to perform a baseline<br />
correction. Choose Absorbance from the Process menu, followed by Automatic Baseline<br />
Correction from the Process menu. Click and drag the right boundary marker in the View<br />
Finder (that’s the skinny spectral window at the bottom <strong>of</strong> the screen) to eliminate the strong<br />
noise peaks at low frequency. <strong>The</strong> autoscale the spectrum by choosing Full Scale from the<br />
View menu (or setting it on Automatic Full Scale). Your window will now contain two<br />
spectra: the original (inactive) spectrum in blue, and the corrected (active) spectrum in red.<br />
Select the blue spectrum by clicking on it or choosing its title in the title bar. <strong>The</strong>n delete<br />
this spectrum by choosing Clear from the Edit menu. Doing so will prevent confusion.<br />
Labeling Your Peaks<br />
6. You are now ready to characterize your spectrum. Enlarge the window to full screen. Click<br />
and drag the blue vertical boundary markers in the View Finder at the bottom <strong>of</strong> the window<br />
to select a wavenumber range <strong>of</strong> interest. Be sure not to exclude carelessly any weak lines<br />
at the edges <strong>of</strong> your spectrum.<br />
7. Choose Find Peaks… from the Analyze menu. Have some fun with the sensitivity setting<br />
(the scroll bar on the left <strong>of</strong> the window) and the threshold setting (click anywhere on the<br />
spectrum to move the threshold up and down) until you are certain that you have found all<br />
<strong>of</strong> the real peaks and none <strong>of</strong> the noise (the unattainable goal <strong>of</strong> any spectroscopist!). If you<br />
aren’t happy with the locations <strong>of</strong> the boundary markers you chose, click on the Window<br />
menu and choose Window 1—this is still displaying the original version <strong>of</strong> your spectrum.<br />
<strong>The</strong>n repeat Step 6.<br />
8. When you are satisfied that all <strong>of</strong> the relevant peaks have been labeled, click the Print button<br />
(in the upper left <strong>of</strong> the window) to print a copy <strong>of</strong> the spectrum and the peak list.<br />
9. When you are done, quit the program by selecting Exit... from the File menu. (You will<br />
likely need to click Yes twice.)<br />
10. Turn <strong>of</strong>f the printer and the monitor. Put the sample cell back in the plastic bucket.<br />
Page 4 <strong>of</strong> 5
Varberg and Kuwata Chemistry 312 Spring 2008<br />
Data Analysis<br />
1. Label the branch assignments for the H 35 Cl isotopomer on the spectrum you have printed <strong>of</strong>f.<br />
2. Assign the transitions by branch, J, and isotopomer. Note that our FTIR spectrometer plots<br />
lower energy (wave number) to the right, which is the standard Herzberg spectroscopic<br />
convention.<br />
3. Fit the transition wavenumbers (in cm –1 ) to Eqn. [3]. Report values for the five directly<br />
determinable molecular constants <strong>of</strong> each isotopomer. Include a copy <strong>of</strong> your Excel<br />
spreadsheet and the graph <strong>of</strong> υ ~ vs. m for each isotopomer in your lab report. Please organize<br />
your results for the different isotopomers in a combined table in one spreadsheet page.<br />
4. Determine the bond lengths in Å (1 Å = 10 –10 m) in these vibrational states using Eqn. [4].<br />
Does the bond length shorten or lengthen upon vibrational excitation? Explain this behavior.<br />
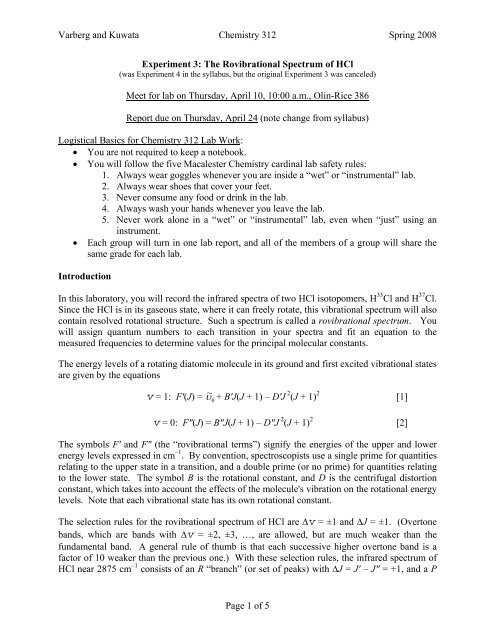
Note: To do this calculation properly, you must use precise<br />
atomic masses for the various isotopes good to at least six digits<br />
as well as similarly precise values for the fundamental constants.<br />
Your textbook lists isotopic masses in the Appendix, but<br />
unfortunately the values given are not all correct. Please consult<br />
the table to the right for the values you need. Furthermore, the<br />
value given for the speed <strong>of</strong> light inside the front cover <strong>of</strong> your<br />
textbook has a typographical error in the seventh digit—the<br />
correct value is c = 2.99792458 × 10 8 m s –1 .<br />
5. Calculate equilibrium values for the rotational constant Be, the constant αe, and the bond<br />
length Re from Eqns. [4] and [5]. Compare and comment on the values for the equilibrium<br />
bond lengths <strong>of</strong> the two isotopomers. Also compare your results for H 35 Cl with the<br />
“literature” values given by Atkins/de Paula (Table 13.2 in the Data Section).<br />
6. Test the Kratzer relation, Eqn. [6], for the two isotopomers. Comment on your results.<br />
7. Calculate the force constant in N/m for the two isotopomers from Eqn. [7], again comparing<br />
your results with those given in Atkins/de Paula, Data Section Table 13.2. Can you <strong>of</strong>fer a<br />
possible explanation for any disagreement between your value and the literature value?<br />
Would you expect the force constants <strong>of</strong> the isotopomers to be equal to each other?<br />
Final Product<br />
You will write a paper with the same sections (Title, Your Names, Abstract, Introduction,<br />
Procedure, Results and Discussion, Conclusions, References, Appendix) as your Chemistry 311<br />
written lab reports. However, note that your Procedure should be extremely short (two to three<br />
sentences will suffice). <strong>The</strong> focus <strong>of</strong> your paper should be addressing the questions posed in the<br />
Data Analysis section <strong>of</strong> the instructions.<br />
Page 5 <strong>of</strong> 5<br />
Isotope Mass (in u)<br />
1 H 1.007825<br />
2 H 2.014102<br />
35 Cl 34.968853<br />
37 Cl 36.965903