WISC-IV with WIAT-II Writer Interpretive Sample Report - Pearson ...
WISC-IV with WIAT-II Writer Interpretive Sample Report - Pearson ...
WISC-IV with WIAT-II Writer Interpretive Sample Report - Pearson ...

You also want an ePaper? Increase the reach of your titles
YUMPU automatically turns print PDFs into web optimized ePapers that Google loves.
BACK<br />
TO<br />
MENU<br />
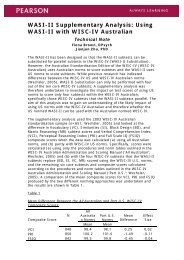
Tables and Graphs <strong>Report</strong> for <strong>WISC</strong>-<strong>IV</strong> and <strong>WIAT</strong>-<strong>II</strong><br />
Composite Score Differences<br />
Scaled Scaled<br />
Critical<br />
Sig.<br />
Diff. Base<br />
Discrepancy Comparisons<br />
Score 1 Score 2 Diff. Value Y/N Rate<br />
VCI - PRI 112 92 20 11 Y 6.1%<br />
VCI - WMI 112 102 10 11.38 N 22.9%<br />
VCI - PSI 112 91 21 12.12 Y 9.7%<br />
PRI - WMI 92 102 -10 11.38 N 24.5%<br />
PRI - PSI 92 91 1 12.12 N 49.3%<br />
WMI - PSI<br />
Base Rate by Overall <strong>Sample</strong><br />
102 91 11 12.46 N 24.1%<br />
Statistical Significance (Critical Values) at the .05 level<br />
Subtest Score Differences<br />
Scaled Scaled<br />
Critical<br />
Sig.<br />
Diff. Base<br />
Discrepancy Comparisons<br />
Score 1 Score 2 Diff. Value Y/N Rate<br />
Digit Span - Letter-Number Sequencing 10 11 -1 2.83 N 47.1%<br />
Coding - Symbol Search 9 8 1 3.55 N 40.2%<br />
Similarities - Picture Concepts 12 8 4 3.36 Y 13.0%<br />
Digit Span - Arithmetic 10 10 0 2.94 N<br />
Letter-Number Sequencing - Arithmetic 11 10 1 2.80 N 44.4%<br />
Coding - Cancellation 9 9 0 3.58 N<br />
Symbol Search - Cancellation 8 9 -1 3.80 N 43.0%<br />
Statistical Significance (Critical Values) at the .05 level<br />
Differences between Subtest and Mean of Subtest Scores<br />
Subtest<br />
Scaled<br />
Mean<br />
Scaled<br />
Diff.<br />
from<br />
Critical<br />
Base<br />
Subtest<br />
Score Score Mean Value S/W Rate<br />
Block Design 9 8.67 0.33 2.22 >25%<br />
Similarities 12 12.33 -0.33 2.23 >25%<br />
Picture Concepts 8 8.67 -0.67 2.38 >25%<br />
Vocabulary 13 12.33 0.67 2.11 >25%<br />
Matrix Reasoning 9 8.67 0.33 2.09 >25%<br />
Comprehension 12 12.33 -0.33 2.41 >25%<br />
Verbal Comprehension: Mean = 12.33, Scatter = 1, Base Rate = 96.4%<br />
Perceptual Reasoning: Mean = 8.67, Scatter = 1, Base Rate = 98.2%<br />
Statistical Significance (Critical Values) at the .05 level<br />
Copyright © 2003 by Harcourt Assessment, Inc.<br />
All rights reserved. Printed in the United States of America.<br />
Page 5