SIEVE User Guide
SIEVE User Guide
SIEVE User Guide

Create successful ePaper yourself
Turn your PDF publications into a flip-book with our unique Google optimized e-Paper software.
B Understanding the Framing Process<br />
Aligning Peaks<br />
Aligning Peaks<br />
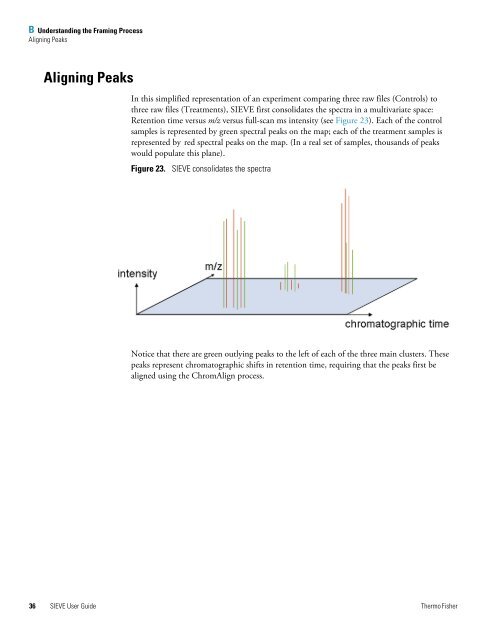
In this simplified representation of an experiment comparing three raw files (Controls) to<br />
three raw files (Treatments), <strong>SIEVE</strong> first consolidates the spectra in a multivariate space:<br />
Retention time versus m/z versus full-scan ms intensity (see Figure 23). Each of the control<br />
samples is represented by green spectral peaks on the map; each of the treatment samples is<br />
represented by red spectral peaks on the map. (In a real set of samples, thousands of peaks<br />
would populate this plane).<br />
Figure 23. <strong>SIEVE</strong> consolidates the spectra<br />
Notice that there are green outlying peaks to the left of each of the three main clusters. These<br />
peaks represent chromatographic shifts in retention time, requiring that the peaks first be<br />
aligned using the ChromAlign process.<br />
36 <strong>SIEVE</strong> <strong>User</strong> <strong>Guide</strong> Thermo Fisher