A5V4d
A5V4d A5V4d
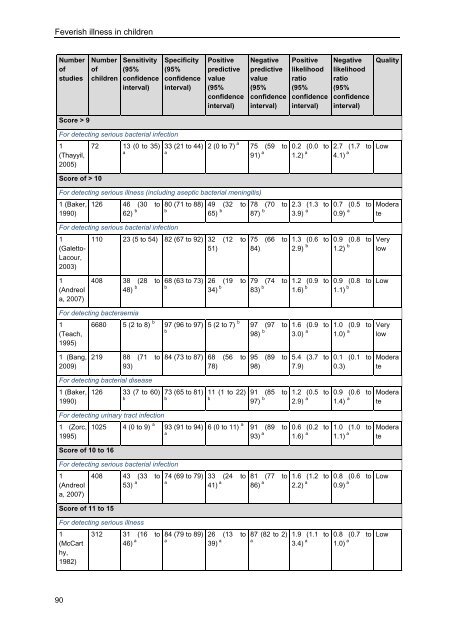
Feverish illness in children Number of studies Score > 9 90 Number of children Sensitivity (95% confidence interval) For detecting serious bacterial infection 1 (Thayyil, 2005) Score of > 10 72 13 (0 to 35) a Specificity (95% confidence interval) 33 (21 to 44) a Positive predictive value (95% confidence interval) Negative predictive value (95% confidence interval) 2 (0 to 7) a 75 (59 to 91) a For detecting serious illness (including aseptic bacterial meningitis) 1 (Baker, 1990) 126 46 (30 to 62) b For detecting serious bacterial infection 1 (Galetto- Lacour, 2003) 1 (Andreol a, 2007) 80 (71 to 88) b 49 (32 to 65) b 110 23 (5 to 54) 82 (67 to 92) 32 (12 to 51) 408 38 (28 to 48) b For detecting bacteraemia 1 (Teach, 1995) 1 (Bang, 2009) 68 (63 to 73) b 6680 5 (2 to 8) b 97 (96 to 97) b 219 88 (71 to 93) For detecting bacterial disease 1 (Baker, 1990) 126 33 (7 to 60) b For detecting urinary tract infection 1 (Zorc, 1995) Score of 10 to 16 26 (19 to 34) b 84 (73 to 87) 68 (56 to 78) 73 (65 to 81) b 1025 4 (0 to 9) a 93 (91 to 94) a For detecting serious bacterial infection 1 (Andreol a, 2007) Score of 11 to 15 408 43 (33 to 53) a For detecting serious illness 1 (McCart hy, 1982) 312 31 (16 to 46) a 74 (69 to 79) a 84 (79 to 89) a 78 (70 to 87) b 75 (66 to 84) 79 (74 to 83) b 5 (2 to 7) b 97 (97 to 98) b 11 (1 to 22) b 95 (89 to 98) 91 (85 to 97) b 6 (0 to 11) a 91 (89 to 93) a 33 (24 to 41) a 26 (13 to 39) a 81 (77 to 86) a 87 (82 to 2) a Positive likelihood ratio (95% confidence interval) 0.2 (0.0 to 1.2) a 2.3 (1.3 to 3.9) a 1.3 (0.6 to 2.9) b 1.2 (0.9 to 1.6) b 1.6 (0.9 to 3.0) a 5.4 (3.7 to 7.9) 1.2 (0.5 to 2.9) a 0.6 (0.2 to 1.6) a 1.6 (1.2 to 2.2) a 1.9 (1.1 to 3.4) a Negative likelihood ratio (95% confidence interval) 2.7 (1.7 to 4.1) a 0.7 (0.5 to 0.9) a 0.9 (0.8 to 1.2) b 0.9 (0.8 to 1.1) b 1.0 (0.9 to 1.0) a 0.1 (0.1 to 0.3) 0.9 (0.6 to 1.4) a 1.0 (1.0 to 1.1) a 0.8 (0.6 to 0.9) a 0.8 (0.7 to 1.0) a Quality Low Modera te Very low Low Very low Modera te Modera te Modera te Low Low
Number of studies 1 (Teach, 1995) 1 (Bang, 2009) Score of ≥ 16 Number of children Sensitivity (95% confidence interval) Specificity (95% confidence interval) 6680 1 (0 to 2) b 99 (99 to 99) b 219 48 (27 to 56) For detecting serious illness 1 (McCart hy, 1982) 312 33 (18 to 49) a For detecting serious bacterial infection 1 (Andreol a, 2007) Positive predictive value (95% confidence interval) 91 (67 to 90) 68 (52 to 82) 99 (98 to 100) a 408 9 (3 to 14) a 98 (96 to 99) a Clinical assessment of the child with fever Negative predictive value (95% confidence interval) 1 (0 to 4) b 97. (97 to 97) b 92 (78 to 100) a 53 (28 to 79) a NA Not applicable a Calculated by the NCC-WCH from results reported in the study 82 (75 to 87) 89 (85 to 93) a 78 (74 to 82) a b Confidence intervals calculated by the NCC-WCH from data reported in the study Table 5.47 GRADE profile for comparison of Yale Observation Scores Number of studies Positive likelihood ratio (95% confidence interval) 0.4 (0.1 to 3.2) a 5.5 (3.0 to 9.8) 64.7 (8.7 to 482.0) a 3.8 (1.4 to 10.3) a Negative likelihood ratio (95% confidence interval) 1.0 (1.0 to 1.0) a 0.6 (0.4 to 0.7) 0.7 (0.5 to 0.8) a 0.9 (0.9 to 1.0) a Duration of fever Effect Quality With serious bacterial illness/infectio n (SBI) (Mean, SD) Yale Observation Score For detecting serious bacterial infection 1 (Hsiao, 2006) Without SBI (Mean, SD) P value 9.4 (SD 4.6) 8.1 (SD 3.6) P < 0.05 High For detecting bacteraemia 1 (Haddon, 1999) 7.0 (SD 1.5) 7.4 (SD 1.9) P = 0.45 High P probability, SBI serious bacterial illness/infection, SD standard deviation Evidence statements The following definitions have been used when summarising the likelihood ratios: Quality Very low Modera te Convincing: positive likelihood ratio (LR+) 10 or higher, negative likelihood ratio (LR-) 0.1 or lower Strong: LR+ 5 or higher (but less than 10), LR- 0.2 or lower (but higher than 0.1) Not strong: LR+ 4.9 or lower, LR- higher than 0.2 Low Low 91 2013 Update
- Page 46 and 47: 4 Thermometers and the detection of
- Page 48 and 49: Feverish illness in children Some p
- Page 50 and 51: Feverish illness in children from a
- Page 52 and 53: Feverish illness in children Table
- Page 54 and 55: Feverish illness in children Recomm
- Page 56 and 57: Feverish illness in children 5.2 Li
- Page 58 and 59: Feverish illness in children Proces
- Page 60 and 61: Feverish illness in children Recomm
- Page 62 and 63: Feverish illness in children 56 Ta
- Page 64 and 65: Feverish illness in children Table
- Page 66 and 67: Feverish illness in children Number
- Page 68 and 69: Feverish illness in children Number
- Page 70 and 71: Feverish illness in children Number
- Page 72 and 73: Feverish illness in children Number
- Page 74 and 75: Feverish illness in children Table
- Page 76 and 77: Feverish illness in children Table
- Page 78 and 79: Feverish illness in children Table
- Page 80 and 81: Feverish illness in children Number
- Page 82 and 83: Feverish illness in children Number
- Page 84 and 85: Feverish illness in children Table
- Page 86 and 87: Feverish illness in children Table
- Page 88 and 89: Feverish illness in children Table
- Page 90 and 91: Feverish illness in children Number
- Page 92 and 93: Feverish illness in children Table
- Page 94 and 95: Feverish illness in children Table
- Page 98 and 99: Feverish illness in children The fo
- Page 100 and 101: Feverish illness in children Nasal
- Page 102 and 103: Feverish illness in children Neck s
- Page 104 and 105: Feverish illness in children the YO
- Page 106 and 107: Feverish illness in children The ev
- Page 108 and 109: Feverish illness in children Based
- Page 110 and 111: Feverish illness in children Howeve
- Page 112 and 113: Feverish illness in children Non-bl
- Page 114 and 115: Feverish illness in children also h
- Page 116 and 117: Feverish illness in children strong
- Page 118 and 119: Feverish illness in children Qualit
- Page 120 and 121: Feverish illness in children The fi
- Page 122 and 123: Feverish illness in children for sp
- Page 124 and 125: Feverish illness in children Number
- Page 126 and 127: Feverish illness in children Figure
- Page 128 and 129: Feverish illness in children Table
- Page 130 and 131: Feverish illness in children report
- Page 132 and 133: Feverish illness in children Figure
- Page 134 and 135: Feverish illness in children Other
- Page 136 and 137: Feverish illness in children Review
- Page 138 and 139: Feverish illness in children A thir
- Page 140 and 141: Feverish illness in children The AH
- Page 142 and 143: Feverish illness in children 136 gr
- Page 144 and 145: Feverish illness in children Table
Feverish illness in children<br />
Number<br />
of<br />
studies<br />
Score > 9<br />
90<br />
Number<br />
of<br />
children<br />
Sensitivity<br />
(95%<br />
confidence<br />
interval)<br />
For detecting serious bacterial infection<br />
1<br />
(Thayyil,<br />
2005)<br />
Score of > 10<br />
72 13 (0 to 35)<br />
a<br />
Specificity<br />
(95%<br />
confidence<br />
interval)<br />
33 (21 to 44)<br />
a<br />
Positive<br />
predictive<br />
value<br />
(95%<br />
confidence<br />
interval)<br />
Negative<br />
predictive<br />
value<br />
(95%<br />
confidence<br />
interval)<br />
2 (0 to 7) a 75 (59 to<br />
91) a<br />
For detecting serious illness (including aseptic bacterial meningitis)<br />
1 (Baker,<br />
1990)<br />
126 46 (30 to<br />
62) b<br />
For detecting serious bacterial infection<br />
1<br />
(Galetto-<br />
Lacour,<br />
2003)<br />
1<br />
(Andreol<br />
a, 2007)<br />
80 (71 to 88)<br />
b<br />
49 (32 to<br />
65) b<br />
110 23 (5 to 54) 82 (67 to 92) 32 (12 to<br />
51)<br />
408 38 (28 to<br />
48) b<br />
For detecting bacteraemia<br />
1<br />
(Teach,<br />
1995)<br />
1 (Bang,<br />
2009)<br />
68 (63 to 73)<br />
b<br />
6680 5 (2 to 8) b 97 (96 to 97)<br />
b<br />
219 88 (71 to<br />
93)<br />
For detecting bacterial disease<br />
1 (Baker,<br />
1990)<br />
126 33 (7 to 60)<br />
b<br />
For detecting urinary tract infection<br />
1 (Zorc,<br />
1995)<br />
Score of 10 to 16<br />
26 (19 to<br />
34) b<br />
84 (73 to 87) 68 (56 to<br />
78)<br />
73 (65 to 81)<br />
b<br />
1025 4 (0 to 9) a 93 (91 to 94)<br />
a<br />
For detecting serious bacterial infection<br />
1<br />
(Andreol<br />
a, 2007)<br />
Score of 11 to 15<br />
408 43 (33 to<br />
53) a<br />
For detecting serious illness<br />
1<br />
(McCart<br />
hy,<br />
1982)<br />
312 31 (16 to<br />
46) a<br />
74 (69 to 79)<br />
a<br />
84 (79 to 89)<br />
a<br />
78 (70 to<br />
87) b<br />
75 (66 to<br />
84)<br />
79 (74 to<br />
83) b<br />
5 (2 to 7) b 97 (97 to<br />
98) b<br />
11 (1 to 22)<br />
b<br />
95 (89 to<br />
98)<br />
91 (85 to<br />
97) b<br />
6 (0 to 11) a 91 (89 to<br />
93) a<br />
33 (24 to<br />
41) a<br />
26 (13 to<br />
39) a<br />
81 (77 to<br />
86) a<br />
87 (82 to 2)<br />
a<br />
Positive<br />
likelihood<br />
ratio<br />
(95%<br />
confidence<br />
interval)<br />
0.2 (0.0 to<br />
1.2) a<br />
2.3 (1.3 to<br />
3.9) a<br />
1.3 (0.6 to<br />
2.9) b<br />
1.2 (0.9 to<br />
1.6) b<br />
1.6 (0.9 to<br />
3.0) a<br />
5.4 (3.7 to<br />
7.9)<br />
1.2 (0.5 to<br />
2.9) a<br />
0.6 (0.2 to<br />
1.6) a<br />
1.6 (1.2 to<br />
2.2) a<br />
1.9 (1.1 to<br />
3.4) a<br />
Negative<br />
likelihood<br />
ratio<br />
(95%<br />
confidence<br />
interval)<br />
2.7 (1.7 to<br />
4.1) a<br />
0.7 (0.5 to<br />
0.9) a<br />
0.9 (0.8 to<br />
1.2) b<br />
0.9 (0.8 to<br />
1.1) b<br />
1.0 (0.9 to<br />
1.0) a<br />
0.1 (0.1 to<br />
0.3)<br />
0.9 (0.6 to<br />
1.4) a<br />
1.0 (1.0 to<br />
1.1) a<br />
0.8 (0.6 to<br />
0.9) a<br />
0.8 (0.7 to<br />
1.0) a<br />
Quality<br />
Low<br />
Modera<br />
te<br />
Very<br />
low<br />
Low<br />
Very<br />
low<br />
Modera<br />
te<br />
Modera<br />
te<br />
Modera<br />
te<br />
Low<br />
Low


