Interim Report Jan-Sep 2004.pdf - Securitas
Interim Report Jan-Sep 2004.pdf - Securitas
Interim Report Jan-Sep 2004.pdf - Securitas

Create successful ePaper yourself
Turn your PDF publications into a flip-book with our unique Google optimized e-Paper software.
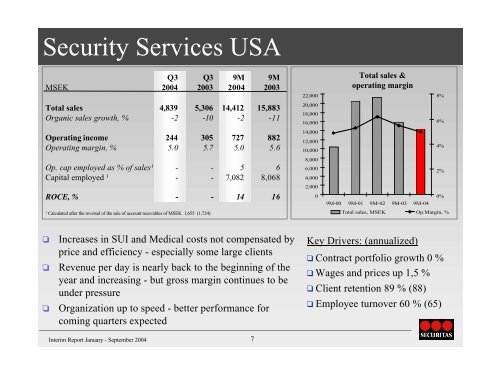
Security Services USA<br />
Q3 Q3 9M 9M<br />
MSEK 2004 2003 2004 2003<br />
Total sales 4,839 5,306 14,412 15,883<br />
Organic sales growth, % -2 -10 -2 -11<br />
Operating income 244 305 727 882<br />
Operating margin, % 5.0 5.7 5.0 5.6<br />
Op. cap employed as % of sales¹ - - 5 6<br />
Capital employed ¹ - - 7,082 8,068<br />
ROCE, % - - 14 16<br />
¹ Calculated after the reversal of the sale of account recevables of MSEK 1,655 (1,724)<br />
❑ Increases in SUI and Medical costs not compensated by<br />
price and efficiency - especially some large clients<br />
❑ Revenue per day is nearly back to the beginning of the<br />
year and increasing - but gross margin continues to be<br />
under pressure<br />
❑ Organization up to speed - better performance for<br />
coming quarters expected<br />
<strong>Interim</strong> <strong>Report</strong> <strong>Jan</strong>uary - <strong>Sep</strong>tember 2004 7<br />
22,000<br />
20,000<br />
18,000<br />
16,000<br />
14,000<br />
12,000<br />
10,000<br />
8,000<br />
6,000<br />
4,000<br />
2,000<br />
0<br />
Total sales &<br />
operating margin<br />
9M-00 9M-01 9M-02 9M-03 9M-04<br />
8%<br />
6%<br />
4%<br />
2%<br />
0%<br />
Total sales, MSEK Op.Margin, %<br />
Key Drivers: (annualized)<br />
❑ Contract portfolio growth 0 %<br />
❑ Wages and prices up 1,5 %<br />
❑ Client retention 89 % (88)<br />
❑ Employee turnover 60 % (65)