

Etude des marchés d'assurance non-vie à l'aide d'équilibres de ...
Etude des marchés d'assurance non-vie à l'aide d'équilibres de ...
Etude des marchés d'assurance non-vie à l'aide d'équilibres de ...

Create successful ePaper yourself
Turn your PDF publications into a flip-book with our unique Google optimized e-Paper software.
tel-00703797, version 2 - 7 Jun 2012<br />
Chapitre 2. Theorie <strong><strong>de</strong>s</strong> jeux et cycles <strong>de</strong> marché<br />
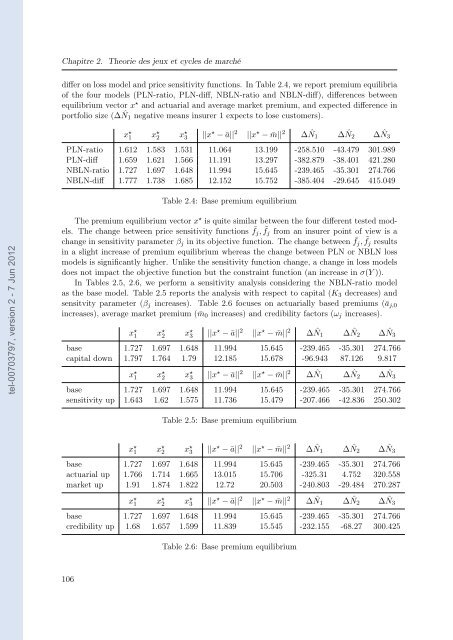
differ on loss mo<strong>de</strong>l and price sensitivity functions. In Table 2.4, we report premium equilibria<br />
of the four mo<strong>de</strong>ls (PLN-ratio, PLN-diff, NBLN-ratio and NBLN-diff), differences between<br />
equilibrium vector x ⋆ and actuarial and average market premium, and expected difference in<br />
portfolio size (∆ ˆ N1 negative means insurer 1 expects to lose customers).<br />
x ⋆ 1 x ⋆ 2 x ⋆ 3 ||x ⋆ − ā|| 2 ||x ⋆ − ¯m|| 2 ∆ ˆ N1 ∆ ˆ N2 ∆ ˆ N3<br />
PLN-ratio 1.612 1.583 1.531 11.064 13.199 -258.510 -43.479 301.989<br />
PLN-diff 1.659 1.621 1.566 11.191 13.297 -382.879 -38.401 421.280<br />
NBLN-ratio 1.727 1.697 1.648 11.994 15.645 -239.465 -35.301 274.766<br />
NBLN-diff 1.777 1.738 1.685 12.152 15.752 -385.404 -29.645 415.049<br />
Table 2.4: Base premium equilibrium<br />
The premium equilibrium vector x ⋆ is quite similar between the four different tested mo<strong>de</strong>ls.<br />
The change between price sensitivity functions ¯ fj, ˜ fj from an insurer point of <strong>vie</strong>w is a<br />
change in sensitivity parameter βj in its objective function. The change between ¯ fj, ˜ fj results<br />
in a slight increase of premium equilibrium whereas the change between PLN or NBLN loss<br />
mo<strong>de</strong>ls is significantly higher. Unlike the sensitivity function change, a change in loss mo<strong>de</strong>ls<br />
does not impact the objective function but the constraint function (an increase in σ(Y )).<br />
In Tables 2.5, 2.6, we perform a sensitivity analysis consi<strong>de</strong>ring the NBLN-ratio mo<strong>de</strong>l<br />
as the base mo<strong>de</strong>l. Table 2.5 reports the analysis with respect to capital (K3 <strong>de</strong>creases) and<br />
sensitvity parameter (βj increases). Table 2.6 focuses on actuarially based premiums (āj,0<br />
increases), average market premium ( ¯m0 increases) and credibility factors (ωj increases).<br />
x ⋆ 1 x ⋆ 2 x ⋆ 3 ||x ⋆ − ā|| 2 ||x ⋆ − ¯m|| 2 ∆ ˆ N1 ∆ ˆ N2 ∆ ˆ N3<br />
base 1.727 1.697 1.648 11.994 15.645 -239.465 -35.301 274.766<br />
capital down 1.797 1.764 1.79 12.185 15.678 -96.943 87.126 9.817<br />
x ⋆ 1 x ⋆ 2 x ⋆ 3 ||x ⋆ − ā|| 2 ||x ⋆ − ¯m|| 2 ∆ ˆ N1 ∆ ˆ N2 ∆ ˆ N3<br />
base 1.727 1.697 1.648 11.994 15.645 -239.465 -35.301 274.766<br />
sensitivity up 1.643 1.62 1.575 11.736 15.479 -207.466 -42.836 250.302<br />
Table 2.5: Base premium equilibrium<br />
x ⋆ 1 x ⋆ 2 x ⋆ 3 ||x ⋆ − ā|| 2 ||x ⋆ − ¯m|| 2 ∆ ˆ N1 ∆ ˆ N2 ∆ ˆ N3<br />
base 1.727 1.697 1.648 11.994 15.645 -239.465 -35.301 274.766<br />
actuarial up 1.766 1.714 1.665 13.015 15.706 -325.31 4.752 320.558<br />
market up 1.91 1.874 1.822 12.72 20.503 -240.803 -29.484 270.287<br />
x ⋆ 1 x ⋆ 2 x ⋆ 3 ||x ⋆ − ā|| 2 ||x ⋆ − ¯m|| 2 ∆ ˆ N1 ∆ ˆ N2 ∆ ˆ N3<br />
base 1.727 1.697 1.648 11.994 15.645 -239.465 -35.301 274.766<br />
credibility up 1.68 1.657 1.599 11.839 15.545 -232.155 -68.27 300.425<br />
106<br />
Table 2.6: Base premium equilibrium


