

Psychrophilic and psychrotrophic clostridia: sporulation and ...
Psychrophilic and psychrotrophic clostridia: sporulation and ...
Psychrophilic and psychrotrophic clostridia: sporulation and ...

Create successful ePaper yourself
Turn your PDF publications into a flip-book with our unique Google optimized e-Paper software.
International Journal of Food Science <strong>and</strong> Technology 2010, 45, 1539–1544 1539<br />
Review article<br />
<strong>Psychrophilic</strong> <strong>and</strong> <strong>psychrotrophic</strong> <strong>clostridia</strong>: <strong>sporulation</strong> <strong>and</strong><br />
germination processes <strong>and</strong> their role in the spoilage of chilled,<br />
vacuum-packaged beef, lamb <strong>and</strong> venison<br />
Katharine H. Adam, 1 * Steve H. Flint 2 & Gale Brightwell 1<br />
1 Food Metabolism <strong>and</strong> Microbiology, AgResearch, Ruakura, Private Bag 3123, Hamilton, New Zeal<strong>and</strong><br />
2 Food, Nutrition & Human Health, Massey University, Private Bag 11222, Palmerston North, New Zeal<strong>and</strong><br />
(Received 27 January 2010; Accepted in revised form 20 May 2010)<br />
Summary Spoilage of beef, lamb <strong>and</strong> venison by psychrophilic <strong>and</strong> <strong>psychrotrophic</strong> <strong>clostridia</strong>l species renders meat<br />
unacceptable resulting in financial losses <strong>and</strong> reduced consumer confidence. A number of <strong>clostridia</strong>l strains,<br />
including Clostridium algidicarnis, Clostridium algidixylanolyticum, Clostridium estertheticum, Clostridium<br />
frigidicarnis <strong>and</strong> Clostridium gasigenes, have been implicated in red meat spoilage. Unlike other spoilers,<br />
these <strong>clostridia</strong> are able to grow in anaerobic conditions <strong>and</strong> at chilled temperatures (some at )1.5 °C the<br />
optimal storage temperature for chilled red meat). The spoilage they cause is characterised by softening of<br />
the meat, production of large amounts of drip (exudates), offensive odours <strong>and</strong> in the case of C. estertheticum<br />
<strong>and</strong> C. gasigenes production of gas. Spoilage occurs following the introduction of <strong>clostridia</strong>l spores into<br />
vacuum packages during processing. Germination of spores is necessary for the growth of vegetative cells,<br />
which cause spoilage. Current mitigation strategies focus on good management practice within meat<br />
processing plants. However, this is not always sufficient to prevent spoilage. This review summarises the<br />
issues associated with meat spoilage because of psychrotolerant <strong>clostridia</strong> <strong>and</strong> discusses areas that require<br />
further study.<br />
Keywords Chilling, food quality, meat products, microbiology.<br />
Introduction<br />
Three categories of meat spoilage (as opposed to food<br />
safety issues such as those caused by toxin producing<br />
strains of Clostridium botulinum) are caused by psychrotolerant<br />
<strong>clostridia</strong>: ‘blown pack’, ‘surface spoilage’<br />
<strong>and</strong> ‘bone taint’. A vacuum package suffering ‘blown<br />
pack’ spoilage is typically grossly distended to the<br />
point where meat would be considered off prior to<br />
opening. On opening the pack, strong <strong>and</strong> offensive,<br />
sulphurous, off odours <strong>and</strong> copious quantities of drip<br />
are present, <strong>and</strong> the meat may have a soft texture.<br />
Products affected include primal cuts of beef, lamb<br />
<strong>and</strong> venison, cooked dog rolls, pre-cooked turkey <strong>and</strong><br />
roast beef <strong>and</strong> Sous-vide (food heat processed under<br />
vacuum in O2-impermeable barrier bags <strong>and</strong> stored at<br />
refrigeration temperature) (Broda et al., 1996; Kalinowski<br />
& Tompkin, 1999). Initial contamination with<br />
‘blown pack’ spoilers occurs on the surface of the<br />
*Correspondent: Fax: +64 7 838 5625;<br />
e-mail: katharine.adam@agresearch.co.nz<br />
doi:10.1111/j.1365-2621.2010.02320.x<br />
Ó 2010 AgResearch Ltd<br />
meat, <strong>and</strong> the culprit can be isolated from the drip or<br />
a surface swab. Post-packaging heat shrink treatments<br />
of vacuum packs have the potential to accelerate the<br />
onset of <strong>clostridia</strong>l induced ‘blown pack’ spoilage (Bell<br />
et al., 2001). ‘Surface’ spoilage differs from ‘blown<br />
pack’ spoilage in that little or no gas accumulates in<br />
the pack. On opening, sickly spoilage odours are<br />
present, <strong>and</strong> the bacterium can be isolated from drip<br />
or a surface swab. Clostridia have also been associated<br />
with deep tissue or ‘bone taint’ spoilage, which is not<br />
discussed here as the source of the causative organisms<br />
differs from that of ‘blown pack’ <strong>and</strong> ‘surface’<br />
spoilage.<br />
Clostridia associated with meat spoilage<br />
The first report of a Clostridial species being associated<br />
with the spoilage of fresh, chilled, vacuum-packaged red<br />
meat was published by Dainty et al. (1989). The<br />
bacterium involved was later described <strong>and</strong> named<br />
Clostridium estertheticum (Collins et al., 1992). A second<br />
strain of C. estertheticum, C. estertheticum sub species
1540<br />
Spoilage of red meat by psychrotolerant <strong>clostridia</strong> K. H. Adam et al.<br />
laramiense (originally Clostridium Laramie) was isolated<br />
from spoiled beef shortly after (Kalchayan<strong>and</strong> et al.,<br />
1993; Spring et al., 2003). Clostridium frigidicarnis,<br />
Clostridium gasigenes <strong>and</strong> Clostridium algidixylanolyticum<br />
were all isolated from spoiled vacuum-packed meat<br />
originating from New Zeal<strong>and</strong>. Also associated with<br />
chilled meat spoilage, Clostridium algidicarnis was originally<br />
isolated from cooked vacuum-packaged refrigerated<br />
pork. All strains discussed here exhibit the<br />
characteristics of members of the genus Clostridium as<br />
well as being psychrotolerant. Phylogeny of individual<br />
strains, within the genus, is discussed in the original<br />
species descriptions. Based on analysis, 16S rRNA<br />
sequences C. algidixylanolyticum belongs to cluster<br />
XIVa, which also contains C. xylanolyticum (Broda<br />
et al., 2000a). The other strains listed earlier belong to<br />
cluster I, which also contains strains of C. botulinum<br />
types A to F (Broda et al., 1999, 2000b; Lawson et al.,<br />
1994; Spring et al., 2003).<br />
Psychrotolerance<br />
Historically, the definitions of the terms psychrophilic,<br />
<strong>psychrotrophic</strong> <strong>and</strong> psychrotolerant have varied between<br />
papers. Here, the following definitions have been<br />
adopted: psychrophilic: (cold loving) having optimum<br />
growth at 12–15 °C, a maximum growth temperature<br />
of 15–20 °C <strong>and</strong> minimum growth temperature of )5<br />
to 5 °C, <strong>psychrotrophic</strong>: (cold growing) having optimum<br />
growth at 25–30 °C, a maximum growth temperature<br />
of 30–35 °C <strong>and</strong> a minimum growth temperature<br />
at )5 to 5 °C <strong>and</strong> psychrotolerant: (cold tolerant)<br />
capable of growing at
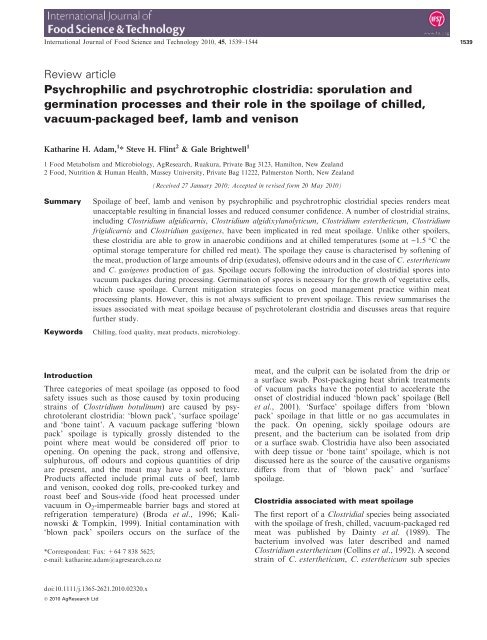
Figure 1 The life cycle of spore forming<br />
bacteria in the environment <strong>and</strong> as spoilers of<br />
vacuum-packaged chilled meats. Cycling<br />
generally occurs in the environment. Under<br />
appropriate conditions transfer of spores of<br />
spoilage causing organisms results in spoiled<br />
meat. Stages of spore formation based on<br />
Paredes et al. (2005).<br />
vacuum packs of red meat, two surveys were conducted<br />
in New Zeal<strong>and</strong> (Boerema et al., 2003; Broda et al.,<br />
2002). Potential sources of contamination within the<br />
abattoir can be split into two main categories: 1. soil <strong>and</strong><br />
faeces on animals <strong>and</strong> 2. equipment. Broda et al. (2002)<br />
relied on classical microbiological methods to isolate<br />
potential spoilers, which were then differentiated using<br />
molecular methods [restriction fragment length polymorphism<br />
analysis of 16S rRNA PCR (PCR-RFLP)<br />
product <strong>and</strong> 16S–23S rRNA internal transcribed spacer<br />
analysis]. Based on PCR-RFLP b<strong>and</strong>ing patterns, isolates<br />
were separated into two groups. The majority of<br />
gas producers belonged to the first group <strong>and</strong> were from<br />
either hide samples or faecal samples. This suggests soil<br />
particles attached to hide or present in faeces were the<br />
primary reservoir from which ‘blown pack’ <strong>clostridia</strong><br />
were introduced on to carcasses. Boerema et al. (2003)<br />
increased the sensitivity of the detection methods, by<br />
combining sample enrichment with PCR amplification,<br />
in a second survey of a New Zeal<strong>and</strong> meat processing<br />
plant from which spoilt chilled vacuum-packed meat<br />
had originated. Clostridium estertheticum <strong>and</strong>C. gasigenes<br />
were detected in soil, faecal <strong>and</strong> pelt samples but<br />
not in boning room or chillers <strong>and</strong> only to a limited<br />
extent on the slaughter floor. This survey, as well as one<br />
carried out by Moschonas et al. (2009) of four commercial<br />
beef abattoirs in Irel<strong>and</strong>, reported high levels of<br />
‘blown pack’ spoilage causing <strong>clostridia</strong> in samples<br />
taken at hide removal <strong>and</strong> in faeces, adds weight to the<br />
theory that contamination originated from soil or faecal<br />
material attached to pelts.<br />
Current mitigation strategies<br />
Chilled lamb, transported from New Zeal<strong>and</strong> to international<br />
markets, by sea freight must reliably attain a<br />
storage life of between 8 <strong>and</strong> 9 weeks (Gill, 1987). Beef<br />
Spoilage of red meat by psychrotolerant <strong>clostridia</strong> K. H. Adam et al. 1541<br />
<strong>and</strong> venison transported by sea spends at least as long as<br />
lamb in chilled storage. Good management practice<br />
(GMP) including minimising initial contamination,<br />
reaching <strong>and</strong> maintaining a uniform, optimum temperature,<br />
of )1.5 °C, <strong>and</strong> the initial pH of the meat are all<br />
important in achieving a long shelf-life, particularly<br />
where product is to be sold in Europe where the use of<br />
chemical intervention is not permitted (Bell et al., 2001;<br />
Gill, 1987). Detection of high numbers of C. estertheticum<br />
<strong>and</strong> C. gasigenes in faeces highlights the importance<br />
of limiting faecal contamination of carcases<br />
(Moschonas et al., 2009). Prior to slaughter, the muscle<br />
tissue of cattle is essentially sterile becoming contaminated<br />
with bacteria as a result of processing. The area of<br />
the carcass around the opening cut has a high risk of<br />
becoming contaminated, <strong>and</strong> care must be taken to<br />
prevent rollback (the pelt around the opening cut rolling<br />
in causing the outside of the pelt to come in contact with<br />
the essentially sterile carcass) (Boerema et al., 2003;<br />
Moschonas et al., 2009). Maintenance of low temperature<br />
is particularly important when dealing with coldtolerant<br />
organisms. An increase in temperature from<br />
)1.5 to 1 or 4 °C significantly shortened the time to<br />
initial gas production in packs of vacuum-packed beef<br />
inoculated with gas producing strains of <strong>clostridia</strong> (Bell<br />
et al., 2001). Selection of appropriate meat for chilled<br />
storage also has an impact as an increase in initial pH of<br />
Beef from 5.5 to 6.0 was shown to result in shorter times<br />
to initial gas production (Bell et al., 2001).<br />
Although maintaining GMP can reduce spoilage by<br />
psychrotolerant <strong>clostridia</strong> the risk remains. Contamination<br />
of animals with spores is unavoidable as are low<br />
levels of transfer of bacteria from hide to carcass. A<br />
range of intervention strategies are available for reducing<br />
the presence of bacteria on red meat including<br />
trimming, the use of steam vacuum, hot water washes,<br />
<strong>and</strong>, where regulations permit, chemical washes (for<br />
Ó 2010 AgResearch Ltd International Journal of Food Science <strong>and</strong> Technology 2010, 45, 1539–1544
1542<br />
Spoilage of red meat by psychrotolerant <strong>clostridia</strong> K. H. Adam et al.<br />
example lactic acid) (Jay, 1996). All intervention treatments<br />
have their limitations. Trimming only removes<br />
visible contamination <strong>and</strong> reduces the final weight of the<br />
carcass. Heat treating spores of C. estertheticum for<br />
240 s at 100 °C resulted in their inactivation in vitro<br />
(Broda, 2007). Further work would be required to<br />
determine whether this effect could be replicated on<br />
freshly slaughtered carcases without causing permanent<br />
discolouration. Steam vacuuming <strong>and</strong> hot water washing,<br />
while effective against E. coli (Dorsa et al., 1996),<br />
risks activating spores if the temperature or time of<br />
application is insufficient. Peroxyacetic acid-(POAA)<br />
based sanitizer is capable of reducing spores of C. estertheticum<br />
by at least 4 log CFU mL )1 in vitro (Broda,<br />
2007). Exposure to POAA resulted in inactivation of<br />
spores. It is unknown if POAA would be effective at<br />
reducing spores from the environment on freshly<br />
slaughtered carcasses.<br />
Sporulation<br />
The survival of psychrotolerant <strong>clostridia</strong>l meat spoilers<br />
in soil <strong>and</strong> on animal hides prior to entering meat packs<br />
at processing plants, is dependent upon the ability to<br />
sporulate, because of their obligate anaerobic nature.<br />
The first visual sign of <strong>sporulation</strong> is the formation of an<br />
asymmetric forespore septum (Fitz-James & Young,<br />
1969). The smaller of the two halves, called the<br />
forespore (sometimes called the pre-spore), becomes<br />
the spore while the larger, called the mother cell,<br />
supports the spore’s formation. The mother cell engulfs<br />
the smaller forespore protecting it <strong>and</strong> producing<br />
components necessary to spore development. A thick<br />
peptidoglycan cortex is synthesised between the outer<br />
<strong>and</strong> inner forespore membranes accompanied by a large<br />
decrease in the water content of the forespore protoplast<br />
<strong>and</strong> a decrease in the forespore pH (Setlow, 2007). Later<br />
the forespore takes up large quantities of dipicolinic acid<br />
that has been synthesised by the mother cell. Finally, the<br />
mother cell lyses releasing the spore into the environment<br />
(Piggot & Hilbert, 2004).<br />
In Bacillus subtilis, <strong>sporulation</strong> is induced by starvation<br />
for carbon <strong>and</strong> ⁄ or nitrogen <strong>and</strong> is initiated by a<br />
multi-component phosphorelay. The phosphorelay is<br />
absent in Clostridium acetobutylicum; however, the<br />
master regulator, Spo0A is conserved. Spo0A regulates<br />
expression of sigma factors that drive differential gene<br />
expression in the forespore <strong>and</strong> mother cell (Jones et al.,<br />
2008). During <strong>sporulation</strong>, the mother cell <strong>and</strong> forespore<br />
participate in extensive ‘cross-talk’ to ensure gene<br />
expression in both compartments remains coordinated<br />
(Setlow, 2007). Unlike B. subtilis, <strong>clostridia</strong>l species<br />
commonly require complex <strong>sporulation</strong> media <strong>and</strong> the<br />
presence of a slowly fermentable carbon source at the<br />
end of the log phase of growth to allow continuation of<br />
energy supply during the early stages of the <strong>sporulation</strong><br />
process. In the development of <strong>sporulation</strong> media, it has<br />
been found that even within various strains of Clostridium<br />
perfringens, variations in the requirements for<br />
<strong>sporulation</strong> occur (De Jong et al., 2002). Initiation of<br />
<strong>sporulation</strong> may also be affected by cell signalling, when<br />
cells become crowded, resulting in a rise in the concentration<br />
of specific signal compounds (Peck et al., 2004).<br />
Germination<br />
Spores in vacuum packs of red meat must germinate to<br />
grow <strong>and</strong> cause spoilage (Fig. 1). At present, there are<br />
no published data on germination in psychrotolerant<br />
<strong>clostridia</strong>. Strain-specific germinants <strong>and</strong> cellular <strong>and</strong><br />
molecular processes of germination, in psychrotolerant<br />
<strong>clostridia</strong>, are unknown. Germination has been studied<br />
in a number of mesophilic strains including B. subtilis,<br />
Bacillus cereus, Clostridium sporogenes <strong>and</strong> C. botulinum<br />
typeB (Broussolle et al., 2002; Paredes-Sabja et al.,<br />
2008). Where studied bacterial spore germination followed<br />
the general pattern: activation, germination <strong>and</strong><br />
outgrowth. Activation is not always necessary for spore<br />
germination, is reversible, does not result in loss of<br />
resistance <strong>and</strong> is often the result of heat treatment<br />
(Keynan & Evenchik, 1969). The heat treatment process<br />
used to shrink vacuum packs may be sufficient to<br />
activate <strong>clostridia</strong>l spores on the surface of meat as it has<br />
been shown to decrease the time to ‘pack blowing’ in<br />
packs inoculated with spores of C. estertheticum (Bell<br />
et al., 2001). Following activation spores will, with<br />
appropriate stimulation, commit themselves to germination.<br />
Once initiated, the germination process proceeds<br />
without the continued presence of the germinant or<br />
synthesis of new macromolecules. This indicates that<br />
germination is a process controlled by the sequential<br />
activation of a set of pre-existing germination-related<br />
enzymes already present in the mature spore (Johnstone,<br />
1994; Moir et al., 2002; Okamura et al., 2000). Germination<br />
results in the loss of refractility <strong>and</strong> resistance to<br />
a wide range of environmental assaults including heat,<br />
UV <strong>and</strong> solvents (Atrih & Foster, 2002; Foster &<br />
Johnstone, 1990). After germination, the spore is physiologically<br />
different from a vegetative cell despite having<br />
lost many spore-specific properties. Before a cell can be<br />
considered vegetative, it must undergo outgrowth,<br />
following which division can proceed (Keynan &<br />
Evenchik, 1969).<br />
Germination occurs in response to environmental<br />
cues called germinants. With the exception of Clostridium<br />
difficile, all strains of <strong>clostridia</strong> have been found to<br />
possess germinant receptor type proteins as part of their<br />
germination systems (Sebaihia et al., 2007). Germinant<br />
receptor proteins interact with a specific nutrient or<br />
nutrients to trigger germination. Studies of germination<br />
in psychrotolerant <strong>clostridia</strong> would highlight similarities<br />
to germination systems in mesophilic spore formers.<br />
International Journal of Food Science <strong>and</strong> Technology 2010, 45, 1539–1544 Ó 2010 AgResearch Ltd
Knowledge of the germination systems utilised by<br />
psychrotolerant <strong>clostridia</strong> would provide insight into<br />
the properties of meat packs that make them ideal<br />
environments for germination. Knowledge of the germination<br />
systems in psychrotolerant <strong>clostridia</strong> would<br />
also potentially lead to improved use of current intervention<br />
strategies or the formulation of new methods for<br />
the reduction in spoilage.<br />
Conclusion<br />
A number of strains of <strong>clostridia</strong>, including C. estertheticum,<br />
are able to spoil chilled ‘vacuum-packed’ beef,<br />
lamb <strong>and</strong> venison. As part of the spoilage process, they<br />
must germinate. The process of germination <strong>and</strong> the<br />
genes involved have been well studied in a number of<br />
strains of bacillus <strong>and</strong> clostridium. The genes involved in<br />
germination of psychrotolerant clostridium <strong>and</strong> the<br />
germinants responsible for triggering germination are<br />
not known. Determining the germination system(s)<br />
involved in the germination of cold-tolerant <strong>clostridia</strong><br />
would potentially lead to methods for the reduction in<br />
spoilage.<br />
Acknowledgments<br />
The financial support of the New Zeal<strong>and</strong> Foundation<br />
for Research, Science <strong>and</strong> Technology is gratefully<br />
acknowledged as is Pauline Hunt for help in preparing<br />
Figure 1.<br />
References<br />
Atrih, A. & Foster, S.J. (2002). Bacterial endospores the ultimate<br />
survivors. International Dairy Journal, 12, 217–223.<br />
Bell, R.G., Moorhead, S.M. & Broda, D.M. (2001). Influence of heat<br />
shrink treatments on the onset of <strong>clostridia</strong>l ‘‘blown pack’’ spoilage<br />
of vacuum packed chilled meat. Food Research International, 34,<br />
271–275.<br />
Boerema, J.A., Broda, D.M. & Bell, R.G. (2002). PCR detection of<br />
psychrotolerant <strong>clostridia</strong> associated with deep tissue spoilage of<br />
vacuum-packed chilled meats. Letters in Applied Microbiology, 35,<br />
446–450.<br />
Boerema, J.A., Broda, D.M. & Bell, R.G. (2003). Abattoir sources<br />
of psychrophilic <strong>clostridia</strong> causing blown pack spoilage of<br />
vacuum-packed chilled meats determined by culture-based <strong>and</strong><br />
molecular detection procedures. Letters in Applied Microbiology,<br />
36, 406–411.<br />
Broda, D.M. (2007). The effect of peroxyacetic acid-based sanitizer,<br />
heat <strong>and</strong> ultrasonic waves on the survival of Clostridium estertheticum<br />
spores in vitro. Letters in Applied Microbiology, 45, 336–<br />
341.<br />
Broda, D.M., DeLacy, K.M., Bell, R.G., Braggins, T.J. & Cook, R.L.<br />
(1996). Psychrotrophic Clostridium spp. associated with ‘blown<br />
pack’ spoilage of chilled vacuum-packed red meats <strong>and</strong> dog rolls in<br />
gas-impermeable plastic casings. International Journal of Food<br />
Microbiology, 29, 335–352.<br />
Broda, D.M., DeLacy, K.M., Cook, R.L. & Bell, G.R. (1997).<br />
Prevalence of cold-tolerant <strong>clostridia</strong> associated with vacuumpacked<br />
beef <strong>and</strong> lamb stored at abusive <strong>and</strong> chill temperatures.<br />
New Zeal<strong>and</strong> Journal of Agricultural Research, 40, 93–98.<br />
Spoilage of red meat by psychrotolerant <strong>clostridia</strong> K. H. Adam et al. 1543<br />
Broda, D.M., Lawson, P.A., Bell, G.R. & Musgrave, D.R. (1999).<br />
Clostridium frigidicarnis sp. a psychrotolerant bacterium associated<br />
with ‘blown pack’ spoilage of vacuum-packed meats. International<br />
Journal of Systematic <strong>and</strong> Evolutionary Microbiology, 49, 1539–1550.<br />
Broda, D.M., Saul, D.J., Bell, G.R. & Musgrave, D.R. (2000a).<br />
Clostridium algidixylanolyticum sp. nov., a psychrotolerant, xyl<strong>and</strong>egrading,<br />
spore-forming bacterium. International Journal of Systematic<br />
<strong>and</strong> Evolutionary Microbiology, 50, 623–631.<br />
Broda, D.M., Saul, D.J., Lawson, P.A., Bell, G.R. & Musgrave, D.R.<br />
(2000b). Clostridium gasigenes sp. nov., a psychrophile causing<br />
spoilage of vacuum-packed meat. International Journal of Systematic<br />
<strong>and</strong> Evolutionary Microbiology, 50, 107–118.<br />
Broda, D.M., Bell, R.G., Boerema, J.A. & Musgrave, D.R. (2002). The<br />
abattoir source of culturable psychrophilic Clostridium spp. causing<br />
‘blown pack’ spoilage of vacuum-packed chilled venison. Journal of<br />
Applied Microbiology, 93, 817–824.<br />
Broussolle, V., Alberto, F., Shearman, C.A. et al. (2002). Molecular<br />
<strong>and</strong> physiological characterisation of spore germination in Clostridium<br />
botulinum <strong>and</strong> C-sporogenes. Anaerobe, 8, 89–100.<br />
Collins, M.D., Rodrigues, U.M., Dainty, R.H., Edwards, R.A. &<br />
Roberts, T.A. (1992). Taxonomic studies on a phsychrophilic<br />
Clostridium from vacuum-packed beef: description of Clostridium<br />
estertheticum sp. nov. FEMS Microbiology Letters, 96, 235–240.<br />
Dainty, R.H., Edwards, R.A. & Hibbard, C.M. (1989). Spoilage of<br />
vacuum-packed beef by a clostridium sp. Journal of the science of<br />
food <strong>and</strong> agriculture, 49, 153–157.<br />
De Jong, A.E.I., Beumer, R.R. & Rombouts, F.M. (2002). Optimizing<br />
<strong>sporulation</strong> of Clostridium perfringens. Journal of Food Protection,<br />
65, 1457–1462.<br />
Dorsa, W.J., Cutter, C.N. & Siragusa, G.R. (1996). Effectiveness of<br />
steam-vacuum sanitizer for reducing Escherichia coli 0157:H7<br />
inoculated to beef carcass surface tissue. Letters in Applied Microbiology,<br />
23, 61–63.<br />
Fitz-James, P. & Young, E. (1969). Morphology of <strong>sporulation</strong>. In:<br />
The Bacterial Spore (edited by G.W. Gould & A. Hurst). Pp. 39–72.<br />
London & New York: Academic Press.<br />
Foster, S.J. & Johnstone, K. (1990). Pulling the trigger: the mechanism<br />
of bacterial spore germination. Molecular Microbiology, 4, 137–141.<br />
Gill, C.O. (1987). Prevention of microbial contamination in the lamb<br />
processing plant. In: Elimination of Pathogenic Organisms from Meat<br />
<strong>and</strong> Poultry (edited by F.J.M. Smulders). Pp. 203–219. Amsterdam:<br />
Elsevier.<br />
Helps, C.R., Harbour, D.A. & Corry, J.E.L. (1999). PCR-based 16S<br />
ribosomal DNA detection technique for Clostridium estertheticum<br />
causing spoilage in vacuum-packed chill-stored beef. International<br />
Journal of Food Microbiology, 52, 57–65.<br />
Jay, J.M. (1996). Fresh Meats <strong>and</strong> Poultry. Modern food microbiology.<br />
Pp. 69–96. New York: Chapman & Hall.<br />
Johnstone, K. (1994). The trigger mechanism of spore germination:<br />
current concepts. Journal of Applied Bacteriology, 76, S17–S24.<br />
Jones, S.W., Paredes, C.J., Tracy, B. et al. (2008). The transcriptional<br />
program underlying the physiology of <strong>clostridia</strong>l <strong>sporulation</strong>.<br />
Genome biology, 9, 7.<br />
Kalchayan<strong>and</strong>, N., Ray, B., Field, R.A. & Johnson, M.C. (1989).<br />
Spoilage of vacuum-packaged refrigerated beef by Clostridium.<br />
Journal of Food Protection, 52, 424–426.<br />
Kalchayan<strong>and</strong>, N., Ray, B. & Field, R.A. (1993). Characteristics of<br />
<strong>psychrotrophic</strong> Clostridium laramie causing spoilage of vacuumpackaged<br />
refrigerated fresh <strong>and</strong> roasted beef. Journal of Food<br />
Protection, 56, 13–17.<br />
Kalinowski, R.M. & Tompkin, R.B. (1999). Psychrotrophic <strong>clostridia</strong><br />
causing spoilage in cooked meat <strong>and</strong> poultry products. Journal of<br />
Food Protection, 62, 766–772.<br />
Keynan, A. & Evenchik, Z. (1969). Activation. In: The Bacterial Spore<br />
(edited by G.W. Gould & A. Hurst). Pp. 359–396. London & New<br />
York: Academic Press.<br />
Lawson, P., Dainty, R.H., Kristiansen, N., Berg, J. & Collins, M.D.<br />
(1994). Characterization of a <strong>psychrotrophic</strong> Clostridium causing<br />
Ó 2010 AgResearch Ltd International Journal of Food Science <strong>and</strong> Technology 2010, 45, 1539–1544
1544<br />
Spoilage of red meat by psychrotolerant <strong>clostridia</strong> K. H. Adam et al.<br />
spoilage in vacuum-packed cooked pork: description of Clostridium<br />
algidicarnis sp. nov. Letters in Applied Microbiology, 19, 153–157.<br />
Moir, A., Corfe, B.M. & Behraven, J. (2002). Spore Germination.<br />
Cellular <strong>and</strong> Molecular Life Sciences, 59, 403–409.<br />
Moschonas, G., Bolton, D.J., Sheridan, J.J. & McDowell, D.A. (2009).<br />
Isolation <strong>and</strong> sources of ‘blown pack’ spoilage <strong>clostridia</strong> in beef<br />
abattoirs. Journal of Applied Microbiology, 107, 616–624.<br />
Okamura, S., Urakami, K., Kimata, M. et al. (2000). The N-terminal<br />
prepeptide is required for the production of spore cortex-lytic<br />
enzyme from its inactive precursor during germination of<br />
Clostridium perfringens S40 spores. Molecular Microbiology, 37,<br />
821–827.<br />
Paredes, C.J., Alsaker, K.V. & Papoutsakis, E.T. (2005). A comparative<br />
genomic view of <strong>clostridia</strong>l <strong>sporulation</strong> <strong>and</strong> physiology. Nature<br />
Reviews Microbiology, 3, 969–978.<br />
Paredes-Sabja, D., Torres, J.A., Setlow, P. & Sarker, M.R. (2008).<br />
Clostridium perfringens spore germination: characterization of<br />
germinants <strong>and</strong> their receptors. Journal of Bacteriology, 190, 1190–<br />
1201.<br />
Peck, M.W., Granum, P.E., Gould, G.W. & Mainil, J.G. (2004). Food<br />
borne <strong>clostridia</strong> <strong>and</strong> <strong>sporulation</strong>, Pathology <strong>and</strong> Ecology of the<br />
genus Clostridium in Humans, Animals, <strong>and</strong> other Foodstuffs:<br />
Identification, Epidemiology <strong>and</strong> Prophylaxis. Concerted Action<br />
QLK2-CT2001-01267 Presse de la faculté de Me´decine Vétéraire de<br />
l’Université de Liege, 4000 Liège, Belgique.<br />
Piggot, P.J. & Hilbert, D.W. (2004). Sporulation of Bacillus subtilis.<br />
Current Opinion in Microbiology, 7, 579–586.<br />
Russell, N.J. (1997). <strong>Psychrophilic</strong> bacteria-molecular adaptations of<br />
membrane lipids. Comparative Biochemistry <strong>and</strong> Physiology, 118A,<br />
489–493.<br />
Sebaihia, M., Peck, M.W., Minton, N.P. et al. (2007). Genome<br />
sequence of a proteolytic (Group I) Clostridium botulinum strain<br />
Hall A <strong>and</strong> comparative analysis of the <strong>clostridia</strong>l genomes. Genome<br />
Research, 17, 1082–1092.<br />
Setlow, P. (2007). I will survive: DNA protection in bacterial spores.<br />
Trends in Microbiology, 15, 172–180.<br />
Spring, S., Merkhoffer, B., Weiss, N., Kroppenstedt, R.M., Hippe, H.<br />
& Stackebr<strong>and</strong>t, E. (2003). Characterization of novel psychrophilic<br />
<strong>clostridia</strong> from an Antarctic microbial mat: description of Clostridium<br />
frigoris sp. nov., Clostridium lacusfryxellense sp. nov., Clostidium<br />
bowmanii sp. nov. <strong>and</strong> reclassification of Clostidium laramiense as<br />
Clostridium estertheticum subsp. laramiense subsp. nov. International<br />
Journal of Systematic <strong>and</strong> Evolutionary Microbiology, 53, 1019–1029.<br />
Yang, X., Balamurugan, S. & Gill, C.O. (2009a). Substrate utilization<br />
by Clostridium estertheticum cultivated in meat juice medium.<br />
International Journal of Food Microbiology, 128, 501–505.<br />
Yang, X., Gill, C. & Balamurugan, S. (2009b). Effects of temperature<br />
<strong>and</strong> pH on the growth of bacteria isolated from blown packs<br />
of vacuum-packaged beef. Journal of Food Protection, 72, 2380–<br />
2385.<br />
International Journal of Food Science <strong>and</strong> Technology 2010, 45, 1539–1544 Ó 2010 AgResearch Ltd
International Journal of Food Science <strong>and</strong> Technology 2010, 45, 1545–1551 1545<br />
Original article<br />
Shelf life extension of durum semolina-based fresh pasta<br />
Cristina Costa, 1 Annalisa Lucera, 1 Marcella Mastromatteo, 2 Amalia Conte 1,2 & Matteo Aless<strong>and</strong>ro Del Nobile 1,2 *<br />
1 Department of Food Science, University of Foggia, Via Napoli, 25 – 71100 Foggia, Italy<br />
2 Istituto per la Ricerca e le Applicazioni Biotecnologiche per la Sicurezza e la Valorizzazione dei Prodotti Tipici e di Qualità, BIOAGROMED,<br />
Università degli Studi di Foggia, Via Napoli, 25 – 71100 Foggia, Italy<br />
(Received 15 January 2010; Accepted in revised form 12 March 2010)<br />
Summary In this work, the combined effects of chitosan, modified atmosphere packaging (MAP) <strong>and</strong> packaging barrier<br />
properties on shelf life of fresh pasta is presented. In particular, all pasta samples were packaged under active<br />
<strong>and</strong> passive MAP in two different polymeric films with high <strong>and</strong> low barrier properties. In order to assess the<br />
influence of the variables described beforeh<strong>and</strong> on the shelf life of pasta, the sensorial <strong>and</strong> microbiological<br />
quality has been monitored during storage. Results confirmed the antimicrobial properties of chitosan.<br />
Moreover, the findings recorded in this study suggest that the shelf life of fresh pasta is limited by the<br />
sensorial characteristics. Statistically significant differences between the shelf life of pasta packaged in low<br />
barrier <strong>and</strong> high barrier films were found. The best result was obtained for samples packaged in high barrier<br />
film, due to the ability of the packaging to maintain the gas headspace conditions during the storage.<br />
Keywords Antimicrobial agents, pasta, shelf life.<br />
Introduction<br />
Pasta is a generic word for a wide range of products with<br />
very different characteristics in terms of shape, colour,<br />
composition, storage, requirements <strong>and</strong> use. According<br />
to the Italian legislation ‘Pasta’ is defined as the product<br />
obtained by extrusion or lamination <strong>and</strong> successive<br />
drying (to 12.5% maximum water content) of a dough<br />
made of durum wheat semolina <strong>and</strong> water. Pasta with<br />
moisture content more than 24% is defined ‘fresh pasta’<br />
<strong>and</strong> requires storage temperatures lower than 4 °C.<br />
For its high water content fresh pasta is a product<br />
easily perishable; spoilage is due to the metabolic<br />
activity of microorganisms (bacteria, yeasts, moulds)<br />
that can easily grow in a product with these characteristics<br />
(Del Nobile et al., 2009a; Zardetto, 2005). The<br />
microbial quality in fresh pasta at the end of the<br />
production process is strictly related to the characteristics<br />
of raw materials, such as durum semolina or<br />
alternative flours <strong>and</strong> water <strong>and</strong> to the methods used<br />
to make pasta (homemade pasta, pilot plant or industrial<br />
plant). Moreover, the cell load is also influenced by<br />
the methods used to sanitize the plant <strong>and</strong> to prevent<br />
new outer contaminations. Large differences can be<br />
found between pasta made with an industrial production<br />
line <strong>and</strong> homemade pasta (Del Nobile et al., 2009a);<br />
*Correspondent: Fax: (+39) 881 589 242;<br />
e-mail: ma.delnobile@unifg.it<br />
doi:10.1111/j.1365-2621.2010.02277.x<br />
Ó 2010 The Authors. Journal compilation Ó 2010 Institute of Food Science <strong>and</strong> Technology<br />
the lower microbial loads of homemade pasta can be<br />
attributed to the better management of the facilities.<br />
To prolong the shelf life of fresh pasta different<br />
methods can be proposed. Actually, in fresh pasta is<br />
allowed the use of chemical preservatives <strong>and</strong> bacteriostatic<br />
compounds to avoid microorganisms proliferation<br />
(FDA, 2006). However, due to the increasing consumer<br />
dem<strong>and</strong> for high quality food without chemical agents,<br />
the use of modified atmosphere packaging (MAP) or the<br />
natural compounds with antimicrobial properties to<br />
control the microbial proliferation has been receiving<br />
considerable attention from the scientific researchers<br />
(Del Nobile et al., 2009a,b).<br />
Among the natural antimicrobials, chitosan has<br />
received considerable interest for commercial applications<br />
(Dutta et al., 2009; Mohy Eldin et al., 2008; Zheng<br />
& Zhu 2003).<br />
Different studies reported the implication of MAP to<br />
preserve the quality of fresh pasta (Del Nobile et al.,<br />
2009b; Zardetto, 2005). In particular, low O 2 <strong>and</strong> high<br />
CO2 concentrations limit the development of microorganisms<br />
<strong>and</strong> reduce the growth <strong>and</strong> toxin production<br />
of different moulds, strictly aerobic <strong>and</strong> sensitive to high<br />
concentrations of CO2 (Zardetto, 2005). Moreover,<br />
the success of the MAP is closely connected to the<br />
permeability of the film used for packaging. A number<br />
of factors influences the barrier properties of packaging<br />
materials. In particular, gas diffusion across a film is<br />
determined by film structure, thickness, area, gradient
1546<br />
Shelf life extension of durum semolina-based fresh pasta C. Costa et al.<br />
concentrations, concentrations across the film, temperature,<br />
<strong>and</strong> differences in pressure across the film<br />
(Gholizadeh et al., 2007).<br />
In several studies, the quality of fresh pasta is<br />
determined by the assessment of either the microbiological<br />
(Alamprese et al., 2004; Zardetto, 2005) or other<br />
quality indices (i.e. protein contents, viscoelasticities,<br />
furosine, texture analysis) (Kovacs et al., 1997; Alamprese<br />
et al., 2005; Zardetto <strong>and</strong> Dalla Rosa, 2006). In our<br />
previous works, the influence of different natural antimicrobial<br />
compounds <strong>and</strong> MAP on microbial stability<br />
of amaranth-based homemade fresh pasta was evaluated.<br />
The recorded results highlighted that the combined<br />
effect of chitosan <strong>and</strong> MAP improved the microbiological<br />
quality of fresh pasta (Del Nobile et al., 2009a,b).<br />
However, the shelf life of a given food is related to both<br />
its sensorial <strong>and</strong> microbial quality.<br />
Thus, the aim of this work is to evaluate the influence<br />
of chitosan, MAP <strong>and</strong> film packaging on shelf life<br />
extension of durum semolina-based fresh pasta, made by<br />
a pilot plant. In particular, three different concentrations<br />
of chitosan <strong>and</strong> two packaging films with different<br />
barrier properties were tested to assess their influence on<br />
the microbiological <strong>and</strong> sensorial quality of fresh pasta.<br />
Materials <strong>and</strong> methods<br />
Raw materials <strong>and</strong> pasta production<br />
Fresh pasta samples were produced by using durum<br />
semolina (provided by Mulini T<strong>and</strong>oi, Corato, Bari,<br />
Italy). Chitosan (Danisco, Brab<strong>and</strong>, Denmark), as<br />
antimicrobial compound, was added to the dough at<br />
three different concentrations: 1000, 2000 <strong>and</strong><br />
3000 mg kg )1 . Semolina <strong>and</strong> tap water (30% v ⁄ w) were<br />
mixed to prepare pasta dough. The samples were<br />
prepared with a pilot plant made of an extruder<br />
(60VR; Namad, Rome, Italy) <strong>and</strong> equipped with a<br />
bronze head to give the pasta dough the shape of<br />
macaroni. The kneading time applied to produce fresh<br />
pasta was 20 min. To obtain pasta samples loaded at<br />
different antimicrobial concentrations, three active solutions<br />
were prepared by dissolving chitosan in lactic<br />
acid (0.3% in the final pasta dough). The solutions<br />
were added to the dough, separately, to obtain final<br />
concentrations of 1000 mg kg )1 , 2000 mg kg )1 <strong>and</strong><br />
3000 mg kg )1<br />
of chitosan in the fresh pasta<br />
(CHT1000, CHT2000 <strong>and</strong> CHT3000). As control, pasta<br />
samples without antimicrobial (CNT) were also prepared.<br />
No lactic acid was added to the control sample.<br />
About 200 g of pasta samples were arranged in a<br />
plastic tray, that in turn was packaged in a plastic bag.<br />
Two polymeric films with different characteristics were<br />
used as packaging bags. An anti-fog low-barrier film<br />
(Low-B), made up of polypropylene (PP) with 30 lm<br />
thickness (Carton Pack, Bari, Italy) <strong>and</strong> an anti-fog<br />
high-barrier multilayer film (High-B) made up of polyethylene<br />
terephthalate (PET), ethylene-vinyl alcohol<br />
(EVOH) <strong>and</strong> polyethylene (PE), with 90 lm thickness<br />
(Di Mauro Officine Grafiche s.p.a., Napoli, Italy). All<br />
packaged samples were sealed by means of a thermal<br />
sealer (G<strong>and</strong>us sealers, Milan, Italy) under ordinary<br />
atmosphere (passive MAP, named as P-MAP) <strong>and</strong><br />
modified atmospheric conditions (active MAP, named<br />
as A-MAP). To realise the modified headspace conditions<br />
the following gas concentrations were used: 70%<br />
CO2 <strong>and</strong> 30% N2. All the samples were stored at 4 °C.<br />
Headspace gas composition<br />
The changes in headspace O 2 <strong>and</strong> CO 2 concentration of<br />
packaged samples were measured using a PBI Dansensor<br />
O2 ⁄ CO2 analyzer (Checkmate 9900, Denmark). The<br />
volume taken from the package headspace for gas<br />
analysis was about 10 cm 3 . To avoid modifications in<br />
the headspace gas composition due to gas sampling,<br />
each package was used only for a single measurement of<br />
the headspace gas composition. Two bags were used for<br />
each measurement.<br />
Permeation tests<br />
The water vapour transmission rate (WVTR) was<br />
determined by means of a Lyssy permeabilimeter<br />
(Model L80-5000; PBI Dansensor, Milan, Italy). Samples<br />
of each film with a surface area of 50 cm 2 were<br />
tested at 23 °C <strong>and</strong> 85% of relative humidity (RH).<br />
The oxygen transmission rate (OTR) was determined<br />
by means of an Ox-Tran permeabilimeter (Model 2 ⁄ 21;<br />
Mocon, Neuwied, Germany). Samples of each film with<br />
a surface area of 5 cm 2 were tested at 23 °C <strong>and</strong> 0% RH<br />
at the upstream <strong>and</strong> the downstream sides of the sample.<br />
The carbon dioxide transmission rate (CDTR) was<br />
determined by means of a Permatran permeabilimeter<br />
(Mocon, Model C 4 ⁄ 41). Samples of each film with a<br />
surface area of 5 cm 2 were tested at 23 °C <strong>and</strong> 0% RH<br />
at the upstream <strong>and</strong> the downstream side of the<br />
sample. WVTR, OTR <strong>and</strong> CDTR tests were performed<br />
twice.<br />
Microbiological analyses<br />
For microbiological analyses, about 25 g of sample was<br />
aseptically removed from each package, placed in a<br />
stomacher bag, diluted with 0.9% NaCl solution <strong>and</strong><br />
homogenised with a stomacher LAB Blender 400 (Pbi<br />
International, Milan, Italy). Serial dilutions in sterile<br />
saline solution were plated onto appropriate media. The<br />
media <strong>and</strong> the conditions were the following: plate count<br />
agar (PCA) incubated at 30 °C for 48 h for aerobic<br />
mesophilic bacteria <strong>and</strong> at 7 °C for 10 days for <strong>psychrotrophic</strong><br />
bacteria; Violet Red Bile Agar (VRBA)<br />
International Journal of Food Science <strong>and</strong> Technology 2010 Ó 2010 The Authors. Journal compilation Ó 2010 Institute of Food Science <strong>and</strong> Technology
incubated at 37 °C for 24 h for total coliforms; Baird-<br />
Parker Agar, supplemented with egg yolk tellurite<br />
emulsion, incubated at 37 °C for 48 h for Staphylococcus<br />
spp.; deMan Rogosa Sharpe agar (MRS), added<br />
with 0.17 g L )1 cycloheximide (Sigma-Aldrich, Milan,<br />
Italy) incubated at 30 °C for 48 h for lactic acid<br />
bacteria; Sabouraud Dextrose Agar, added with<br />
0.1 g L )1 chloramphenicol (C. Erba, Milan, Italy),<br />
incubated at 25 °C for 48 h for yeasts <strong>and</strong> 25 °C for<br />
5 days for moulds. All media <strong>and</strong> supplements were<br />
from Oxoid (Milan, Italy). All microbiological analyses<br />
were performed twice on two different batches.<br />
pH evaluation<br />
The measurement of pH on the homogenised product<br />
was performed twice on two different batches by using a<br />
pH-meter (Crison, Barcelona, Spain).<br />
Sensory analysis<br />
Both uncooked <strong>and</strong> cooked fresh pasta were subjected<br />
to sensory evaluation. All the uncooked samples were<br />
submitted in a single session to a panel of eight trained<br />
tasters for estimation of colour, odour <strong>and</strong> overall<br />
quality. In addition, adhesiveness, bulkiness, firmness,<br />
elasticity, colour, odour, taste <strong>and</strong> overall quality were<br />
evaluated on cooked pasta. Each unpackaged sample<br />
(about 200 g) was cooked in a cooker containing about<br />
4000 mL of tap water at 100 °C. A nine-point hedonic<br />
rating scale, where 1 corresponded to ‘extremely<br />
unpleasant’ <strong>and</strong> 9 to ‘extremely pleasant’, was used to<br />
perform the panel test. A score equal to 5 was used as<br />
the threshold for product acceptability (Del Nobile<br />
et al., 2009a). The panelists were selected on the basis of<br />
their sensory skills (ability to accurately determine <strong>and</strong><br />
communicate the sensory attributes, appearance, odour,<br />
flavour <strong>and</strong> texture of a food product) (Meilgaard et al.,<br />
1999). Prior to testing pasta, the panelists were trained<br />
in sensory vocabulary <strong>and</strong> identification of particular<br />
attributes, by using samples of commercial pasta. The<br />
analyses were performed in isolated booths in a<br />
st<strong>and</strong>ard taste panel kitchen.<br />
Moreover, panellists were also asked to search for<br />
visual moulds, thus allowing determining the day<br />
between the latest storage time at which moulds were<br />
not visible <strong>and</strong> the earliest storage time at which moulds<br />
were visible, hereinafter referred to as VMT (Visual<br />
Moulds Time).<br />
Modelling<br />
To quantitatively determine the effectiveness of the<br />
combined effects of the two packaging films, chitosan<br />
<strong>and</strong> MAP in preventing microbial growth, the storage<br />
time at which the viable cell concentration reached its<br />
Shelf life extension of durum semolina-based fresh pasta C. Costa et al. 1547<br />
threshold value was calculated according to the Gompertz<br />
equation, as re-parameterised by Corbo et al. (2006):<br />
logðNðtÞÞ ¼ logðNmaxÞ<br />
A exp exp l max 2:71<br />
þ A exp exp l max 2:71<br />
k MAL<br />
A<br />
þ 1<br />
k t<br />
A<br />
þ 1 ð1Þ<br />
where N(t) is the viable cell concentration (CFU g )1 )at<br />
storage time t, A is related to the difference between the<br />
decimal logarithm of maximum bacterial growth<br />
attained at the stationary phase <strong>and</strong> the decimal<br />
logarithm of the initial cell load concentration<br />
(CFU g )1 ), lmax is the maximal specific growth rate<br />
(Dlog[CFU g )1 ] day )1 ), k is the lag time (day), t is the<br />
time (day), Nmax is the cell load concentration threshold<br />
value (CFU g )1 ), MAL is the microbial acceptability<br />
limit (day) (i.e. the storage time at which the N(t) equals<br />
Nmax). In the case of total mesophilic <strong>and</strong> <strong>psychrotrophic</strong><br />
bacteria the value of N max was set to<br />
10 6 CFU g )1 , whereas in the case of total coliforms<br />
<strong>and</strong> Staphylococcus spp. it was set to 10 4 CFU g )1<br />
(Ministerial Health Decree 32, 1985).<br />
A similar approach was used to quantitatively determine<br />
the efficacy of the tested variables on sensorial<br />
quality. To this aim, the Gompertz equation, as reparameterised<br />
by Corbo et al. (2006), was also fitted to<br />
the sensorial data:<br />
SQðtÞ ¼SQ min<br />
A Q exp exp l Q max<br />
2:71 kQ<br />
SAL<br />
A Q<br />
þ 1<br />
þ A Q exp exp l Q kQ t<br />
max 2:71 þ 1 ð2Þ<br />
AQ where SQ(t) is the pasta sensorial quality at time t, A Q is<br />
related to the difference between the sensorial quality<br />
attained at the stationary phase <strong>and</strong> the initial value of<br />
pasta sensorial quality, l Q max is the maximal rate at<br />
which SQ(t) decreases, k Q is the lag time, SQmin is the<br />
threshold value, SAL is the sensorial acceptability limit<br />
(i.e. the storage time at which the SQ(t) equals SQmin),<br />
<strong>and</strong> t is the storage time. The value of SQmin was set<br />
equal to 5.<br />
Statistical analysis<br />
The values of MAL, SAL <strong>and</strong> shelf life of all the<br />
investigated samples were compared by one-way anova<br />
analysis. A Duncan’s multiple range test, with the<br />
option of homogeneous groups (P < 0.05), was used to<br />
determine significance among differences. To this aim,<br />
statistica 7.1 for Windows (StatSoft Inc., Tulsa, OK,<br />
USA) was used.<br />
Ó 2010 The Authors. Journal compilation Ó 2010 Institute of Food Science <strong>and</strong> Technology International Journal of Food Science <strong>and</strong> Technology 2010
1548<br />
Shelf life extension of durum semolina-based fresh pasta C. Costa et al.<br />
Results <strong>and</strong> discussion<br />
Film barrier properties<br />
Table 1 shows the values of WVTR, OTR <strong>and</strong> CDTR of<br />
the two films. As it can be seen, WVTR values are very<br />
similar; on the contrary, the OTR <strong>and</strong> CDTR values<br />
differ by three orders of magnitude, being the Low-B<br />
film the most permeable to oxygen <strong>and</strong> carbon dioxide.<br />
In fact, these two films were chosen to test the ability of<br />
different plastic materials to maintain the active MAP<br />
during storage <strong>and</strong> consequently to preserve fresh pasta.<br />
Finally, it must be highlighted that the WVTR, OTR<br />
<strong>and</strong> CDTR values should be considered for sole<br />
comparative purposes as the permeation tests were<br />
conducted at 23 °C <strong>and</strong> not at 4 °C, the temperature at<br />
which shelf life tests were conducted.<br />
As an example, the Fig. 1 shows the headspace<br />
oxygen <strong>and</strong> carbon dioxide concentration plotted as a<br />
function of storage time for CNT samples packaged<br />
under active MAP. Similar trends were also obtained<br />
for samples with chitosan packaged in the same<br />
conditions (data not shown). Regardless of packaging<br />
film used, pasta under P-MAP conditions (data not<br />
shown), showed a reduction of oxygen concentration<br />
<strong>and</strong> an increase of carbon dioxide, principally due to<br />
the metabolic activity of the aerobic microorganisms<br />
(Cruz et al., 2006). Differently from what expected, in<br />
the High-B bag under P-MAP no anaerobic conditions<br />
were created. Concerning the product packaged under<br />
A-MAP, relevant differences between samples in Low-<br />
B <strong>and</strong> High-B bags were recorded. In particular, while<br />
the Low-B bag had a fast change in both carbon<br />
dioxide <strong>and</strong> oxygen headspace concentrations, the gas<br />
mixture in the High-B bag was maintained constant<br />
throughout the entire monitoring period. This experimental<br />
evidence could be related to the limited<br />
development of microbial groups producing carbon<br />
dioxide. It is also worth noting that samples packaged<br />
in Low-B under A-MAP were monitored for a shorter<br />
period, due to the proliferation of visible moulds on<br />
pasta. The recorded results demonstrated that film gas<br />
barrier properties can play a key role in preserving<br />
product quality (Conte et al., 2009a; Del Nobile et al.,<br />
2009c).<br />
Table 1 Values of water vapour transmission rate (WVTR), oxygen<br />
transmission rate (OTR) <strong>and</strong> carbon dioxide transmission rate<br />
(CDTR) of the two selected packaging films<br />
Film<br />
WVTR<br />
[g ⁄ (m 2 Æday)]<br />
OTR<br />
[cc ⁄ (m 2 Æ day)]<br />
CDTR<br />
[cc ⁄ (m 2 Æ day)]<br />
Low Barrier (30 lm) 0.71 ± 0.04 1971.57 ± 33.15 6311.56 ± 28.92<br />
High Barrier (90 lm) 0.69 ± 0.01 2.64 ± 0.12 2.5 ± 0<br />
(a)<br />
(b)<br />
Figure 1 Headspace O2 (•) <strong>and</strong> CO2 (¤) concentration plotted as a<br />
function of storage time for CNT samples packaged under active MAP<br />
in (a) low-barrier <strong>and</strong> (b) high-barrier film.<br />
Microbiological stability<br />
The influence of chitosan concentration, MAP <strong>and</strong><br />
packaging film barrier properties on microbial quality<br />
loss during storage of fresh pasta was assessed by<br />
monitoring the viable cell concentration of the main<br />
spoilage microbial groups (i.e., mesophilic <strong>and</strong> <strong>psychrotrophic</strong><br />
bacteria, total coliforms, Staphylococcus spp.,<br />
lactic acid bacteria, yeasts <strong>and</strong> moulds). Figures S1 <strong>and</strong> S2<br />
show the evolution of total mesophilic bacteria for pasta<br />
with <strong>and</strong> without chitosan, packaged in the two selected<br />
films, under P-MAP <strong>and</strong> A-MAP conditions. Similar<br />
microbial trends were found for <strong>psychrotrophic</strong> bacteria,<br />
lactic acid bacteria <strong>and</strong> yeasts (data no shown). The<br />
curves reported in the figures were obtained by fitting<br />
eqn (1) to the experimental data; the solid horizontal line<br />
International Journal of Food Science <strong>and</strong> Technology 2010 Ó 2010 The Authors. Journal compilation Ó 2010 Institute of Food Science <strong>and</strong> Technology
is the threshold value as imposed by the law. MAL has to<br />
be intended as the time at which the fresh pasta is no<br />
more marketable, due to the imposed threshold (Ministerial<br />
Health Decree 32, 1985). MAL values are listed in<br />
Table 2 for each microbial group. These values were<br />
calculated when the microbial load in pasta samples was<br />
found higher than the threshold. As can be seen in the<br />
above figure, the total mesophilic cell load steadily<br />
overlaps the limit, reaching a maximum population of<br />
about 10 8 CFU g )1 or higher in all CNT samples. On the<br />
other h<strong>and</strong>, the samples loaded at different chitosan<br />
concentrations showed lower cell loads <strong>and</strong> consequently,<br />
higher MAL Mesophilic values. The microbial<br />
growth in samples packaged in Low-B under P-MAP<br />
<strong>and</strong> A-MAP, <strong>and</strong> in High-B under P-MAP was favoured<br />
by the presence of oxygen, which generally promotes the<br />
growth of aerobic microorganisms (Cruz et al., 2006).<br />
The oxygen was naturally present in the P-MAP <strong>and</strong><br />
gradually increased in the headspace of Low-B bag<br />
sealed under A-MAP, due to the scarce film barrier<br />
properties. Conversely, for pasta packed in High-B film<br />
under A-MAP, the mesophilic population can be related<br />
to the development of anaerobic microorganisms. As can<br />
be inferred from data, chitosan efficiently delay the<br />
growth of mesophilic bacteria in pasta packaged in both<br />
films under P-MAP <strong>and</strong> A-MAP, if compared to the<br />
CNT sample. These results confirmed the well-known<br />
antimicrobial properties of chitosan on Gram positive<br />
<strong>and</strong> negative bacteria (No et al., 2007). MAL Mesophilic<br />
value for CHT3000 packaged in High-B under A-MAP<br />
was 21.51 days, whereas CHT1000 <strong>and</strong> CHT2000 sam-<br />
Shelf life extension of durum semolina-based fresh pasta C. Costa et al. 1549<br />
Table 2 Microbial acceptability limit (MAL) <strong>and</strong> sensorial acceptability limit (SAL) (day; mean ± SD) of pasta samples packaged in the high<br />
barrier film; visual moulds time (VMT) defined as the day between the latest storage time at which moulds were not visible <strong>and</strong> the earliest<br />
storage time at which moulds were visible; Shelf life assumed as the lowest value between MAL, SAL <strong>and</strong> VMT<br />
MAL (day) SAL Overall quality (day)<br />
MAL Mesophilic MAL Psychrotrophic MAL Coliforms MAL Staphylococcus VMT (day) SAL O.Q.Uncooked SAL O.Q.Cooked<br />
ples showed lower MAL Mesophilic values (11.70 <strong>and</strong><br />
10.51 days, respectively). It is worth noting that the<br />
different time scale used in Figs S1 <strong>and</strong> S2 is related to<br />
the detection of visible moulds, most probably proliferated<br />
for the headspace oxygen concentration.<br />
In addition, the combination of film barrier properties<br />
<strong>and</strong> MAP influenced the microbial quality loss. In fact,<br />
higher MAL values were obtained for samples packaged<br />
in High-B film under A-MAP. In particular, for these<br />
samples visible moulds did not occur, whereas for the<br />
other samples visible moulds were detected at the tenth<br />
day storage. Moreover, results suggested that MAP <strong>and</strong><br />
chitosan can act in synergic way to control the microbial<br />
stability, as also previously reported by Del Nobile et al.<br />
(2009b).<br />
The total coliforms <strong>and</strong> Staphylococcus spp. were<br />
always found below the threshold imposed by law, in all<br />
fresh pasta samples, except the CNT samples packaged<br />
in High-B under P-MAP that overlapped the limit<br />
imposed for Staphylococcus spp. (10 4 CFU g )1 ) already<br />
after 24 h of storage. Although during the entire storage<br />
period no moulds were recorded by plate count, visible<br />
moulds appeared on pasta surface, as consequence of<br />
numerous factors affecting moulds proliferation<br />
(Sautour et al., 2002; Samapundo et al., 2007).<br />
pH evaluation<br />
Shelf life (day)<br />
Samples in Low-B<br />
CNT P-MAP 0.48 ± 0.48a 1.93 ± 1.07a >12 >12 12 6.64 ± 0.35a >12 0.48 ± 0.48a<br />
CHT1000 P-MAP 7.28 ± 0.80b 7.83 ± 1.87b >12 >12 12 8.80 ± 0.51b >12 7.28 ± 0.80d<br />
CHT2000 P-MAP 9.16 ± 0.60c >12 >12 >12 12 8.55 ± 0.57b >12 8.55 ± 0.57b<br />
CHT3000 P-MAP >16 >16 >16 >16 16 12.16 ± 1.37d >16 12.16 ± 1.37e<br />
CNT A-MAP 0.61 ± 0.54a 1.02 ± 0.23a >12 >12 12 7.26 ± 0.31a 9.46 ± 0.17a 0.61 ± 0.54a<br />
CHT1000 A-MAP >12 >12 >12 >12 12 8.84 ± 0.46b >12 8.84 ± 0.46b,c<br />
CHT2000 A-MAP >12 >12 >12 >12 12 8.99 ± 0.43b,c 9.58 ± 0.11a 8.99 ± 0.43b,c<br />
CHT3000 A-MAP >16 >16 >16 >16 16 10.00 ± 0.09c 12.06 ± 1.62b 10.00 ± 0.09c<br />
Samples in High-B<br />
CNT P-MAP 0.69 ± 0.20a 0.86 ± 0.14a >10 0.41 ± 0.14 10 4.95 ± 0.15a >10 0.41 ± 0.14a<br />
CHT1000 P-MAP >13 >13 >13 >13 13 10.92 ± 3.10b >13 10.92 ± 3.10b<br />
CHT2000 P-MAP >13 >13 >13 >13 13 >13 >13 13 b<br />
CHT3000 P-MAP >17 >17 >17 >17 17 >17 >17 17 c<br />
CNT A-MAP 1.76 ± 1.18a 1.69 ± 0.30b >8 >8 >8 5.15 ± 0.35a >8 1.69 ± 0.30a<br />
CHT1000 A-MAP 11.70 ± 1.57b >37 >37 >37 >37 >37 20.93 ± 3.29a 11.70 ± 1.57b<br />
CHT2000 A-MAP 10.51 ± 1.40b >43 >43 >43 >43 19.54 ± 2.54c 24.31 ± 2.12a 10.51 ± 1.40b<br />
CHT3000 A-MAP 21.51 ± 5.10c >43 >43 >43 >43 17.75 ± 2.44c 24.03 ± 2.59a 17.75 ± 2.44c<br />
Some differences in pH values between samples were also<br />
detected. In particular, CNT samples showed pH values<br />
higher than samples loaded with chitosan, 6.19 ± 0.01<br />
Ó 2010 The Authors. Journal compilation Ó 2010 Institute of Food Science <strong>and</strong> Technology International Journal of Food Science <strong>and</strong> Technology 2010
1550<br />
Shelf life extension of durum semolina-based fresh pasta C. Costa et al.<br />
Figure 2 Uncooked pasta sensorial quality during storage time for<br />
samples packaged in (a) low-barrier <strong>and</strong> (b) high-barrier film. The<br />
curves are the best fit of eqn 2 to the experimental data.<br />
<strong>and</strong> 4.50 ± 0.01, respectively. The lower pH values of<br />
samples loaded with chitosan can be attributed to the<br />
lactic acid used to dissolve chitosan in the dough. It is<br />
worth noting that Del Nobile et al. (2009a) proved that<br />
lactic acid did not affect, to a great extent, microbial<br />
growth. The pH values of all pasta samples packaged<br />
under P-MAP <strong>and</strong> A-MAP decreased during storage. In<br />
particular, CNT packaged in both MAP achieved pH<br />
values of 5.35 ± 0.02 <strong>and</strong> 4.25 ± 0.01, respectively. In<br />
the former case this was probably due to the rapid<br />
microbial increase, whereas in the latter case it could be<br />
ascribed to the presence of high carbon dioxide headspace<br />
concentration (Ke et al., 1991).<br />
Sensory evaluation<br />
In Fig. 2 the overall quality of uncooked pasta packaged<br />
in High-B film under P-MAP <strong>and</strong> A-MAP conditions is<br />
reported; the solid horizontal line is the overall quality<br />
threshold. The curves shown in this figure were obtained<br />
by fitting equation (2) to the sensorial data. SAL values<br />
of the overall quality (SALO.Q) listed in Table 2 for<br />
uncooked <strong>and</strong> cooked pasta were calculated only when<br />
the sensory attribute judgement was below 3. It is worth<br />
noting that SAL O.Q. is the time at which the investigated<br />
fresh pasta is no more marketable from a sensory point<br />
of view. As can be seen, the control samples under<br />
both ordinary atmosphere <strong>and</strong> MAP rapidly fall down<br />
below the threshold value. In fact, SAL O.Q. values of<br />
CHT1000, CHT2000 <strong>and</strong> CHT3000 were found to be<br />
higher than that of the control samples. It is also worth<br />
highlighting that tests were stopped because of the<br />
presence of visible moulds <strong>and</strong> ⁄ or when microbial load<br />
or sensorial overall quality reached the relative threshold<br />
value. In particular, for the uncooked pasta packaged<br />
in both films under P-MAP <strong>and</strong> A-MAP<br />
conditions, the SAL O.Q. was mainly influenced by visible<br />
moulds appearing on the product surface <strong>and</strong> by the<br />
odour, respectively. On the contrary, the odour was the<br />
sensorial attribute that limited the overall quality of all<br />
cooked pasta samples (data not shown).<br />
Shelf life evaluation<br />
In Table 2 the shelf life values of all packaged samples<br />
are also reported, these data representing the lowest<br />
values between MAL, SAL O.Q. <strong>and</strong> VMT (Conte et al.,<br />
2009b). As can be inferred from the data, the shelf life<br />
values of CNT sample packaged in Low-B under P-<br />
MAP <strong>and</strong> A-MAP are similar, probably due to the<br />
scarce barrier properties of the film, that deleted the<br />
effects deriving from MAP. Data also show that shelf<br />
life values of chitosan-loaded samples were higher than<br />
the CNT sample. In particular, the shelf life of<br />
CHT3000 sample packaged under P-MAP <strong>and</strong><br />
A-MAP was 12.16 <strong>and</strong> 10.00. respectively, compared<br />
to a shelf life less than 1 day recorded in the CNT pasta.<br />
For most samples the shelf life was limited by the<br />
sensorial quality of the uncooked pasta, except for the<br />
CNT under both packaging atmospheres <strong>and</strong> CHT1000<br />
packaged under P-MAP, that became unacceptable for a<br />
high microbial proliferation (MAL Mesophilic ).<br />
Results in Table 2 also highlight that for samples<br />
packaged in high barrier film under P-MAP conditions,<br />
microbial <strong>and</strong> sensorial quality were both responsible<br />
for the unacceptability of CNT sample <strong>and</strong> CHT1000<br />
respectively, whereas the shelf life of CHT2000 <strong>and</strong><br />
CHT3000 sample was limited by the development of<br />
visible moulds. Conversely, for CNT, CHT1000,<br />
CHT2000 samples packaged under A-MAP the shelf<br />
life was limited by the microbial quality; instead the<br />
sensory characteristics limited the shelf life of CHT3000<br />
sample. From a sensorial point of view, no statistically<br />
significant differences were found between the samples<br />
packaged under P-MAP <strong>and</strong> A-MAP, even though the<br />
use of High-B film with A-MAP delayed visible moulds<br />
proliferation.<br />
Conclusion<br />
In this work the influence of chitosan, gas headspace in<br />
the package <strong>and</strong> film barrier properties on shelf life of<br />
International Journal of Food Science <strong>and</strong> Technology 2010 Ó 2010 The Authors. Journal compilation Ó 2010 Institute of Food Science <strong>and</strong> Technology
durum semolina-based fresh pasta was studied. In<br />
particular, three different chitosan concentrations <strong>and</strong><br />
two packaging films with high <strong>and</strong> low barrier properties<br />
were tested. To assess the influence of all the selected<br />
variables on the shelf life of fresh pasta the microbiological<br />
<strong>and</strong> sensorial quality were monitored. Results<br />
suggested that the sensorial quality, in particular the<br />
odour of the packaged product, played a significant role<br />
in determining the product acceptability. Moreover,<br />
there are statistically significant differences between the<br />
samples packaged in Low-B <strong>and</strong> High-B film. The high<br />
shelf life value of pasta packaged in High-B under<br />
A-MAP (17.75 days) can be ascribed to the ability of<br />
the packaging film in maintaining the initial modified<br />
headspace conditions during the entire storage period.<br />
Results recorded in this work highlighted that MAP,<br />
chitosan <strong>and</strong> high barrier packaging system can act in<br />
synergic way to control the quality loss of fresh pasta<br />
during refrigerated storage from both microbial <strong>and</strong><br />
sensorial points of view.<br />
References<br />
Alamprese, C., Rossi, M., Casiraghi, E., Hidalgo, A. & Rauzzino, F.<br />
(2004). Hygienic quality evaluation of the egg product used as<br />
ingredient in fresh egg pasta. Food Chemistry, 87, 313–319.<br />
Alamprese, C., Iametti, S., Rossi, M. & Bergonzi, D. (2005). Role of<br />
pasteurisation heat treatments on rheological <strong>and</strong> protein structural<br />
characteristics of fresh egg pasta. European Food Research <strong>and</strong><br />
Technology, 221, 759–767.<br />
Conte, A., Gammariello, D., Di Giulio, S., Attanasio, M. & Del<br />
Nobile, M.A. (2009a). Active coating <strong>and</strong> modified-atmosphere<br />
packaging to extend the shelf life of Fior di Latte cheese. Journal of<br />
Dairy Science, 92, 887–894.<br />
Conte, A., Scrocco, C., Brescia, I. & Del Nobile, M.A. (2009b).<br />
Packaging strategies to prolong the shelf life of minimally processed<br />
lampascioni (Muscari comosum). Journal of Food Engineering,<br />
90, 199–206.<br />
Corbo, M.R., Del Nobile, M.A. & Sinigaglia, M. (2006). A novel<br />
approach for calculating shelf life of minimally processed vegetables.<br />
International Journal of Food Microbiology, 106, 69–73.<br />
Cruz, R.S., de Fa´tima Ferreira Soares, N. & de Andrade, N.J. (2006).<br />
Evaluation of oxygen absorber on antimicrobial preservation of<br />
lasagna – type fresh pasta under vacuum packed. Cieˆncia e agrotecnologia<br />
Lavras, 30, 1135–1138.<br />
Del Nobile, M.A., Di Benedetto, N., Suriano, N., Conte, A.,<br />
Lamacchia, C., Corbo, M.R. & Sinigaglia, M. (2009a). Use of<br />
natural compounds to improve the microbial stability of Amaranthbased<br />
homemade fresh pasta. Food Microbiology, 26, 151–156.<br />
Del Nobile, M.A., Di Benedetto, N., Suriano, N., Conte, A., Corbo,<br />
M.R. & Sinigaglia, M. (2009b). Combined effects of chitosan <strong>and</strong><br />
MAP to improve the microbial quality of amaranth homemade fresh<br />
pasta. Food Microbiology, 26, 587–591.<br />
Del Nobile, M.A., Conte, A., Scrocco, C., Brescia, I., Speranza, B.,<br />
Sinigaglia, M., Perniola, R. & Antonacci, D. (2009c). A study on<br />
quality loss of minimally processed grapes as affected by film<br />
packaging. Postharvest Biology <strong>and</strong> Technology, 51, 21–26.<br />
Dutta, P.K., Tripathi, S., Mehrotra, G.K. & Dutta, J. (2009).<br />
Perspectives for chitosan based antimicrobial films in food applications.<br />
Food Chemistry, 114, 1173–1182.<br />
Shelf life extension of durum semolina-based fresh pasta C. Costa et al. 1551<br />
FDA (2006). Food <strong>and</strong> drug administration department of health <strong>and</strong><br />
human services. 1CFR172.860.<br />
Gholizadeh, M., Razavi, J. & Mousavi, S.A. (2007). Gas permeability<br />
measurement in polyethylene <strong>and</strong> its copolymer films. Materials <strong>and</strong><br />
Design, 28, 2528–2532.<br />
Ke, D., Goldstein, L., O’Mahony, M. & Kader, A.A. (1991). Effects<br />
of short term exposure to low O2 <strong>and</strong> high CO2 atmospheres on<br />
quality attributes of strawberries. Journal of Food Science, 56,<br />
50–54.<br />
Kovacs, M.I.P., Poste, L.M., Butler, G., Woods, S.M., Leisle, D.,<br />
Noll, J.S. & Dahlke, G. (1997). Durum Wheat Quality: Comparison<br />
of Chemical <strong>and</strong> Rheological Screening Tests with Sensory Analysis.<br />
Journal of Cereal Science, 25, 65–75.<br />
Meilgaard, M., Civille, G.V. & Carr, B.T. (1999). Sensory Evaluation<br />
Techniques. 3rd edn. Boca Raton: CRC Press.<br />
Mohy Eldin, M.S., Soliman, E.A., Hashem, A.I. & Tamer, T.M. (2008).<br />
Antibacterial activity of chitosan chemically modified with new<br />
technique. Trends in Biomaterial <strong>and</strong> Artificial Organs, 22, 121–133.<br />
No, H.K., Meyers, S.P., Prinyawiwatkul, W. & Xu, Z. (2007).<br />
Application of chitosan for improvement of quality <strong>and</strong> shelf life<br />
of foods: a review. Journal of Food Science, 72, 100–187.<br />
Samapundo, S., Devlieghere, F., Geeraerd, A.H., De Meulenaer, B.,<br />
Van Impe, J.F. & Debevere, J. (2007). Modelling of the individual<br />
<strong>and</strong> combined effects of water activity <strong>and</strong> temperature on the radial<br />
growth of Aspergillus flavus <strong>and</strong> A. parasiticus on corn. Food<br />
Microbiology, 24, 517–529.<br />
Sautour, M., Soares Mansur, C., Divies, C., Bensoussan, M. &<br />
Dantigny, P. (2002). Comparison of the effects of temperature<br />
<strong>and</strong> water activity on growth rate of food spoilage moulds. Journal<br />
of Industrial Microbiology <strong>and</strong> Biotechnology, 28, 311–316.<br />
Zardetto, S. (2005). Potential application of near infrared spectroscopy<br />
for evaluating thermal treatments of fresh egg pasta. Food Control,<br />
16, 249–256.<br />
Zardetto, S. & Dalla Rosa, M. (2006). Study of the effect of lamination<br />
process on pasta by physical chemical determination <strong>and</strong> near<br />
infrared spectroscopy analysis. Journal of Food Engineering, 74, 402–<br />
409.<br />
Zheng, L.Y. & Zhu, J.F. (2003). Study of antimicrobial activity of<br />
chitosan with different molecular weight. Carbohydrate Polymers,<br />
54, 527–530.<br />
Supporting Information<br />
Additional supporting Information may be found in the<br />
online version of this article:<br />
Figure S1. Evolution of mesophilic bacteria plotted as<br />
a function of storage time for fresh pasta packaged in<br />
low-barrier bag under (a) passive <strong>and</strong> (b) active MAP<br />
<strong>and</strong> in high-barrier bag under (c) passive <strong>and</strong> (d) active<br />
MAP. The curves are the best fit of Eq. (1) to the<br />
experimental data.<br />
Figure S2. Evolution of mesophilic bacteria plotted as<br />
a function of storage time for fresh pasta packaged in<br />
high-barrier under (a) passive <strong>and</strong> (b) active MAP. The<br />
curves are the best fit of Eq. (1) to the experimental data.<br />
Please note: Wiley-Blackwell are not responsible for<br />
the content or functionality of any supporting information<br />
supplied by the authors. Any queries (other than<br />
missing material) should be directed to the corresponding<br />
author for the article.<br />
Ó 2010 The Authors. Journal compilation Ó 2010 Institute of Food Science <strong>and</strong> Technology International Journal of Food Science <strong>and</strong> Technology 2010
1552<br />
Original article<br />
Comparison of hurdle treatments for buffalo meat<br />
Altaf H. Malik 1 * & Brahma Deo Sharma<br />
Division of Livestock Products Technology, Indian Veterinary Research Institute Izatnagar Bareilly UP 243122, India<br />
(Received 8 December 2009; Accepted in revised form 7 April 2010)<br />
Summary Three types of shelf stable buffalo meat chunks (SBM) were prepared using three types of infusion solution<br />
formulations. These contained varying percentages of glycerol, sodium chloride, propylene glycol <strong>and</strong> honey,<br />
in addition to sodium nitrite @ 100 ppm <strong>and</strong> sorbic acid @ 0.2%. Meat chunks were pasteurised at 80 °C<br />
for 20 min <strong>and</strong> then desorbed under refrigeration, drained <strong>and</strong> dried at 80 °C. The SBM processed with<br />
ISF-3 (glycerol 6.0, propylene glycol 1.00 <strong>and</strong> sodium chloride 6.00%) had significantly lower salt <strong>and</strong><br />
moisture content <strong>and</strong> significantly higher protein <strong>and</strong> haem pigments than the other two products. The SBM<br />
processed with ISF-1 (glycerol 9.5, propylene glycol 1.5, sodium chloride 7.5 <strong>and</strong> honey 2.0%) had<br />
significantly lower water activity but significantly higher yield <strong>and</strong> protein solubility than other two products.<br />
The SBM processed with ISF-2 (glycerol 2.5, propylene glycol 2.5, sodium chloride 8.5 <strong>and</strong> honey 1.0%) had<br />
significantly higher salt content <strong>and</strong> Thiobarbituric acid values than the other two products. All the three<br />
types of products had very good sensory acceptability <strong>and</strong> satisfactory microbiological qualities.<br />
Keywords Chemical composition, chemical preservatives, cooking, drying, electrophoresis, foods of animal origin, honey, lipid oxidation,<br />
microbiology, organic acids.<br />
Introduction<br />
India ranks first in buffalo population (98 million) in the<br />
world accounting for more than 56% of the world<br />
buffalo population (Food <strong>and</strong> Agriculture Organisation<br />
2005). During the year 2004–05 out of India’s total meat<br />
export of 0.316 million metric tonnes buffalo meat<br />
accounted for 0.307 million metric tonnes which earned<br />
360.06 million US$ (DGCI&S 2006). Currently India<br />
produces 1.9 million metric tonnes of buffalo meat out<br />
of which 21% (0.399 million tonnes) is exported (Anon<br />
2008). Meat is an important national resource <strong>and</strong> has<br />
good domestic <strong>and</strong> export market. Meat being perishable<br />
commodity needs preservation till it is transported<br />
<strong>and</strong> distributed to retailers <strong>and</strong> then to actual consumers.<br />
Refrigeration is a common method of preservation<br />
of meat. However, refrigeration is an energy intensive<br />
<strong>and</strong> costly process which is not always practicable in a<br />
developing country like India having enormous geographical<br />
area with tropical climate.<br />
It, therefore, becomes imperative to find some cost<br />
effective alternative for preservation of meat. Hurdle<br />
*Correspondent: E-mail: altafhussain.dr@gmail.com<br />
1 Associate Professor ⁄ Senior Scientist, Division of Livestock Products<br />
Technology, Faculty of Veterinary Sciences & AH, Sher e Kashmir<br />
University of Agricultural Sciences <strong>and</strong> Technology of Kashmir<br />
Shuhama Alusteng, Srinagar, Kashmir, India 190006<br />
International Journal of Food Science <strong>and</strong> Technology 2010, 45, 1552–1563<br />
technology can be utilised to store <strong>and</strong> transport meat at<br />
ambient temperatures with good microbiological safety,<br />
sensory <strong>and</strong> nutritional properties <strong>and</strong> convenience at<br />
cheaper <strong>and</strong> affordable price. Hurdle technology, also<br />
referred to as combination preservation technique, uses<br />
the parameters which hinder microbial growth <strong>and</strong><br />
enzymatic deterioration. The hurdles are selected based<br />
on the type of food, its natural micro flora, chemical<br />
composition <strong>and</strong> climatic conditions of h<strong>and</strong>ling <strong>and</strong><br />
storage. The purpose is to disturb the homeostasis of<br />
microbes in order to render them inactive. The hurdles<br />
generally used are water activity, pH, redox potential,<br />
mild heat treatment, refrigeration, preservatives, competitive<br />
flora <strong>and</strong> high pressure etc. Hurdle technology<br />
has made it possible to devise some semi-moist, readyto-eat,<br />
stable, sound <strong>and</strong> convenient meat <strong>and</strong> meat<br />
products to meet the requirements of a special class of<br />
people like space scientists, mountaineers, <strong>and</strong> defence<br />
personnel especially as combat ration with light weight.<br />
It has been possible to produce various types of shelf<br />
stable <strong>and</strong> intermediate moisture meat products with<br />
hurdle technology. Some of the popular meats produced<br />
using this processing technology all over the world as<br />
per Leistner (1985) are raw ham, fermented sausage<br />
(Europe), Mortadella (Italy), Bruhdauerwurst<br />
(Germany), Gelderse Rook worst (Netherl<strong>and</strong>s), Charque<br />
(Brazil), Beef Jerky (North America), Pemmican<br />
(North America), Biltong (South Africa), Kundi (West<br />
doi:10.1111/j.1365-2621.2010.02291.x<br />
Ó 2010 The Authors. Journal compilation Ó 2010 Institute of Food Science <strong>and</strong> Technology
Africa), Dendeng Giling (Indonesia) <strong>and</strong> Tsusousan<br />
(China). A review of literature on the subject reveals<br />
that technologists have prepared intermediate moisture<br />
meat products in various countries using sugar <strong>and</strong> salt<br />
desorption process at high concentrations. But the<br />
humectants at higher levels affect the flavour in finished<br />
product (Ledward, 1981). Recent studies by Prabhakar<br />
& Ramamurthi (1990) have also suggested that palatability<br />
of intermediate moisture meat products can be<br />
improved by variety of ways including using of low<br />
levels of preservatives <strong>and</strong> cooking with traditional<br />
Indian method with spices.<br />
In view of the above as well as growing need for shelf<br />
stable meat <strong>and</strong> meat products, it was proposed to<br />
prepare shelf stable intermediate moisture type buffalo<br />
meat chunks which could be stored <strong>and</strong> transported to<br />
long distances by rail, road, sea <strong>and</strong> air without<br />
refrigeration <strong>and</strong> could be cooked by consumers as per<br />
their convenience <strong>and</strong> taste. The buffalo meat being<br />
comparable to beef except for its leanness was chosen<br />
for its easy availability <strong>and</strong> economic importance in<br />
India.<br />
Materials <strong>and</strong> methods<br />
Meat source<br />
Buffalo meat required for the experiments was procured<br />
from a selected retail meat shop located in Bareilly meat<br />
market The meat samples strictly belonged to round<br />
(consisting mostly of semi-membranosus, semitendinosus,<br />
biceps, femoris <strong>and</strong> quadriceps muscles) of carcasses<br />
of almost similar conformation of spent adult female<br />
Murrah buffaloes slaughtered according to traditional<br />
Halal method. Boneless meat cuts of required weight<br />
were procured within 4–5 h of slaughter packed in low<br />
density polyethylene (LDPE) bags <strong>and</strong> brought to<br />
laboratory within 30 min. The meat chunks were kept<br />
for conditioning in a refrigerator at 4 ± 1 °C for about<br />
24 h till further use.<br />
Chemicals <strong>and</strong> ingredients<br />
Chemicals <strong>and</strong> ingredients used in the experiment were<br />
all food grade from st<strong>and</strong>ard concerns.<br />
Spice mix formulation<br />
The composition of spice mix formulation is given in<br />
Table 1.<br />
Preparation of meat chunks<br />
After chilling for 24 h separable fat <strong>and</strong> connective<br />
tissue were removed as far as possible <strong>and</strong> the chunks of<br />
approximately 2.5 · 1.25 · 1.25 cm size were cut.<br />
Table 1 Composition of spices mix<br />
Ingredients % by weight<br />
1. Cinnamon (Dalchini) 5.15<br />
2. Black pepper (Kalimirch) 12.40<br />
3. Nutmeg (Jaifal) 2.00<br />
4. Mace (Jawitri) 2.00<br />
5. Cori<strong>and</strong>er powder (Dhania) 20.60<br />
6. Cloves (Laung) 2.00<br />
7. Cumin seeds (Zeera) 15.50<br />
8. Caraway seeds (Ajwain) 10.40<br />
9. Cardamon dry (Badi Elaichi) 5.15<br />
10. Bay leaves (Tejpat) 2.00<br />
11. Capsicum (Mirch powder) 10.40<br />
12. Aniseed (Saonf) 12.40<br />
100.00<br />
St<strong>and</strong>ardisation of pasteurisation process<br />
Three hundred grams of meat chunks were dispersed in<br />
450 mL distilled water <strong>and</strong> heated in a water bath<br />
maintained at 75 °C<strong>and</strong>80°C separately for a period of<br />
15 min <strong>and</strong> 20 min at each temperature. Samples were<br />
taken for total aerobic plate count to see the effect of<br />
pasteurisation. Three trials were conducted. The observations<br />
guided us to adopt pasteurisation at 80 °C for a<br />
period of 20 min.<br />
Preparation of infusion solution<br />
In preliminary trials different levels of humectants were<br />
tried e.g. glycerol from 2.5 to 20%, sodium chloride 6.0–<br />
12.0%, sucrose 2.0–6.0%, propylene glycol 1.0–2.5%<br />
with nitrite <strong>and</strong> sorbate as preservative. The pH of<br />
infusion solution was adjusted with lactic acid. Since the<br />
higher levels of glycerol <strong>and</strong> sodium chloride were not<br />
liked by the sensory panellists <strong>and</strong> hence the humectants<br />
were used at lower levels in three different combinations<br />
(Table 2). Formulation 1 was exclusively used for<br />
st<strong>and</strong>ardisation of drying <strong>and</strong> rehydration process.<br />
The ingredients were taken on per cent weight basis of<br />
infusion solution <strong>and</strong> dissolved in sterile potable water.<br />
Table 2 Formulation of infusion solutions<br />
Ingredients<br />
Hurdle treatments of Buffalo meat A. H. Malik <strong>and</strong> B. D. Sharma 1553<br />
Per cent by weight<br />
1 2 3<br />
Glycerol 9.50 2.50 6.00<br />
Propylene glycol 1.50 2.50 1.00<br />
Sodium chloride 7.50 8.50 6.00<br />
Honey 2.00 1.00 -<br />
Sodium nitrite 0.01 (100 ppm) 0.01 (100 ppm) 0.01 (100 ppm)<br />
Sorbic acid 0.20 0.20 0.20<br />
Water 79.29 85.29 86.79<br />
Total 100.00 100.00 100.00<br />
Ó 2010 The Authors. Journal compilation Ó 2010 Institute of Food Science <strong>and</strong> Technology International Journal of Food Science <strong>and</strong> Technology 2010
1554<br />
Hurdle treatments of Buffalo meat A. H. Malik <strong>and</strong> B. D. Sharma<br />
Desorption of meat chunks<br />
Meat chunks were desorbed in infusion solutions in<br />
sterile beakers. Meat to infusion solution ratio of 1:1.5<br />
by weight was followed. The pH of infusion solution<br />
containing meat chunks was recorded after 20 min of<br />
immersion <strong>and</strong> stirring. Meat chunks with infusion<br />
solution were pasteurised in a water bath maintained at<br />
80 °C for 20 min.<br />
Adjustment of pH<br />
After pasteurisation <strong>and</strong> subsequent cooling to room<br />
temperature the pH of the solution was adjusted to 5.0<br />
with the help of lactic acid before keeping it under<br />
refrigeration at 4 ± 1 °C to allow desorption process.<br />
After 24 h desorbed meat was drained for 10–15 min<br />
<strong>and</strong> taken in a clean tray. The surface moisture was<br />
wiped with blotting paper <strong>and</strong> samples were taken for<br />
moisture determination before proceeding for drying.<br />
Drying process<br />
To achieve moisture levels of approximately 50% <strong>and</strong><br />
water activity (aw) below 0.94, Infusion Solution formulation<br />
1 (ISF1) was used to st<strong>and</strong>ardise the drying<br />
process at 80 °C. Desorbed meat 1500 g was loaded in<br />
trays in the oven preheated to 100 °C. Three time periods<br />
90, 120 <strong>and</strong> 150 min were tried for optimum drying. The<br />
meat chunks were taken out at above mentioned<br />
intervals, their surface wiped with blotting paper <strong>and</strong><br />
allowed to cool <strong>and</strong> sampled for moisture <strong>and</strong> aw.<br />
Rehydration time<br />
The dried meat chunks were immersed in potable water<br />
equivalent to the weight of meat <strong>and</strong> subjected to<br />
occasional stirring, sampled at intervals of 90, 120 <strong>and</strong><br />
150 min for moisture determination.<br />
Preparation of hurdle treated (shelf stable) meat chunks<br />
Three types of infusion solution formulations (Table 2)<br />
were used for the preparation of hurdle treated meat<br />
chunks as per the processing steps st<strong>and</strong>ardised earlier.<br />
Three trials were conducted. The products were analysed<br />
at appropriate stages for various physico-chemicals,<br />
sensory <strong>and</strong> microbiological parameters <strong>and</strong> results were<br />
statistically analysed.<br />
Cooking for sensory evaluation<br />
The dried hurdle treated meat chunks were rehydrated for<br />
2 h in potable water. The rehydrated meat chunks were<br />
pressure cooked for 35 min in the rehydration fluid itself<br />
<strong>and</strong> then fried in oil in traditional way with spices <strong>and</strong><br />
condiments. Frozen meat was taken as control. The product<br />
was served to taste panellists for sensory evaluation.<br />
Physico-chemical analyses<br />
pH<br />
The pH was determined by combined glass electrode of a<br />
digital pH metre (Model CP901; Century India, Ch<strong>and</strong>igarah,<br />
India) using the method of (Keller et al. (1974).<br />
Proximate composition <strong>and</strong> nitrite<br />
Methods of AOAC (1995) were followed. The nitrogen<br />
was estimated by using the Micro-kjeldahl distillation<br />
assembly <strong>and</strong> fat was estimated using the Soxhlet apparatus<br />
(Borosil Glass Works Ltd. Worli Mumbai, India) as<br />
ether extract. For nitrite the OD was determined at<br />
540 nm using the Beckman (Model DU 640) Spectrophotometer<br />
(Beckman Coulter Inc., Brea, CA, USA).<br />
Water activity (a w)<br />
The water activity (a w) of meat samples was determined<br />
by the procedure recommended by Lerici et al. (1983),<br />
with slight modification.<br />
Approximately 50 g minced sample was tightly<br />
packed inside a 60 mL glass tube <strong>and</strong> mouth was corked<br />
air-tight. Then it was immersed in a cooling chamber.<br />
The cooling chamber had precooled ethanol at )30 °C<br />
to )35 °C in one litre glass beaker <strong>and</strong> kept in deep<br />
freezer (Vertical type, Vestfrost, Denmark). Resistant<br />
thermometer probe (Century, CT809, S.No. 101) was<br />
introduced inside the cork to monitor the temperature of<br />
the product. The rate of decrease in temperature was<br />
monitored by looking at electronic digital display<br />
(Century) which was constant up to a specific point.<br />
After that the rate markedly decreased. The point at<br />
which the rate markedly altered was taken as freezing<br />
point of the sample. The freezing point was converted to<br />
a w value using )ln a w = 27.622–528.373 (1 ⁄ T)–4.579<br />
lnT where, T = freezing point temperature in Kelvin.<br />
Warner bratzler shear force value<br />
The objective texture measurement of shelf stable meat<br />
products was done using Warner Bratzler shear press<br />
(Model No. 81031307, G-R Manufacturing Co., Manhattan,<br />
KS, USA). Muscle cores with cross-sections of<br />
1.27 cm · 1.27 cm were prepared by cutting the meat<br />
pieces through their longitudinal axis. Maximum force<br />
(kg) required to shear meat cores ⁄ strips along the<br />
transverse axis was recorded <strong>and</strong> expressed as the force<br />
(kg) required to shear meat.<br />
Sodium chloride (salt)<br />
Methods described by (Koniecko (1979) were followed<br />
for sodium chloride.<br />
International Journal of Food Science <strong>and</strong> Technology 2010 Ó 2010 The Authors. Journal compilation Ó 2010 Institute of Food Science <strong>and</strong> Technology
Thiobarbituric acid (TBA) value<br />
The method of Tarladgis et al. (1960) with slight<br />
modifications was followed. Exactly 10 g sample was<br />
blended with 49 mL distilled water <strong>and</strong> 1 mL of<br />
sulphanilamide reagent in a homogeniser. The mixture<br />
was quantitatively transferred into a Kjeldahl flask<br />
(Borosil Glass Works Ltd.). Another 48 mL of distilled<br />
water was used for rinsing the blender <strong>and</strong> poured into<br />
the flask followed by addition of 2 mL of hydrochloric<br />
acid solution (one volume with two volume of water).<br />
Few chips of paraffin wax were added <strong>and</strong> the flask<br />
heated at high heat <strong>and</strong> 50 mL of distillate collected into<br />
a graduated cylinder. The distillate was mixed well,<br />
5 mL was pipetted into test tubes to which 5 mL of<br />
Thiobarbituric acid (TBA) reagent was added <strong>and</strong><br />
mixed. The tubes on a st<strong>and</strong> were immersed in boiling<br />
water bath for 35 min followed by 10 min cooling in tap<br />
water. The OD was read at 538 nm against reagent<br />
blank in a Beckman (Model DU 640) Spectrophotometer.<br />
The OD was multiplied by the factor 7.8 <strong>and</strong> results<br />
expressed as mg malonaldehyde ⁄ kg meat.<br />
Total haem pigments<br />
The method used by Hornsey (1956) was adopted for<br />
measurement of total pigments. The OD was recorded<br />
at 640 nm using the Beckman (Model DU 640) Spectrophotometer.<br />
Protein solubility<br />
The method used by Okonkwo et al. (1992) was<br />
adopted. Remi T8 Centrifuge was used for centrifugation<br />
at 5000 · g as per Madovi (1980).<br />
Sodium dodecyl sulphate polyacrylamide gel<br />
electrophoresis (SDS-PAGE)<br />
SDS-PAGE of meat extractable proteins was carried out<br />
as per the method of Laemmli (1970) with slight<br />
modification using 1 mm slab gel in Genei electrophoresis<br />
equipment (Genei Pvt. Ltd, Banglore, India) <strong>and</strong><br />
power supply apparatus (Pharmacia American Instrument<br />
Exchange Inc., Skokie, IL, USA).<br />
Preparation of sample<br />
Buffalo meat samples obtained from semitendinosus<br />
muscle of spent adult female Murrah buffaloes, used in<br />
experiment 1 were taken for SDS-PAGE at different<br />
processing stages i.e. fresh, desorbed <strong>and</strong> dried muscle.<br />
Meat proteins were extracted from sample following the<br />
procedure of Syed et al. (1995). Minced meat (5 g) was<br />
mixed with 50 mL of 0.01 N sodium phosphate buffer<br />
(pH 7.0) containing 1% sodium dodecyl sulphate (SDS)<br />
plus 1% 2-mercaptoethanol <strong>and</strong> incubated at 37 °C for<br />
2 h. The mixture was then centrifuged at 4000 r.p.m. for<br />
30 min. An aliquot of supernatant was dialysed overnight<br />
at room temperature (26 ± 2 °C) against 0.1 N<br />
sodium phosphate buffer containing 0.1% SDS <strong>and</strong><br />
0.1% 2-mercaptoethanol. About 50 lL–100 lL of<br />
dialysed.<br />
Microbiological quality<br />
All the microbiological parameters viz: Total Plate<br />
Count, Staphylococcus aureus, <strong>and</strong> Yeast <strong>and</strong> mould<br />
count were determined following the APHA (1984). For<br />
total plate count <strong>and</strong> Staphylococcus aureus plate count<br />
agar <strong>and</strong> Baird–Parker agar with potassium Tellurite of<br />
Himedia Laboratories private limited Mumbai at incubation<br />
temperature of 35 °C for 24 h <strong>and</strong> 48 h were used<br />
respectively. For Yeast <strong>and</strong> moulds Potato dextrose<br />
agar of Himedia <strong>and</strong> incubation temperature of 25 °C<br />
was used.<br />
Sensory evaluation<br />
A semi-trained experienced taste panel (Seman et al.,<br />
1987) members consisting of scientists <strong>and</strong> postgraduate<br />
students of the Division <strong>and</strong> Institute evaluated the<br />
sensory attributes of buffalo meat products on the<br />
basis of sensory evaluation scoring guide <strong>and</strong> scoring<br />
card. The 8-point descriptive scale was used (wherein<br />
eight is extremely desirable <strong>and</strong> one is extremely<br />
undesirable). Cooked chunks were served warm to the<br />
panellists.<br />
Statistical analysis<br />
The data obtained from the various trials was pooled<br />
<strong>and</strong> processed at the Institute’s Computer Centre Using<br />
SPSS software (SPSS Inc., Chicago, IL, USA) for<br />
obtaining mean ± SE. The data was subjected to<br />
analysis of variance, least square difference <strong>and</strong> critical<br />
difference (Snedecor & Cochran, 1967) for comparing<br />
the means to find the effects between treatments.<br />
Results<br />
Hurdle treatments of Buffalo meat A. H. Malik <strong>and</strong> B. D. Sharma 1555<br />
St<strong>and</strong>ardisation of processing steps<br />
The results are presented in Tables 3–5.<br />
Pasteurisation<br />
Pasteurisation at 75 °C reduced mean total aerobic plate<br />
count (TPC) from initial log 4.50 to log 2.41 <strong>and</strong> log<br />
1.90 in 15 <strong>and</strong> 20 min respectively, whereas repetition of<br />
same process at 80 °C resulted in counts being reduced<br />
to log 1.66 <strong>and</strong> log 0.88, respectively (Table 3). How-<br />
Ó 2010 The Authors. Journal compilation Ó 2010 Institute of Food Science <strong>and</strong> Technology International Journal of Food Science <strong>and</strong> Technology 2010
1556<br />
Hurdle treatments of Buffalo meat A. H. Malik <strong>and</strong> B. D. Sharma<br />
Table 3 Effect of time-temperature combination on total plate count<br />
(log10 cfu g )1 ) during st<strong>and</strong>ardisation of pasteurisation process for<br />
buffalo meat chunks at 75 °C <strong>and</strong> 80 °C<br />
Trial<br />
Initial<br />
numbers<br />
ever, no colonies were detected in two out of three trials<br />
on pasteurisation at 80 °C for 20 min.<br />
Drying of meat chunks<br />
Pasteurisation<br />
75 °C 80 °C<br />
15 min 20 min 15 min 20 min<br />
1 5.47 3.77 3.42 3.54 2.65<br />
2 4.60 3.47 2.30 1.44 ND<br />
3 3.42 ND ND ND ND<br />
Mean 4.50 2.41 1.90 1.66 0.88<br />
ND = Not detected.<br />
Table 4 Changes in moisture (%) of buffalo meat chunks during<br />
st<strong>and</strong>ardisation of drying at 80 °C <strong>and</strong> rehydration at room temperature<br />
Initial<br />
Time<br />
1½ h 2 h 2½ h 3 h<br />
Drying<br />
65.81 ± 0.18 d 55.83 ± 0.20 c 53.81 ± 0.04 b 52.30 ± 0.20 a<br />
Rehydration<br />
-<br />
52.19 ± 0.20 a 64.48 ± 0.38 b 67.48 ± 0.38 c<br />
- 68.24 ± 0.18 c<br />
n =4.<br />
Means (±SE) bearing different superscripts in each row differ significantly<br />
(P < 0.05).<br />
anova indicated highly significant (P < 0.01) effect on<br />
moisture content due to drying time.<br />
Moisture<br />
Moisture content of desorbed meat chunks decreased<br />
significantly (P < 0.01) (Table 4) as drying time increased.<br />
Moisture content of 52.30% could be achieved<br />
after 2½ h drying at 80 °C.<br />
Water activity<br />
During st<strong>and</strong>ardisation of drying, the water activity (a w)<br />
values (not given in tables) of desorbed meat chunks<br />
(0.946) after 1½, 2 <strong>and</strong> 2½ h drying at 80 °C were<br />
recorded as 0.923, 0.919 <strong>and</strong> 0.904, respectively. On the<br />
basis of observations, time for drying was adopted as<br />
2½ h at 80 °C.<br />
Rehydration of buffalo meat chunks<br />
The anova indicated highly significant (P < 0.01) effect<br />
of time of rehydration on moisture content of rehydrated<br />
meat chunks. Moisture increased significantly from<br />
the initial value of dried meat chunks (Table 4) after<br />
1½, 2 <strong>and</strong> 3 h rehydration in potable water. However,<br />
there was no significant (P > 0.05) improvement in<br />
moisture content during 3 h rehydration over that of 2 h<br />
rehydration.<br />
Effect of different infusion solution formulations on the<br />
quality of Shelf stable buffalo meat chunks (SBM) during<br />
<strong>and</strong> after the production processes<br />
The results of pH, per cent moisture <strong>and</strong> salt at various<br />
stages of processing are presented in Tables 5 <strong>and</strong> 6 <strong>and</strong><br />
the results of quality of SBM treated with three different<br />
ISFs are presented in Tables 7 <strong>and</strong> 8.<br />
Physico-chemical characteristics during processing<br />
pH<br />
The initial pH of infusion solution formulations was<br />
comparable. It is evident from Table 5 that pH of all<br />
infusion solution formulations increased after desorption<br />
of meat <strong>and</strong> subsequent pasteurisation till it was<br />
adjusted to 5.00 with lactic acid. Same trend was<br />
observed in pH of meat chunks treated with three<br />
infusion solution formulations after 24-h desorption <strong>and</strong><br />
after drying for 2½ at 80 °C. The anova indicated that<br />
the infusion solution formulations (ISF) had no significant<br />
(P > 0.05) effect on pH at any stage of processing<br />
of buffalo meat chunks.<br />
Table 5 Effect of different infusion solution formulations on pH at various stages of processing of shelf-stable buffalo meat chunks (Mean ± SE)<br />
Processing stage Sample<br />
Infusion solution formulations<br />
1 2 3<br />
Before desorption of meat Infusion solution 3.89 ± 0.03 3.84 ± 0.03 3.87 ± 0.02<br />
After 20 min of desorbing meat Infusion solution with meat 4.76 ± 0.04 4.77 ± 0.06 4.83 ± 0.07<br />
After pasteurisation <strong>and</strong> cooling for 2 h Infusion solution with meat 5.26 ± 0.04 5.17 ± 0.03 5.24 ± 0.05<br />
After adjustment with lactic acid Infusion solution with meat 5.00 ± 0.00 5.00 ± 0.00 5.00 ± 0.00<br />
After desorption for 24 h Meat chunks 5.66 ± 0.04 5.59 ± 0.07 5.57 ± 0.07<br />
After drying at 80 °C for 2 h -do- 5.67 ± 0.06 5.64 ± 0.09 5.62 ± 0.05<br />
n =3.<br />
Mean initial pH of fresh meat before conditioning was 6.29 ± 0.09 <strong>and</strong> after conditioning 5.77 ± 0.07.<br />
International Journal of Food Science <strong>and</strong> Technology 2010 Ó 2010 The Authors. Journal compilation Ó 2010 Institute of Food Science <strong>and</strong> Technology
Table 6 Effect of different infusion solution formulations on moisture<br />
<strong>and</strong> salt per cent at various stages of processing of shelf-stable buffalo<br />
meat chunks<br />
Processing<br />
stage<br />
Fresh<br />
meat<br />
Infusion solution formulations<br />
1 2 3<br />
Moisture (%)<br />
Desorption 75.40 c<br />
65.61 a ± 0.21 67.65 b ± 0.32 68.39 b ± 0.34<br />
Drying 52.96 b ± 0.20 53.63 c ± 0.31 52.01 a ± 0.19<br />
Rehydration 68.15 b ± 0.17 65.58 a ± 0.39 65.32 a Salt (%)<br />
± 0.32<br />
Desorption 4.04 b ± 0.18 4.40 c ± 0.12 3.14 a ± 0.05<br />
Drying 5.10 b ± 0.10 5.55 c ± 0.07 4.42 a ± 0.06<br />
Rehydration 2.58 ab ± 0.18 2.74 b ± 0.11 2.24 a ± 0.08<br />
n =6.<br />
Means (±SE) bearing different superscripts in each row differ significantly<br />
(P < 0.05).<br />
Moisture<br />
The anova indicated highly significant (P < 0.01) effect<br />
of infusion solution formulations on moisture content of<br />
meat chunks after desorption, drying <strong>and</strong> rehydration<br />
stages of processing (Table 6). Significant decrease of<br />
moisture was observed after desorption. The moisture<br />
was significantly lower (P < 0.01) in meat chunks<br />
processed with ISF-1. However, no significant difference<br />
was recorded in moisture per cent between the chunks<br />
processed with ISF-2 <strong>and</strong> ISF-3. After drying the<br />
moisture per cent in the entire three hurdle treated meat<br />
chunks was significantly different.<br />
After rehydration of meat chunks in water, the<br />
moisture content was significantly higher in meat chunks<br />
processed with ISF-1 than the other two ISFs while<br />
there was no significant difference in moisture content<br />
between the meat chunks processed with ISF2 <strong>and</strong> ISF3.<br />
Sodium chloride (common salt)<br />
The infusion solution formulations had highly significant<br />
(P < 0.01) effect on per cent salt content of meat<br />
chunks after desorption <strong>and</strong> drying processes <strong>and</strong> a<br />
significant (P < 0.05) effect after rehydration.<br />
Physico-chemical characteristics after processing<br />
The anova indicated a highly significant (P < 0.01)<br />
effect on almost all parameters <strong>and</strong> only a significant<br />
(P < 0.05) effect on nitrite content due to infusion<br />
solution formulations.<br />
Yield<br />
The buffalo meat chunks treated with ISF-1 had<br />
significantly higher yield (Table 7) than SBMs treated<br />
with ISF-2 <strong>and</strong> ISF-3 whereas the SBM treated with<br />
ISF-3 had significantly lower per cent yield than the<br />
other two SBMs.<br />
Water activity (a w)<br />
Water activity of SBM treated with ISF-1 was significantly<br />
lower than the aw of SBM treated with ISF-2 <strong>and</strong><br />
ISF-3 while the aw of SBM treated with ISF-2 was<br />
significantly higher than others (Table 7).<br />
Proximate composition<br />
The per cent protein, fat <strong>and</strong> ash were significantly<br />
higher in all types of SBM (Table 7) than the fresh meat.<br />
Among the SBM the protein per cent of SBM treated<br />
with ISF-3 was significantly higher than the other two<br />
SBMs. While the protein per cent of SBM treated with<br />
ISF-1 was lowest among all the SBM. There was no<br />
significant difference in fat <strong>and</strong> ash contents among the<br />
SBM treated with three types of infusion solution<br />
formulations.<br />
Table 7 Effect of different infusion solution formulations on physico-chemical characteristics of shelf-stable buffalo meat chunks<br />
Parameters** Fresh meat ⁄ Control<br />
Hurdle treatments of Buffalo meat A. H. Malik <strong>and</strong> B. D. Sharma 1557<br />
Infusion solution formulations<br />
1 2 3<br />
Yield (%) - 60.13 c ± 0.18 57.65 b ± 0.47 55.55 a ± 0.58<br />
Water activity (aw) - 0.903 a ± 0.001 0.908 b ± 0.0006 0.913 c ± 0.0009<br />
Moisture (%) 75.402* ± 0.584 52.96 b ± 0.12 53.63 c ± 0.31 52.00 a ± 0.19<br />
Protein (%) 19.21 a ± 0.21 29.21 c ± 0.07 28.60 b ± 0.13 31.81 d ± 0.26<br />
Fat (%) 4.88 a ± 0.38 8.66 b ± 0.08 8.65 b ± 0.10 8.43 b ± 0.04<br />
Ash (%) 1.00 a ± 0.04 5.43 b ± 0.00 5.80 b ± 0.01 5.20 b ± 0.17<br />
Shear force value (kg ⁄ 1.27 cm) 3.16 a ± 0.16 3.76 b ± 0.13 5.69 c ± 0.14 5.49 c ± 0.11<br />
Salt (%) - 5.10 b ± 0.10 5.55 c ± 0.07 4.42 a ± 0.06<br />
Nitrite (ppm) - 20.68 b ± 0.42 19.48 a ± 0.28 19.67 a ± 0.25<br />
Protein solubility (%) - 82.91 b ± 0.29 80.07 a ± 0.38 80.58 a ± 0.53<br />
Total haem pigments (ppm) 198.57 a ± 5.76 345.60 b ± 5.06 360.88 b ± 2.17 389.88 c ± 13.95<br />
TBA (mg malonaldehyde ⁄ kg meat) 0.24 a ± 0.01 0.36 b ± 0.02 0.40 b ± 0.02 0.39 b ± 0.02<br />
*Not compared.<br />
**n = Shear force value 96, water activity <strong>and</strong> yield 3, others 6. Means (±SE) bearing different superscripts in each row differ significantly (P < 0.05).<br />
Ó 2010 The Authors. Journal compilation Ó 2010 Institute of Food Science <strong>and</strong> Technology International Journal of Food Science <strong>and</strong> Technology 2010
1558<br />
Hurdle treatments of Buffalo meat A. H. Malik <strong>and</strong> B. D. Sharma<br />
Table 8 Effect of different infusion solution formulations on sensory<br />
attributes of shelf-stable buffalo meat chunks<br />
Sensory<br />
attributes Control<br />
Infusion solution formulations<br />
1 2 3<br />
Appearance 6.52 a ± 0.13 7.00 b ± 0.14 7.00 b ± 0.14 7.14 b ± 0.13<br />
Flavour 6.43 ± 0.16 6.33 ± 0.19 6.10 ± 0.33 6.67 ± 0.13<br />
Juiciness 6.48 ± 0.16 6.53 ± 0.18 6.24 ± 0.33 6.71 ± 0.14<br />
Texture 6.38 ± 0.18 6.48 ± 0.19 6.67 ± 0.16 6.85 ± 0.13<br />
Saltiness 6.57 ± 0.20 6.48 ± 0.20 6.52 ± 0.21 6.85 ± 0.18<br />
Overall<br />
palatability<br />
6.43 ± 0.15 6.29 ± 0.16 6.33 ± 0.13 6.76 ± 0.12<br />
n = 21.<br />
Means (±SE) bearing different superscripts in each row differ significantly<br />
(P < 0.05).<br />
Warner bratzler<br />
Shear force value<br />
The values for shear force were significantly higher<br />
(P < 0.01) in all types of SBM than the fresh (control)<br />
meat chunks. Among the SBM the values were significantly<br />
lower for SBM treated with ISF-1 than the other<br />
two types of BM which in turn did not differ significantly<br />
between them.<br />
Nitrite<br />
Nitrite content was significantly higher in SBM treated<br />
with ISF-1 than either ISF1 or ISF2. The latter, however<br />
did not significantly differ from each other.<br />
Protein solubility<br />
Protein solubility values ranged between 80.07 <strong>and</strong><br />
82.91. Solubility was significantly higher (P 0.05) difference between the control<br />
<strong>and</strong> three types of buffalo meat chunks or hurdle treated<br />
1 2 3 4 5 6 7 8 9 10 11 12 13<br />
Figure 1 SDS-PAGE of proteins extracted from buffalo semitendinosus<br />
muscle during different stages of processing of shelf stable meat<br />
chunks Lane 1: Fresh meat, Lanes 2 & 3: Desorbed meat chunks<br />
processed with ISF-1, Lanes 4 & 5: Dried meat chunks processed with<br />
ISF-1, Lanes 6 & 7: Desorbed meat chunks processed with ISF-2,<br />
Lanes 8 & 9: Dried meat chunks processed with ISF-2, Lanes 10 & 11:<br />
Desorbed meat chunks processed with ISF-3, Lanes 12 & 13: Dried<br />
meat chunks processed with ISF-3.<br />
International Journal of Food Science <strong>and</strong> Technology 2010 Ó 2010 The Authors. Journal compilation Ó 2010 Institute of Food Science <strong>and</strong> Technology
meat chunks in flavour, juiciness, texture, saltiness <strong>and</strong><br />
overall palatability. However, the scores for appearance<br />
(Table 8) were significantly lower (P < 0.01) in control<br />
than three types of SBMs which did not differ significantly<br />
among themselves.<br />
Microbiological quality<br />
In all the three types of hurdle treated meat chunks, the<br />
growth of microbes viz. total plate counts, yeast <strong>and</strong><br />
moulds <strong>and</strong> Staphylococcus aureus was neither detected<br />
in the meat chunks after desorption which included<br />
pasteurisation of meat chunks in infusion solution nor<br />
after completion of drying at 80 °C for 2½ h.<br />
Discussion<br />
The procedure for the development of shelf stable meat<br />
chunks was st<strong>and</strong>ardised <strong>and</strong> various control parameters<br />
were established in the preliminary studies, the<br />
details of which have been presented in materials <strong>and</strong><br />
methods. The information on this type of shelf stable<br />
buffalo meat chunks is very scanty. However, an<br />
attempt has been made to compare, wherever possible,<br />
the present findings with the available literature on some<br />
other shelf stable meats.<br />
St<strong>and</strong>ardisation of processing steps<br />
Pasteurisation<br />
The pasteurisation at 80 °C for 20 min gave the desirable<br />
<strong>and</strong> superior results (Table 3) than other timetemperature<br />
combinations. After pasteurisation, total<br />
plate count of only log 0.88 was detected out of initial<br />
mean log of 4.5. In a large number of microbial<br />
population cells differ in heat resistance (Jay, 1986)<br />
besides some cells may become heat resistant due to<br />
excretion of protective substances. Further, some of the<br />
surviving colonies could be sub lethally damaged spores<br />
(Fern<strong>and</strong>ez et al., 1994). This type of pasteurisation or<br />
mild heating for killing of vegetative cells during<br />
desorption of meat chunks has been also carried by<br />
Obanu et al. (1975), Webster et al. (1986) <strong>and</strong> Okonkwo<br />
et al. (1992).<br />
Formulation of infusion solutions<br />
Three infusion solutions were formulated which would<br />
give desired water activity while maintaining the<br />
texture <strong>and</strong> flavour of meat chunks. Most of the<br />
workers have used very high levels of glycerol to<br />
achieve desired water activity (Brockman, 1973; Obanu<br />
et al., 1975, 1976; Webster et al., 1986; Okonkwo et al.,<br />
1992). Propylene glycol has been used at 0.3–5.0%<br />
level (Kaplow & Hallik, 1972; Muguruma et al., 1987)<br />
while sugars-sucrose or sorbitol have also been used at<br />
high levels to achieve the desired water activity.<br />
Hurdle treatments of Buffalo meat A. H. Malik <strong>and</strong> B. D. Sharma 1559<br />
However, very high levels of glycerol may give sweet<br />
taste (Ledward, 1981) while propylene glycol may give<br />
bitter after taste (Bone, 1973). Sodium chloride at<br />
higher levels has palatability problem. It has physiological<br />
implications as well in consumers (Ledward,<br />
1981). Sugars will naturally give a sweet taste at higher<br />
levels. Conventional sucrose was replaced by 0–2%<br />
honey because honey contains fructose as sugar <strong>and</strong><br />
has been reported to possess antibiotic property<br />
(Sheikh et al., 1995). The concentrations of sorbic acid<br />
<strong>and</strong> sodium nitrite were kept constant in all formulations<br />
so that effects due to combination of humectants<br />
could be evaluated.<br />
Drying of meat chunks<br />
The moisture (65.810) content (Table 4) <strong>and</strong> water<br />
activity (0.946) of meat chunks after desorption in<br />
infusion solution were still very high which could not<br />
ensure the stability of meat chunks. Hence, drying was<br />
taken up at 80 °C to reduce moisture to nearly 50% <strong>and</strong><br />
water activity to
1560<br />
Hurdle treatments of Buffalo meat A. H. Malik <strong>and</strong> B. D. Sharma<br />
nen et al., 1970). Similar effect was observed in meat<br />
chunks, treated with three infusion solution formulations<br />
after drying for 2½ h at 80 °C. The shelf stable<br />
meat chunks did not differ significantly in the pH values<br />
because pH of the infusion solution containing meat<br />
chunks was adjusted with lactic acid uniformly to 5.0 in<br />
all the three formulations. The final pH of finished<br />
product ranged from 5.62 to 5.67 which is close to the<br />
range of 5.40–5.90 reported for such products by Chirife<br />
et al. (1979).<br />
Moisture<br />
The significant decrease in moisture content of meat<br />
chunks after desorption (Table 6) was a direct effect of<br />
solutes or humectants to equilibrate the water activity of<br />
the solution <strong>and</strong> the meat components. Higher concentration<br />
of solutes in ISF-1 caused significantly higher<br />
moisture loss in meat chunks than other two infusion<br />
solutions.<br />
The significantly higher moisture content in SBM<br />
processed with ISF-2 may be due to higher concentration<br />
of volatile propylene glycol (Sloan & Labuza,<br />
1975). After the SBM chunks were rehydrated in potable<br />
water at room temperature for 2 h there was increase in<br />
moisture content of all the three samples in direct<br />
proportion to the initial glycerol content (Table 6).<br />
Glycerol has been reported to maintain the muscle<br />
structure near to fresh meat <strong>and</strong> prevent protein<br />
denaturation (Muguruma et al., 1987) <strong>and</strong> thereby<br />
showing better rehydration.<br />
Sodium chloride (common salt)<br />
Desorbed meat chunks had absorbed salt in proportion<br />
to its concentration in three infusion solutions accounting<br />
for the significant differences among the meat<br />
chunks. Due to concentration of solutes in drying, the<br />
salt concentration further increased in the shelf stable<br />
buffalo meat chunks. However, after rehydration of<br />
SBM in potable water for 2 h before cooking, some of<br />
the salt leached out into the rehydrating fluid thereby<br />
decreasing the salt content (Table 6) of meat chunks to<br />
near normal seasoning level of 2–2.5%. Of course slight<br />
variation in salt level acceptability is common as a<br />
matter of personal preference (Pearson & Tauber, 1985).<br />
Salt levels in the products processed by the present<br />
technique were far less than reported by Prabhakar &<br />
Ramamurthi (1990).<br />
Effect of different infusion solution formulations on the<br />
quality of shelf stable buffalo meat chunks (SBM)<br />
Yield<br />
The significantly higher yield (Table 7) in the shelf stable<br />
buffalo meat chunks processed with ISF-1 may be<br />
possibly due to the diffusion of more solutes in this<br />
product as compared to others.<br />
Water activity<br />
The significantly lower water activity of SBM treated<br />
with ISF-1 than the other two may be due to the high<br />
solute concentration in the infusion solution 1 especially<br />
that of glycerol which has better water binding <strong>and</strong><br />
water activity lowering properties. The significantly<br />
higher water activity in the SBM treated with ISF-3<br />
may be due to relatively less concentration of sodium<br />
chloride <strong>and</strong> propylene glycol.<br />
Proximate composition<br />
The proximate composition of fresh buffalo meat<br />
(Table 7) was similar to that reported for buffalo meat<br />
by Padda et al. (1986). Since moisture content decreased<br />
due to desorption <strong>and</strong> drying, concentration of constituents<br />
such as fat, protein <strong>and</strong> ash had a proportionate<br />
increase in the product.<br />
Shear force value<br />
Fresh meat had significantly lower shear force value<br />
than the shelf stable buffalo meat chunks (Table 7)<br />
which may perhaps be due to the effect of drying on<br />
SBM. Similar results were reported by Okonkwo et al.<br />
(1992). The shear force value of SBM processed with<br />
ISF-1 were significantly lower than the other two<br />
possibly because the former had more glycerol concentration<br />
which is reported to give soft texture (Ledward,<br />
1982; Muguruma et al., 1987; Okonkwo et al., 1992).<br />
Nitrite<br />
The residual nitrite content in all the samples was very<br />
low (19.48–20.68 ppm). This has been explained by<br />
Cassens et al. (1979) as 5–15% complexes with myoglobin,<br />
1–10% becomes free nitrate, 5–20% remains as free<br />
nitrite, 1–5% is evolved as gas <strong>and</strong> 26–50% forms<br />
sulphahydryl, lipid <strong>and</strong> protein complexes. Jay (1986)<br />
also reported that heating causes decrease in nitrite level.<br />
Though nitrite was added in equal quantity in all the<br />
infusion solution formulations, SBM processed with<br />
ISF-1 had significantly higher nitrite content. It is quite<br />
possible that this particular humectant combination<br />
might have helped in retention of more nitrite.<br />
Protein solubility<br />
It was also significantly higher in SBM processed with<br />
ISF-1 than the other two (Table 7). This may be due to<br />
its higher glycerol content than the other two as glycerol<br />
has been reported to give increased protein solubility in<br />
such meats (Okonkwo et al., 1992). The protein solubility<br />
values of 80.07–82.91 in this case are comparable<br />
with 79.0–82% reported for IMM beef by Webster et al.<br />
(1986) <strong>and</strong> 80% by Okonkwo et al. (1992).<br />
Total haem pigments<br />
The total meat pigments had significantly increased in<br />
all the SBM than the fresh meat (Table 7) due to loss of<br />
International Journal of Food Science <strong>and</strong> Technology 2010 Ó 2010 The Authors. Journal compilation Ó 2010 Institute of Food Science <strong>and</strong> Technology
moisture during drying. These findings are in agreement<br />
with Okonkwo et al. (1992) in IMM beef.<br />
Thiobarbituric acid value<br />
The significant increase in TBA value in all the three<br />
SBM products from the fresh meat level may be due to<br />
several factors such as desorption heating (Yamauchi,<br />
1972; Dunlavy & Lamkey, 1995), prooxidant effect of<br />
salt (Torres et al., 1994) <strong>and</strong> low water activity (Torres<br />
et al., 1994). However, the values were still below the<br />
threshold limit of 1–2 mg kg )1 (Watts, 1962).<br />
Sodium dodecyl sulphate polyacrylamide gel<br />
electrophoresis (SDS-PAGE)<br />
Protein pattern (Fig. 1) of fresh meat (control) Lane 1<br />
indicates that fresh meat contains number of proteins<br />
varying in molecular weight ranges from smaller molecular<br />
weight to higher molecular weight. The small<br />
molecular weight range proteins might have been<br />
produced due to proteolytic cleavage of large proteins<br />
as no antiproteolytic agent was included during extraction<br />
of proteins from fresh meat. So, many b<strong>and</strong>s<br />
appeared in the gel with Rf values from 0.080 to 0.863.<br />
The high molecular weight proteins seem to be myosin<br />
heavy chain, light chain etc. After desorption of meat<br />
chunks with infusion solution-1 (ISF-1) (Lane 2–3) no<br />
difference was observed between this <strong>and</strong> protein pattern<br />
of fresh meat (Lane 1).<br />
When the meat chunks processed with ISF-1 were<br />
dried at 80 °C for 2½ h (Lane 4–5) some of the medium<br />
<strong>and</strong> low molecular weight proteins disappeared. The loss<br />
of these proteins might be due to coagulation or other<br />
chemical changes produced by heating.<br />
In proteins extracted from meat chunks desorbed in<br />
ISF-2 (Lane 6–7) few b<strong>and</strong>s were not observed as<br />
compared to b<strong>and</strong>s in Lane 2–3 (for meat desorbed in<br />
ISF-1) <strong>and</strong> Lane 1 representing fresh meat. This might<br />
be perhaps due to the comparatively higher concentrations<br />
of sodium chloride <strong>and</strong> very low concentrations of<br />
glycerol in this infusion solution as glycerol has been<br />
reported to give protection to the muscle protein against<br />
denaturation <strong>and</strong> proteolysis <strong>and</strong> thus maintaining<br />
fresh meat like characteristics (Muguruma et al.,<br />
1987). When meat chunks processed with ISF-2 were<br />
subjected to drying at 80 °C for 2½ h, there was not<br />
much difference (Lane 8–9) in protein pattern from its<br />
desorbed stage (Lane 6–7) except for the disappearance<br />
of few low molecular weight b<strong>and</strong>s. In comparison to<br />
protein pattern of dried meat processed with ISF-1<br />
(Lane 4–5), there was not much loss of protein b<strong>and</strong>s in<br />
this case.<br />
Protein pattern of meat desorbed in ISF-3 (Lane 10–<br />
11) shows some less b<strong>and</strong>s especially in the upper half of<br />
gel as compared to protein pattern obtained at similar<br />
stage in meat processed with ISF-1 (Lane 2–3) <strong>and</strong> ISF-<br />
Hurdle treatments of Buffalo meat A. H. Malik <strong>and</strong> B. D. Sharma 1561<br />
2 (Lane 6–7). This difference may be due to difference in<br />
composition of infusion solutions. After drying of meat<br />
chunks processed with ISF-3, there was some loss of<br />
protein b<strong>and</strong>s (Lane 12–13) comparable to similar stage<br />
in meat processed with ISF-2 (Lane 8–9) except that few<br />
b<strong>and</strong>s of low molecular weight which disappeared in<br />
case of meat processed with ISF-2 were present in the<br />
former suggesting that processing with ISF-3 had better<br />
stability at drying than ISF-1 <strong>and</strong> ISF-2.<br />
Sensory attributes<br />
Sensory evaluation of shelf stable buffalo meat chunks<br />
did not differ significantly (Table 8) either among<br />
themselves or with the control cooked in the same<br />
ways. This shows all the SBM had almost equal<br />
acceptability. The significantly higher sensory scores of<br />
appearance (very good to excellent) of all the SBM can<br />
be attributed to their cured meat colour. In general,<br />
sensory scores of SBM processed with ISF-3 were<br />
slightly higher (Table 8) than others. Some panellists<br />
also recorded sweet taste in SBM processed with other<br />
two infusion solution formulations. In fact, sensory<br />
scores for flavour, juiciness, texture, saltiness <strong>and</strong> overall<br />
palatability of control as well as all the SBM were<br />
between moderate to very desirable.<br />
Microbiological quality<br />
The absence of total plate count, yeast <strong>and</strong> moulds <strong>and</strong><br />
Staphylococcus aureus after desorption (including pasteurisation)<br />
<strong>and</strong> drying indicates that combined effect of<br />
low water activity, preservatives, low pH <strong>and</strong> mild heat<br />
treatment (pasteurisation) had killed the vegetative cells<br />
<strong>and</strong> inactivated or caused sub lethal damage to the<br />
spores. Drying at 80 °C for 2½ h might have further<br />
damaged the spores resulting in absence of microbial<br />
growth below detection level. This sub lethal damage of<br />
spores (Leistner, 1985) <strong>and</strong> Perigo factor might have<br />
produced a combined effect (Perigo & Roberts, 1968).<br />
Conclusions<br />
With the application of hurdle technology, it was<br />
possible to prepare shelf stable buffalo meat chunks<br />
with good to very good acceptability The pasteurisation<br />
⁄ mild heating of meat chunks in infusion solution for<br />
20 min at 80 °C was enough to give a hurdle effect to<br />
achieve a product with good microbiological quality. A<br />
drying process of 2½ h at 80 °C was enough to give a<br />
product with water activity 0.90–0.91 <strong>and</strong> moisture<br />
52.0%. Before pressure cooking, a rehydration process<br />
of 2 h in potable water was found enough to equate<br />
these chunks to near fresh meat status with respect<br />
to sensory attributes. The products shall have the<br />
practical application as no refrigeration is required for<br />
Ó 2010 The Authors. Journal compilation Ó 2010 Institute of Food Science <strong>and</strong> Technology International Journal of Food Science <strong>and</strong> Technology 2010
1562<br />
Hurdle treatments of Buffalo meat A. H. Malik <strong>and</strong> B. D. Sharma<br />
transportation <strong>and</strong> storage <strong>and</strong> therefore can be used in<br />
areas of no electricity facilities. The storage studies shall<br />
be dealt in a separate paper.<br />
Acknowledgment<br />
The authors duly acknowledge the financial <strong>and</strong> technical<br />
support of the Director Indaian Veterinary<br />
Research Institute Izatnagar Bareilly India<br />
References<br />
Anon (2008). Ministry of Food Processing Annual report 2007–2008<br />
Government of India Source. http:www.indian business.nic.in/<br />
industry-infrastructure/industrial – sectors/food-process.htm (last<br />
accessed 3 July 2009)<br />
AOAC (1995). Official Methods of Analysis. 17th edn. Washington,<br />
DC: Association of Analytical Chemists.<br />
APHA (1984). Microbiological tests for sanitation of equipment. In:<br />
Compendium of Methods for the Microbiological Examination of<br />
Foods 2nd edn. (edited by M.L. Speck). Pp. 310–330. Washington,<br />
DC: Am. Pub. Health Assoc.<br />
Bone, D. (1973). Water activity in intermediate moisture foods. Food<br />
Technology, 27, 71.<br />
Brockman, M.C. (1973). Intermediate Moisture Foods. In: Food<br />
dehydration (edited by W.B. Van Arsdel, M.J. Copley & A.I.<br />
Morgan Jr). Pp. 489–505. Westport. Connecticut: The AVI publishing<br />
Co. Vol. 2.<br />
Cassens, R.G., Greaser, M.L., Ito, T. & Lee, M. (1979). Reactions of<br />
nitrite in meat. Food Technology, 33, 46–57.<br />
Chirife, J., Scorza, O.C., Maria, S., Vigo, M.H., Bertoni, M.H. &<br />
Caltaneo, P.C. (1979). Preliminary studies on the storage stability of<br />
intermediate moisture beef formulated with various water binding<br />
agents. Journal of Food Technology, 14, 421–428.<br />
Cook, D.J. (1975). Intermediate moisture foods. Nutrition <strong>and</strong> Food<br />
Science, 40, 20–21.<br />
DGCI&S (Directorate General of Commercial Intelligence <strong>and</strong><br />
Statistics) Ministry of Commerce <strong>and</strong> Industries Government of<br />
India (2006). Export of meat <strong>and</strong> meat products. In: Compendium of<br />
National Workshop cum Seminar on Commercial Goat <strong>and</strong> Sheep<br />
(edited by M.K. Agnihotri). Pp. 127–130. DGCI&S. Cited by<br />
Nayyar, S. S (2006). Farmer- Industry –Researcher Interface. Held<br />
on 4–5 March 2006 at CIRG Makhdoom UP India. Published by<br />
CIRG Makhdoom (ICAR), U.P, India.<br />
Dunlavy, K.A. & Lamkey, J.W. (1995). Dextrose level <strong>and</strong> oven<br />
temperature effects on warmed-over flavour development in beef top<br />
round roasts. Journal of Muscle Foods, 6, 63 [Food Science <strong>and</strong><br />
Technology Abstracts, 27,5S 57].<br />
Dymsza, H.S. & Silverman, G. (1979). Improving the acceptability of<br />
intermediate moisture fish. Food Technology, 33, 52–53.<br />
Fern<strong>and</strong>ez, S.J., Gomez, R. & Carmona, M.A. (1994). Water activity<br />
of Spanish intermediate moisture meat products. Meat Science, 38,<br />
341–346.<br />
Food <strong>and</strong> Agriculture Organisation (2005). Food <strong>and</strong> Agriculture<br />
Organisation Production Data Year Book for the Year 2006. Pp. 1–<br />
39. Published by FAO United Nations, NHBS Environment book<br />
studio, FAO Rome, Italy. Food <strong>and</strong> Agriculture Organisation.<br />
Hornsey, H.C. (1956). The colour of cured pork. 1. Estimation of nitric<br />
oxide-haem pigments. Journal of the Science of Food <strong>and</strong> Agriculture,<br />
7, 54–58.<br />
Jay, J.M. (1986). Modern Food Microbiology. 3rd edn. Pp. 41, 69, 437–<br />
453. Delhi: CBS Publishers & Distributors.<br />
Kaplow, M. & Hallik, J. (1972). Determination of moisture content in<br />
Glycerol-containing Intermediate Moisture Foods. U.S.Patent:<br />
3,694,233. Sept. 26.<br />
Keller, J.E., Skelly, G.C. & Acton, J.C. (1974). Effect of meat particle<br />
size <strong>and</strong> casing diameter changes on summer sausage properties<br />
during drying. Journal of Milk <strong>and</strong> Food Technology, 37, 297–300.<br />
Koniecko, E.S. (1979). H<strong>and</strong>book of meat chemists. Pp. 20–45. Wayne,<br />
New Jersey, U.S.A.: Avery Publishing Group Inc.<br />
Laakhonen, E., Wellington, G.H. & Sherbon, J.W. (1970). Low<br />
temperature, long time beating of bovine muscle. 1. Changes in<br />
tenderness, water binding capacity, pH <strong>and</strong> amount of water soluble<br />
components. Journal of Food Science, 35, 175–177.<br />
Laemmli, U.K. (1970). Cleavage of structural proteins during the<br />
assembly of the head of bacteriophage T4. Nature, 227, 680–685.<br />
Ledward, D.A. (1981). Intermediate moisture meats. In: Developments<br />
in Meat Science 2nd edn. (edited by R. Lawrie). Pp. 159–194.<br />
London: Applied Science Publishers.<br />
Leistner, L. (1985). Hurdle technology applied to meat products of the<br />
shelf stable product <strong>and</strong> intermediate moisture food types. In:<br />
Properties of Water in Foods (edited by D. Simatos & J.L. Multon).<br />
Pp. 309–330. Boston: Martinus Nijhoff Publishers.<br />
Lerici, C.R., Piva, M. & Rosa, M.D. (1983). Water activity <strong>and</strong><br />
freezing point depression of aqueous solutions <strong>and</strong> liquid foods.<br />
Journal of Food Science, 48, 1667–1669.<br />
Madovi, P.B. (1980). Changes in the free NH 2-free CO 2H <strong>and</strong><br />
titratable acidity of meat proteins. Journal of Food Technology, 15,<br />
311–318.<br />
Muguruma, M., Nishimura, T., Umetsu, Raizaburo., Goto, I. &<br />
Yamaguchi, M. (1987). Humectants improve myosin extractability<br />
<strong>and</strong> water activity of raw cured intermediate moisture meats. Meat<br />
Science, 20, 179–194.<br />
Obanu, Z.A., Ledward, D.A. & Lawrie, R.A. (1975). The protein of<br />
intermediate moisture meat stored at tropical temperature: changes<br />
in solubility <strong>and</strong> electrophoretic pattern. Journal of Food Technology,<br />
10, 657–666.<br />
Obanu, Z.A., Biggin, R.J., Neale, P.J., Ledward, D.A. & Lawrie, R.A.<br />
(1976). The protein of intermediate moisture meat stored at tropical<br />
temperature: nutritional quality. Journal of Food Technology, 11,<br />
575–580.<br />
Okonkwo, T.M., Obanu, Z.A. & Ledward, D.A. (1992). Characteristics<br />
of some intermediate moisture smoked meats. Meat Science,<br />
31, 135–145.<br />
Padda, G.S., Sharma, B.D. & Sharma, N. (1986). Quality characteristics<br />
of buffalo meat. Buffalo Bulletin, 5, 27–29.<br />
Pearson, A.M. & Tauber, F.W. (1985). Ingredients utilised in meat<br />
curing. In: Processed Meats (edited by A.M. Pearson & F.W.<br />
Tauber). Pp. 46–54. Westport, Connecticut: AVI Publishing Co. Inc.<br />
Perigo, J.A. & Roberts, T.A. (1968). Inhibition of Clostridia by nitrite.<br />
Journal of Food Technology, 3, 91–94.<br />
Prabhakar, K. & Ramamurthi, R. (1990). A study on the preparation<br />
of intermediate moisture meat. Journal of Food Science <strong>and</strong><br />
Technology, 27, 162–164.<br />
Seman, D.L., Moody, W.G., Fox, J.D. & Gay, N. (1987). Influence of<br />
hot <strong>and</strong> cold boning on the palatability, textural <strong>and</strong> economic traits<br />
of restructured meat. Journal of Food Science, 52, 879–880.<br />
Shaikh, D., Shams-Uz-Zaman, S., Naqvi, B.S., Sheikh, R.M. &<br />
Ghulam, Ali. (1995). Studies on microbial activity of honey.<br />
Pakistan Journal of Pharmaceutical Sciences, 8, 51–62.<br />
Sloan, A.E. & Labuza, T.P. (1975). Investigating alternative humectants<br />
for use in foods. Food Product Development, 9, 75–88.<br />
Snedecor, G.W. & Cochran, W.G. (1967). Statistical Methods. 6th edn.<br />
Ames, Iowa: The Iowa State University Press.<br />
Syed, Z.K., Rao, D.N. & Ambla, B.L. (1995). Effect of lactic acid,<br />
ginger extract <strong>and</strong> sodium chloride on electrophoretic pattern of<br />
buffalo muscle proteins. Journal of Food Science <strong>and</strong> Technology, 32,<br />
224–227.<br />
Tarladgis, B.G., Watts, B.M., Younathan, M.T. & Duga, L. Jr (1960).<br />
A distillation method for the qualitative determination of malonaldehyde<br />
in rancid foods. Journal of the American Oil Chemists’<br />
Society, 37, 44–48.<br />
International Journal of Food Science <strong>and</strong> Technology 2010 Ó 2010 The Authors. Journal compilation Ó 2010 Institute of Food Science <strong>and</strong> Technology
Torres, E.A.F.S., Shimokomaki, M., Franco, B.D.G.M. & L<strong>and</strong>graf,<br />
M. (1994). Parameters determining the quality of charqui, an<br />
intermediate moisture meat product. Meat Science, 38, 229–234.<br />
Watts, B.M. (1962). Meat products. In: Symposium on Food Lipids <strong>and</strong><br />
Their Oxidation (edited by H.W. Shultz, E.A. Day & R.O.<br />
Sinnbubber). Pp. 202. Westport, CT: AVI Publishing Co. Inc.<br />
Webster, C.E.M., Allison, S.E., Adelakun, I.O., Obanu, Z.A. &<br />
Ledward, D.A. (1986). Reactivity of sorbate <strong>and</strong> glycerol in<br />
Hurdle treatments of Buffalo meat A. H. Malik <strong>and</strong> B. D. Sharma 1563<br />
intermediate moisture meat products. Food Chemistry, 21, 133–<br />
143.<br />
Yamauchi, K. (1972). Effect of heat treatment on the development of<br />
oxidative rancidity in meat <strong>and</strong> its isolated tissue fraction. Bulletin of<br />
the Faculty of Agriculture of Miyazaki University, 19, 147 [Food<br />
Science <strong>and</strong> Technology Abstracts]<br />
Ó 2010 The Authors. Journal compilation Ó 2010 Institute of Food Science <strong>and</strong> Technology International Journal of Food Science <strong>and</strong> Technology 2010
1564<br />
Original article<br />
Performance of different drying methods <strong>and</strong> their effects on the<br />
chemical quality attributes of raw cocoa material<br />
Tagro Simplice Guehi, 1 * Irié Bi Zahouli, 2 Louis Ban-Koffi, 2 Monké Adrien Fae 1 & Jean Gnopo Nemlin 2<br />
1 Unité de Formation et de Recherche des Sciences et Technologies des Aliments (UFR-STA), Université d’Abobo-Adjamé. 02 Bp 801 Abidjan 02<br />
Coˆ te d’Ivoire<br />
2 Station de Recherche et de Technologie, Centre National de Recherche Agronomique (SRT-CNRA). 08 BP 33 Abidjan 08 – Coˆ te d’Ivoire<br />
(Received 13 January 2010; Accepted in revised form 27 April 2010)<br />
Summary Studies were carried out to investigate the impact of different drying processes on the chemical quality traits<br />
of raw cocoa beans. The pH of less fermented cocoa is higher than the well-fermented cocoa’s. The sun-dried<br />
beans pH ranged from 4.5 to 5.5, while the pH of both oven- <strong>and</strong> mixed-dried beans was between 3.8 <strong>and</strong> 5.2.<br />
The sun-dried beans contained lower volatile acidity than oven-dried beans. Artificially dried beans resulted<br />
in higher free acidity content when compared to both sun- <strong>and</strong> mixed-dried beans. Ammonium nitrogen<br />
content in raw cocoa beans is not influenced by the drying methods. Free fatty acid content increases slowly<br />
but remains below the critical value of 1.75% whatever the drying processes. While oven-dried beans show<br />
the FFA content above 0.70% both of sun- <strong>and</strong> mixed-dried beans are associated with FFA content below<br />
0.70%.<br />
Keywords Chemical quality, cocoa, drying methods.<br />
Introduction<br />
Cocoa beans are the seeds from fruit pods of a tropical<br />
tree botanically known as Theobroma cacao L. (Family<br />
Sterculiaceae). Each pod contains 30–40 beans embedded<br />
in a mass of mucilaginous pulp within the pod. The<br />
bean pulp is rich in fermentable sugars, such as glucose,<br />
fructose <strong>and</strong> sucrose, <strong>and</strong> has a low pH of 3.0–3.5,<br />
mainly because of the presence of citric acid. Cocoa<br />
bean is the principal raw material of chocolate manufacture<br />
(Ardhana & Fleet, 2003). Theobroma cacao is<br />
grown mostly in the wet tropical forest climate which is<br />
within 20° of latitude of the equator at countries such as<br />
Coˆ te d’Ivoire, Ghana, Nigeria, Cameroon, Brazil,<br />
Equador, Papua New Guinea, Indonesia <strong>and</strong> Malaysia<br />
(Beckett, 1994). World production of cocoa beans was<br />
about 3 888 000 t in 2006 ⁄ 07 crop year, <strong>and</strong> nearly 70%<br />
of this quantity was produced in West Africa (World<br />
Cocoa Foundation, 2008). Cocoa is a crop that needs to<br />
be fermented <strong>and</strong> dried before export. The processing of<br />
cocoa beans consists of two major steps namely<br />
fermentation <strong>and</strong> drying (Wood & Lass, 1985). Fermentation<br />
<strong>and</strong> drying are both essential steps for the<br />
quality of final product. Upon harvesting of ripe cocoa<br />
*Correspondent: Fax: +22520374300;<br />
e-mail: g_tagro@hotmail.com<br />
International Journal of Food Science <strong>and</strong> Technology 2010, 45, 1564–1571<br />
pods, the beans <strong>and</strong> associated pulp are removed from<br />
the pod <strong>and</strong> subject to microbial fermentation as the<br />
first stage in preparation for chocolate production.<br />
Fresh cocoa beans are fermented for 5–7 days <strong>and</strong> dried<br />
immediately after fermentation to safe moisture level of<br />
7.5%. The importance of bean fermentation in contributing<br />
to chocolate quality has been recognised for over<br />
100 years, <strong>and</strong> numerous studies have been conducted in<br />
different countries to determine the microbial species<br />
associated with this process (Schwan et al., 1995). These<br />
fermentations are generally conducted as traditional,<br />
indigenous processes, the details of which have been well<br />
reviewed (Roelofsen, 1958; Lehrian & Patterson, 1983;<br />
Lopez & Dimick, 1995; Thompson et al., 2001). Microbial<br />
action during fermentation solubilises the pulp<br />
material surrounding the beans <strong>and</strong> produces a range of<br />
metabolic end-products (e.g. alcohols, organic acids)<br />
which diffuse into the beans to cause their death. These<br />
changes induce an array of biochemical reactions within<br />
the beans <strong>and</strong> generate the chemical precursors of<br />
chocolate flavour, aroma <strong>and</strong> colour (Lehrian & Patterson,<br />
1983; Jones & Jones, 1984; Hansen et al., 1998;<br />
Hashim et al., 1998; Thompson et al., 2001). During<br />
fermentation the temperature of the beans will rise from<br />
ambient to about 50–55 °C because of the exothermic<br />
oxidation reaction (Wood & Lass, 1985). After the end<br />
of fermentation, the moisture content of the whole<br />
doi:10.1111/j.1365-2621.2010.02302.x<br />
Ó 2010 CNRA-Université d’Abobo-Adjamé
eans is approximately 60% <strong>and</strong> this must be reduced to<br />
7–7.5% before the cocoa can be stored, sold, transported<br />
<strong>and</strong> exported to European countries. So the<br />
beans are dried immediately to avoid over fermentation,<br />
which could lead to product deterioration. Drying is<br />
usually carried out using natural sun <strong>and</strong> artificial hot<br />
air techniques (Mc Donald et al., 1981). Natural or<br />
artificial drying methods may be chosen, depending on<br />
characteristics of each species, the amount of harvested<br />
seeds, <strong>and</strong> on weather conditions prevailing after seeds<br />
were harvested. Natural cocoa bean drying is directly<br />
dependent on weather conditions. The disadvantage of<br />
the method lies in the need for intensive human labour<br />
<strong>and</strong> in turn leads to poor operational performance.<br />
Cocoa smallholders produce in small quantity would<br />
prefer sun drying, while for the bigger plantation the hot<br />
air (artificial) method is preferred (Wood & Lass, 1985).<br />
During drying, the cocoa beans undergo various chemical<br />
<strong>and</strong> biochemical changes that form the necessary<br />
flavour <strong>and</strong> aroma precursors needed during processing.<br />
Cocoa beans constitute an inexpensive fat source <strong>and</strong><br />
are the principal raw material of chocolate from Africa<br />
<strong>and</strong> both Central <strong>and</strong> South America (Tafuri et al.,<br />
2004). Nowadays, one of the most widespread concerns<br />
in advanced technological countries is food quality <strong>and</strong><br />
safety. The economy of most developing countries,<br />
based primarily on their agricultural resources, is<br />
strongly dependent on the often rigorous <strong>and</strong> rigid<br />
quality st<strong>and</strong>ards set by developed countries. Ivorian<br />
raw cocoa bean quality did not escape being degraded as<br />
the liberalisation of the cocoa-producing chain in 1999<br />
<strong>and</strong> the reasons were unspecified (DGTCP (Direction<br />
Ge´ne´rale du Tre´sor et de la Comptabilité Publique de<br />
Coˆ te d’Ivoire), 2004). Indeed, as this liberalisation <strong>and</strong><br />
dislocation of the Ivorian traditional control quality <strong>and</strong><br />
the cocoa producers framing system, agricultural practices<br />
varied on the region <strong>and</strong> sometimes on the<br />
producers in the same area. Thus, in Coˆ te d’Ivoire, it<br />
is difficult to talk about cocoa post harvest treatments.<br />
However, Guehi et al. (2008) have identified the<br />
common practices about fermentation <strong>and</strong> drying<br />
methods in Coˆ te d’Ivoire. The predominant processing<br />
of fermentation for Ivorian raw cocoa production<br />
consists of ferment beans in heaps in small farms or in<br />
wooden boxes in big farms without turning. In Coˆ te<br />
d’Ivoire, cocoa fermentation usually lasts between 4 <strong>and</strong><br />
5 days on weather conditions <strong>and</strong> time during the cocoa<br />
season. Fermentation generally takes shorter at the start<br />
<strong>and</strong> peak of the cocoa crop but longer towards the end<br />
of the crop when there is less mucilage available for<br />
fermentation. At the end of fermentation, Ivorian cocoa<br />
producers spread freshly fermented beans on a meshed<br />
wooden tray with area about 30–90 cm <strong>and</strong> raised 1 m<br />
above ground level, mats, polypropylene sheets or the<br />
concrete floor of a cocoa house each day to a depth of<br />
not less than 5 cm <strong>and</strong> mixed constantly to promote<br />
Performance of different drying methods T. S. Guehi et al. 1565<br />
uniform drying <strong>and</strong> to break agglomerates. Although<br />
sun drying is the preferred method for Ivorian producers,<br />
since some years artificial drying method is more<br />
<strong>and</strong> more employed in the big cocoa farms. Probably<br />
such variations in agricultural practices in Ivorian cocoa<br />
chain could be explained why the quality of Ivorian raw<br />
cocoa is more <strong>and</strong> more degraded. Therefore, it is<br />
important to identify the factors that reduce commercial<br />
value by studying the chemical quality of Ivorian beans<br />
resulted from different durations of fermentation <strong>and</strong><br />
dried by different drying processes. The objective of this<br />
study did not focus on postharvest h<strong>and</strong>ling <strong>and</strong><br />
technology processing of cocoa beans at the farmer’s<br />
level in Coˆ te d’Ivoire.<br />
This study aimed to evaluate the performance of some<br />
cocoa drying methods in terms of chemical quality of<br />
raw cocoa beans such as acidity (pH, free <strong>and</strong> volatile<br />
acidities, ammonium nitrogen contents <strong>and</strong> free fatty<br />
acids content) during fermentation.<br />
Materials <strong>and</strong> methods<br />
Cocoa<br />
The ripe cocoa pods (Theobroma cacao L.) of mixedhybrids<br />
were harvested by h<strong>and</strong> during the big 2005<br />
cocoa season (from December to February) in the<br />
experimental cocoa station of Centre National de<br />
Recherche Agronomique (CNRA) located at Bingerville<br />
region of Coˆ te d’Ivoire, a moderate hot rainy region<br />
with an average of 28–29 °C during the harvest season, a<br />
low altitude, below 500 m, 70–80 mm ⁄ month rainfall.<br />
2.2 Cocoa pod storage <strong>and</strong> breaking<br />
The cocoa pod storage time is 4 days at ambient<br />
temperature at the field. The pod storage time is the<br />
time that the pods were stored after harvesting but<br />
before breaking using a piece of wood billet as a<br />
bludgeon as reported earlier (Meyer et al., 1989). Pod<br />
breaking using wooden billet involves one or two sharp<br />
blows with the edge of the billet. The distal portion of<br />
the pod falls away <strong>and</strong> the beans remain attached to the<br />
placenta from which they can be easily extracted. The<br />
beans were removed from placenta being careful to<br />
exclude any germinated, black or diseased beans or<br />
pieces of shell or placenta fragments.<br />
Cocoa fermentation<br />
Cocoa beans were fractioned into seven same subsamples<br />
(about 25 kg). One type of fermentation was<br />
studied as reported earlier by Mounjouenpou et al.<br />
(2008): six boxes fermentation, where the beans of each<br />
fraction were put in banana leaves placed in wooden<br />
boxes measuring 35 · 35 · 35 cm 3 . Fermentation was<br />
Ó 2010 CNRA-Université d’Abobo-Adjamé International Journal of Food Science <strong>and</strong> Technology 2010, 45, 1564–1571
1566<br />
Performance of different drying methods T. S. Guehi et al.<br />
carried out in each box using 25 kg of fresh beans during<br />
1, 2, 3, 4, 5 <strong>and</strong> 6 days respectively for the boxes no. 1, 2,<br />
3, 4, 5 <strong>and</strong> 6. The heap of wet cocoa beans was then<br />
covered in the box with other fresh banana leaves <strong>and</strong><br />
other banana leaves were used to insulate the top of<br />
box. Initial turning during fermentation was done after<br />
48 h <strong>and</strong> additional turning 48 h thereafter to facilitate<br />
adequate aeration of fermenting mass <strong>and</strong> to ensure that<br />
beans from the top <strong>and</strong> bottom are thoroughly mixed<br />
together. A fresh layer of banana leaves were added to<br />
the original leaves after each turning to ensure adequate<br />
insulation. Fermentation experimentations were<br />
conducted triplicate.<br />
Drying methods<br />
After fermentation, cocoa beans were fractioned into<br />
three same parts. Fermented beans of each fraction were<br />
dried according to a specific method. All drying methods<br />
processing is stopped when the moisture content of<br />
cocoa beans reached 7–8%.<br />
Sun drying methods<br />
Natural or sun drying process consistent to expose<br />
cocoa beans from 9 am until to 6 pm (C9) is considered<br />
as st<strong>and</strong>ard drying method. So characteristics of dried<br />
beans resulted from both other experiments were compared<br />
against this sun-dried beans. Two batches, one of<br />
whom is respectively unfermented <strong>and</strong> fermented beans<br />
were separately spread thinly on a meshed wooden tray<br />
with area about 30–90 cm <strong>and</strong> raised 1 m above ground<br />
level <strong>and</strong> sun-dried until they reached moisture content<br />
of about 7%. The beans were mixed each 1 h to ensure<br />
uniformity.<br />
Artificial hot air drying methods<br />
Raw cocoa beans were artificially dried using an airventilated<br />
oven at temperature of 60 °C (EV34) until<br />
moisture content of 7% as reported (Hii et al., 2009).<br />
The beans were spread thinly in single layer (about<br />
2 cm thick) on a meshed sample tray with square<br />
openings. Heat was generated by the heater integrated<br />
into the side walls of the oven <strong>and</strong> the hot air flowed<br />
through the samples. The exhaust air escaped through a<br />
ventilation hole (diameter 4 cm) at the back of the<br />
oven. The beans were mixed every 2 h to ensure<br />
uniformity. Drying was conducted for 8 h daily, <strong>and</strong><br />
the beans were left to temper at room temperature<br />
overnight. The tempering step is a common routine in<br />
cocoa drying, <strong>and</strong> the purpose is to redistribute the<br />
internal moisture to the outer beans layer after each<br />
drying cycle.<br />
Combination of sun <strong>and</strong> artificial drying process<br />
The unfermented <strong>and</strong> fermented cocoa beans were dried<br />
by a mixed drying process consisting primarily sun<br />
drying from 9 am to 6 pm daily until moisture of 25%<br />
<strong>and</strong> consecutively by artificial drying process using an<br />
air-ventilated oven (C9 EV18) until moisture content of<br />
7%.<br />
Analytical methods<br />
Moisture content<br />
The beans used in each experiment were weighed prior<br />
to mixing during drying by using an analytical balance.<br />
The moisture content (%) of the beans was determined<br />
with reference to the dry weight of the beans as early<br />
reported (Guehi et al., 2007). The measurement was<br />
performed in triplicates.<br />
Chemical acidities <strong>and</strong> pH<br />
The methods used to quantify, volatile <strong>and</strong> free<br />
acidity, <strong>and</strong> ammonium nitrogen contents, <strong>and</strong> to<br />
determine pH were described by Pontillon & Cros<br />
(1998). Five grams of ground nibs was homogenised in<br />
45 ml boiled distilled water. The mixture was filtered<br />
with Whatman No. 4 filter paper <strong>and</strong> cooled to<br />
20–25 °C. The resulting filtrate was measured for pH<br />
using a pH meter (Consort P 107) which had been<br />
calibrated with buffers at pH 4 <strong>and</strong> 7 as described by<br />
Hii et al., 2009). A further 25-ml aliquot was titrated<br />
to an end point pH of 8.1 with 0.01 N solution of<br />
NaOH. Titratable acidity was calculated using the<br />
formula proposed by Hamid <strong>and</strong> Lopez (2000). The<br />
values reported as meq of sodium hydroxide per 1 g of<br />
dry nibs. Acidities were measured in triplicates to<br />
check the good fermentation <strong>and</strong> conservation of the<br />
samples.<br />
Free fatty acids content.<br />
About 15 g of dried cocoa beans were carefully shelled<br />
manually. Cocoa nibs were frozen in liquid nitrogen<br />
before finely grinding in a kitchen-scale coffee grinding<br />
(Moulinex, France) to the smallest particle (size<br />
< 500 lm). Ten grams of cocoa powder was put in<br />
Whatman cartridge <strong>and</strong> soaked in 350 ml of petroleum<br />
ether (Prolabo Normapur, type 40–60 °C) for one night.<br />
Cocoa butter was extracted on a Soxhlet apparatus for<br />
8 h. After eliminating the solvent in a rotary evaporator,<br />
FFA contents were quantified in triplicates by the<br />
official method 42-1993 (IOCCC, 1996) as reported<br />
earlier (Guehi et al., 2008).<br />
Statistical methods<br />
All analytical experiments treatments were conducted in<br />
three replicates. The experimental data were analysed by<br />
using one-way anova using the SAS software GLM<br />
procedure (SAS Institute, 2002) <strong>and</strong> mean comparison<br />
using the Newman–Keuls test at 95% confidence level<br />
(P < 0.05).<br />
International Journal of Food Science <strong>and</strong> Technology 2010, 45, 1564–1571 Ó 2010 CNRA-Université d’Abobo-Adjamé
pH<br />
6<br />
5<br />
4<br />
3<br />
2<br />
1<br />
0<br />
Day 0 Day 2 Day 4 Day 6<br />
Results <strong>and</strong> discussion<br />
Duration of fermentation (days)<br />
C9 EV34 C9EV18<br />
Figure 1 Effect of drying methods on pH of raw cocoa beans. C9: sun<br />
drying method EV34: artificial hot air drying method, C9EV18:<br />
combination of sun <strong>and</strong> artificial drying methods.<br />
Effect of drying methods on pH of raw cocoa material<br />
Figure 1 illustrates the influence of drying processes on<br />
the pH of raw cocoa beans. In term of pH, whatever the<br />
duration of fermentation process, comparison was also<br />
made against the sun-dried beans obtained from other<br />
experiments. For fresh beans (0 day fermentation) <strong>and</strong><br />
cocoa beans fermented during 2 <strong>and</strong> 4 days, the pH of<br />
mixed-dried beans is not significantly different from that<br />
of sun-dried beans except the day 6 fermented beans.<br />
The sun-dried beans pH ranged from 4.5 to 5.5, while<br />
for the oven- <strong>and</strong> mixed-dried beans registered pH was<br />
comprised between 3.8 <strong>and</strong> 5.2. The differences may be<br />
explained by several factors such as exposure times to<br />
drying air, drying air temperature, relative humidity in<br />
the drying site, nature of drying air flow <strong>and</strong> the speed<br />
with which moisture migrated from the inner cocoa<br />
beans structures to their surface as previously indicated<br />
by Franke et al. (2008). Indeed artificial <strong>and</strong> mixed<br />
drying processes are faster with little time needed for the<br />
cocoa beans to have their moisture reduced from about<br />
60% to around 8% than the natural drying process. So<br />
the pH value for sun-dried beans is usually higher (less<br />
acidic) than artificially <strong>and</strong> mixed-dried beans because<br />
of the slow <strong>and</strong> gentle drying process that enable the<br />
evaporation of more acetic acid (Hii et al., 2009). The<br />
lower pH of unfermented cocoa beans could be<br />
explained by the bean pulp which has a low pH of<br />
3.0–3.5, mainly because of the presence of citric acid<br />
(Ardhana & Fleet, 2003). Generally, the pH of fermented<br />
beans falls within the values reported for most<br />
dried cocoa beans. Indeed these results were not<br />
significantly different (P < 0.05) from the pH values<br />
of both best fermented beans sourced from West Africa<br />
which is around 5.5 (Franke et al., 2008) <strong>and</strong> the<br />
st<strong>and</strong>ard Malaysian estate beans, which is about 4.4–4.7<br />
(Nazaruddin et al., 2006). In conclusion, the pH of<br />
Ivorian cocoa beans resulted from each treatment was<br />
found to be acid as well as all current raw cocoa beans<br />
whatever the duration of fermentation.<br />
Effect of drying methods on volatile acidity of raw cocoa<br />
material<br />
The impact of drying processes on the volatile acidity of<br />
raw cocoa beans is shown in Fig. 2. The results show<br />
that the changes in volatile acidity content of cocoa<br />
beans depend on drying methods. Indeed sun-dried<br />
beans contain lower volatile acidity than oven-dried<br />
beans for both fresh beans <strong>and</strong> fermented beans. Solardried<br />
beans present a volatile content below 1.0 meq of<br />
NaOH ⁄ g while that of oven-dried beans ranged from<br />
1.0 to 2.4 meq of NaOH ⁄ g whatever the duration of<br />
fermentation. For the beans fermented during 6 days,<br />
the volatile acidity content of sun-dried beans is not<br />
significantly different from the content both of oven <strong>and</strong><br />
mixed-dried beans.<br />
Highest volatile acidity in beans fermented during<br />
2 days could be explained by the accumulation of acetic<br />
acid which is mainly produced through oxidation of<br />
ethanol in the presence of oxygen by acetic acid bacteria<br />
from the second day of fermentation processing (Hii<br />
et al., 2009). The lowest volatile acidity content in both<br />
sun- <strong>and</strong> mixed-dried beans is because of the fact that<br />
generally volatile acidity is removed as acetic acid from<br />
Volatile aicdity content<br />
(meq of NaOH per g)<br />
3<br />
2<br />
1<br />
0<br />
Performance of different drying methods T. S. Guehi et al. 1567<br />
Day 0 Day 2 Day 4 Day 6<br />
Duration of fermentation (days)<br />
C9 EV34 C9EV18<br />
Figure 2 Effect of drying methods on volatile acidity of raw cocoa<br />
beans. C9: sun drying method EV34: artificial hot air drying method,<br />
C9EV18: combination of sun <strong>and</strong> artificial drying methods.<br />
Ó 2010 CNRA-Université d’Abobo-Adjamé International Journal of Food Science <strong>and</strong> Technology 2010, 45, 1564–1571
1568<br />
Performance of different drying methods T. S. Guehi et al.<br />
fermented beans during a slow <strong>and</strong> gentle drying process<br />
as natural process contrary to artificial drying process<br />
which would dry faster <strong>and</strong> break the diffusion path of<br />
the acetic acid during moisture removal because of its<br />
high drying rate (Jinap et al., 1994a,b). Indeed during<br />
drying, acetic acid is evaporated off along with the<br />
moisture removal process because of its volatile nature.<br />
However, the lactic acids contained inside cannot be<br />
evaporated off as it is not a volatile compound (Hii<br />
et al., 2009).<br />
In conclusion, beans solar-dried from 9 am to 6 pm<br />
daily for 1 week <strong>and</strong> subsequently dried in an oven at<br />
60 °C were of comparable quality to sun-dried beans.<br />
Both of these were of better quality than beans oven-dried<br />
at 60 °C as previously concluded by Jinap et al. (1994a,b).<br />
A large number of reports have referred to the high acidity<br />
<strong>and</strong> poor flavour development of artificially dried beans<br />
compared to sun-dried beans with similar levels of<br />
fermentation (Shelton, 1967; Jinap et al., 1994a).<br />
Effect of drying methods on free acidity of raw cocoa<br />
material<br />
Figure 3 shows the effect of drying methods on free<br />
acidity of raw cocoa beans. The changes in free acidity<br />
content show that artificially dried beans have resulted<br />
in high acidity when compared to both sun- <strong>and</strong> mixeddried<br />
beans whatever the duration of fermentation.<br />
Indeed, artificially dried cocoa contains 2.5, 4.5, 4.2 <strong>and</strong><br />
3.4 meq of NaOH ⁄ g respectively for fresh beans <strong>and</strong><br />
beans fermented during 2, 4 <strong>and</strong> 6 days. If the fermentation<br />
is stopped after 4 days, there is a danger of a<br />
winning of acidity <strong>and</strong> flavour acidity (Chong et al.,<br />
1978; Duncan et al., 1989) because of the important<br />
Free acidity content (meq of NaOH per g)<br />
6<br />
5<br />
4<br />
3<br />
2<br />
1<br />
0<br />
Day 0 Day 2 Day 4 Day 6<br />
Duration of fermentation (days)<br />
C9 EV34 C9EV18<br />
Figure 3 Effect of drying methods on free acidity of raw cocoa beans.<br />
C9: sun drying method EV34: artificial hot air drying method,<br />
C9EV18: combination of sun <strong>and</strong> artificial drying methods.<br />
production of acetic acid in the presence of oxygen by<br />
acetic acid bacteria from the oxidation of ethanol<br />
initially produced by yeasts (Schwan & Wheals, 2004)<br />
<strong>and</strong> other organic acids such as lactic acid. The slight<br />
free acidity content of beans fermented during 2 days<br />
could be explained by the fact that biochemical changes<br />
in the sugar of the pulp around the beans lead to the<br />
formation of only the ethylic alcohol <strong>and</strong> not of acidic<br />
compound. Acidity of beans is influenced by several<br />
factors <strong>and</strong> fermentation method is known to be crucial.<br />
Meyer et al. (1989) found that fermentation in boxes has<br />
been shown to produce more acid beans than either<br />
heap or tray fermentation. The lower free acidity<br />
content in beans fermented during 6 days might be<br />
because of biochemical changes in the heap of fermented<br />
beans leading to the formation of slight concentration of<br />
lactic acid because of the turnings made at 48 <strong>and</strong> 96 h<br />
of fermentation causing the slowing of lactic bacteria<br />
growth, the probable loss of these acidities during<br />
fermentation by exudation of acidic liquid <strong>and</strong> not by<br />
chemical degradation (Jinap et al., 1994a). After all,<br />
most studies have shown that removal of moisture from<br />
beans increases their acidities (Hii et al., 2009). Free<br />
acidity content of mixed-dried beans is similar to the<br />
quality of sun-dried beans as previously found by Jinap<br />
et al. (1994a) which clearly demonstrated that beans air<br />
blown for 72 h <strong>and</strong> subsequently dried in an oven at<br />
60 °C were of comparable quality to sun-dried beans.<br />
Both of these cocoa were of better quality than beans<br />
oven-dried at 60 °C (Jinap et al., 1994a). As previously<br />
concluded, sun-dried beans <strong>and</strong> mixed-dried beans<br />
have resulted in low free acidity when compared to<br />
artificially dried beans because of the sun drying process<br />
sufficient time for the volatilisation of acids (acetic acid)<br />
from the beans <strong>and</strong> thereby reducing the acidity. Indeed,<br />
during drying, acetic acid is evaporated off along with<br />
the moisture removal process because of its volatile<br />
nature. However, the lactic acids contained inside<br />
cannot be evaporated off as it is not a volatile compound<br />
(Hii et al., 2009). So sun drying, if done properly,<br />
produces the best quality beans (Crespo, 1985). According<br />
to Bonaparte et al. (1998), this method, however, is<br />
inefficient <strong>and</strong> produces beans of inconsistent quality<br />
when drying conditions are unfavourable. Furthermore,<br />
it appears that drying of fermented beans at higher<br />
temperature such as artificially or oven drying process<br />
resulted in inferior quality cocoa with respect to beans<br />
acidity. High acidic beans are always associated with<br />
oven drying process.<br />
Effect of drying methods on ammonium nitrogen of raw<br />
cocoa material<br />
The effect of drying processes on ammonium nitrogen of<br />
raw cocoa material is presented in Fig. 4. Ammonium<br />
nitrogen content increases according to the duration of<br />
International Journal of Food Science <strong>and</strong> Technology 2010, 45, 1564–1571 Ó 2010 CNRA-Université d’Abobo-Adjamé
Ammonium nitrogen content<br />
(ppm)<br />
800<br />
700<br />
600<br />
500<br />
400<br />
300<br />
200<br />
100<br />
0<br />
Day 0 Day 2 Day 4 Day 6<br />
Duration of fermentation (days)<br />
C9 EV34 C9EV<br />
Figure 4 Effect of drying methods on Ammonium Nitrogen of raw<br />
cocoa beans. C9: sun drying method EV34: artificial hot air drying<br />
method, C9EV18: combination of sun <strong>and</strong> artificial drying methods.<br />
fermentation whatever the drying method. Low ammonium<br />
nitrogen content is expected to the short duration<br />
of fermentation especially in the early stages, <strong>and</strong> high<br />
ammonium nitrogen content is found in cocoa beans<br />
fermented during long duration. Indeed ammonium<br />
nitrogen content varies from about 200 to above<br />
600 ppm from the beginning to the end of fermentation.<br />
These observations demonstrate clearly that drying<br />
methods show no significant differences in ammonium<br />
nitrogen content because of the fact that ammonium<br />
nitrogen is not a volatile compound. However, ammonium<br />
nitrogen might be produced during fermentation<br />
from the degradation of cocoa beans nitrogen compounds,<br />
such as total polyphenols, flavonoids, epicatechin,<br />
catechin; the formation of precursors of pyrazines<br />
(Jinap et al., 1994b; Hashim et al., 1997); <strong>and</strong> the<br />
proteolysis of proteins <strong>and</strong> the oxidation of amino acids<br />
<strong>and</strong> peptides by the suppression of nitrogen under the<br />
control of amino acid oxidase <strong>and</strong> glutamine synthesis<br />
enzyme. The presence of relative high concentration of<br />
ammonium nitrogen in all samples could be because of<br />
the storage of cocoa pods during 4 days before breaking<br />
<strong>and</strong> to the boxes fermentation method. In addition<br />
probably, long duration of fermentation could lead to<br />
the production of much ammonium nitrogen through<br />
amino acid oxidase enzymes activities as previously<br />
described by Jinap et al. (1994a) <strong>and</strong> glutamine synthesis<br />
enzyme <strong>and</strong> then cocoa beans becomes dark in<br />
appearance. These enzymes activities originated from<br />
both endogenous source (beans) <strong>and</strong> microbial source<br />
such us Bacillus sp. could generate ammonium nitrogen<br />
during fermentation (Jinap et al., 1994b).<br />
Effect of drying methods on free fatty acids of raw cocoa<br />
material<br />
Free fatty acids (FFA) content increases slowly but<br />
remains below the critical value of 1.75% in cocoa beans<br />
Free fatty acids content ( )<br />
2.00<br />
1.80<br />
1.60<br />
1.40<br />
1.20<br />
1.00<br />
0.80<br />
0.60<br />
0.40<br />
0.20<br />
0.00<br />
Performance of different drying methods T. S. Guehi et al. 1569<br />
Day 0 Day 2 Day 4 Day 6<br />
Duration of fermentation (days)<br />
C9 EV34 C9EV18<br />
Figure 5 Effect of drying methods on free fatty acids of raw cocoa<br />
beans. C9: sun drying method EV34: artificial hot air drying method,<br />
C9EV18: combination of sun <strong>and</strong> artificial drying methods.<br />
whatever the duration of fermentation (Fig. 5). FFA<br />
content varies from 0.4% to 1% for both fresh <strong>and</strong><br />
fermented cocoa beans. Among three dried samples<br />
studied, oven-dried cocoa beans show higher FFA<br />
content than both solar- <strong>and</strong> mixed-dried beans. Indeed<br />
artificial drying process leads to the FFA content above<br />
0.70%, while both sun <strong>and</strong> mixed drying processes<br />
produce raw cocoa beans with FFA content below<br />
0.70%. Slighter increasing in changes FFA depending<br />
on the fermentation duration indicates no significant<br />
difference (P < 0.05) within fermented cocoa beans. So<br />
limitation of cocoa beans fermentation duration to<br />
6 days does not seem to be critical to increase the<br />
chances for FFA formation. FFA content of mixeddried<br />
beans is similar to the quality of sun-dried beans<br />
demonstrating that beans air blown for 7 days <strong>and</strong><br />
subsequently dried in an oven at 60 °C were of comparable<br />
quality to sun-dried beans. Both of these cocoas<br />
were of better quality than beans oven-dried at 60 °C.<br />
This result is probably because of the break of triglycerides<br />
obtained from the liquefaction <strong>and</strong> the diffusion<br />
of cocoa butter during the faster process of oven drying<br />
method. Higher variations of FFA content corresponding<br />
high st<strong>and</strong>ard deviations observed in the same cocoa<br />
beans sample are probably because of a high heterogeneity<br />
of beans qualities <strong>and</strong> certainly to the growth of<br />
some lipolytic fungi such as Mucor sp. <strong>and</strong> Rhizopus sp.<br />
Indeed circumstantial evidence presented the FFA<br />
formation in cocoa beans is because of microbial<br />
enzymatic activities in the combination with certain<br />
factors such as the quality <strong>and</strong> the physical integrity of<br />
beans <strong>and</strong> not to endogenous plant lipases as previously<br />
demonstrated by Gue´not et al. (1976) <strong>and</strong> Guehi et al.<br />
Ó 2010 CNRA-Université d’Abobo-Adjamé International Journal of Food Science <strong>and</strong> Technology 2010, 45, 1564–1571
1570<br />
Performance of different drying methods T. S. Guehi et al.<br />
(2008). Microbial lipase activities hydrolysed the ester<br />
bonds between fatty acids <strong>and</strong> hydroxyl functions of<br />
glycerol in triglycerides of cocoa butter <strong>and</strong> liberated<br />
free fatty acids which content increased. As the quality<br />
of our beans <strong>and</strong> their integrity were high, a little<br />
amount of free fatty acid was formed. Indeed, whatever<br />
the drying process, cocoa beans resulted showed FFA<br />
content below critical content of 1.75% according to<br />
European directive (EEC, 1973). According to Gue´not<br />
et al. (1976), high FFA contents above 1.75% were<br />
mostly observed in poor-quality raw cocoa beans. This<br />
observation confirms that all samples obtained from our<br />
study are of best quality in term of FFA content <strong>and</strong><br />
indicates clearly that any appropriate cocoa drying<br />
processing do not have an appreciable impact on FFA<br />
formation.<br />
Conclusion<br />
Although drying processes has shown no great effect on<br />
ammonium nitrogen <strong>and</strong> free fatty acids formation in<br />
cocoa beans, the changes in acidic characteristics such as<br />
pH, free <strong>and</strong> volatile are largely dependent on the drying<br />
methods. Among cocoa samples resulted from our<br />
study, sun-dried beans <strong>and</strong> beans air blown for 7 days<br />
<strong>and</strong> subsequently dried in an oven at 60 °C were of<br />
better quality than beans oven-dried at 60 °C. So sun<br />
drying method of cocoa beans is best for optimal<br />
quality. Fermentation duration has a significant impact<br />
on the formation of ammonium nitrogen which originated<br />
from the decomposition of polyphenol compounds.<br />
The results obtained from this study are<br />
essential in underst<strong>and</strong>ing <strong>and</strong> solving the problems<br />
associated with the quality of raw cocoa beans material.<br />
Further research is needed to carry out the effect of the<br />
storage time before breaking pods <strong>and</strong> their sanitary<br />
quality on physico-chemical <strong>and</strong> microbial quality<br />
attributes of industrial raw cocoa material aimed to<br />
improve globally the quality of raw cocoa beans sourced<br />
from Coˆ te d’Ivoire.<br />
Acknowledgments<br />
This research was supported by Centre National de<br />
Recherches Agronomiques (CNRA) cocoa program of<br />
Coˆ te d’Ivoire. The authors are grateful particularly to<br />
Dr. Firmin ABOUA, Senior Researcher <strong>and</strong> to the<br />
support given by the Unity of Research <strong>and</strong> Formation<br />
in Food Sciences <strong>and</strong> Technologies (UFR-STA) of<br />
Universite´ d’Abobo-Adjame´.<br />
References<br />
Ardhana, M.M. & Fleet, G.H. (2003). The microbial ecology of cocoa<br />
bean fermentations in Indonesia. International Journal of Food<br />
Microbiology, 86, 87–99.<br />
Beckett, S.T. (1994). Industrial Chocolate Manufacture <strong>and</strong> Use, 2nd<br />
edn. Blacki Academic & Professional, Glasgow.<br />
Bonaparte, A., Alikhani, Z., Madramootoo, C.A. & Raghavan, V.<br />
(1998). Some Quality Characteristics of Solar-Dried Cocoa Beans in<br />
St Lucia. Journal of the Science of Food <strong>and</strong> Agriculture, 76, 553–558.<br />
Chong, C.F.Shepherd, R. & Poon, Y.C. (1978). Mitigation of cocoa<br />
bean acidity – Fermentary investigations. In: Cocoa Biotechnology<br />
(edited by P.S. Dimick). Pp. 387–414. Department of Food Science.<br />
Pennsylvania State University, USA.<br />
Crespo, S. (1985). Judging the quality of cocoa beans. The Manufact<br />
Confectioner, May, 59–63.<br />
DGTCP (Direction Générale du Trésor et de la Comptabilité Publique<br />
de Coˆ te d’Ivoire) (2004) Commercialisation du cacao: La Coˆ te<br />
d’Ivoire s’apprête à relever le de´fi de la certification. Article 140<br />
online http://www.tresor.gov.ci/actualités. Accessed 08 ⁄ 02 ⁄ 2006.<br />
Duncan, R.J.E., Godfrey, G., Yap, T.N., Pettipher, G.L. & Tharumarajah,<br />
T. (1989). Improvement of Malaysian cocoa bean flavour<br />
by modification of harvesting, fermentation <strong>and</strong> drying methods –<br />
The Sime – Cadbury Process. Cocoa Growers’ Bulletin, 42, 43–57.<br />
EEC (1973). Directive 73 ⁄ 241 ⁄ EEC by European Parliament <strong>and</strong> the<br />
European Council relating to cocoa <strong>and</strong> chocolate products<br />
intended for human consumption. Official Journal of the European<br />
Communities L 228 of 16 ⁄ 08 ⁄ 1973, pp. 0023–0035.<br />
Franke, L.B., Torres, M.Â.P. & Lopes, R.R. (2008). Performance of<br />
different drying methods <strong>and</strong> their effects on the physiological<br />
quality of grain sorghum seeds (S. bicolor (L.) Moench). Revista<br />
Brasileira de Sementes, 30, 177–184.<br />
Guehi, T.S., Konan, Y.M., Koffi-Nevry, R.N’Dri, D.Y. & Manizan,<br />
N.P. (2007). Enumeration <strong>and</strong> Identification of Main Fungal<br />
Isolates <strong>and</strong> Evaluation of Fermentation’s Degree of Ivorian Raw<br />
Cocoa Beans. Australian Journal of Basic <strong>and</strong> Applied Sciences, 1,<br />
479–486.<br />
Guehi, T.S., Dingkuhn, M., Cros, E. et al. (2008). Impact of cocoa<br />
processing technologies in free fatty acids formation in stored raw<br />
cocoa beans. African Journal of Agricultural Research, 3, 174–179.<br />
Guénot, M.C., Perriot, J.J. & Vincent, J.C. (1976). Evolution de la<br />
microflore et des acides gras des fèves de cacao au cours du stockage:<br />
e´tude préliminaire. Cafe´ Cacao The´, 20, 53–58.<br />
Hansen, G.E., Olmo, M.D. & Burns, C. (1998). Enzyme activities in<br />
cocoa beans during fermentation. Journal of the Science of Food <strong>and</strong><br />
Agriculture, 77, 273–281.<br />
Hamid, A. & Lopez, A.S. (2000). Quality <strong>and</strong> weight changes in cocoa<br />
beans stored under two warehouses’ conditions in East Malaysia.<br />
The planter, Kuala Lumpur, 76, 619–637.<br />
Hashim, P., Selamat, J., Ali, A. & Kharidah, S. (1997). Pyrazines<br />
formation in cocoa beans: changes during fermentation. Journal of<br />
Food Science <strong>and</strong> Technology, 34, 483–487.<br />
Hashim, P., Selamat, J., Muhammad, S.K.S. & Ali, A. (1998). Changes<br />
in free amino acid peptide-N, sugar <strong>and</strong> pyrazine concentration<br />
during cocoa fermentation. Journal of the Science of Food <strong>and</strong><br />
Agriculture, 78, 535–542.<br />
Hii, C.L., Law, C.L., Cloke, M. & Suzannah, S. (2009). ‘‘Thin layer<br />
drying kinetics of cocoa <strong>and</strong> dried product quality’’. Biosystems<br />
Engineering, 102, 153–161.<br />
IOCCC: International Office of Cocoa, Chocolate <strong>and</strong> Sugar Confection<br />
(1996). Determination of free fatty acids (FFA) content of<br />
cocoa fat as a measure of cocoa nib acidity. Analytical Method no<br />
42–1993.<br />
Jinap, S., Thien, J. & Yap, T.N. (1994a). Effect of drying on acidity<br />
<strong>and</strong> volatile fatty acids content of cocoa beans. Journal of the<br />
Science of Food <strong>and</strong> Agriculture, 65, 67–75.<br />
Jinap, S., Siti, M.H. & Norsiati, M.G. (1994b). Formation of Methyl<br />
Pyrazine during Cocoa Bean Fermentation. Pertanika Journal of<br />
Tropical Agriculture Science, 17, 27–32.<br />
Jones, K.L. & Jones, S.E. (1984). Fermentations involved in the<br />
production of cocoa, coffee <strong>and</strong> tea. Progress in Industrial Microbiology,<br />
19, 411–433.<br />
International Journal of Food Science <strong>and</strong> Technology 2010, 45, 1564–1571 Ó 2010 CNRA-Université d’Abobo-Adjamé
Lehrian, D.W. & Patterson, G.R. (1983). Cocoa fermentation. In:<br />
Food <strong>and</strong> Feed Production with Microorganisms. Biotechnology, vol.<br />
5. (edited by G. Reed). Pp. 529–575. Verlag Chemie, Weinheim,<br />
Germany.<br />
Lopez, A.S.F. & Dimick, P.S. (1995). Cocoa fermentation. In:<br />
Enzymes, Biomass, Food <strong>and</strong> Feed, 2nd edn. Biotechnology, Vol. 9.<br />
(edited by G. Reed & T.W. Nagodawithana). Pp. 561–577. VCH,<br />
Weinheim, Germany.<br />
Mc Donald, C.R., Lass, R.A. & Lopez, A.S.F. (1981). Cocoa drying –<br />
a review. Cocoa Growers’ Bulletin, 31, 5–41.<br />
Meyer, B., Biehl, B., Said, M.B. & Samarakoddy, R.J. (1989). Post<br />
harvest pod storage: a method of pulp preconditioning to impair<br />
strong nib acidification during cocoa fermentation in Malaysia.<br />
Journal of the Science of Food <strong>and</strong> Agriculture, 48, 285–304.<br />
Mounjouenpou, P., Gueule, D., Fontana-Tachon, A., Guyot, B.,<br />
Tondje, P.R. & Guiraud, J.-P. (2008). Filamentous fungi producing<br />
ochratoxin a during cocoa processing in Cameroon. International<br />
Journal of Food Microbiology, 121, 234–241.<br />
Nazaruddin, R., Seng, L.K., Hassan, O. & Said, M. (2006). Effect of<br />
pulp preconditioning on the content of polyphenols in cocoa beans<br />
(Theobroma Cacao) during fermentation. Industrial Crops <strong>and</strong><br />
Products, 24, 87–94.<br />
Pontillon, J. & Cros, E. (1998). Me´thodes analytiques pour le cacao<br />
et produits dérivés. In: Cacao et chocolat (edited by J. Pontillon).<br />
Pp. 447–545. Paris, France: Lavoisier.<br />
Performance of different drying methods T. S. Guehi et al. 1571<br />
Roelofsen, P.A. (1958). Fermentation, drying <strong>and</strong> storage of cacao<br />
beans. Advances in Food Research, 8, 225–296.<br />
SAS Institute, Inc. (2002). JMP Software Version 5, Cary, NC.<br />
Schwan, R.F. & Wheals, A.E. (2004). The microbiology of cocoa<br />
fermentation <strong>and</strong> its role in chocolate quality. Critical Reviews in<br />
Food Science <strong>and</strong> Nutrition, 44, 205–221.<br />
Schwan, R.F., Rose, A.H. & Board, R.G. (1995). Microbial fermentation<br />
of cocoa beans, with emphasis on enzymatic degradation of<br />
the pulp. Journal of Applied Bacteriology, 79, 96S–107S (symposium<br />
supplement).<br />
Shelton, B. (1967). Artificial drying of cocoa beans. Tropical Agriculture<br />
(Trinidad), 44, 125–131.<br />
Tafuri, A., Ferracane, R. & Ritieni, A. (2004). Ochratoxin A in Italian<br />
marketed cocoa products. Food chemistry, 88, 487–494.<br />
Thompson, S.S., Miller, K.B. & Lopez, A.S.F. (2001). Cocoa <strong>and</strong><br />
coffee. In: Food Microbiology Fundamentals <strong>and</strong> Frontiers (edited by<br />
M.P. Doyle, L.R. Beuchat & T.J. Montville). Pp. 721–736. ASM<br />
Press, Washington, DC, USA.<br />
Wood, G.A.R., Lass, R.A. (1985). Cocoa, 4th edn. Longman Inc.,<br />
New York.<br />
World Cocoa Foundation (2008). Cocoa market. Available from:<br />
http://www.worldcocoafoundation.org. Accessed 17 ⁄ 04 ⁄ 2009.<br />
Ó 2010 CNRA-Université d’Abobo-Adjamé International Journal of Food Science <strong>and</strong> Technology 2010, 45, 1564–1571
1572<br />
Original article<br />
Optimisation of Spirulina platensis convective drying: evaluation of<br />
phycocyanin loss <strong>and</strong> lipid oxidation<br />
Elizangela G. Oliveira, Jessica H. Duarte, Kelly Moraes, Valeria T. Crexi & Luiz A. A. Pinto*<br />
Unit Operations Laboratory, School of Chemistry <strong>and</strong> Food, Federal University of Rio Gr<strong>and</strong>e (FURG), P.O. Box 474, Zip 96201-900, Rio<br />
Gr<strong>and</strong>e, RS, Brazil<br />
(Received 26 November 2009; Accepted in revised form 30 April 2010)<br />
Summary The aim of the study was the optimisation of Spirulina platensis drying on convective hot air through the<br />
response surface methodology. The responses were thiobarbituric acid (TBA) <strong>and</strong> phycocyanin loss<br />
percentage values in final product. Experiments were carried out in perforated tray drier with parallel air<br />
flow, <strong>and</strong> the wet samples thickness <strong>and</strong> drying air temperatures were in range of 3–7 mm <strong>and</strong> 50–70 °C,<br />
respectively. The statistical analysis showed significant effect (P 0.05) in relation to<br />
fresh biomass. The lipid profile of dried product presented high percentage of polyunsaturated fatty acids<br />
(34.4%), especially the gamma-linolenic acid (20.6%).<br />
Keywords Drying, fatty acids, microalgae, phycocyanin, spirulina platensis, thiobarbituric acid.<br />
Introduction<br />
The microalgae Spirulina platensis is produced commercially<br />
all over the world, <strong>and</strong> the dried product is<br />
valuable food supplement. It is rich in proteins (60–70%<br />
by dry weight), vitamins (especially B12 <strong>and</strong> b-carotene)<br />
<strong>and</strong> minerals. It contains many essential amino acids<br />
<strong>and</strong> fatty acids (Jiménez et al., 2003); also it is an<br />
inexpensive source of pigment (Richmond, 1988). The<br />
Spirulina components, with antioxidants properties, are<br />
the polyunsaturated fatty acids <strong>and</strong> pigments (Estrada<br />
et al., 2001). Phycocyanin <strong>and</strong> gamma-linolenic acid<br />
(C18:3, x6, GLA) are the components of the Spirulina,<br />
which has been receiving more attention from researchers.<br />
Phycocyanin is the main pigment produced by the<br />
microalgae Spirulina platensis <strong>and</strong> reaches 20% in dry<br />
weight of the cell protein (Vonshak, 1997). Phycocyanin<br />
has a significant antioxidant, anti-inflammatory,<br />
hepatoprotective <strong>and</strong> free radical properties; it is also<br />
used in food colouring <strong>and</strong> in cosmetics as they are<br />
nontoxic <strong>and</strong> noncarcinogenic (Henrikson, 1994; Morist<br />
et al., 2001; Minkova et al., 2003; ). Phycocyanin is used<br />
in chewing gums, dairy products, ice creams, jellies<br />
*Correspondent: Fax: +55 53 3233 8745;<br />
e-mail: dqmpinto@furg.br; luiz.pinto@pq.cnpq.br<br />
International Journal of Food Science <strong>and</strong> Technology 2010, 45, 1572–1578<br />
(Cohen, 1986; Yoshida et al., 1996) <strong>and</strong> biomedical<br />
research (Glazer, 1994). It is used as potential therapeutic<br />
agent reducing the oxidative stress disease<br />
(Romay et al., 1998; Bhat & Madyastha, 2001). The<br />
extraction method of phycocyanin from spirulina biomass<br />
is suggested by several methods such as spray<br />
drying <strong>and</strong> oven dried which result in approximately<br />
50% loss of phycocyanin (Sarada et al., 1999). The<br />
improved drying method is important to store maximum<br />
amount of phycocyanin in the biomass (Doke, 2005).<br />
The microalgae Spirulina platensis is a potential<br />
source of gamma-linolenic acid (GLA), an essential<br />
polyunsaturated fatty acid with economic interest. GLA<br />
is metabolite of linolenic acid (LA) <strong>and</strong> the first<br />
intermediate in the conversion of LA to arachidonic<br />
acid (AA) (Gustone, 1992). The microbial production<br />
for extraction of polyunsaturated fatty acid (PUFA) is<br />
considered an economical alternative to produce large<br />
quantities of fatty acids (Kennedy et al., 1993).<br />
Dehydration operation is an important step in the<br />
chemical <strong>and</strong> food processing industries. The basic<br />
objective in foodstuffs drying is the removal of water in<br />
the solids for to minimise the microbial growth <strong>and</strong><br />
deterioration by chemical reactions (Krokida et al.,<br />
2003). Also, it leads the reduction in weight <strong>and</strong> volume<br />
of material, storage <strong>and</strong> transportation costs (Okos<br />
et al., 1992). Convective hot air drying is one of the most<br />
doi:10.1111/j.1365-2621.2010.02299.x<br />
Ó 2010 Institute of Food Science <strong>and</strong> Technology
common industrial methods used for drying organic<br />
material <strong>and</strong> is a simultaneous process that involves heat<br />
<strong>and</strong> mass transfer followed by a phase or state change<br />
(Babalis & Belessiotis, 2004).<br />
The drying of Spirulina platensis constitutes approximately<br />
30% of the total production cost, <strong>and</strong> the<br />
traditional methods used to process fresh biomass into<br />
dry Spirulina are spray drying, freeze drying, solar<br />
drying, convective hot air drying <strong>and</strong> spouted bed<br />
(Morist et al., 2001; Jime´nez et al., 2003; Desmorieux &<br />
Decaen, 2006; Oliveira et al., 2009). Sarada et al. (1999)<br />
found a loss of approximately 50% of the phycocyanin<br />
presented in the biomass when different techniques have<br />
been used to dry microalgae Spirulina, including the<br />
spray <strong>and</strong> convective dryers. Oliveira et al. (2008)<br />
reported that high drying temperature (>60 °C) in<br />
two different dryers (spouted bed <strong>and</strong> convective air<br />
dryers) decreased the amount of phycocyanin extractable<br />
from Spirulina platensis. When low-cost drying<br />
methods are optimised, e.g. convective dryer, have the<br />
potential to approach the advantages derived from<br />
spray drying in terms of quality <strong>and</strong> bioavailability at<br />
lower cost.<br />
Several factors can influence hot air drying of foods,<br />
for example: velocity <strong>and</strong> temperature of air, water<br />
diffusion through material, load density, thickness <strong>and</strong><br />
shape of the product. The factors temperature <strong>and</strong><br />
thickness are more important in the microalgae drying<br />
operation according to literature (Desmorieux & Decaen,<br />
2006; Oliveira et al., 2009). However, the water<br />
removal decreases the nutritional <strong>and</strong> sensorial values of<br />
food <strong>and</strong> leads to phenomena such as hardening <strong>and</strong><br />
shrinkage (Vega et al., 2007). The microalgae Spirulina<br />
platensis is a high source of biocompounds, as phycobiliproteins<br />
(phycocyanin) <strong>and</strong> essential fatty acids; it is<br />
important reason to optimise the drying conditions.<br />
The aim of this study was the optimisation of the of<br />
microalgae Spirulina platensis drying through the<br />
response surface methodology (RSM), considering as<br />
independent variables the drying air temperature <strong>and</strong><br />
sample thickness. The responses were phycocyanin loss<br />
percentage <strong>and</strong> thiobarbituric acid (TBA) values. The<br />
fatty acids profile was determined in the best drying<br />
condition <strong>and</strong> compared with the fresh biomass.<br />
Materials <strong>and</strong> methods<br />
Raw material<br />
Spirulina strain LEB-18 (Costa et al., 2004) was cultivated<br />
in a 450 L open outdoor photo-bioreactors, under<br />
uncontrolled conditions, in the south of Brazil. During<br />
these cultivations, water was supplemented with 20%<br />
Zarrouk synthetic medium (Zarrouk, 1966), containing<br />
(g L )1 ): NaHCO3, 16.8; NaNO3, 2.5; K2HPO4, 0.5;<br />
K2SO4, 1.0; NaCl, 1.0; MgSO4.7H2O, 0.2; CaCl2, 0.04;<br />
Optimisation of Spirulina convective drying E. G. Oliveira et al. 1573<br />
FeSO4.7H2O, 0.01; EDTA, 0.08 <strong>and</strong> micronutrients.<br />
The initial biomass concentration was 0.15 g L )1 .Samples<br />
were taken every 24 h to determine the biomass<br />
concentration by optical density measurements at<br />
670 nm using a spectrophotometer (Quimis model<br />
Q108-DRM, Sa˜ o Paulo, Brazil). In the end of cultivation,<br />
the biomass was recovered by filtration <strong>and</strong><br />
pressing.<br />
Biomass drying<br />
Drying experiments were carried out at 50, 60 <strong>and</strong> 70 °C<br />
in the discontinuous tray dryer. The samples thicknesses<br />
were 3, 5 <strong>and</strong> 7 mm with load density of 4 kg m )2 , <strong>and</strong> the<br />
hot air velocity was 2.5 m s )1 . The drying procedure was<br />
continued till the moisture content of the sample was<br />
about 0.10 kg kg )1 (wet basis). After drying experiments,<br />
all products were ground in a knife mill (Willey model,<br />
Philadelphia, USA) <strong>and</strong> sieved (150 mesh), packed in<br />
plastics bags <strong>and</strong> stored at ambient temperature. Each<br />
drying experiment was carried out in duplicate.<br />
Chemical analyses<br />
The following parameters were determined in duplicate<br />
for the Spirulina platensis fresh: moisture (method<br />
925.10), protein (method 960.52) <strong>and</strong> ash (method<br />
923.03) contents. Determinations were carried out<br />
according to Association of Official Analytical Chemists,<br />
AOAC, (1995). Lipids content was through the<br />
methodology proposed by Folch & Lees (1957), <strong>and</strong><br />
carbohydrate content was determined by difference.<br />
Phycocyanin content<br />
Quantitative analysis of phycocyanin was carried out by<br />
Spectrometric method, according to Boussiba & Richmond<br />
(1979), on fresh <strong>and</strong> dried biomass. Initially, it was<br />
added 2 g of the wet sample in the pan, <strong>and</strong> after, it was<br />
dried in the oven for 6 h. To determine the percentage of<br />
phycocyanin, 40 mg of dried Spirulina was weighed,<br />
mixed in 10 mL of phosphate buffer 0.1 m (pH = 7) <strong>and</strong><br />
stirred until complete dissolution. The samples were<br />
stored in refrigerator at 4 °C overnight. The samples were<br />
subsequently mixed <strong>and</strong> centrifuged (Fanem model Baby<br />
I 206BL, Sa˜ o Paulo, Brazil) at 10 °C, 4000 g for 5 min.<br />
The absorbance was read in spectrophotometer (Quimis<br />
model Q-108DRM, Sa˜ o Paulo, Brazil) at 620 nm using<br />
phosphate buffer as blank. Phycocyanin content was<br />
calculated according to Eqn 1:<br />
% Phyco ¼<br />
A620.nd<br />
3:39:ðmsampleÞ:ðXdry matterÞ<br />
:100 ð1Þ<br />
where % Phyco is the phycocyanin percentage in<br />
sample, A 620 is the absorbency in a wave length of<br />
Ó 2010 Institute of Food Science <strong>and</strong> Technology International Journal of Food Science <strong>and</strong> Technology 2010, 45, 1572–1578
1574<br />
Optimisation of Spirulina convective drying E. G. Oliveira et al.<br />
620 nm, nd is the dilution number (mL), 3.39 is the<br />
coefficient of extinction for phycocyanin at 620 nm,<br />
msample is the wet mass of Spirulina (g), Xdry matter is<br />
the Spirulina dry composition (dimensionless) <strong>and</strong> 100<br />
is the representative of 100%. Each analysis was<br />
performed in duplicate.<br />
TBA value<br />
Dried samples were carried out to the TBA determination<br />
of lipid oxidation. The TBA value was done<br />
according to Tiburcio et al. (2007) with some modifications:<br />
Spirulina powder (10 g) was mixed with 40 mL<br />
of chloroform <strong>and</strong> filtrated. The filtrate (10 mL) was<br />
placed in tubes of centrifuge (Fanem model Baby I<br />
206BL, Sa˜ o Paulo, Brazil) with 10 mL of trichloroacetic<br />
acid (TCA) 10% w ⁄ v <strong>and</strong> centrifuged at 2000 g for<br />
15 min. The supernatant (4 mL) <strong>and</strong> 1 mL of thiobarbituric<br />
acid (TBA) 0.02 m were stirred for 5 min <strong>and</strong><br />
then incubated in boiling water bath for 40 min to<br />
develop the colour. Absorbance of the resulting supernatant<br />
was determined at 530 nm by a spectrophotometer<br />
(Quimis model Q-108DRM, Sa˜ o Paulo,<br />
Brazil). The reagents used were of analytical grade.<br />
The TBA value was calculated through st<strong>and</strong>ard curve<br />
obtained by reacting of tetramethoxypropane 0.01 m<br />
with TBA, the value was expressed as milligrams of<br />
malonyldialdehyde (MDA) per kg of sample in dry<br />
basis.<br />
Fatty acids profiles<br />
To evaluate the fatty acids profiles of the microalga<br />
Spirulina platensis, lipids extraction was carried out by a<br />
methodology proposed by Folch & Lees (1957). The<br />
extraction was carried out in the fresh <strong>and</strong> dehydrated<br />
biomass. Fatty acid identification <strong>and</strong> quantification<br />
were carried out by chromatographic analysis for<br />
Spirulina oil. Fatty acids profiles were determined by<br />
preparation of methyl esters as described by Metcalfe &<br />
Schimitz (1966).<br />
Fatty acid methyl esters (FAME) were identified by<br />
gas chromatography (chromatographer model Varian-<br />
3400 CX, Palo Alto, USA) equipped with a DB-17 J&W<br />
Scientific (50% phenyl methylpolysiloxane) capillary<br />
column. Fatty acid esters analyses were carried out in<br />
duplicate by injecting 1.0 lL, SPLIT ratio 1:50, into the<br />
capillary column (30 · 0.25 mm, 0.25 m film in thickness).<br />
GC setting conditions were as follows: injection<br />
temperature 250 °C <strong>and</strong> flame ionisation detector temperature<br />
300 °C, helium gas carrier flow rate<br />
1.0 mL min )1 , linear speed 24 cm s )1 <strong>and</strong> oven temperature<br />
held at 100 °C for 1 min, then increased to 160 °C<br />
at 6 °C min )1 <strong>and</strong> held at 230 °C at6°C min )1 . FAME<br />
were identified by direct comparison of the retention<br />
times with st<strong>and</strong>ards (SUPELCO TM 37, Bellefonte, PA,<br />
USA) <strong>and</strong> were quantified as the percentage area of each<br />
FAME mixture.<br />
Statistical analysis<br />
In the drying experiments, the effects of the drying air<br />
temperature (X1) <strong>and</strong> the samples thickness (X2) were<br />
studied through a full factorial design (3 2 ) on the<br />
responses for phycocyanin loss percentage <strong>and</strong> TBA<br />
values. The optimisation procedure was by the response<br />
surface methodology (Myer, 1976).<br />
The independent variables (factors) investigated in<br />
this study were drying air temperature <strong>and</strong> wet samples<br />
thickness. The values of these factors were 50, 60 <strong>and</strong><br />
70 °C for air temperature; 3, 5 <strong>and</strong> 7 mm for samples<br />
thickness. The coded levels of these values, for both<br />
factors, were represented by ()1), (0) <strong>and</strong> (+1), respectively.<br />
For the regression analysis of the experimental data,<br />
the software Statistica 6.0 for Windows (StatSoft Inc.,<br />
USA) was used. The statistical significance of the<br />
second-order statistical model (Eqn 2) <strong>and</strong> the variance<br />
explained by this model were determined by Fisher’s test<br />
<strong>and</strong> coefficient of determination (R 2 ), respectively. The<br />
response surfaces were found to define the optimal<br />
drying conditions for phycocyanin loss percentage <strong>and</strong><br />
TBA values.<br />
The second-order statistical model is presented in<br />
Eqn 2:<br />
Yn ¼ b0 þ b1X1 þ b11X 2 1 þ b2X2 þ b22X 2 2 þ b12X1X2<br />
ð2Þ<br />
where Yn is the predicted response (in real value), X1 is<br />
the codified temperature, X2 is the codified thickness<br />
<strong>and</strong> b0, b1, b11, b2, b22 <strong>and</strong> b12 are the regression<br />
coefficients.<br />
The fatty acids profile was found in the best drying<br />
condition, <strong>and</strong> the results were compared using the<br />
Tukey test at the significance level of 95% (P < 5%),<br />
with the aid of the software Statistica 6.0 for Windows<br />
(Statsoft Inc., USA).<br />
Results <strong>and</strong> discussion<br />
Characterisation of the Spirulina platensis fresh was (in<br />
wet basis): moisture content 75.7% ± 0.2; ash content<br />
1.7% ± 0.2; protein content 11.9% ± 0.3; lipids content<br />
3.4% ± 0.5 <strong>and</strong> carbohydrate content 7.3% ± 0.1<br />
(by difference). The phycocyanin content value of the<br />
fresh biomass was 0.11 kg kg )1 . The phycocyanin loss<br />
percentage values on dried products were calculated in<br />
relation to the fresh biomass. Table 1 shows the total<br />
drying time, phycocyanin loss percentage <strong>and</strong> TBA<br />
values of the factorial design matrix.<br />
The TBA value is extensively used like an indicator to<br />
the lipid oxidation degree, quantified the secondary<br />
products by oxidation. According to Boran et al. (2006),<br />
the TBA value required for acceptability of oils for<br />
International Journal of Food Science <strong>and</strong> Technology 2010, 45, 1572–1578 Ó 2010 Institute of Food Science <strong>and</strong> Technology
Table 1 Results of the 3 2 factorial design matrix for drying experiments<br />
Experiment<br />
(n°)<br />
X1 (Coded<br />
temperature)<br />
X2 (Coded<br />
thickness)<br />
human consumption is in the range 7–8 mg MDA kg )1 .<br />
Therefore, the oils obtained by dried Spirulina in all<br />
drying conditions (Table 1) presented oxidative quality.<br />
Drying process is a very important step to store<br />
maximum phycocyanin content in biomass <strong>and</strong> is an<br />
efficient extraction method for maximum recovery with<br />
relatively high purity ratio (Doke, 2005). According to<br />
Sarada et al. (1999), considerable loss of phycocyanin<br />
concentration was observed when wet biomass was dried<br />
at elevated temperature. The same occurred with the<br />
biomass dried at 70 °C <strong>and</strong> in the thickness of 7 mm<br />
(Table 1).<br />
Statistical analysis of the results in Table 2 showed<br />
that in the drying of microalgae Spirulina platensis in<br />
convective air drying, both the study factors (air<br />
temperature <strong>and</strong> sample thickness) have a significance<br />
effect at level of 95% (P < 0.05) on the loss of<br />
phycocyanin <strong>and</strong> TBA values. The results in Table 2<br />
show that the temperature has an important role on<br />
phycocyanin content during the drying process of<br />
Spirulina biomass. Also, it can be observed that the<br />
thickness presented significance in the loss of pigment, it<br />
can be explained due the higher thickness material had<br />
taken a larger time to dry (Table 1) until the commercial<br />
moisture content.<br />
Total drying<br />
time* (min)<br />
TBA value*<br />
(mgMDA kg )1 )<br />
Phycocyanin loss<br />
percentage* (%)<br />
1 )1 )1 192 ± 9 1.43 ± 0.10 43.76 ± 0.11<br />
2 0 )1 150 ± 7 2.12 ± 0.03 43.84 ± 0.17<br />
3 1 )1 133 ± 12 2.27 ± 0.15 75.30 ± 0.12<br />
4 )1 0 369 ± 5 1.20 ± 0.01 56.24 ± 0.20<br />
5 0 0 210 ± 5 0.90 ± 0.02 40.17 ± 0.15<br />
6 1 0 145 ± 15 0.96 ± 0.05 76.15 ± 0.21<br />
7 )1 1 608 ± 10 0.88 ± 0.04 82.22 ± 0.13<br />
8 0 1 300 ± 6 0.76 ± 0.01 85.13 ± 0.14<br />
9 1 1 214 ± 5 0.65 ± 0.05 93.07 ± 0.12<br />
MDA, malonyldialdehyde; TBA, thiobarbituric acid.<br />
*Mean value ± st<strong>and</strong>ard error (in replicate).<br />
Table 2 Effects <strong>and</strong> significance estimated by nonlinear regression<br />
Phycocyanin loss (%)<br />
Optimisation of Spirulina convective drying E. G. Oliveira et al. 1575<br />
In Table 2, the results of TBA values show that the<br />
effects of the thickness were higher than temperature one<br />
in this response. The lipid oxidations do not occur in<br />
saturated fatty acids, only in drastic conditions of<br />
temperature. However, the TBA value in the higher<br />
temperatures <strong>and</strong> thickness showed a reduction, it can<br />
be explained due the drying experiments occurred faster<br />
in highest temperature, <strong>and</strong> also in the higher thickness,<br />
the oil was more protected of the action of the<br />
temperature. The results of the second-order statistical<br />
model of analysis of variance are shown in Table 3.<br />
In Table 3, the F-test leads to that the model was<br />
adequate because the calculated (Fc) values were 3.48<br />
<strong>and</strong> 3.25 times higher than the table (Ft) values for<br />
phycocyanin loss percentage <strong>and</strong> TBA values, respectively,<br />
at 95% of confidence. As a practical rule, a model<br />
has statistical significance when the calculated F value is<br />
at least 3–5 times higher than the table value (Khury &<br />
Cornell, 1996). These values guarantee a satisfactory fit<br />
of the quadratic models to the experimental data,<br />
Eqns 3 <strong>and</strong> 4, <strong>and</strong> indicated that 95% of the variability<br />
in the responses could be explained by the models. The<br />
coefficients of correlation (R 2 ) for phycocyanin loss<br />
percentage <strong>and</strong> TBA responses were 0.95 <strong>and</strong> 0.94,<br />
respectively.<br />
TBA value (mg MDA kg )1 dry sample)<br />
Effect Pure Error t(2) P<br />
Effect Pure Error t(2)<br />
Average 43.85 0.085 514.25
1576<br />
Optimisation of Spirulina convective drying E. G. Oliveira et al.<br />
Table 3 Analysis of variance (ANOVA) for responses of the statistical model<br />
Y1 ¼ 43:85 þ 10:38X1 þ 17:04X 2 1 þ 16:25X2<br />
þ 15:33X 2 2<br />
SS df MS Fc Ft* Fc ⁄ Ft<br />
Phycocyanin loss percentage (%)<br />
Regression 4153.01 5 830.60 17.59 5.05 3.48<br />
Residual 236.07 5 47.21 – –<br />
Total 4389.08 10 – –<br />
TBA value (mg MDA kg )1 drysample)<br />
Regression 2.78 5 0.55 14.75 4.53 3.25<br />
Residual 0.18 5 0.04 – –<br />
Total 2.97 10 – –<br />
SS, Sum square; df, degree free; MS, mean square; MDA, malonyldialdehyde; TBA, thiobarbituric acid; F c, calculated value; F t, table value.<br />
*The Fisher F distribution at 5% probability (P < 0.05).<br />
5:17X1X2<br />
ð3Þ<br />
Y2 ¼ 0:96 þ 0:06X1 0:59X2 þ 0:37X 2 2 0:26X1X2<br />
ð4Þ<br />
where Y1 is phycocyanin loss percentage, in %; Y2 is the<br />
TBA value, in mgMDA kg )1 sample; X1 is the codified<br />
temperature; X 2 is the codified thickness.<br />
The response surface curves <strong>and</strong> the contour plot for<br />
drying of microalgae Spirulina platensis were obtained<br />
by statistical model (Eqns 3 <strong>and</strong> 4) <strong>and</strong> are show in<br />
Figs 1 <strong>and</strong> 2. The drying condition with the lowest<br />
phycocyanin loss percentage value was considered the<br />
best condition. Figures 1 <strong>and</strong> 2 show that the lower<br />
phycocyanin loss percentage <strong>and</strong> TBA values were<br />
obtained in air temperature 55 °C <strong>and</strong> sample thickness<br />
of 3.7 mm. In the best drying condition, the responses<br />
for the phycocyanin loss percentage <strong>and</strong> TBA values<br />
were 37.4 ± 0.3% <strong>and</strong> 1.5 ± 0.1 mgMDA kg )1 sample,<br />
respectively.<br />
Figure 1 Response surface curve for loss of phycocyanin.<br />
Tiburcio et al. (2007) studied the lipid oxidation of<br />
Spirulina platensis in three drying techniques, sun, solar<br />
<strong>and</strong> draft oven <strong>and</strong> compared with control sample<br />
dried in spray dryer. The lipid oxidation was evaluated<br />
through of TBA value. The authors found that<br />
the combined effect of tertiary-butyl hydroquinone<br />
(TBHQ) <strong>and</strong> microwave blanching was the most<br />
effective pre-dehydration treatment for minimising lipid<br />
peroxidation in drying Spirulina, <strong>and</strong> the lowest TBA<br />
value in product dried in sun-drying (0.47 mg MDA kg )1 )<br />
also was closest to the spray-dried sample (control),<br />
0.43 mgMDA kg )1 . They suggest that sun-drying when<br />
optimised produced a dried product more stable than<br />
spray-dried. As the pre-dehydration treatment was not<br />
used in this study, the higher TBA values were observed<br />
(Table 1).<br />
The drying method used in this study was considered<br />
satisfactory by statistical analysis in the drying of<br />
microalgae Spirulina, <strong>and</strong> in the best drying condition,<br />
the loss of phycocyanin was about 40%. This value was<br />
lower than those reported by the literature using<br />
methods more expensive <strong>and</strong> traditional of drying of<br />
microalgae (Sarada et al., 1999).<br />
Table 4 shows the composition of main fatty acids<br />
present in microalgae Spirulina platensis fresh <strong>and</strong> after<br />
the drying process in the best condition. There were not<br />
significance differences (P < 0.05), through the Tukey<br />
test, between the oils obtained by Spirulina fresh <strong>and</strong> by<br />
dried product in the best drying condition. The oil<br />
obtained from the Spirulina is an important source of<br />
monosaturated <strong>and</strong> polyunsaturated fatty acids (MUFA<br />
<strong>and</strong> PUFA), about 51% of total fatty acids. In both, oils<br />
was found linoleic acid <strong>and</strong> linolenic acid about 13.9%<br />
<strong>and</strong> 20.6%, respectively. Thermal processes, as well as<br />
light exposure, may affect MUFA <strong>and</strong> PUFA contents<br />
because of the oxidation process (Morist et al., 2001). In<br />
Table 4, the drying process does not change the chemical<br />
structure of linolenic acid <strong>and</strong> also did not occur<br />
unfavourable transformations to the nutrients of this<br />
microalgae.<br />
The fatty acids are susceptible molecules to treatments<br />
that use high temperature, leading to chemical<br />
International Journal of Food Science <strong>and</strong> Technology 2010, 45, 1572–1578 Ó 2010 Institute of Food Science <strong>and</strong> Technology
Table 4 Fatty acids compositions of microalgae Spirulina fresh <strong>and</strong><br />
dried product<br />
Fatty Acid (%) Spirulina fresh *†<br />
C11:0 3.50 ± 0.01 a<br />
C16:0 32.50 ± 0.02 a<br />
C16:1x7 13.09 ± 0.02 a<br />
C18:0 2.89 ± 0.01 a<br />
C18:1x9 3.10 ± 0,02 a<br />
C18:2 x6 trans 13.88 ± 0.01 a<br />
C18:3x6 cis 20.60 ± 0.02 a<br />
Saturated 38.89 ± 0.01 a<br />
Monounsaturated 16.19 ± 0.02 a<br />
Polyunsaturated 34.48 ± 0.01 a<br />
PUFA ⁄ SFA 0.88 ± 0.02 a<br />
Spirulina dried *†<br />
3.48 ± 0.02 a<br />
32.53 ± 0.01 a<br />
13.10 ± 0.02 a<br />
2.90 ± 0.01 a<br />
3.20 ± 0.02 a<br />
13.86 ± 0.02 a<br />
20.56 ± 0.01 a<br />
38.91 ± 0.01 a<br />
16.30 ± 0.02 a<br />
34.42 ± 0.01 a<br />
0.88 ± 0.02 a<br />
* Tukey test: same letters indicate no significance differences (P > 0.05).<br />
† Values means ± st<strong>and</strong>ard deviation (in replicate).<br />
Figure 2 Response surface curve for TBA values.<br />
transformations, polymerisation, geometrical isomerisation<br />
<strong>and</strong> intramolecular cyclisation (Berdeaux et al.,<br />
2007; Ceriane & Meirelless, 2007); however, in this best<br />
condition, the trans-linolenic fat acid was not changed<br />
after the drying process. A similar result was reported by<br />
Zepka et al. (2007), on drying the microalgae Aphanothece<br />
microscopica Na¨geli, with different conditions in<br />
convective air dryer.<br />
A higher content of PUFA increases the nutritional<br />
value of foods. The recommendation for the human diet<br />
is a polyunsaturated ⁄ saturated (PUFA ⁄ SFA) ratio<br />
higher than 0.45 (Cuthbertson, 1989). An analysis of<br />
Table 4 shows that the lipids profile of the microalgae<br />
Spirulina presents the (PUFA ⁄ SFA) ratio of 0.88. This<br />
result agrees with other authors (Campanella et al.,<br />
1999; Tokusoglu & U¨ nal, 2003) that considered the<br />
microalgae Spirulina as potential sources of the essential<br />
fatty acid gamma-linolenic acid.<br />
Conclusion<br />
The Spirulina platensis convective hot air drying, in<br />
thin layer with parallel air flow, showed a significant<br />
effect of air temperature <strong>and</strong> samples thickness<br />
(P 0.05). The lipid profile of Spirulina<br />
platensis samples in nature <strong>and</strong> dried showed a<br />
polyunsaturated <strong>and</strong> saturated fatty acids (PUFA ⁄ SFA)<br />
ratio of 0.88, being the recommendation for the human<br />
diet a ratio higher than 0.45. The palmitic <strong>and</strong> gammalinolenic<br />
acids presented the highest values (32.5% <strong>and</strong><br />
20.6%, respectively) of the fatty acids compositions of<br />
Spirulina fresh <strong>and</strong> dried product.<br />
Acknowledgment<br />
The authors are grateful to CAPES (Brazilian Agency<br />
for Improvement of Graduate Personnel) <strong>and</strong> FA-<br />
PERGS (Rio Gr<strong>and</strong>e do Sul Research Support Foundation),<br />
Brazil, for the financial support that made this<br />
work possible.<br />
References<br />
Optimisation of Spirulina convective drying E. G. Oliveira et al. 1577<br />
AOAC (1995). Official Methods of Analysis, 16th edn. Arlington,<br />
Virginia, USA: Association of Official Analytical Chemists.<br />
Babalis, S.J. & Belessiotis, V.G. (2004). Influence of the drying<br />
conditions on the drying constants <strong>and</strong> moisture diffusivity during<br />
the thin-layer drying of figs. Journal of Food Engineering, 65, 449–<br />
458.<br />
Berdeaux, O., Fournier, V., Lambelet, P., Dionisi, F., Sebedio, J.L. &<br />
Destaillats, F. (2007). Isolation <strong>and</strong> structural analysis of the cyclic<br />
fatty acid monomers formed from eicosapentaenoic <strong>and</strong> docosahexaenoic<br />
acids during fish oil deodorization. Journal of Chromatograph<br />
A, 1138, 216–224.<br />
Bhat, V.D. & Madyastha, K.M. (2001). Scavenging of peroxynitrite by<br />
phycocyanin <strong>and</strong> phycocyanobilin from Spirulina platensis: protection<br />
against oxidative damage to DNA. Biochemical <strong>and</strong> Biophysical<br />
Research Communications, 285, 262–266.<br />
Boran, G., Karac¸am, H. & Boran, M. (2006). Changes in the quality of<br />
fish oils due to storage temperature <strong>and</strong> time. Food Chemistry, 98,<br />
693–698.<br />
Boussiba, S. & Richmond, A. (1979). Isolation <strong>and</strong> purification of<br />
phycocyanins from the blue-green alga Spirulina platensis. Archives<br />
of Microbiology, 120, 155–159.<br />
Campanella, L., Crescentini, G. & Avino, P. (1999). Chemical<br />
composition <strong>and</strong> nutritional evaluation of some natural <strong>and</strong><br />
commercial food products based on Spirulina. Analusis, 27, 533–<br />
540.<br />
Ceriane, R. & Meirelless, J.A. (2007). Formation of trans PUFA<br />
during deodorization of canola oil: a study through computational<br />
Ó 2010 Institute of Food Science <strong>and</strong> Technology International Journal of Food Science <strong>and</strong> Technology 2010, 45, 1572–1578
1578<br />
Optimisation of Spirulina convective drying E. G. Oliveira et al.<br />
simulation. Chemical Engineering <strong>and</strong> Processing: Process Intensification,<br />
46, 375–385.<br />
Cohen, Z. (1986). Products from microalgae. H<strong>and</strong>book of Microalgal<br />
Mass Culture. Pp. 69–99. Boca Raton: CRC Press Inc.<br />
Costa, J.A.V., Colla, L.M. & Duarte Filho, P.F. (2004). Improving<br />
Spirulina platensis biomass yield using a fed-batch process. Bioresource<br />
Technology, 92, 237–241.<br />
Cuthbertson, W.F.J. (1989). What is a healthy food? Food Chemistry,<br />
33, 53–80.<br />
Desmorieux, H. & Decaen, N. (2006). Convective drying of Spirulina<br />
in thin layer. Journal of Food Engineering, 77, 64–70.<br />
Doke, J.M. Jr (2005). An improved <strong>and</strong> efficient method for the<br />
extraction of phycocyanin from Spirulina sp. Intern. International<br />
Journal of Food Engineering, 1, 1–11.<br />
Estrada, J.E.P., Besco´s, P.B. & Fresno, A.M.V. (2001). Antioxidant<br />
activity of different fractions of Spirulina platensis protean extract.<br />
IL Farmaco, 56, 497–500.<br />
Folch, J. & Lees, M. (1957). A simple method for isolation <strong>and</strong><br />
purification of total lipids from animal tissues. Journal of Biological<br />
Chemistry, 226, 497–509.<br />
Glazer, A.N. (1994). Phycobiliproteins: a family of valuable widely<br />
used fluorophores. Journal of Applied Phycology, 6, 105–112.<br />
Gustone, F.D. (1992). c-linolenic acid. Occurrence <strong>and</strong> physical <strong>and</strong><br />
chemical properties. Progress in Lipid Research, 31, 145–161.<br />
Henrikson, R. (1994). Microalga Spirulina superalimento del futuro. Pp.<br />
112. Barcelona: Urano.<br />
Jiménez, C., Cossio´, B.R., Labella, D.F. & Niell, X. (2003). The<br />
feasibility of industrial production of Spirulina (Arthrospira) in<br />
Southern Spain. Aquaculture, 217, 179–190.<br />
Kennedy, M.J., Reader, S.L. & Davies, R.J. (1993). Fatty acid<br />
production characteristics of fungi with particular emphasis on<br />
gamma linolenic acid production. Biotechnology <strong>and</strong> Bioengineering,<br />
42, 625–634.<br />
Khury, A.I. & Cornell, J.A. (1996). Response Surfaces. 2nd edn. New<br />
York: Marcel Dekker.<br />
Krokida, M.K., Karathanos, V.T., Maroulis, Z.B. & Marinos-Kouris,<br />
D. (2003). Drying kinetics of some vegetables. Journal Food<br />
Engineering, 59, 391–403.<br />
Metcalfe, L.D.A.A. & Schimitz, J.R. (1966). Rapid preparation of<br />
fatty acid esters from lipids for gas liquid chromatography.<br />
Analytical Chemistry, 38, 510 p.<br />
Minkova, K.M., Tchernov, A.A., Tchorbadjieva, M.I., Fournadjieva,<br />
S.T., Antova, R.E. & Busheva, M.C.H. (2003). Purification of<br />
C-phycocyanin from Spirulina (Arthrospira) fusiforms. Journal of<br />
Biotechnology, 102, 55–59.<br />
Morist, A., Montesinos, J.L., Cusidó, J.A. & Gòdia, F. (2001).<br />
Recovery <strong>and</strong> treatment of Spirulina platensis cells cultured in a<br />
continuous photobioreactor to be used as food. Process Biochemistry,<br />
37, 535–547.<br />
Myer, R.H. (1976). Response Surface Methodology. New York:<br />
Library of Congress.<br />
Okos, M.R., Narasimhan, G., Singh, R.K. & Witnauer, A.C. (1992).<br />
Food dehydration. In: H<strong>and</strong>book of Food Engineering (Edited by<br />
D.R. Hedman & D.B. Lund). Pp. 437–562. New York: Marcel<br />
Dekker.<br />
Oliveira, E.G., Rosa, G.S., Moraes, M.A. & Pinto, L.A.A. (2008).<br />
Phycocyanin content of Spirulina platensis dried in spouted bed <strong>and</strong><br />
thin layer. Journal of Food Process Engineering, 31, 34–50.<br />
Oliveira, E.G., Rosa, G.S., Moraes, M.A. & Pinto, L.A.A. (2009).<br />
Characterization of thin layer drying of Spirulina platensis utilizing<br />
perpendicular air flow. Bioresource Technology, 100, 1297–1303.<br />
Richmond, A. (1988). Spirulina. In: Micro-Algal Biotechnology (edited<br />
by M.A. Borowitzka & L.J. Borowitzka). Pp. 85–121. Cambridge:<br />
Cambridge University Press.<br />
Romay, C., Armesto, J., Remirez, D., González, R., Ledon, N. & García,<br />
I. (1998). Antioxidant <strong>and</strong> anti-inflammatory properties of C-phycocyanin<br />
from blue-green algae. Inflammation Research, 47, 36–41.<br />
Sarada, R., Pillai, M.G. & Ravishankar, G.A. (1999). Phycocyanin<br />
from Spirulina sp: influence of processing of biomass on phycocyanin<br />
yield, analysis of efficacy of extraction methods <strong>and</strong> stability<br />
studies on phycocyanin. Process Biochemistry, 34, 795–801.<br />
Tiburcio, P.C., Galvez, F.C.F., Cruz, L.J. & Gavino, V.C. (2007).<br />
Determination of shelf life of Spirulina platensis (MI2) grown in the<br />
Philippines. Journal of Applied Phycology, 19, 727–731.<br />
Tokusoglu, Ö. &U¨ nal, M.K. (2003). Biomass nutrients profiles of<br />
three microalgae: Spirulina platensis, Chlorella vulgaris, <strong>and</strong> Isochrisis<br />
galbana. Journal of Food Science, 68, 1144–1148.<br />
Vega, A., Fito, P., Andrés, A. & Lemus, R. (2007). Mathematical<br />
modeling of hot-air drying kinetics of red bell pepper (var. Lamuyo).<br />
Journal of Food Engineering, 79, 1460–1466.<br />
Vonshak, A. (1997). Spirulina Platensis (Arthrospira) Physiology, Cell-<br />
Biology <strong>and</strong> Biotechnology. London: Taylor & Francis.<br />
Yoshida, A., Takagaki, Y. & Nishimune, T. (1996). Enzyme immunoassay<br />
for phycocyanin as the main component of Spirulina color<br />
in foods. Bioscience, Biotechnology <strong>and</strong> Biochemistry, 60, 57–60.<br />
Zarrouk, C. (1966). Contribution A` L’e´tude D’une Cyanophyce´e.<br />
Influence De Divers Facteurs Physiques Et Chimiques Sur La<br />
Croissance Et La Photosynthe`se De Spirulina Maxima. Ph.D. Thesis.<br />
Paris, France: University of Paris.<br />
Zepka, L.Q., Lopes, E.J., Goldbeck, R. & Queiroz, M.I. (2007).<br />
Production <strong>and</strong> biochemical profile of the microalgae Aphanothece<br />
microscopica Na¨geli submitted to different drying conditions.<br />
Chemical Engineering <strong>and</strong> Process: Process Intensification, 47,<br />
1305–1310.<br />
International Journal of Food Science <strong>and</strong> Technology 2010, 45, 1572–1578 Ó 2010 Institute of Food Science <strong>and</strong> Technology
International Journal of Food Science <strong>and</strong> Technology 2010, 45, 1579–1585 1579<br />
Original article<br />
Taste characterisation of green tea catechins<br />
Masataka Narukawa, 1,2,3 Hironobu Kimata, 1 Chiaki Noga 2 & Tatsuo Watanabe 1,2,3 *<br />
1 Graduate School of Nutritional <strong>and</strong> Environmental Sciences, University of Shizuoka, 52-1 Yada, Suruga-ku, Shizuoka 422-8526, Japan<br />
2 School of Food <strong>and</strong> Nutritional Sciences, University of Shizuoka, 52-1 Yada, Suruga-ku, Shizuoka 422-8526, Japan<br />
3 Global COE Program, University of Shizuoka, 52-1 Yada, Suruga-ku, Shizuoka 422-8526, Japan<br />
(Received 25 February 2010; Accepted in revised form 30 April 2010)<br />
Summary There has been interest in biological activities of green tea catechins. However, little is known about the taste<br />
characteristics of catechins. To assess the taste characteristics of catechins (())–epicatechin (EC), ())–<br />
epicatechin gallate (ECg), ())–epigallocatechin (EGC) <strong>and</strong> ())–epigallocatechin gallate (EGCg)), sensory<br />
evaluations were performed. The taste intensity increased with increased catechins concentration. Among<br />
them, ECg showed the strongest taste. Catechins had tastes that consisted primarily of astringency <strong>and</strong><br />
bitterness. Therefore, taste palatability decreased with increasing catechin concentrations. In line with taste<br />
intensity, taste palatability of ECg was the lowest. Taste sensor analysis <strong>and</strong> mouse behavioural assays<br />
showed same results. EC <strong>and</strong> ECg were more stable in Ringer’s solution than EGC <strong>and</strong> EGCg. Furthermore,<br />
taste cell responses to ECg that had the strong taste <strong>and</strong> better stability among catechins used were recorded.<br />
Some taste cells responded to ECg. This result suggests that ECg might be recognised by taste cells.<br />
Keywords Catechin, EC, ECg, EGC, EGCg, taste.<br />
Introduction<br />
Green tea has long been a popular drink in East Asia.<br />
Many active ingredients, such as polyphenols, vitamins<br />
<strong>and</strong> amino acids, are present in green tea (Graham, 1992).<br />
())–Epicatechin (EC), ())–epicatechin gallate (ECg),<br />
())–epigallocatechin (EGC) <strong>and</strong> ())–epigallocatechin<br />
gallate (EGCg) are major components of the polyphenols<br />
in green tea <strong>and</strong> are referred to as tea catechins.<br />
Recently, the pharmaceutical effects of catechins have<br />
attracted attention. According to recent studies, the<br />
catechins have anti-hypertensive (Henry & Stephens-<br />
Larson, 1984), anti-oxidative (Chen & Chan, 1996)<br />
(Zhang et al., 1997), anti-arteriosclerotic (Hertog et al.,<br />
1993), anti-carcinogenic (Shi et al., 1994) (Wang et al.,<br />
1994) <strong>and</strong> hypocholesterolemic properties (Imai &<br />
Nakachi, 1995). There are some studies that examined<br />
sensory characteristics of tea catechins (Scharbert &<br />
Hofmann, 2005) (Rossetti et al., 2009). Although their<br />
reports investigated taste threshold of catechins, the<br />
detailed taste analysis including the relationship of<br />
concentration <strong>and</strong> taste intensity <strong>and</strong> ⁄ or preference is<br />
not performed. Therefore, we performed more detailed<br />
taste analysis of tea catechins in this study. First, we<br />
investigated the taste of catechins using human sensory<br />
*Correspondent: Fax: +81 54 264 5550;<br />
e-mail: watanbt@u-shizuoka-ken.ac.jp<br />
doi:10.1111/j.1365-2621.2010.02304.x<br />
Ó 2010 The Authors. Journal compilation Ó 2010 Institute of Food Science <strong>and</strong> Technology<br />
evaluations. We also tried an objective assessment of<br />
taste by a mouse behavioural assay <strong>and</strong> an instrumental<br />
analysis. Furthermore, we recorded the responses of<br />
mouse taste cells that detect the taste of food, using the<br />
tea catechins as tastants.<br />
Materials <strong>and</strong> methods<br />
Materials<br />
EC, ECg, EGC <strong>and</strong> EGCg were provided by Mitsui<br />
Norin Co. Ltd. (Tokyo, Japan). Collagenase type IV<br />
<strong>and</strong> elastase were purchased from Worthington Biochemical<br />
(Lakewood, NJ, USA). Trypsin inhibitor,<br />
DNase, amiloride <strong>and</strong> DMSO were obtained from<br />
Sigma (St. Louis, MO, USA), <strong>and</strong> Fluo-4AM was<br />
purchased from Molecular Probes (Eugene, OR, USA).<br />
All other reagents were of analytical grade <strong>and</strong> were<br />
obtained from st<strong>and</strong>ard suppliers.<br />
Sensory evaluation<br />
We recruited 11 volunteers with a mean age of<br />
23.7 ± 3.7 years (mean ± st<strong>and</strong>ard deviation). All subjects<br />
had normal body mass, were non-smokers <strong>and</strong><br />
were in good physical health. All psychophysical tests<br />
were performed according to a protocol approved by the<br />
University of Shizuoka Ethics Committee.
1580<br />
Taste characterisation of catechins M. Narukawa et al.<br />
Taste intensity was assessed using a visual analogue<br />
scale (VAS). The subjects were asked to spit out each<br />
solution after tasting <strong>and</strong> to rate the taste intensity by<br />
marking the appropriate position on a 100-mm VAS.<br />
The right <strong>and</strong> left ends of the scale represented ‘strong’<br />
<strong>and</strong> ‘weak’ tastes, respectively. The palatability was<br />
assessed using a scoring method in which catechin<br />
solutions were graded on a scale of )3 to +3: )3,<br />
strongly unpleasant; )2, unpleasant; )1, slightly<br />
unpleasant; 0, neither pleasant nor unpleasant; +1,<br />
slightly pleasant; +2, pleasant; <strong>and</strong> +3, strongly<br />
pleasant. The subjects described the taste qualities in<br />
terms of no taste, bitterness, sourness, saltiness, sweetness,<br />
umami, astringency, pungency <strong>and</strong> other tastes.<br />
Because tea catechins is included at the range of<br />
10–300 lm in green tea drink (Chen et al., 2001), we<br />
prepared EC, ECg, EGC <strong>and</strong> EGCg solutions at four<br />
different concentrations, 10, 30, 100 <strong>and</strong> 300 lm. For the<br />
tasting test, the subjects were presented with cups<br />
containing 30 mL of a sample solution. All solutions<br />
were poured into plastic cups <strong>and</strong> presented at ambient<br />
temperature. For each tasting test, the subjects were<br />
asked to thoroughly rinse their mouth with distilled<br />
water, sip the test solution, swirl it around in their<br />
mouth for several seconds to taste it <strong>and</strong> then spit it out.<br />
The subjects rinsed their mouths with distilled water<br />
between tasting different samples. The sensory evaluation<br />
was performed in a laboratory for sensory evaluation;<br />
the temperature <strong>and</strong> humidity were 24 ± 1 °C<br />
<strong>and</strong> 54% ± 1%, respectively.<br />
Behavioural assay<br />
For animal experiments, C57BL ⁄ 6J strain mice (age, 7–<br />
20 weeks, supplier) were used. The animal experiments<br />
were performed according to a protocol approved by the<br />
University of Shizuoka Animal Care Committee. A<br />
48-h, two-bottle preference test was performed as a<br />
behavioural assay. The mice (n = 10) were caged<br />
individually <strong>and</strong> given access for 48 h to two bottles;<br />
one contained distilled water <strong>and</strong> the other, a tastant<br />
solution. After 24 h, the bottle positions were switched<br />
to control for any positional effect. The ratio of tastant<br />
volume to total liquid consumed was recorded for each<br />
tastant. The intake of each fluid in the two-bottle<br />
preference test was expressed as mean ± st<strong>and</strong>ard error<br />
of the mean (SEM), <strong>and</strong> their differences were evaluated<br />
statistically using the t-test. Tastant solutions were 10,<br />
30, 100, 300-lm EC, ECg, EGC <strong>and</strong> EGCg.<br />
Measurement of astringency intensity of catechins by a<br />
taste sensor<br />
A taste sensor assay referred to the procedure of<br />
Hayashi et al. (2008) <strong>and</strong> was performed using a TS-<br />
5000Z taste recognition system (Intelligent Sensor<br />
Technology, Inc., Kanagawa, Japan), fitted with an<br />
AE1 probe <strong>and</strong> reference probes. The taste sensor is a<br />
device that analyses the taste of food on the basis of the<br />
affinity to a lipid layer (Toko, 2000). As a st<strong>and</strong>ard<br />
solution, 30 mm KCl + 0.3 mm tartaric acid was used.<br />
Sample solutions were 300-lm EC, ECg, EGC <strong>and</strong><br />
EGCg dissolved in the st<strong>and</strong>ard solution.<br />
HPLC analysis<br />
Degradation of green tea catechins of 48 h after preparation<br />
was quantified using high-performance liquid<br />
chromatography (HPLC). HPLC analysis referred to a<br />
slight modification of the procedure of Maeda-Yamamoto<br />
et al. (2005). Solutions of 300 lm of EC, ECg, EGC<br />
<strong>and</strong> EGCg were prepared in distilled water <strong>and</strong> Ringer’s<br />
solution followed by incubation at room temperature<br />
(25 °C). HPLC analysis was performed using an LC-6A<br />
or LC-9A system equipped with a SPD-6AV spectrophotometric<br />
detector (Shimadzu Corporation, Kyoto,<br />
Japan), <strong>and</strong> a JH-392 ODS column was used (internal<br />
diameter, 4.6 mm <strong>and</strong> length, 150 mm; YMC Co. Ltd.,<br />
Kyoto, Japan). The mobile phase consisted of H2Omethanol-H3PO4<br />
(65:35:0.17) at a flow rate of<br />
1 mL min )1 . The detection wavelength was 272 nm for<br />
EC, ECg <strong>and</strong> EGCg <strong>and</strong> 242 nm for ECg.<br />
Measurement of intracellular calcium concentration<br />
Ca 2+ measurements were measured using Fluo-4 from<br />
isolated single taste cells of mouse circumvallate papillae<br />
as described previously (Narukawa et al., 2006, 2008,<br />
2009). Briefly, taste cells were isolated <strong>and</strong> plated on<br />
concanavalin A-coated glass-bottom dishes. Then, cells<br />
were loaded with the cell-permeable, Ca 2+ -sensitive<br />
fluorescent dye Fluo-4 AM (3 lm). Images of Fluo-4<br />
fluorescence were acquired at 6-s intervals by an<br />
Olympus Fluoview FV300 laser scanning confocal<br />
microscope (Olympus, Tokyo, Japan). The intracellular<br />
Ca 2+ changes were expressed as the relative fluorescence<br />
change, DF ⁄ F=(F–F0) ⁄ F0, where the resting fluorescent<br />
F0 was determined by averaging 10 images at the<br />
beginning of each experiment. A response was defined<br />
when peak DF ⁄ F increased by 10% or more from the<br />
previous fluorescence image while perfused with the<br />
stimulating solution. Cells were perfused with Ringer’s<br />
solution containing 100-lm ECg. The EGC was dissolved<br />
in Ringer’s solution just before use. All experiments<br />
were performed at room temperature.<br />
Our Ringer’s solution contained (in mm): 136.89<br />
NaCl, 5.37 KCl, 20 HEPES, 5.55 d-glucose, 0.44<br />
KH2PO4, 0.34 Na2HPO4, 1 CaCl2 <strong>and</strong> 2.5 probenecid<br />
at pH 7.4. The divalent cation-free Ringer’s solution<br />
contained (in mm): 65 NaCl, 26 NaHCO3, 2.5 NaH2- PO4, 1 EDTA.4Na, <strong>and</strong> 20 glucose <strong>and</strong> adjusted to pH<br />
7.4 with NaOH.<br />
International Journal of Food Science <strong>and</strong> Technology 2010 Ó 2010 The Authors. Journal compilation Ó 2010 Institute of Food Science <strong>and</strong> Technology
Statistical analysis<br />
Data were expressed as the mean ± st<strong>and</strong>ard errors of<br />
the mean (SEM). The statistical significance of differences<br />
was analysed by student t-test. The differences<br />
were considered to be significant at P < 0.05.<br />
Results<br />
Taste analysis of catechins by human sensory evaluation<br />
The relationship of catechin concentration–taste intensity,<br />
palatability <strong>and</strong> qualities are shown in Fig. 1. The<br />
taste intensity increased with increased catechin concentration<br />
(Fig. 1a). On the other h<strong>and</strong>, the taste palatability<br />
decreased with increased catechin concentration<br />
(Fig. 1b). At 300-lm catechin, the taste intensity of ECg<br />
was the strongest, followed by EGCg, EC <strong>and</strong> EGC.<br />
Their taste intensities were 76.1 ± 7.4, 43.8 ± 8.4,<br />
26.2 ± 8.2 <strong>and</strong> 21.3 ± 4.9, respectively. Similarly, the<br />
taste palatability of ECg was the lowest, followed by<br />
EGCg, EC <strong>and</strong> EGC. Catechins had a complex taste<br />
that consisted primarily of astringency <strong>and</strong> bitterness<br />
(Fig. 1c). There were a few subjects who felt saltiness<br />
<strong>and</strong> umami to EC. When taste quality was compared<br />
between ECg <strong>and</strong> EGCg, ECg had relatively stronger<br />
astringency <strong>and</strong> EGCg had stronger bitterness. Fiftyfive<br />
per cent of subjects felt astringency to 300-lm ECg.<br />
Seventy-three per cent of subjects felt bitterness to<br />
300-lm EGCg. Thus, ECg had the strongest <strong>and</strong> most<br />
unpleasant taste among the four tea catechins tested.<br />
Taste sensor analysis<br />
Membrane potential changes with astringency taste<br />
(AE1 sensor) were observed. The membrane potential<br />
change with ECg was the biggest, followed by EGCg,<br />
EC <strong>and</strong> EGC (Fig. 2). It was thought that ECg had the<br />
strongest astringency.<br />
Two-bottle preference test in mice<br />
Next, a 48-h, two-bottle preference test was performed<br />
as a behavioural assay (Fig. 3). The palatability of ECg<br />
decreased, concentration-dependently. The mice significantly<br />
avoided more than 30-lm ECg. For EGCg,<br />
although the palatability from 10 to 100-lm EGCg did<br />
not change but that of 300-lm EGCg decreased significantly.<br />
The palatability of EGC <strong>and</strong> EC did not change.<br />
Thus, mice may detect the taste of ECg most strongly in<br />
the catechins tested.<br />
Stability measurements of catechins by HPLC<br />
It is known that catechins are rapidly degraded around<br />
neutral pH (Zhu et al., 1997). Thus, we sought to<br />
(a) 100<br />
Taste intensity (VAS mm)<br />
(b)<br />
Taste preference<br />
(c)<br />
80<br />
60<br />
40<br />
20<br />
0<br />
0<br />
–1<br />
–2<br />
–3<br />
EC<br />
ECg<br />
EGC<br />
EGCg<br />
Taste characterisation of catechins M. Narukawa et al. 1581<br />
: EC<br />
: ECg<br />
: EGC<br />
: EGCg<br />
10 30 100 300<br />
Conc. (µM)<br />
Conc. (µM)<br />
10 30 100 300<br />
: EC<br />
: ECg<br />
: EGC<br />
: EGCg<br />
Taste quality<br />
0% 20% 40% 60% 80% 100%<br />
: Bitter, : Astrigency, : Umami, : Salty, : No-taste<br />
Figure 1 Taste intensity, palatability <strong>and</strong> quality of catechins.<br />
(a) Change in taste intensity at 10, 30, 100 <strong>and</strong> 300-lm catechins.<br />
(b) Change in taste palatability at 10, 30, 100 <strong>and</strong> 300-lm catechins.<br />
(c) Taste quality of 300-lm catechins. The values represent the<br />
mean ± SE (n = 11).<br />
confirm their effectiveness in the foregoing experiments.<br />
Also, to examine the state of catechins when used in a<br />
physiological experiment, we measured the stability of<br />
Ó 2010 The Authors. Journal compilation Ó 2010 Institute of Food Science <strong>and</strong> Technology International Journal of Food Science <strong>and</strong> Technology 2010
1582<br />
Taste characterisation of catechins M. Narukawa et al.<br />
Output of AE1 sensor (mV)<br />
0<br />
–5<br />
–10<br />
–15<br />
–20<br />
EC ECg EGC EGCg<br />
Figure 2 Membrane potential change of astringency sensor to catechins<br />
(300 lm). Astringency is the membrane potential values from the<br />
AE1 sensor probe. The y-axis indicates that the lower the value is, the<br />
stronger the taste is.<br />
Preference ratio<br />
0.6<br />
0.4<br />
0.2<br />
*<br />
: EC<br />
: ECg<br />
:EGC<br />
:<br />
: EGCg<br />
***<br />
catechins in distilled water <strong>and</strong> Ringer’s solution for<br />
48 h. Catechins were hardly degraded in distilled water<br />
for 48 h (Fig. 4a). On the other h<strong>and</strong>, in Ringer’s<br />
**<br />
****<br />
0<br />
10 100 1000<br />
Conc. (uM)<br />
Figure 3 Change of palatability to catechins in mouse. The values<br />
represent the mean ± SEM (n = 10). *, **, *** <strong>and</strong> **** indicate<br />
P
ΔF/F<br />
10%<br />
60 s<br />
100 µM ECg<br />
Figure 5 Intracellular Ca 2+ Response to ECg (100 lm). Time course<br />
of the representative ECg-induced Ca 2+ response (DF ⁄ F).<br />
This result suggests that the taste of ECg is recognised by<br />
taste cells.<br />
Discussion<br />
The functionality of green tea has gained attention, <strong>and</strong><br />
worldwide consumption has increased. Catechins are the<br />
main polyphenol in green tea. It is reported that<br />
polyphenols influence the quality in some foods. For<br />
example, it affects the flavour quality of cocoa beans<br />
(Noor-Soffalina et al., 2009). And its concentration has<br />
the negative influence on perceived quality in Longjing<br />
tea (Wang & Ruan, 2009). Therefore, it is possible that<br />
catechins are the functional components in green tea<br />
with an unpleasant flavour, hindering further consumption.<br />
To further increase consumption of green tea, it<br />
will be necessary to underst<strong>and</strong> the taste characterisation<br />
of the catechins to explore methods for reducing the<br />
unpleasant flavour. In this study, we investigated the<br />
taste characteristics of representative tea catechins, EC,<br />
ECg, EGC <strong>and</strong> EGCg.<br />
Taste intensity of catechins increased, concentrationdependently.<br />
Among them, ECg showed the strongest<br />
taste. Although there was no difference in taste intensities<br />
of EC, EGC <strong>and</strong> EGCg at 10–100 lm, the taste of EGCg<br />
increased at 300 lm. Taste palatability was inversely<br />
related to taste intensity <strong>and</strong> decreased with increased<br />
catechin concentrations. Thus, it is thought that catechins<br />
have an aversive taste. In fact, when the taste<br />
quality was investigated, these compounds possessed<br />
aversive tastes, such as bitterness <strong>and</strong> astringency. To<br />
evaluate the taste of catechins objectively, we performed<br />
an instrumental analysis <strong>and</strong> a mouse behavioural assay.<br />
We performed an instrumental analysis using a taste<br />
sensor. The experiment using the taste sensor supported<br />
these results. The order of astringency sensor output<br />
for 300-lm catechins was as follows: ECg > EGCg<br />
> EC > EGC. In the catechin included in green tea,<br />
the order of taste intensity was as follows: ECg > EGCg<br />
> EC > EGC. Among the catechins in green tea, the<br />
Taste characterisation of catechins M. Narukawa et al. 1583<br />
amount of EGCg is highest, followed by EGC, ECg <strong>and</strong><br />
EC (Goto & Nagashima, 1996) (Chen et al., 2001).<br />
Because the taste intensity of 300-lm ECg was about<br />
1.8-fold higher than that of EGCg, the influence of ECg<br />
in contributing to the taste of tea may be stronger than<br />
expected. A few subjects felt saltiness <strong>and</strong> umami to<br />
300-lm EC solution. As for this reason, it is thought that<br />
the subjects did not detect clear taste because taste<br />
intensity of 300-lm EC is weak rather than EC has<br />
saltiness <strong>and</strong> umami. In fact, the subjects who did not<br />
detect taste to EC existed 20%. And bitterness threshold<br />
to EC was reported about 1.5 mm (Rossetti et al., 2009).<br />
Next, we examined a taste preference test with mice.<br />
As we have described previously, palatability partially<br />
reflects taste intensity. The order of avoidance ratio of<br />
the 300-lm catechins was as follows: ECg > EGCg<br />
> EC > EGC. This corresponded with the result of<br />
the sensory evaluation. Thus, this experiment using mice<br />
may be able to predict experimental results in humans.<br />
Generally, it is reported that the higher the hydrophobicity<br />
of a bitter substance is, the higher its<br />
interaction with bitter receptor is (Kumazawa et al.,<br />
1986). In the catechins used, ECg <strong>and</strong> EGCg, which<br />
have galloyl groups, had higher taste intensities than EC<br />
<strong>and</strong> EGC. The hydrophobicity is increased by the<br />
galloyl group. As a result, the interaction with the<br />
receptor is expected to be stronger. Thus, the taste<br />
intensity of ECg <strong>and</strong> EGCg would be expected to be<br />
strong. Also, there was a difference in taste intensity<br />
between ECg <strong>and</strong> EGCg <strong>and</strong> ⁄ or EC <strong>and</strong> EGC. The<br />
existence of the catechol group <strong>and</strong> the galloyl group<br />
may influence this. In comparison with the catechol<br />
group, the galloyl group has more than one hydroxy<br />
group. Thus, it was thought that the taste intensity<br />
decreased in ECg <strong>and</strong> EC because the hydrophobicity of<br />
EGCg <strong>and</strong> EGC, with the galloyl group, may be weaker.<br />
Because humans detected bitterness from catechins<br />
<strong>and</strong> mice recognised the taste of catechins, we tried to<br />
record the taste response to catechins. Because it is<br />
known that catechins readily degrade around neutral<br />
pH (Zhu et al., 1997), the stability in Ringer’s solution<br />
used for cell assays was examined. In Ringer’s solution,<br />
EC <strong>and</strong> ECg were more stable than EGCg <strong>and</strong> EGC.<br />
Thus, taste cell responses to ECg that had the strong<br />
taste <strong>and</strong> better stability, of the catechins used, were<br />
recorded. In taste cells isolated from mouse circumvallate<br />
papillae, there were cells that responded to ECg.<br />
Thus, a part of the taste of this compound may be<br />
transduced via taste cells. We performed Ca 2+ imaging<br />
in dispersed taste cells. Not all of the cells observed were<br />
taste cells. Taste cells are divided into four types. It is<br />
reported that some taste cells respond to bitter substances<br />
(Kataoka et al., 2008). Thus, the level of ECgresponsive<br />
cells in the measured cells may have been<br />
low. Also, this level of responsive cells might increase<br />
when ECg is at a concentration higher than 100 lm.<br />
Ó 2010 The Authors. Journal compilation Ó 2010 Institute of Food Science <strong>and</strong> Technology International Journal of Food Science <strong>and</strong> Technology 2010
1584<br />
Taste characterisation of catechins M. Narukawa et al.<br />
Bitter compounds are detected by the T2R family,<br />
which consists of 25 members in humans <strong>and</strong> 34<br />
members in the mouse (Matsunami et al. 2000) (Adler<br />
et al., 2000) (Ch<strong>and</strong>rashekar et al., 2000) (Mueller et al.,<br />
2005). However, a taste receptor that can detect catechins<br />
has not yet been identified. In a study that<br />
investigated the interaction of the catechins with lipid<br />
bilayers using liposome systems, the order of affinity of<br />
the catechins was reported as follows: ECg > EGCg<br />
> EC > EGC (Hashimoto et al., 1999). This is the<br />
same order as the taste intensity of the catechins. In<br />
intracellular bitter taste transduction, pathways that do<br />
not go through receptors have also been reported: these<br />
pathways activate some signal components directly<br />
(Naim et al., 1994) (Cummings & Kinnamon, 1992)<br />
<strong>and</strong> ⁄ or generate phase boundary potentials by absorbing<br />
to lipid bilayer (Kumazawa et al., 1988). This<br />
indicates that the taste of catechins might not be<br />
transduced via taste receptors. Although astringency is<br />
interpreted as a taste separate from the sensation of<br />
bitterness (Schiffman et al., 1992), the details remain<br />
unclear. By further investigating the taste response to<br />
catechins, part of the astringency mechanism may<br />
become clearer.<br />
Acknowledgments<br />
This work was supported by Shizuoka Prefecture<br />
Collaboration of Regional Entities for the Advancement<br />
of Technological Excellence, JST.<br />
References<br />
Adler, E., Hoon, M.A., Mueller, K.L., Ch<strong>and</strong>rashekar, J., Ryba, N.J.<br />
& Zuker, C.S. (2000). A novel family of mammalian taste receptors.<br />
Cell, 100, 693–702.<br />
Ch<strong>and</strong>rashekar, J., Mueller, K.L., Hoon, M.A. et al. (2000). T2Rs<br />
function as bitter taste receptors. Cell, 100, 703–711.<br />
Chen, Z.Y. & Chan, P.T. (1996). Antioxidative activity of green tea<br />
catechins in canola oil. Chemistry <strong>and</strong> Physics of Lipids, 82, 163–172.<br />
Chen, Z.Y., Zhu, Q.Y., Tsang, D. & Huang, Y. (2001). Degradation of<br />
green tea catechins in tea drinks. Journal of Agricultural <strong>and</strong> Food<br />
Chemistry, 49, 477–482.<br />
Cummings, T.A. & Kinnamon, S.C. (1992). Apical K + channels in<br />
Necturus taste cells. Modulation by intracellular factors <strong>and</strong> taste<br />
stimuli. Journal of General Physiology, 99, 591–613.<br />
Goto, T. & Nagashima, H. (1996). Contents of individual tea<br />
catechins <strong>and</strong> caffeine in Japanese green tea. Tea Research Journal,<br />
83, 21–28.<br />
Graham, H.N. (1992). Green tea composition, consumption, <strong>and</strong><br />
polyphenol chemistry. Preventive Medicine, 21, 334–350.<br />
Hashimoto, T., Kumazawa, S., Nanjo, F., Hara, Y. & Nakayama, T.<br />
(1999). Interaction of tea catechins with lipid bilayers investigated<br />
with liposome systems. Bioscience, Biotechnology, <strong>and</strong> Biochemistry,<br />
63, 2252–2255.<br />
Hayashi, N., Chen, R., Ikezaki, H. & Ujihara, U. (2008). Evaluation of<br />
the umami taste intensity of green tea by a taste sensor. Journal of<br />
Agricultural <strong>and</strong> Food Chemistry, 56, 7384–7387.<br />
Henry, J.P. & Stephens-Larson, P. (1984). Reduction of chronic<br />
psychosocial hypertension in mice by decaffeinated tea. Hypertension,<br />
6, 437–444.<br />
Hertog, M.G., Feskens, E.J., Hollman, P.C., Katan, M.B. & Kromhout,<br />
D. (1993). Dietary antioxidant flavonoids <strong>and</strong> risk of coronary<br />
heart disease: the Zutphen Elderly Study. Lancet, 342, 1007–1011.<br />
Imai, K. & Nakachi, K. (1995). Cross sectional study of effects of<br />
drinking green tea on cardiovascular <strong>and</strong> liver diseases. BMJ, 310,<br />
693–696.<br />
Kataoka, S., Yang, R., Ishimaru, Y. et al. (2008). The c<strong>and</strong>idate sour<br />
taste receptor, PKD2L1, is expressed by type III taste cells in the<br />
mouse. Chemical Senses, 33, 243–254.<br />
Kumazawa, T., Kashiwayanagi, M. & Kurihara, K. (1986). Contribution<br />
of electrostatic <strong>and</strong> hydrophobic interactions of bitter<br />
substances with taste receptor membranes to generation of receptor<br />
potentials. Biochimica et Biophysica Acta, 888, 62–69.<br />
Kumazawa, T., Nomura, T. & Kurihara, K. (1988). Liposomes as<br />
model for taste cells: receptor sites for bitter substances including N-<br />
C=S substances <strong>and</strong> mechanism of membrane potential changes.<br />
Biochemistry, 27, 1239–1244.<br />
Maeda-Yamamoto, M., Nagai, H., Suzuki, Y., Ema, K., K<strong>and</strong>a, E. &<br />
Mitsuda, H. (2005). Changes in O-methylated catechin <strong>and</strong> chemical<br />
component contents of ‘Benifuuki’ green tea (Camellia sinensis L.)<br />
beverage under various extraction conditions. Food Science <strong>and</strong><br />
Technology Research, 11, 248–253.<br />
Matsunami, H., Montmayeur, J.P. & Buck, L.B. (2000). A family of<br />
c<strong>and</strong>idate taste receptors. Nature, 404, 601–604.<br />
Mueller, K.L., Hoon, M.A., Erlenbach, I., Ch<strong>and</strong>rashekar, J., Zuker,<br />
C.S. & Ryba, N.J. (2005). The receptors <strong>and</strong> coding logic for bitter<br />
taste. Nature, 434, 225–229.<br />
Naim, M., Seifert, R., Nurnberg, B., Grunbaum, L. & Schultz, G.<br />
(1994). Some taste substances are direct activators of G-proteins.<br />
The Biochemical Journal, 297, 451–454.<br />
Narukawa, M., Mori, T. & Hayashi, Y. (2006). Umami changes<br />
intracellular Ca 2+ levels using intracellular <strong>and</strong> extracellular sources<br />
in mouse taste receptor cells. Bioscience, Biotechnology, <strong>and</strong><br />
Biochemistry, 70, 2613–2619.<br />
Narukawa, M., Kitagawa-Iseki, K., Oike, H., Abe, K., Mori, T. &<br />
Hayashi, Y. (2008). Characterization of umami receptor <strong>and</strong><br />
coupling G protein in mouse taste cells. Neuroreport, 19, 1169–1173.<br />
Narukawa, M., Minamisawa, E. & Hayashi, Y. (2009). Signalling<br />
mechanisms in mouse bitter responsive taste cells. Neuroreport, 20,<br />
936–940.<br />
Noor-Soffalina, S.S., Jinap, S., Nazamid, S. & Nazimah, S.A.H.<br />
(2009). Effect of polyphenol <strong>and</strong> pH on cocoa maillard-related<br />
flavour precursors in a lipidic model system. International Journal of<br />
Food Science <strong>and</strong> Technology, 44, 168–180.<br />
Rossetti, D., Bongaerts, J.H.H., Wantling, E., Stokes, J.R. &<br />
Williamson, A.-M. (2009). Astringency of tea catechins: more than<br />
an oral lubrication tactile percept. Food Hydrocolloids, 23, 1984–<br />
1992.<br />
Scharbert, S. & Hofmann, T. (2005). Molecular definition of black tea<br />
taste by means of quantitative studies, taste reconstitution, <strong>and</strong><br />
omission. Journal of Agricultural <strong>and</strong> Food Chemistry, 53, 5377–<br />
5384.<br />
Schiffman, S.S., Suggs, M.S., Sostman, A.L. & Simon, S.A. (1992).<br />
Chorda tympani <strong>and</strong> lingual nerve responses to astringent compounds<br />
in rodents. Physiology & Behavior, 51, 51–63.<br />
Shi, S.T., Wang, Z.Y., Smith, T.J. et al. (1994). Effects of green tea <strong>and</strong><br />
black tea on 4-(methylnitrosamino)-1-(3-pyridyl)-1-butanone bioactivation,<br />
DNA methylation, <strong>and</strong> lung tumorigenesis in A ⁄ J mice.<br />
Cancer Research, 54, 4641–4647.<br />
Toko, K. (2000). Taste Sensor. Pp. 113–180. U.K., Cambridge<br />
University Press.<br />
Wang, K. & Ruan, J. (2009). Analysis of chemical components in<br />
green tea in relation with perceived quality, A Case Study with<br />
Longjing Teas. International Journal of Food Science <strong>and</strong> Technology,<br />
44, 2476–2484.<br />
Wang, Z.Y., Huang, M.T., Lou, Y.R. et al. (1994). Inhibitory effects<br />
of black tea, green tea, decaffeinated black tea, <strong>and</strong> decaffeinated<br />
green tea on ultraviolet B light-induced skin carcinogenesis in 7,12-<br />
International Journal of Food Science <strong>and</strong> Technology 2010 Ó 2010 The Authors. Journal compilation Ó 2010 Institute of Food Science <strong>and</strong> Technology
dimethylbenz[a]anthracene-initiated SKH-1 mice. Cancer Research,<br />
54, 3428–3435.<br />
Zhang, A., Zhu, Q.Y., Luk, Y.S., Ho, K.Y., Fung, K.P. & Chen, Z.Y.<br />
(1997). Inhibitory effects of jasmine green tea epicatechin isomers on<br />
free radical-induced lysis of red blood cells. Life Sciences, 61, 383–<br />
394.<br />
Zhu, Q.Y., Zhang, A., Tsang, D., Huang, Y. & Chen, Z.Y. (1997).<br />
Stability of green tea catechins. Journal of Agricultural <strong>and</strong> Food<br />
Chemistry, 45, 4624–4628.<br />
Supporting Information<br />
Additional Supporting Information may be found in the<br />
online version of this article:<br />
Taste characterisation of catechins M. Narukawa et al. 1585<br />
Figure S1. Half-period of catechins in Ringer’s solution<br />
(semi-logarithmic scale).<br />
Figure S2. Fluorescence image of the ECG-responsive<br />
cell that loaded with the Ca 2+ -sensitive dye, Fluo-4 AM.<br />
Scale bar = 10 lm.<br />
Please note: Wiley-Blackwell are not responsible for<br />
the content or functionality of any supporting materials<br />
supplied by the authors. Any queries (other than missing<br />
material) should be directed to the corresponding author<br />
for the article.<br />
Ó 2010 The Authors. Journal compilation Ó 2010 Institute of Food Science <strong>and</strong> Technology International Journal of Food Science <strong>and</strong> Technology 2010
1586<br />
Original article<br />
Volatile composition <strong>and</strong> descriptive sensory analysis of Italian<br />
vanilla torrone<br />
Marisa Speziale, 1 Laura Vázquez-Araújo, 2 Antonio Mincione 1 &Ángel A. Carbonell-Barrachina 2 *<br />
1 Università degli Studi Mediterranea di Reggio Calabria, Dipartimento di Biotecnologie per il Monitoraggio Agro-alimentare ed Ambientale,<br />
C.da Melissari – III Lotto – 89124 Reggio Calabria, Italy<br />
2 Universidad Miguel Hernández, Departamento Tecnología Agroalimentaria, Universidad Miguel Hernández, Carretera de Beniel, km 3.2,<br />
03312-Orihuela, Alicante, Spain<br />
(Received 10 January 2010; Accepted in revised form 30 April 2010)<br />
Summary Vanilla torrone is a honey- <strong>and</strong> almond-based confectionery product very famous in Italy, especially during<br />
Christmas. In this study, the effects of two factors, the manufacturing company <strong>and</strong> the manufacturing<br />
season, on the volatile composition of vanilla torrone were studied. Volatile compounds in torrone samples<br />
were extracted using simultaneous distillation-extraction <strong>and</strong> finally isolated, semi-quantified <strong>and</strong> identified<br />
using GC-MS. A trained panel was also used to make a descriptive analysis of torrone. Benzene derivatives<br />
<strong>and</strong> terpenes were the predominant chemical groups in torrone samples. The addition of artificial flavourings<br />
(mainly vanillin <strong>and</strong> benzaldehyde) played an important role in determining the final composition of volatiles<br />
<strong>and</strong> their concentrations. However, the amount <strong>and</strong> quality of almonds <strong>and</strong> honey <strong>and</strong> the intensity of<br />
almond toasting could also play important roles. If manufacturers want to provide a more homogeneous<br />
product to the consumers, more attention should be paid to the composition <strong>and</strong> concentrations of the<br />
flavourings added.<br />
Keywords Almond, aroma profile, descriptive sensory analysis, honey, Italy, turrón.<br />
Introduction<br />
Torrone is a typical Italian product, mainly consumed in<br />
Christmas time, made from almonds (<strong>and</strong> ⁄ or any other<br />
nuts such as pistachio or hazelnut), sugar, inverted<br />
sugar, honey <strong>and</strong> egg albumin, <strong>and</strong> manufactured in a<br />
traditional way in several Italian regions such as<br />
Calabria, Abruzzo, Campania, Lombardy, etc. This<br />
dessert it is included in a list of ‘Traditional Italian Food<br />
Products’ prepared by the Italian Ministry of Agriculture,<br />
Food <strong>and</strong> Forestry in cooperation with all the<br />
Italian regions <strong>and</strong> following the regulation 2081 ⁄ 92<br />
(CEE) from 14th of July 1982 related to the protection<br />
of geographical indications <strong>and</strong> origin designations.<br />
In the manufacturing of torrone in Reggio Calabria,<br />
honey <strong>and</strong> sugars (glucose <strong>and</strong> sucrose) are warmed in a<br />
copper container at low temperature <strong>and</strong> mixed at<br />
uniform speed for 2 h in the ‘torroniera’, where fresh egg<br />
whites have been added. After this time, the caramel<br />
(previously prepared in another copper container using<br />
honey <strong>and</strong> sugars), the natural vanilla extract, a h<strong>and</strong>ful<br />
*Correspondent: Fax: +34 966749677;<br />
e-mail: angel.carbonell@umh.es<br />
International Journal of Food Science <strong>and</strong> Technology 2010, 45, 1586–1593<br />
of pistachios <strong>and</strong> toasted almonds (48 h at 60 °C) are<br />
added. When all the ingredients are properly mixed, the<br />
mass is transferred to a marble table <strong>and</strong> manually<br />
mixed to confer the desired shape using wood frames or<br />
appropriate moulds. To obtain the so-called torrone<br />
vaniglia (vanilla) the product is covered on both surfaces<br />
with wafer, cut, <strong>and</strong> packed. On the other h<strong>and</strong>, the<br />
mixture could be covered by chocolate <strong>and</strong> then the<br />
product is called torrone gi<strong>and</strong>uja (chocolate). However,<br />
there are composition <strong>and</strong> operational differences<br />
between these two types of torrone. For instance, in<br />
general the vanilla torrone has longer times of heating<br />
<strong>and</strong> a higher almond content, which leads to a harder<br />
texture because this type of torrone has less moisture<br />
than chocolate torrone.<br />
Several authors have studied in recent years the aroma<br />
composition from different types of nuts, including the<br />
toasted almonds (Dimick, 1994; Alasalvar et al., 2003;<br />
Krist et al., 2004; Va´zquez-Arau´jo et al., 2008a, 2009),<br />
<strong>and</strong> from different types of Spanish turro´n, a similar<br />
product to the Italian torrone (Va´zquez et al., 2007;<br />
Vázquez-Arau´jo et al., 2008b,c; Narbona et al., 2010).<br />
However, there are no studies related to the aroma of<br />
torrone.<br />
doi:10.1111/j.1365-2621.2010.02307.x<br />
Ó 2010 The Authors. Journal compilation Ó 2010 Institute of Food Science <strong>and</strong> Technology
In the Italian torrone, almonds are raw in many cases<br />
or only slightly toasted, <strong>and</strong> pyrazines should not have<br />
such an important role. Besides, Italian torrone has<br />
artificial flavourings added <strong>and</strong> the main aromatic note<br />
expected is vanilla.<br />
In this work, our main objective was to determine the<br />
general volatile composition of vanilla torrone from the<br />
Reggio Calabria region as affected by the manufacturing<br />
company <strong>and</strong> the manufacturing season. The main<br />
reasons for studying the effects of these factors (company<br />
<strong>and</strong> season) are as follows:<br />
(1) The quality <strong>and</strong> price of the torrone ingredients change<br />
from year to year; therefore, it is expected that the<br />
quality of the torrone may also change. For instance,<br />
manufacturers can reduce the amount of almond if its<br />
price is too high.<br />
(2) Different producers will have different customers ⁄ consumers<br />
<strong>and</strong> they can adjust the quality <strong>and</strong> properties of<br />
their torrone to the specific dem<strong>and</strong> of their consumers.<br />
Materials <strong>and</strong> methods<br />
Torrone<br />
Vanilla torrone samples were kindly provided by six<br />
different artisanal manufacturers of Taurianova (Reggio<br />
Calabria, Southern Italy). Samples were letter coded (A,<br />
B, C, D, E <strong>and</strong> F) to avoid using company names. The<br />
format of vanilla torrone chosen for this study was the<br />
smallest one, with individual bars weighing about 15 g<br />
(approximately 52 · 34 · 33 mm); 20–25 units per company<br />
were collected. Products were sampled during two<br />
consecutive manufacturing seasons: 2007 <strong>and</strong> 2008.<br />
Products were kept until analysis at 10 °C in a chamber<br />
with controlled temperature <strong>and</strong> moisture content.<br />
Simultaneous steam-distillation extraction<br />
Suspension of 30 g of each type of ground torrone were<br />
extracted for aroma volatiles using a Likens–Nickerson<br />
distillator (Afora, Barcelona, Spain), as described in<br />
Va´zquez-Arau´jo et al. (2008a,b,c). Briefly, 30 g of confection<br />
was extracted with 50 mL of dichloromethane,<br />
Cl2CH2. The distillation-extraction process was maintained<br />
for 120 min. The steam-distillation extraction<br />
(SDE) technique was selected because of high recoveries<br />
allied with low variability. Precaution was taken to<br />
ensure that no artefact compounds were included; only<br />
compounds also identified by hydro-distillation using a<br />
Deryng apparatus <strong>and</strong> ⁄ or solid phase micro-extraction,<br />
using a 50 ⁄ 30 lm DVB⁄ CAR ⁄ PDMS fibre, were<br />
included in the list of compounds under study (Alonso<br />
et al., 2009).<br />
As internal st<strong>and</strong>ard, 100 lL of 1-penten-3-one<br />
(1 g L )1 ) was added in the sample flask; this chemical<br />
Aroma of vanilla torrone M. Speziale et al. 1587<br />
was used as internal st<strong>and</strong>ard after checking that it was<br />
absent in Italian torrone samples <strong>and</strong>, under the<br />
proposed conditions, it separates well from other<br />
volatile compounds. Experimental recovery percentage<br />
for 1-penten-3-one in SDE was 97.4%.<br />
After the 120 min of extraction, the organic solvent<br />
was dried over anhydrous sodium sulphate, Na2SO4,<br />
<strong>and</strong> concentrated to 0.4 mL. SDE experiments were run<br />
in triplicate.<br />
GC-MS analytical conditions<br />
The isolation, identification <strong>and</strong> quantification of the<br />
volatile compounds were performed on a gas chromatograph,<br />
Shimadzu GC-17A (Shimadzu Corporation,<br />
Kyoto, Japan), coupled with a Shimadzu mass spectrometer<br />
detector GCMS QP-5050A. The GC-MS<br />
system was equipped with a TRACSIL Meta.X5 column<br />
(Teknokroma S. Coop. C. Ltd, Barcelona, Spain;<br />
30 m · 0.25 mm · 0.25 lm film thickness). Analyses<br />
were carried out using conditions previously described<br />
by Vázquez-Arau´jo et al. (2008a,b,c, 2009).<br />
Most of the compounds were identified using three<br />
different analytical methods: (i) Kovats indices,<br />
(ii) GCMS retention indices (authentic chemicals) <strong>and</strong><br />
(iii) mass spectra (authentic chemicals <strong>and</strong> Wiley spectral<br />
library collection) (McLafferty, 2000). Identification<br />
was considered tentative when it was based only on<br />
mass-spectral data (Table 1).<br />
For the semi-quantification of the volatile compounds,<br />
1-penten-3-one was used as internal st<strong>and</strong>ard.<br />
Data included in this study should be considered as<br />
semi-quantitative, because no st<strong>and</strong>ard curves were<br />
carried out for each one the quantified volatile compounds.<br />
Sensory evaluation with trained panel<br />
Sensory evaluation, with trained panel, was used to<br />
discriminate <strong>and</strong> quantify main sensory attributes of<br />
torrone samples manufactured in 2008. A panel of ten<br />
panellists, aged 24–53 (five women <strong>and</strong> five men, all<br />
members of the panel of the Regulating Council of the<br />
Specific Denominations of Jijona <strong>and</strong> Turro´n de Alicante,<br />
RCSDJTA), with wide experience in sensory<br />
evaluation of turro´n, chocolate <strong>and</strong> derivates, evaluated<br />
the six trademarks of vanilla torrone.<br />
The panel was selected <strong>and</strong> trained following the ISO<br />
st<strong>and</strong>ard 8586-1 (1993) st<strong>and</strong>ard. Details of panel<br />
selection, training <strong>and</strong> validation could be found in<br />
Vázquez-Arau´jo et al. (2005). Descriptive sensory analysis<br />
(DSA) has been successfully used for comparing<br />
odour <strong>and</strong> taste attributes in foods <strong>and</strong> their products<br />
(Alasalvar et al., 2003; Vázquez-Arau´jo et al., 2008b;<br />
Narbona et al., 2010). Torrone samples were assessed<br />
using a flavour profile method (Meilgaard et al., 1999).<br />
Ó 2010 The Authors. Journal compilation Ó 2010 Institute of Food Science <strong>and</strong> Technology International Journal of Food Science <strong>and</strong> Technology 2010
1588<br />
Aroma of vanilla torrone M. Speziale et al.<br />
Table 1 Volatile compounds studied with their identification method, Kovats indices for this study <strong>and</strong> literature values, odour thresholds in water<br />
<strong>and</strong> aroma descriptors<br />
Compound RT KI (experimental) KI (literature) † OT (mg kg )1 ) à<br />
Prior to DSA, panellists discussed the flavour properties<br />
of torrone during two preliminary orientation<br />
sessions, each lasting 90 min, until they had agreed on<br />
their use of flavour attributes. During these orientation<br />
experiments, panellists evaluated three different coded<br />
samples of torrone from different manufacturing companies.<br />
Twelve appearance, flavour <strong>and</strong> texture attributes<br />
were identified, <strong>and</strong> st<strong>and</strong>ards were made available<br />
for panellists (Table 2).<br />
Measurements were performed in individual booths<br />
with controlled illumination (70–90 fc) <strong>and</strong> temperature<br />
(23 ± 2 °C) (AENOR, 1997).<br />
The individual products were scored for the intensity<br />
of the sensory parameters on a scale of 0–10, where:<br />
Descriptor<br />
3-Hydroxy-2-butanone 3.75 743 743 0.8<br />
Hexanal §<br />
4.79 764 800 0.0045 Fatty, fruity, green<br />
Dihydro-2-methyl-3(2H)-furanone §<br />
6.6 801 804<br />
2-Hexanol 7.0 809 810 0.006<br />
Furfural §<br />
7.8 826 831 3 Sweet, woody, almond, fragrant, baked bread<br />
Furfuryl alcohol 9.3 856 860 1.9 Low odour, cooked sugar taste<br />
1-Hexanol 9.9 868 872 0.5<br />
2-Heptanone 10.7 885 891 0.14 Fruity, spicy, cinnamon<br />
Heptanal §<br />
11.3 896 900 0.003 Oily, woody, fatty, fruity, nutty<br />
2-Acetylfuran 11.8 906 910 Almond, beef, caramel, musty, coffee,<br />
potato, tobacco<br />
a-Pinene §<br />
13.0 926 930 0.006 Woody<br />
Benzaldehyde §<br />
14.8 960 960 0.35 Bitter almond, fragrant, aromatic, sweet<br />
b-Pinene §<br />
15.4 970 971 0.14 Woody<br />
1-Heptanol 15.6 973 970 0.425<br />
2-Amylfuran 16.4 988 988<br />
Octanal §<br />
17.1 1000 1000 0.0007 Fatty, citrus, honey on dilution<br />
Limonene §<br />
18.4 1025 1025 1 Mild, citrus, orange, lemon<br />
Benzyl alcohol §<br />
19.3 1040 1032 20 Berry, cherry, grapefruit, citrus, walnut<br />
b-Ocimene 20.1 1056 1055<br />
Linalool oxide 21.0 1072 1086 0.32<br />
Nonanal §<br />
22.8 1104 1102 0.001 Floral, citrus, orange, rose, fatty, waxy<br />
Phenetylalcohol 23.4 1116 1113 Honey, floral, rose<br />
E-2-Nonenal 25.7 1161 1158 0.00008 Penetrating, fatty, waxy, vegetable, earthy<br />
1-Nonanol 26.6 1178 1174 Citrus, rose<br />
Neral 29.9 1243 1249 Lemon<br />
2-Decenal 31.0 1266 1260 0.0004 Orange, slightly fatty, floral, earthy, chocolate<br />
(E, Z)2,4-decadienal –<br />
32.3 1292 1284 0.00007 Powerful, fatty, citrus<br />
(E, E)2,4-decadienal §<br />
33.7 1323 1330 0.00007 Powerful, fatty, citrus<br />
Methyl anthranilate 34.82 1346 1354 0.003 Chocolate, grape, jasmine, lemon, fruity,<br />
herbaceous, floral<br />
E-2-Undecenal 35.87 1369 1371 Orange, fruity, herbaceous<br />
Vanillin §<br />
37.87 1412 1406 Vanilla, caramel<br />
Farnesene 41.77 1499 1505 Apple, lavender, lime, green, woody, herbaceous<br />
Ethyl citrate –<br />
48.84 1669 Wine-like, plum, sweet<br />
† NIST (2009).<br />
à Buttery et al. (1999), Serra Bonvehi (2005), <strong>and</strong> Pino & Mesa (2006).<br />
§ Authentic st<strong>and</strong>ards were used.<br />
– Tentatively identified (only Wiley library).<br />
• 0 = no appreciation of this parameter;<br />
• 5 = moderate intensity (regular intensity in this parameter);<br />
• 10 = extremely intense.<br />
A complete block design was made <strong>and</strong> torrone<br />
samples were presented (coded with a three-digit<br />
r<strong>and</strong>om number), one by one, following a Williams<br />
latin squared design balanced for order <strong>and</strong> first-order<br />
carry-over effects (Meilgaard et al., 1999). Panellists<br />
relied on their training experience to score products. The<br />
entire experiment was repeated three times (all judges<br />
scored all six samples on each session for a total of<br />
three sessions), <strong>and</strong> the sensory scores were presented as<br />
the overall means.<br />
International Journal of Food Science <strong>and</strong> Technology 2010 Ó 2010 The Authors. Journal compilation Ó 2010 Institute of Food Science <strong>and</strong> Technology
Table 2 Attributes selected for descriptive sensory analysis<br />
Attribute Characteristics References<br />
Statistical analysis<br />
All data were subjected to analysis of variance (anova)<br />
<strong>and</strong> the Tukey’s least significant difference multicomparison<br />
test to determine significant differences among<br />
torrone samples as affected by the manufacturing<br />
company <strong>and</strong> season. Significant differences were<br />
reported for P £ 0.05. The statistical analyses were<br />
carried out using SPSS 14.0 (SPSS Science, Chicago, IL,<br />
USA) <strong>and</strong> figures using Sigma Plot 9.0 (SPSS Science).<br />
Results <strong>and</strong> discussion<br />
Instrumental analysis of volatile compounds<br />
The suitability of SDE for analysing the volatile<br />
composition of almond-honey confection was previously<br />
discussed (Va´zquez-Arau´jo et al., 2008a,b). Preliminary<br />
tests were carried out using deodorised almond<br />
matrices (extracted with 1:1 pentane-diethyl ether for<br />
24 h at 40 °C) to study reproducibility <strong>and</strong> recovery of<br />
volatile compounds. The compounds assayed included<br />
2-methylpyrazine, 2,5-dimethylpyrazine, 2-ethyl-3-methylpyrazine,<br />
furfuryl alcohol <strong>and</strong> 2-acetylpyrrole. Their<br />
recoveries after 120 min of distillation-extraction ranged<br />
from 76.3% for 2-acetylpyrrole up to 99.9% 2-methylpyrazine,<br />
with a mean value of 86.7%; the st<strong>and</strong>ard<br />
error of measurements was always D > E > B > F > C.<br />
Vázquez et al. (2007) studied the changes in volatile<br />
compounds during concentration of honey <strong>and</strong> sugars in<br />
Alicante <strong>and</strong> Jijona turro´n <strong>and</strong> the concentration of total<br />
volatile chemicals found was 174 mg kg )1 (only turro´n<br />
mass was studied <strong>and</strong> no toasted almonds were under<br />
consideration at this stage). Later, Vázquez-Arau´jo<br />
et al. (2008c) studied the aromatic compounds of<br />
Alicante <strong>and</strong> Jijona turro´n <strong>and</strong> reported values<br />
207 ± 36 <strong>and</strong> 194 ± 26 mg kg )1 , respectively. In general,<br />
turro´n seemed to present higher total concentrations<br />
of volatiles, although some of the torrone samples<br />
A-2007 (company-season), D-2007 <strong>and</strong> E-2007 were at<br />
the same level.<br />
Thirty-three compounds were isolated, identified <strong>and</strong><br />
quantified in the volatile profile of vanilla torrone<br />
(Table 1). These compounds can be grouped in seven<br />
chemical families: aldehydes (ten compounds), benzene<br />
derivatives (four compounds), furans (five compounds),<br />
terpenes (six compounds), alcohols (four compounds),<br />
ketones (two compounds) <strong>and</strong> esters (two compounds)<br />
(Table 3); these chemical groups contributed to the total<br />
concentration of volatiles in the following manner:<br />
8.5%, 78.7%, 5.8%, 4.0%, 2.1%, 0.5% <strong>and</strong> 0.4%,<br />
respectively.<br />
The most abundant group was benzene derivatives<br />
(Fig. 1), because of the high concentrations of three<br />
compounds: benzaldehyde, benzyl alcohol <strong>and</strong> vanillin.<br />
It seems from the volatile profile that some compounds<br />
could be artificially present in this type of confection,<br />
especially benzaldehyde, which is a natural compound<br />
present in almonds, but not as such high concentrations<br />
(Va´zquez-Arau´jo et al., 2008a, 2009).<br />
The facts that no pyrazines <strong>and</strong> pyrroles were detected<br />
<strong>and</strong> that only low concentrations of furans were present<br />
in this type of torrone indicated that almonds are used<br />
without any toasting step. Vázquez-Arau´jo et al. (2008c)<br />
Ó 2010 The Authors. Journal compilation Ó 2010 Institute of Food Science <strong>and</strong> Technology International Journal of Food Science <strong>and</strong> Technology 2010
1590<br />
Aroma of vanilla torrone M. Speziale et al.<br />
Table 3 Volatile compounds (mg ⁄ kg) found in six manufacturing companies of vanilla torrone<br />
A B C D E F<br />
Compound<br />
2007 2008 2007 2008 2007 2008 2007 2008 2007 2008 2007 2008<br />
Aldehydes<br />
Hexanal 8.56 ± 0.06 †<br />
0.34 ± 0.08 1.03 ± 0.19 0.49 ± 0.20 0.16 ± 0.01 0.30 ± 0.03 0.43 ± 0.02 0.14 ± 0.05 2.46 ± 0.34 0.19 ± 0.06 3.94 ± 0.34 0.28 ± 0.07<br />
Heptanal 0.43 ± 0.01 0.01 ± 0.01 0.10 ± 0.01 0.03 ± 0.01 0.01 ± 0.01 0.02 ± 0.01 0.02 ± 0.01 0.01 ± 0.01 0.50 ± 0.03 0.04 ± 0.01 0.34 ± 0.02 0.02 ± 0.01<br />
Octanal 0.54 ± 0.01 0.02 ± 0.01 0.30 ± 0.06 0.08 ± 0.05 0.01 ± 0.01 0.03 ± 0.01 0.07 ± 0.01 0.01 ± 0.01 1.16 ± 0.01 0.12 ± 0.03 0.35 ± 0.09 0.02 ± 0.01<br />
Nonanal 5.54 ± 0.61 0.81 ± 0.35 1.14 ± 0.01 0.74 ± 0.33 0.12 ± 0.01 0.49 ± 0.13 0.57 ± 0.02 0.51 ± 0.08 3.03 ± 0.08 0.42 ± 0.08 2.81 ± 0.02 0.61 ± 0.07<br />
trans-2-Nonenal 1.27 ± 0.14 0.12 ± 0.04 0.30 ± 0.01 0.58 ± 0.31 0.02 ± 0.01 0.10 ± 0.01 0.36 ± 0.03 0.18 ± 0.05 0.86 ± 0.02 0.09 ± 0.08 3.55 ± 0.28 0.15 ± 0.01<br />
Citral 0.10 ± 0.01 n.d. 0.02 ± 0.01 n.d. n.d. n.d. 0.05 ± 0.01 0.01 ± 0.01 0.22 ± 0.03 n.d. 0.07 ± 0.03 n.d.<br />
2-Decenal 0.70 ± 0.04 0.07 ± 0.02 0.33 ± 0.09 0.14 ± 0.08 0.03 ± 0.01 0.08 ± 0.01 0.15 ± 0.03 0.03 ± 0.01 0.71 ± 0.01 0.09 ± 0.04 0.70 ± 0.07 0.06 ± 0.01<br />
(E, Z) 2,4-Decadienal 7.60 ± 1.28 0.18 ± 0.05 0.67 ± 0.03 0.41 ± 0.10 0.15 ± 0.01 0.18 ± 0.07 0.32 ± 0.10 0.05 ± 0.01 1.62 ± 0.28 0.20 ± 0.08 1.06 ± 0.02 0.19 ± 0.01<br />
(E, E) 2,4-Decadienal n.d. 0.26 ± 0.26 n.d. 1.29 ± 0.42 0.50 ± 0.02 0.71 ± 0.23 0.76 ± 0.20 0.26 ± 0.02 1.02 ± 0.12 n.d. 4.96 ± 0.52 n.d.<br />
E-2-Undecenal 0.67 ± 0.07 n.d. 0.29 ± 0.08 0.16 ± 0.09 0.03 ± 0.01 n.d. 0.08 ± 0.01 0.03 ± 0.01 0.68 ± 0.10 0.11 ± 0.01 0.36 ± 0.33 0.07 ± 0.01<br />
25.4 ± 2.2 1.82 ± 0.82 4.18 ± 0.49 3.92 ± 1.59 1.01 ± 0.10 1.91 ± 0.50 2.80 ± 0.44 1.22 ± 0.26 12.3 ± 1.0 1.26 ± 0.39 18.1 ± 1.72 1.40 ± 0.20<br />
Benzene derivates<br />
Benzaldehyde 45.0 ± 2.3 2.86 ± 0.80 26.6 ± 2.8 25.2 ± 11.9 12.4 ± 0.6 4.95 ± 0.11 105 ± 13 23.8 ± 0.7 67.4 ± 10.0 5.00 ± 2.69 16.0 ± 2.7 18.9 ± 2.2<br />
Benzyl alcohol 12.0 ± 1.9 0.84 ± 0.44 1.53 ± 0.15 0.44 ± 0.04 0.37 ± 0.02 2.29 ± 0.42 2.55 ± 0.25 1.21 ± 0.22 5.10 ± 0.19 0.91 ± 0.22 10.2 ± 0.01 1.28 ± 0.26<br />
Phenetylalcohol 1.66 ± 0.12 n.d. 0.37 ± 0.21 0.01 ± 0.01 0.09 ± 0.01 0.16 ± 0.05 0.49 ± 0.04 0.08 ± 0.02 0.45 ± 0.01 0.08 ± 0.05 1.57 ± 0.43 0.20 ± 0.02<br />
Vanillin 145 ± 33 58.9 ± 3.0 13.1 ± 6.5 29.6 ± 13.4 1.17 ± 0.06 13.2 ± 0.1 9.61 ± 0.62 11.2 ± 2.1 2.43 ± 0.35 3.25 ± 1.00 11.7 ± 2.6 1.28 ± 0.29<br />
203 ± 37 62.6 ± 4.2 41.6 ± 9.8 55.2 ± 25.4 14.0 ± 0.7 20.6 ± 0.7 118 ± 14 36.3 ± 3.1 75.4 ± 10.6 9.24 ± 3.97 39.4 ± 5.7 21.7 ± 2.8<br />
Furans<br />
Dihydro-2-methyl- 1.87 ± 0.99 0.07 ± 0.03 0.20 ± 0.09 0.03 ± 0.01 0.06 ± 0.01 0.02 ± 0.01 0.08 ± 0.02 0.03 ± 0.01 0.44 ± 0.09 0.02 ± 0.01 0.90 ± 0.13 0.05 ± 0.02<br />
3(2H)-furanone<br />
Furfural 16.3 ± 2.8 0.56 ± 0.42 1.81 ± 1.29 0.28 ± 0.14 0.32 ± 0.02 0.04 ± 0.04 0.58 ± 0.22 0.23 ± 0.13 2.77 ± 0.71 0.26 ± 0.13 3.19 ± 0.49 0.41 ± 0.22<br />
Furfuryl alcohol 9.19 ± 3.41 0.43 ± 0.30 1.50 ± 1.11 0.18 ± 0.11 0.28 ± 0.01 0.04 ± 0.04 0.65 ± 0.47 0.19 ± 0.11 0.27 ± 0.17 0.06 ± 0.05 1.44 ± 0.18 0.34 ± 0.12<br />
2-Acetylfuran 1.69 ± 0.79 n.d. 0.23 ± 0.18 n.d. 0.04 ± 0.01 n.d. 0.25 ± 0.12 n.d. 0.23 ± 0.13 0.01 ± 0.01 0.39 ± 0.16 0.03 ± 0.01<br />
2-Amylfuran 0.99 ± 0.03 0.08 ± 0.03 0.21 ± 0.07 0.15 ± 0.06 0.03 ± 0.01 0.11 ± 0.01 0.14 ± 0.02 0.04 ± 0.01 0.73 ± 0.08 0.04 ± 0.03 0.78 ± 0.29 0.11 ± 0.01<br />
30.1 ± 8.0 1.14 ± 0.78 3.95 ± 2.74 0.63 ± 0.32 0.74 ± 0.06 0.21 ± 0.10 1.69 ± 0.85 0.50 ± 0.26 4.44 ± 1.18 0.39 ± 0.23 6.70 ± 1.25 0.95 ± 0.38<br />
Terpenes<br />
a-Pinene 0.41 ± 0.01 0.41 ± 0.12 0.03 ± 0.01 0.05 ± 0.02 n.d. 0.03 ± 0.01 0.06 ± 0.01 0.02 ± 0.01 0.26 ± 0.01 0.04 ± 0.01 0.22 ± 0.06 0.02 ± 0.01<br />
b-Pinene 0.14 ± 0.05 0.10 ± 0.01 0.04 ± 0.01 0.02 ± 0.01 0.01 ± 0.01 0.06 ± 0.01 n.d. 0.01 ± 0.01 0.17 ± 0.02 0.01 ± 0.01 0.18 ± 0.09 0.04 ± 0.01<br />
Limonene 6.77 ± 0.98 0.67 ± 0.26 1.56 ± 0.09 0.48 ± 0.19 0.23 ± 0.01 1.14 ± 0.18 2.25 ± 0.27 0.30 ± 0.01 6.71 ± 0.49 0.36 ± 0.14 5.53 ± 1.26 0.39 ± 0.04<br />
b-Ocimene 0.89 ± 0.14 0.06 ± 0.01 0.18 ± 0.01 n.d. 0.03 ± 0.01 0.10 ± 0.01 0.19 ± 0.02 0.01 ± 0.01 0.78 ± 0.01 0.02 ± 0.01 0.62 ± 0.19 0.05 ± 0.01<br />
Linalool oxide 2.49 ± 0.24 0.10 ± 0.01 0.23 ± 0.14 0.01 ± 0.01 0.01 ± 0.01 0.04 ± 0.01 0.14 ± 0.08 0.01 ± 0.01 0.32 ± 0.03 0.03 ± 0.01 0.31 ± 0.07 0.01 ± 0.01<br />
Farnesene 0.02 ± 0.02 n.d. n.d. n.d. n.d. n.d. 0.05 ± 0.01 n.d. 0.06 ± 0.06 n.d. n.d. 0.01 ± 0.01<br />
10.7 ± 1.4 1.34 ± 0.41 2.04 ± 0.26 0.56 ± 0.23 0.29 ± 0.04 1.37 ± 0.22 2.69 ± 0.39 0.36 ± 0.05 8.29 ± 0.62 0.46 ± 0.18 6.86 ± 1.67 0.53 ± 0.09<br />
Alcohols<br />
2-Hexanol 2.79 ± 0.37 n.d. 0.34 ± 0.01 n.d. 0.09 ± 0.01 n.d. 0.10 ± 0.03 n.d. 0.09 ± 0.02 n.d. 0.57 ± 0.43 n.d.<br />
1-Hexanol 7.33 ± 0.25 0.01 ± 0.01 0.22 ± 0.03 0.09 ± 0.01 0.02 ± 0.01 0.21 ± 0.09 0.18 ± 0.01 n.d. 0.47 ± 0.07 0.02 ± 0.01 0.84 ± 0.37 0.06 ± 0.03<br />
1-Heptanol 1.03 ± 0.24 n.d. 0.10 ± 0.03 n.d. n.d. 0.01 ± 0.01 n.d. n.d. 0.49 ± 0.01 n.d. 0.18 ± 0.01 n.d.<br />
1-Nonanol 1.21 ± 0.02 0.02 ± 0.01 0.20 ± 0.07 0.03 ± 0.01 0.02 ± 0.01 0.06 ± 0.01 0.10 ± 0.01 0.01 ± 0.01 0.61 ± 0.02 0.02 ± 0.02 0.78 ± 0.03 0.09 ± 0.01<br />
12.4 ± 0.9 0.03 ± 0.02 0.86 ± 0.14 0.12 ± 0.02 0.13 ± 0.03 0.28 ± 0.11 0.37 ± 0.05 0.01 ± 0.01 1.67 ± 0.12 0.04 ± 0.03 2.38 ± 0.84 0.15 ± 0.04<br />
International Journal of Food Science <strong>and</strong> Technology 2010 Ó 2010 The Authors. Journal compilation Ó 2010 Institute of Food Science <strong>and</strong> Technology
Table 3 (Continued)<br />
A B C D E F<br />
Compound 2007 2008 2007 2008 2007 2008 2007 2008 2007 2008 2007 2008<br />
Ketones<br />
3-Hydroxy- 1.22 ± 0.40 0.01 ± 0.01 0.14 ± 0.01 0.01 ± 0.01 0.04 ± 0.01 0.01 ± 0.01 0.14 ± 0.02 0.02 ± 0.01 0.18 ± 0.06 0.01 ± 0.01 0.52 ± 0.14 n.d.<br />
2-butanone<br />
2-Heptanone 1.25 ± 0.92 0.05 ± 0.02 0.08 ± 0.02 0.01 ± 0.01 n.d. n.d. 0.09 ± 0.03 n.d. 0.30 ± 0.04 0.03 ± 0.01 0.18 ± 0.05 0.03 ± 0.01<br />
2.48 ± 1.32 0.06 ± 0.03 0.21 ± 0.03 0.02 ± 0.02 0.04 ± 0.01 0.01 ± 0.01 0.22 ± 0.05 0.02 ± 0.01 0.47 ± 0.10 0.03 ± 0.02 0.70 ± 0.19 0.03 ± 0.01<br />
Esters<br />
Methyl n.d. n.d. 0.29 ± 0.14 0.23 ± 0.01 0.03 ± 0.01 0.27 ± 0.01 n.d. n.d. 1.36 ± 0.38 0.54 ± 0.08 n.d. n.d.<br />
anthranilate<br />
Ethyl citrate 0.03 ± 0.01 n.d. n.d. n.d. n.d. n.d. n.d. n.d. n.d. 0.58 ± 0.33 n.d. n.d.<br />
0.03 ± 0.01 n.d. 0.29 ± 0.14 0.23 ± 0.01 0.03 ± 0.01 0.27 ± 0.01 n.d. n.d. 1.36 ± 0.38 1.13 ± 0.41 n.d. n.d.<br />
Total 284 ± 51 67.0 ± 6.2 52.8 ± 13.6 60.5 ± 27.6 16.2 ± 1.0 24.3 ± 1.7 125 ± 16 38.4 ± 3.7 104 ± 25 12.5 ± 5.2 74.2 ± 10.3 24.7 ± 3.5<br />
† Values reported are the mean of three replicates (±st<strong>and</strong>ard error).<br />
Concentration (mg kg –1 )<br />
100<br />
80<br />
60<br />
20<br />
10<br />
0<br />
Aldehydes<br />
Benzene derivatives<br />
Furans<br />
Terpenes<br />
Alcohols<br />
Ketones<br />
Esters<br />
Total<br />
Figure 1 Grouping of volatile compounds according to their<br />
chemical nature in vanilla torrone. Values represented here are the<br />
mean of six manufacturing companies <strong>and</strong> two seasons.<br />
concluded that during manufacturing of Jijona turro´n,<br />
the most complex (more thermal steps) Spanish confection,<br />
the concentrations of benzene derivatives <strong>and</strong><br />
terpenes decreased while concentrations of pyrazines,<br />
furans <strong>and</strong> pyrroles increased.<br />
Descriptive sensory analysis<br />
Because this is the first study on vanilla torrone, the most<br />
important thing is to characterise this typical Italian<br />
Christmas confection. Figure 2 summarises its sensory<br />
profile, which has higher values of vanilla flavour,<br />
Solubility<br />
Cohesiveness<br />
Fracturability<br />
Adhesiveness<br />
Hardness<br />
Aroma of vanilla torrone M. Speziale et al. 1591<br />
Colour<br />
10<br />
8<br />
6<br />
4<br />
2<br />
0<br />
Sweet<br />
Alm. amount<br />
Vanilla flav.<br />
Alm. size<br />
Almond flav.<br />
Honey flav.<br />
Figure 2 Descriptive sensory analysis of appearance, flavour <strong>and</strong><br />
texture attributes of vanilla torrone. Values represented here are the<br />
mean of six manufacturing companies <strong>and</strong> ten panellists.<br />
Ó 2010 The Authors. Journal compilation Ó 2010 Institute of Food Science <strong>and</strong> Technology International Journal of Food Science <strong>and</strong> Technology 2010
1592<br />
Aroma of vanilla torrone M. Speziale et al.<br />
Table 4 Descriptive sensory analysis of vanilla torrone samples from the 2008 season<br />
Variation source Colour<br />
ANOVA test<br />
Assessor NS †<br />
Almond Flavour<br />
Amount Size Almond Honey Vanilla Sweetness Hardness Fracturability Cohesiveness Solubility Adhesiveness<br />
sweetness, cohesiveness <strong>and</strong> adhesiveness, but lower<br />
values of almond amount, almond flavour (especially<br />
toasted notes) than Spanish turro´n (Va´zquez-Arau´jo<br />
et al., 2008b; : Va´zquez-Arau´jo et al., 2008c, 2006).<br />
These differences are attributed to the following factors:<br />
(1) formulation: in Spanish turro´n, no vanilla flavouring can<br />
be added; the amount of almond is higher because of the<br />
legal requirements, <strong>and</strong> therefore the amount of sugars<br />
<strong>and</strong> sweetness are lower, <strong>and</strong><br />
(2) manufacturing conditions: the toasting of almonds is<br />
softer in Italian torrone <strong>and</strong> this product is intended to<br />
be more cohesive <strong>and</strong> chewable than Spanish turro´n<br />
(Speziale, 2010).<br />
Intensities for a number of organoleptic attributes<br />
(‘amount of almond’, ‘sweetness’, ‘hardness’) were not<br />
significantly (P > 0.05) affected by the manufacturing<br />
company (only samples from the 2008 season were used<br />
for sensory studies) (Table 4).<br />
The colour of samples from companies F <strong>and</strong> C was<br />
white <strong>and</strong> changed towards a more yellowish-white in B<br />
<strong>and</strong> E samples (Table 3). Samples from the company D<br />
had a higher amount of almonds but of a smaller size<br />
compared to all other samples. Regarding texture,<br />
samples of companies E <strong>and</strong> F were different from the<br />
other ones because they presented higher values of<br />
cohesiveness <strong>and</strong> adhesiveness, <strong>and</strong> lower of fracturability<br />
<strong>and</strong> solubility in saliva.<br />
As expected, the most relevant flavour attributes<br />
selected by the trained panel to describe vanilla torrone<br />
were almond, honey <strong>and</strong> vanilla flavours (Table 4). This<br />
selection could be expected after seeing the sensory<br />
descriptors <strong>and</strong> odour thresholds included in Table 1<br />
<strong>and</strong> the concentrations from Table 3. The almond<br />
flavour obtained a mean value for all companies of<br />
about 3.2 ± 0.3 (5 = moderate intensity) (Table 4),<br />
implying once again that almost were not toasted at all<br />
Texture<br />
NS NS NS NS NS NS NS NS NS NS NS<br />
Company * NS *** NS * NS NS NS ** *** *** ***<br />
Tukey’s multiple range test<br />
A 3.9 à ab § 2.0 2.0 ab 3.8 2.9 a 6.4 5.9 4.8 ab 5.5 ab 5.1 b 5.4 a 5.1 bc<br />
B 4.9 a 2.6 2.0 ab 3.1 2.3 ab 5.9 5.8 4.4 ab 5.6 a 4.4 b 5.9 a 3.4 c<br />
C 1.9 b 1.9 2.3 ab 2.5 1.3 b 4.6 4.9 2.7 b 4.3 ab 5.3 b 4.4 ab 5.4 bc<br />
D 3.9 ab 4.7 1.1 b 3.3 1.8 ab 5.4 5.6 4.4 ab 5.2 ab 5.2 b 4.5 ab 4.7 bc<br />
E 4.7 ab 2.6 2.6 a 3.5 2.4 ab 4.1 5.2 5.5 a 2.9 b 7.8 a 2.6 b 8.3 a<br />
F 1.9 b 1.9 1.6 ab 2.9 1.7 ab 4.7 4.9 4.0 ab 2.9 b 5.8 ab 3.9 ab 5.9 b<br />
*, **, <strong>and</strong> ***, significant at P < 0.05, 0.01, <strong>and</strong> 0.001, respectively.<br />
† NS = not significant F ratio (P < 0.05).<br />
à Values are the mean of ten panellists (three sessions).<br />
§ Values followed by the same letter, within the same variation source, were not significant different (P < 0.05), Tukey’s multiple-range test.<br />
or just slightly toasted. On the other h<strong>and</strong>, <strong>and</strong> as<br />
expected, the intensity of honey flavour was low,<br />
2.0 ± 0.3 (Table 4), because the almond <strong>and</strong> especially<br />
vanilla notes will mask the perception of the honey<br />
ones; besides, honey is usually present in torrone at<br />
concentrations lower than 10%. Finally, the highest<br />
flavour notes were those of vanilla (mean of 5.2 ± 0.4)<br />
(Table 4), which was expected after seeing the high<br />
contents of vanillin in some of the torrone samples, for<br />
instance A-2007. The intensity of the vanilla flavour<br />
was quantified at 5.2 but comparing to other vanilla<br />
torrone, without any doubt the vanilla intensity in this<br />
type of torrone is much higher than in any other type of<br />
turro´n, torrone or nougat. The higher values of the<br />
intensities of ‘vanilla flavour’ in torrone samples<br />
from companies A <strong>and</strong> B (season 2008) were without<br />
any doubt related to the high concentration of the<br />
group benzene derivatives (especially vanillin <strong>and</strong><br />
Total volatile compounds (mg kg –1 )<br />
80<br />
60<br />
40<br />
20<br />
Total volatile compounds<br />
Total benzene derivatives<br />
R 2 = 0.9778<br />
R 2 = 0.9877<br />
0<br />
0<br />
3.5 4.0 4.5 5.0 5.5 6.0 6.5 7.0<br />
Sensory vanilla<br />
Figure 3 Relationship among total volatile compounds (mg ⁄ kg) <strong>and</strong><br />
total benzene derivatives (mg ⁄ kg) with the intensity of the sensory<br />
attribute ‘vanilla flavour’.<br />
International Journal of Food Science <strong>and</strong> Technology 2010 Ó 2010 The Authors. Journal compilation Ó 2010 Institute of Food Science <strong>and</strong> Technology<br />
80<br />
60<br />
40<br />
20<br />
Total benzene derivatives (mg kg –1 )
enzaldehyde) <strong>and</strong> thus the total volatile concentrations.<br />
Significant positive correlations (P > 0.001) were<br />
found for both relationships with coefficients of determination<br />
higher than 0.97 (Fig. 3).<br />
Conclusions<br />
The artisan nature of the Italian vanilla torrone was<br />
evident in the fact that the total concentrations of<br />
volatiles were very heterogeneous <strong>and</strong> were significantly<br />
affected by both the manufacturing companies <strong>and</strong> the<br />
manufacturing season. For example, the total concentration<br />
could take a value >100 mg kg )1 on the season<br />
2007 <strong>and</strong> decreased as low as 12.5 mg kg )1 in the<br />
following season. These important differences in the<br />
volatile composition of torrone could be because of<br />
different reasons: (i) the addition of different artificial<br />
aromas (mainly vanillin <strong>and</strong> benzaldehyde) <strong>and</strong> at<br />
different concentrations by each company <strong>and</strong> depending<br />
on the quality of the raw ingredients, <strong>and</strong> (ii) the<br />
toasting of almonds, <strong>and</strong> (iii) the quality <strong>and</strong> amount of<br />
both almonds <strong>and</strong> honey.<br />
References<br />
AENOR (Asociación Española de Normalizacio´n y Certificación).<br />
(1997). Sensory Analysis. UNE St<strong>and</strong>ards [In Spanish]. Madrid<br />
(Spain): AENOR.<br />
Alasalvar, C., Shahidi, F. & Cadwallader, K.R. (2003). Comparison of<br />
natural <strong>and</strong> roasted Turkish tombul hazelnut (Corylus avellana L.)<br />
volatiles <strong>and</strong> flavor by DHA ⁄ GC ⁄ MS <strong>and</strong> descriptive sensory<br />
analysis. Journal of Agricultural <strong>and</strong> Food Chemistry, 51, 5067–5072.<br />
Alonso, A., Vázquez-Arau´jo, L., García-Martínez, S., Ruiz, J.J. &<br />
Carbonell-Barrachina, A.A. (2009). Volatile compounds of traditional<br />
<strong>and</strong> virus-resistant breeding lines of Muchamiel tomatoes.<br />
European Food Research <strong>and</strong> Technology, 230, 315–323.<br />
Buttery, R.G., Orts, W.J., Takeoka, G.R. & Nam, Y. (1999). Volatile<br />
flavor components of rice cakes. Journal of Agricultural <strong>and</strong> Food<br />
Chemistry, 47, 4353–4356.<br />
Dimick, P.S. (1994). Peanut flavor-fade research report. Manufacturing<br />
Confectioner, January (1), 45–48.<br />
Krist, S., Unterweger, H., B<strong>and</strong>ion, F. & Buchbauer, G. (2004).<br />
Volatile compound analysis of SPME headspace <strong>and</strong> extract<br />
samples from roasted Italian chestnuts (Castanea sativa Mill.).<br />
European Food Research <strong>and</strong> Technology, 219, 470–473.<br />
Aroma of vanilla torrone M. Speziale et al. 1593<br />
McLafferty, F. (2000). Wiley Registry of Mass Spectral Data, 7th edn.<br />
New York: John Wiley & Sons.<br />
Meilgaard, M., Civille, G.V. & Carr, B.T. (1999). Sensory Evaluation<br />
Techniques, 3rd edn. Boca Raton, FL: CRC Press.<br />
Narbona, E., García-García, E., Vázquez-Arau´jo, L. & Carbonell-<br />
Barrachina, A.A. (2010). Volatile composition of functional ‘‘a la<br />
piedra’’ turro´n with propolis. International Journal of Food Science<br />
<strong>and</strong> Technology, 45, 569–577.<br />
NIST (National Institute of St<strong>and</strong>ards <strong>and</strong> Technology). (2009).<br />
http: ⁄⁄webbook.nist.gov ⁄ chemistry ⁄ name-ser.html (accessed on<br />
July 2009).<br />
Pino, J.A. & Mesa, J. (2006). Contribution of volatile compounds to<br />
mango (Mangifera indica L.) aroma. Flavour <strong>and</strong> Fragrance Journal,<br />
21, 207–213.<br />
Serra Bonvehi, J. (2005). Investigation of aromatic compounds in<br />
roasted cocoa powder. European Food Research <strong>and</strong> Technology,<br />
221, 19–29.<br />
Speziale, M. (2010). Definizione della Tipicita` Sensoriale e di Struttura<br />
di Produzioni Artigianali Dociarie Mediterranee. Ph.D. dissertation.<br />
Reggio Calabria (Italy): Università degli Studi Mediterranea di<br />
Reggio Calabria.<br />
Vázquez, L., Verdú, A., Miquel, A., Burló, F. & Carbonell-Barrachina,<br />
A.A. (2007). Changes in physico-chemical properties, hydroxymethylfurfural<br />
<strong>and</strong> volatile compounds during concentration of<br />
honey <strong>and</strong> sugars in Alicante <strong>and</strong> Jijona turro´n. European Food<br />
Research <strong>and</strong> Technology, 225, 757–767.<br />
Vázquez-Arau´jo, L., Pe´rez-Castejo´n, V., Verdu´, A. & Carbonell-<br />
Barrachina, A.A. (2005). Reclutamiento, selección, entrenamiento y<br />
validacio´n de un panel de catadores especializado en turro´n y sus<br />
materias primas. Alimentacio´n Equipos Tecnologı´a, 10, 92–98.<br />
Vázquez-Arau´jo, L., Verdu´, A., Murcia, R., Burló, F. & Carbonell-<br />
Barrachina, A.A. (2006). Instrumental texture of a typical Spanish<br />
confectionery product Xixona turro´n as affected by commercial<br />
category <strong>and</strong> manufacturing company. Journal of Texture Studies,<br />
37, 63–79.<br />
Vázquez-Arau´jo, L., Enguix, L., Verdu´, A., García-García, E. &<br />
Carbonell-Barrachina, A.A. (2008a). Investigation of aromatic<br />
compounds in toasted almonds used for the manufacturing of<br />
turro´n. European Food Research <strong>and</strong> Technology, 227, 243–254.<br />
Vázquez-Arau´jo, L., Verdú, A.E. & Carbonell-Barrachina, A.A.<br />
(2008b). Aroma volatiles of ‘‘a la piedra’’ turro´n. Flavour <strong>and</strong><br />
Fragrance Journal, 23, 84–92.<br />
Vázquez-Arau´jo, L., Verdu´, A., Enguix, L. & Carbonell-Barrachina,<br />
A.A. (2008c). Investigation of aromatic compounds in Alicante <strong>and</strong><br />
Jijona turro´n. European Food Research <strong>and</strong> Technology, 227, 1139–<br />
1147.<br />
Vázquez-Arau´jo, L., Verdu´, A., Navarro, P., Martínez-Sánchez, F. &<br />
Carbonell-Barrachina, A.A. (2009). Changes in volatile compounds<br />
<strong>and</strong> sensory quality during toasting of Spanish almonds. International<br />
Journal of Food Science & Technology, 44, 2225–2233.<br />
Ó 2010 The Authors. Journal compilation Ó 2010 Institute of Food Science <strong>and</strong> Technology International Journal of Food Science <strong>and</strong> Technology 2010
1594<br />
Original article<br />
Fatty acid profile <strong>and</strong> proximate composition of Pacific mullet<br />
(Mugil so-iuy) caught in the Black Sea<br />
Sevim Köse, 1 * Serkan Koral, 2 Yes¸im Özog˘ul 3 & Bekir Tufan 1<br />
1 Faculty of Marine Sciences, Karadeniz Technical University, C¸amburnu, Trabzon, Turkey<br />
2 Faculty of Fisheries, Rize University, Rize, Turkey<br />
3 Faculty of Fisheries, C¸ukurova University, Adana, Turkey<br />
(Received 30 January 2010; Accepted in revised form 30 April 2010)<br />
Summary This study demonstrates proximate composition <strong>and</strong> fatty acid profile of Pacific mullet caught in Turkey.<br />
The highest moisture <strong>and</strong> protein contents were observed with muscle tissues as 83.74 <strong>and</strong> 10.52%, while the<br />
highest fat <strong>and</strong> ash contents were attributed to female gonads as 11.80 <strong>and</strong> 0.94%, respectively, with a<br />
significant variation amongst months (P < 0.05). Significant variation (P < 0.05) usually occurred amongst<br />
months within the same sex for total saturated fatty acids ( P SFA), monosaturated fatty acids ( P MUFA),<br />
polyunsaturated fatty acids ( P PUFA), eicosapentaenoic acid (EPA) <strong>and</strong> docosahexaenoic acid (DHA) in<br />
muscle, although overall mean values between sexes were not found significant. Except for EPA, no variation<br />
observed for gonads while significant changes occurred (P < 0.05) with liver samples amongst months.<br />
Overall total values of P SFA, P MUFA, P PUFA, DHA <strong>and</strong> EPA in muscle samples were 29.59, 29.26,<br />
18.06 <strong>and</strong> 4.48%, respectively, while in gonads ranged as 30.26–33.23%, 35.17–37.47%, 11.87–14.88%, 4.38–<br />
5.34% <strong>and</strong> 3.02–5.02%. These FAs were 21.57–33.11%, 32.89–50.96%, 14.78–20.08%, 0.89–9.94% <strong>and</strong><br />
5.85–9.54% for liver, respectively. The results of this study showed that muscle <strong>and</strong> gonads of Pacific mullet<br />
were rich in n-3 PUFA, especially, EPA, DHA, increasing the value of this species for human consumption.<br />
Keywords Docosahexaenoic acid, eicosapentaenoic acid, fatty acids, omega 3, Pacific mullet, polyunsaturated fatty acids, proximate<br />
composition.<br />
Introduction<br />
Pacific mullet (Mugil so-iuy, Basilewski, 1855) is a<br />
euryhaline fish originally found in Amu Darya River<br />
Basin, Far East Asia (Unsal, 1992; Kaya et al., 1998;<br />
Bas¸c¸ınar & Okumus¸, 2005). It was first introduced to the<br />
Sea of Azov for fish farming, then migrated to the Black<br />
Sea, <strong>and</strong> from there to the Sea of Marmara <strong>and</strong> Aegean<br />
Sea (Kaya et al., 1998). In the Black Sea region, 10 kg of<br />
weighing members was reported, <strong>and</strong> its medium size<br />
was known as 20–30 cm (max. 61 cm) (Starushenko &<br />
Kazansky, 1996; Kaya et al., 1998). Although mullet<br />
species are widely caught <strong>and</strong> consumed around the<br />
world, the actual statistical information about Pacific<br />
mullet in Turkey or around the world is not clear yet.<br />
There have been few studies related to this species, most<br />
of which deals with aquaculture <strong>and</strong> revised by Bas¸c¸ınar<br />
& Okumus¸ (2005). They also investigated some bioecological<br />
properties. Omelchenko et al. (2004) studied<br />
the genetic structure of far eastern mullet M. so-iuy <strong>and</strong><br />
*Correspondent: Fax: +90 462 7522805;<br />
e-mail: kosesevim@gmail.com<br />
International Journal of Food Science <strong>and</strong> Technology 2010, 45, 1594–1602<br />
its change under acclimatisation. However, there is<br />
scarce information relating to its nutritional contents,<br />
especially fatty acids.<br />
There has been high evidence that fish lipids are<br />
beneficial for human health. Polyunsaturated fatty acids<br />
(PUFA), especially omega 3 fatty acids (n-3 FAs), have<br />
been recognised to be essential components of humans’<br />
diet, prevent several diseases <strong>and</strong> have a vital role in<br />
health promotion. These acids, particularly eicosapentaenoic,<br />
20:5n3 (EPA) <strong>and</strong> docosahexaenoic, 22:6n3<br />
(DHA), have been reported to prevent <strong>and</strong> treat of<br />
cardiovascular, depressions <strong>and</strong> some other diseases like<br />
cancer, coronary heart diseases, inflammatory <strong>and</strong><br />
autoimmune disorders, inflammation <strong>and</strong> arrhythmias<br />
rheumatoid arthritis (Kinsella, 1987; Lees & Karel,<br />
1990; Simopoulos et al., 1991; Schmidt et al., 2006).<br />
There is a nutritional deficit of n-3 PUFA in the human<br />
diet; therefore, a higher consumption of food containing<br />
these acids is recommended (Simopoulos, 1991; Mnari<br />
et al., 2007). However, lipid content <strong>and</strong> FA profile of<br />
fish are known to vary within species, <strong>and</strong> a number of<br />
factors, such as the temperature, the salinity, the season,<br />
the type <strong>and</strong> the availability of food, the habitat, the<br />
doi:10.1111/j.1365-2621.2010.02309.x<br />
Ó 2010 The Authors. Journal compilation Ó 2010 Institute of Food Science <strong>and</strong> Technology
stage of maturity <strong>and</strong> the individual variability, are<br />
believed to be important factors contributing to these<br />
variations (Tanakol et al., 1999; Halilog˘ lu, 2001; Luzia<br />
et al., 2003; Halilog˘ lu et al., 2004; Mnari et al., 2007;<br />
O¨ zogul & O¨ zogul, 2007).<br />
Compositions of lipids <strong>and</strong> FAs present in many fish<br />
species in the world have been extensively studied<br />
(Tanakol et al., 1999; Osman et al., 2001; Luzia et al.,<br />
2003; Mnari et al., 2007; O¨ zog˘ ul et al., 2007; C¸elik,<br />
2008; Yildiz et al., 2008; Karl et al., 2010). However,<br />
there is scarce information available on this aspect<br />
concerning P. mullet. Therefore, investigation of FA<br />
profile of such species is important.<br />
Pacific mullet, which has appeared in Black Sea from<br />
beginning of 1990, had adapted to Black Sea environment<br />
within 10 years of time <strong>and</strong> reached to a dynamic<br />
stock in this area. Okumus¸ & Bas¸çınar (1997) estimated<br />
its spawning season starting towards the end of May,<br />
followed by an egg release from middle of June until the<br />
middle of July. Such species is known to be settled in the<br />
North Black Sea area <strong>and</strong> has been caught by artisanal<br />
fishermen using trammel gill nets during its spawning<br />
period. This is the only species allowed for fishing during<br />
prohibition fishing period of other fish species (1st May–<br />
1st August) in this region (Go¨ zler et al., 2005). Therefore,<br />
the aim of this study is to investigate the changes of<br />
proximate composition <strong>and</strong> fatty acid profile in the<br />
edible flesh (muscle), gonads <strong>and</strong> liver of P. mullet<br />
during its fishing season.<br />
Materials <strong>and</strong> methods<br />
Pacific mullet (Mugil so-iuy, Basilewski, 1855) samples<br />
were purchased from local markets in Black Sea coast of<br />
Turkey just after freshly caught early in the morning.<br />
Sampling was carried out at three different months as<br />
May, June <strong>and</strong> July in 2006. They were brought to the<br />
laboratory immediately after buying in cold storage<br />
conditions. The samples were directly subjected to the<br />
experiments, if delayed, they were kept in the freezer at<br />
)20 °C.<br />
Biometric analyses<br />
All fish were individually weighed <strong>and</strong> measured.<br />
Weight was measured using an electronic digital balance<br />
(±0.1 g). Total length measurement was carried out<br />
using a measurement scale (±1 mm). For age determinations,<br />
10–15 scales of fish were taken for each<br />
measurement. The age was measured under microscope<br />
using the method described by Chugunova (1959). The<br />
sexes were determined after dissection by simple visual<br />
observation of the gonad’s physical appearance<br />
(Okumus¸ & Bas¸çınar, 1997). Weights of female gonads<br />
were determined (±0.01 g) after blotting blood <strong>and</strong><br />
water according to Okumus¸ & Bas¸c¸ınar (1997).<br />
Fatty acid <strong>and</strong> proximate composition of Pacific mullet S. Köse et al. 1595<br />
Proximate compositions analyses<br />
Moisture content was determined by oven drying of 5 g<br />
of fish muscle <strong>and</strong> gonad at 105 °C until a constant<br />
weight was obtained (AOAC, 1995, Method 985.14).<br />
Ash was determined by the AOAC (1980) Method<br />
7.009. Fat content was determined using a solvent<br />
extractor Velp SER 148 ⁄ 6 (Velp Scientifica, Milano,<br />
Italy) with petroleum ether (130 °C). Protein content<br />
was determined by AOAC (1980) Method 2.507 using<br />
the Kjeldahl nitrogen (6.25) in an automated distillation<br />
unit (Buchi 339, Flawil, Switzerl<strong>and</strong>). All analyses were<br />
conducted in triplicate.<br />
Analysis of fatty acid profiles<br />
Fatty acid profiles for muscle, gonads <strong>and</strong> liver samples<br />
were analysed according to O¨ zog˘ ul et al. (2007). Analysis<br />
of liver samples was performed only for two<br />
different sampling periods (May <strong>and</strong> July) from the<br />
mixture obtained from all samples because the size of<br />
liver for individual fish was very small.<br />
FAME analyses<br />
Methyl esters were prepared by transmethylation using<br />
2 m potassium hydroxide (KOH) (Merck, Darmstadt,<br />
Germany) in methanol <strong>and</strong> n-hexane (Sigma-Aldrich,<br />
Steinhein, Germany) according to the method described<br />
by Ichihara et al. (1996) with minor modification; 10 mg<br />
of extracted oil was dissolved in 2 mL hexane, followed<br />
by 4 mL of 2 m methanolic KOH. The tube was then<br />
vortexed for 2 min at room temperature. After centrifugation<br />
at 1780 · g for 10 min, the hexane layer was<br />
taken for GC analyses.<br />
Gas chromatographic conditions<br />
The fatty acid composition was analysed by a GC<br />
Clarous 500 with auto sampler (Perkin–Elmer, Shelton,<br />
CT, USA) equipped with a flame ionisation detector <strong>and</strong><br />
a fused silica capillary SGE column (30 m 0.32 mm ID<br />
0.25lm BP20 0.25UM, USA). The oven temperature was<br />
140 °C, held 5 min, rose to 200 °C at the rate 4 °C per<br />
minutes <strong>and</strong> held at 220 °C at1°C per minutes, while<br />
the injector <strong>and</strong> the detector temperatures were set at<br />
220 <strong>and</strong> 280 °C, respectively. The sample size was 1 lL,<br />
<strong>and</strong> the carrier gas was controlled at 16 ps. The split<br />
used was 1:100. Fatty acids were identified by comparing<br />
the retention times of FAME with the st<strong>and</strong>ard 37<br />
component FAME mixture (Supelco 37 Component<br />
FAME Mix. Pro Num. 47885-U). Two replicate GC<br />
analyses were performed, <strong>and</strong> the results were expressed<br />
in GC area % as mean values ± st<strong>and</strong>ard deviation<br />
(SD). Three samplings were carried out for FA profile of<br />
each individual fish for muscle as well as gonads.<br />
Ó 2010 The Authors. Journal compilation Ó 2010 Institute of Food Science <strong>and</strong> Technology International Journal of Food Science <strong>and</strong> Technology 2010
1596<br />
Fatty acid <strong>and</strong> proximate composition of Pacific mullet S. Köse et al.<br />
Statistical analysis<br />
Analysis of variance (anova) was used to compare<br />
means of the proximate composition <strong>and</strong> fatty acid data,<br />
<strong>and</strong> when significant differences were found, comparisons<br />
among means were carried out by using Tukey test.<br />
A significance level of 95% (P < 0.05) was used<br />
throughout analysis. All statistical analyses were performed<br />
in jmp 5.0.1 package version (SAS Institute, Inc.,<br />
Cary, NC, USA) (Sokal & Rohlf, 1987). The results<br />
were presented as means ± SD.<br />
Results <strong>and</strong> discussion<br />
Table 1 demonstrates proximate composition (% wet<br />
basis) values of the samples representing muscle tissue<br />
for both sex group <strong>and</strong> female gonads of Pacific mullet<br />
sampled at three different months (fishing season).<br />
Overall mean value for moisture of muscle samples<br />
increased from May to June significantly from 76.14%<br />
to 83.73%, while a significant decrease occurred from<br />
May to July in the values of protein, fat <strong>and</strong> ash<br />
contents, from 10.52% to 6.76%, 2.56% to 1.26% <strong>and</strong><br />
0.81% to 0.58%, respectively. Although some significant<br />
variations (P < 0.05) were observed within the individual<br />
sex groups representing the same lot (Table S1), the<br />
variation was not found significant between sexes within<br />
the same months (Table 1). However, significant differences<br />
occurred (P < 0.05) mainly for moisture <strong>and</strong><br />
protein contents amongst some months for both sexes.<br />
Little information exists regarding proximate composition<br />
of P. mullet in literature. Erdem et al. (2006)<br />
investigated different parts of P. mullet for proximate<br />
Analysis<br />
type<br />
Sampling<br />
time Mean females Mean males<br />
Moisture May 76.88 ± 1.68a A<br />
June 79.44 ± 1.44a B<br />
July<br />
C<br />
83.74 ± 1.20a Protein May<br />
A<br />
10.52 ± 0.68a June 8.37 ± 0.38a B<br />
July 7.03 ± 0.07a C<br />
Fat May<br />
A<br />
2.59 ± 0.35a June 2.73 ± 0.21a A<br />
July 1.34 ± 0.08a B<br />
Ash May<br />
A<br />
0.78 ± 0.05a June<br />
A<br />
0.70 ± 004a July 0.55 ± 0.03a B<br />
75.41 ± 2.58a A<br />
77.80 ± 1.84a A<br />
B<br />
83.72 ± 2.75a A<br />
10.52 ± 1.22a 8.96 ± 0.59a B<br />
6.49 ± 0.01a C<br />
A<br />
2.54 ± 0.22a 2.83 ± 0.17a A<br />
1.18 ± 0.22a B<br />
A<br />
0.83 ± 0.08a A<br />
0.76 ± 0.06a 0.62 ± 0.08a B<br />
Females & males<br />
total mean<br />
76.14 ± 2.21 A<br />
78.62 ± 1.79 B<br />
83.73 ± 2.24 C<br />
10.52 ± 0.88 A<br />
8.66 ± 0.55 B<br />
6.76 ± 0.26 C<br />
2.56 ± 0.28 A<br />
2.78 ± 0.19 A<br />
1.26 ± 0.17 B<br />
0.81 ± 0.07 A<br />
0.72 ± 0.05 A<br />
0.58 ± 0.08 B<br />
composition. They observed slightly higher fat <strong>and</strong><br />
protein contents. Their ash <strong>and</strong> moisture contents<br />
supported our findings. The differences in protein <strong>and</strong><br />
fat contents may be attributed to regional fish diet. Vlieg<br />
(1988) reported lower moisture content for grey mullet<br />
from New Zeal<strong>and</strong> while protein, fat <strong>and</strong> ash contents<br />
were close or lower than our results with a variation<br />
amongst months. Muscle fat values of May <strong>and</strong> June<br />
samples were close to fat content observed for Mugil<br />
cephalus by O¨ zogul & O¨ zogul (2007).<br />
Moisture contents of gonad samples ranged from<br />
76.02% to 80.25%, with significant differences between<br />
July <strong>and</strong> other months (Table 1). Protein, fat <strong>and</strong> ash<br />
contents significantly dropped from May to July, 9.23%<br />
to 7.77%, 11.80% to 9.72% <strong>and</strong> 0.94% to 0.78%,<br />
respectively. Significant variation usually occurred<br />
(P < 0.05) within the individual gonads for protein,<br />
fat <strong>and</strong> ash contents (Table S2). The proximate composition<br />
relating to gonads or caviar of mullet is mainly<br />
carried out for grey mullet. Therefore, our results<br />
represent new data to the literature in this respect.<br />
Varying contents of moisture, protein, fat <strong>and</strong> ash were<br />
reported by different authors for gonads or caviar of<br />
grey mullet. Karakas¸ (2008) obtained moisture, protein,<br />
fat <strong>and</strong> ash contents as 61.8%, 23.9%, 9.9% <strong>and</strong> 5.1%<br />
for grey mullet, respectively. Duyar et al. (2008)<br />
observed higher moisture <strong>and</strong> fat contents, <strong>and</strong> lower<br />
protein <strong>and</strong> ash values for the same species. The values<br />
of S¸engo¨ r et al. (2002) for the caviar of M. cephalus were<br />
much lower than those obtained by Karakas¸ (2008) <strong>and</strong><br />
Duyar et al. (2008) while higher protein content was<br />
found. Varying chemical composition was also reported<br />
at different types of fresh <strong>and</strong> processed fish caviar<br />
Female gonads<br />
total mean<br />
77.19 ± 0.55 A<br />
76.02 ± 1.33 A<br />
80.25 ± 0.30 B<br />
9.23 ± 0.36 A<br />
8.43 ± 0.43 A<br />
7.77 ± 0.25 B<br />
11.80 ± 0.61 A<br />
10.50 ± 0.50 B<br />
9.72 ± 0.09 B<br />
0.94 ± 0.06 A<br />
0.85 ± 0.02 B<br />
0.78 ± 0.03 C<br />
n: 3 (mean ± SD).<br />
Different small subscript letters (a, b) at the same row represent significant differences (P < 0.05)<br />
for mean values of males <strong>and</strong> females within the same lot (same month).<br />
Different superscript capital letters (A,B,C) at the same column represent significant differences<br />
(P < 0.05) amongst the months for the same type of chemical composition relating to mean values<br />
within the same sex groups or total mean values.<br />
Table 1 Mean proximate composition (% wet<br />
basis) values of the samples representing<br />
muscle tissue <strong>and</strong> female gonads of Pacific<br />
mullet sampled at three different months<br />
International Journal of Food Science <strong>and</strong> Technology 2010 Ó 2010 The Authors. Journal compilation Ó 2010 Institute of Food Science <strong>and</strong> Technology
Table 2 Mean values of fatty acid profile for muscle tissues of Pacific mullet representing three different months for both male <strong>and</strong> female groups<br />
Mean Values for each sex group for each month Overall mean values<br />
May June July For sexes All Samples<br />
Fatty acid type Females Males Females Males Females Males Males Females F&M<br />
C14:0 3.08 ± 1.96 aA<br />
C15:0 0.92 ± 0.44 aA<br />
C16:0 13.38 ± 3.96 aA<br />
C17:0 0.74 ± 0.25 aA<br />
C18:0 4.27 ± 1.13 aA<br />
C20:0 0.43 ± 0.46 aA<br />
C23:0 0.15 ± 0.09 aA<br />
C24:0 3.18 ± 0.44 aA<br />
P<br />
SFA<br />
aA<br />
25.78 ± 4.50<br />
C14:1 0.06 ± 0.00 aA<br />
C15:1 0.15 ± 0.01 aA<br />
C16:1 14.03 ± 2.62 aA<br />
C17:1 0.82 ± 0.35 aA<br />
C18:1 7.83 ± 2.25 aA<br />
C20:1 2.38 ± 0.76 aA<br />
C22:1 n9 0.09 ± 0.00 a<br />
P<br />
MUFA<br />
aA<br />
24.37 ± 2.23<br />
C18:2cis 0.98 ± 0.78 aA<br />
C18:3 n3 0.36 ± 0.13 aA<br />
C18:3 n6 0.68 ± 0.35 aA<br />
C18:4 n3 0.22 ± 0.00 aA<br />
C20:2 cis 1.47 ± 0.50 aA<br />
C20:3 n6 0.94 ± 0.00 a<br />
C20:4 n6 4.08 ± 1.61 aA<br />
C20:5 n3 4.63 ± 0.20 aA<br />
C22:2 cis 0.29 ± 0.00 aA<br />
C22:6 n3 12.34 ± 1.11 aA<br />
P<br />
PUFA<br />
aA<br />
23.70 ± 2.71<br />
4.36 ± 0.43 a A 5.67 ± 1.96 aB<br />
4.44 ± 0.34 a A 3.99 ± 0.71 aA<br />
2.82 ± 1.76 a B 4.25 ± 1.31 a<br />
3.87 ± 0.91 a<br />
4.06 ± 0.26<br />
1.05 ± 0.36 a A 0.44 ± 0.14 aB<br />
2.45 ± 0.46 b B 0.96 ± 0.33 aA<br />
1.46 ± 0.99 a A 0.77 ± 0.29 a<br />
1.65 ± 0.72 b<br />
1.21 ± 0.62<br />
12.63 ± 0.85 a A 17.58 ± 3.11 aB 20.10 ± 0.90 a B 23.84 ± 1.66 aC 21.09 ± 0.36 a B 18.27 ± 5.26 a 17.94 ± 4.63 a 18.10 ± 0.23<br />
0.61 ± 0.29 a A 0.91 ± 0.60 aA<br />
1.19 ± 0.56 a B 0.45 ± 0.08 aB<br />
1.13 ± 0.97 a B 0.70 ± 0.23 a<br />
0.98 ± 0.32 a<br />
0.84 ± 0.20<br />
4.51 ± 0.28 a A 2.66 ± 0.34 aB<br />
1.90 ± 1.04 a B 1.60 ± 1.96 aC<br />
1.89 ± 2.60 a B 2.84 ± 1.34 a<br />
2.77 ± 1.51 a<br />
2.81 ± 0.05<br />
0.12 ± 0.07 a A ND ND 0.11 ± 0.03 aB<br />
1.95 ± 0.05 b B 0.27 ± 0.23 a<br />
1.04 ± 1.29 a<br />
0.65 ± 0.54<br />
0.54 ± 0.43 a A 0.22 ± 0.03 aA<br />
0.08 ± 0.00 b B ND 0.14 ± 0.01 a B 0.19 ± 0.05 a<br />
0.31 ± 0.33 a<br />
0.25 ± 0.09<br />
4.34 ± 1.40 a A 2.70 ± 1.19 aB<br />
1.44 ± 0.63 b B 1.43 ± 0.06 aC<br />
2.03 ± 0.16 b C 2.44 ± 0.90 a<br />
2.60 ± 1.53 a<br />
2.52 ± 0.12<br />
28.08 ± 2.66 a A 30.26 ± 4.34 aB 31.58 ± 0.67 a B 32.31 ± 1.63 aB 30.86 ± 1.46 a B 29.10 ± 4.61 a 30.09 ± 2.37 a 29.59 ± 0.70<br />
0.06 ± 0.00 a A 0.17 ± 0.06 aB<br />
0.10 ± 0.01 a B 0.06 ± 0.02 aA<br />
0.06 ± 0.02 a A 0.10 ± 0.06 a<br />
0.07 ± 0.02 a<br />
0.09 ± 0.02<br />
0.21 ± 0.14 a A 0.05 ± 0.01 aB<br />
0.31 ± 0.06 b B 0.06 ± 0.02 aB<br />
0.24 ± 0.06 b A 0.09 ± 0.06 a<br />
0.25 ± 0.05 b<br />
0.17 ± 0.12<br />
13.54 ± 1.43 a A 20.92 ± 1.22 aC 28.58 ± 4.03 b B 18.57 ± 3.71 aB 20.24 ± 3.30 a C 17.84 ± 3.50 a 20.79 ± 7.53 a 19.31 ± 2.08<br />
0.82 ± 0.52 a A 0.98 ± 0.73 aA<br />
2.09 ± 0.44 b B 0.09 ± 0.02 aB<br />
0.89 ± 0.81 a A 0.63 ± 0.47 a<br />
1.27 ± 0.71 b<br />
0.95 ± 0.45<br />
5.36 ± 0.54 b A 6.04 ± 1.94 aA<br />
7.31 ± 0.12 a B 10.29 ± 1.90 aB<br />
8.76 ± 2.38 a B 8.05 ± 2.13 a<br />
7.14 ± 1.71 a<br />
7.60 ± 0.64<br />
2.69 ± 0.54 a A 1.37 ± 0.86 aB<br />
0.24 ± 0.17 b B 0.44 ± 0.29 aC<br />
1.68 ± 1.90 a C 1.40 ± 0.97 a<br />
1.54 ± 1.23 a<br />
1.47 ± 0.10<br />
0.08 ± 0.01 a A ND 0.05 ± 0.01A ND 0.08 ± 0.00A 0.09 ± 0.00 a<br />
0.08 ± 0.01 a<br />
0.09 ± 0.01<br />
22.60 ± 1.62 a A 29.48 ± 1.44 aB 38.67 ± 3.87 b B 29.47 ± 1.36 aB 31.95 ± 0.23 b C 27.56 ± 3.04 a 30.97 ± 7.61 a 29.26 ± 1.41<br />
1.96 ± 1.18 a A 1.15 ± 0.11 aA<br />
1.10 ± 0.37 a B 2.77 ± 1.80 aB<br />
0.58 ± 0.42 b C 1.63 ± 0.99 a<br />
0.21 ± 0.02 a A 0.25 ± 0.12 aB<br />
0.48 ± 0.25 b B 0.12 ± 0.04 aC<br />
0.73 ± 0.54 b C 0.35 ± 0.29 a<br />
0.44 ± 0.11 a A 0.36 ± 0.04 aB<br />
0.64 ± 0.15 b B 0.54 ± 0.08 aC<br />
0.51 ± 0.16 a B 0.42 ± 0.10 a<br />
0.22 ± 0.03 a A 0.18 ± 0.09 aA<br />
0.11 ± 0.03 a B 0.07 ± 0.05 aB<br />
0.13 ± 0.04 a B 0.16 ± 0.08 a<br />
1.11 ± 0.57 a A 0.45 ± 0.34 aB<br />
0.13 ± 0.08 b B 0.28 ± 0.16 aC<br />
0.11 ± 0.01 b B 0.73 ± 0.64 a<br />
0.57 ± 0.16 b A ND ND ND 0.15 ± 0.00B 0.94 ± 0.00 a<br />
2.60 ± 0.45 b A 1.59 ± 0.03 aB<br />
1.88 ± 0.50 a B 1.87 ± 0.91 aB<br />
1.44 ± 0.04 a B 2.51 ± 1.36 a<br />
3.52 ± 0.19 b A 6.03 ± 3.16 aB<br />
7.11 ± 1.15 a B 1.58 ± 0.66 aC<br />
4.02 ± 0.47 b C 4.08 ± 2.28 a<br />
1.18 ± 0.15 a<br />
0.90 ± 0.02 B<br />
ND ND ND 0.29 ± 0.00 a<br />
9.42 ± 1.18 b A 9.20 ± 1.13 aB<br />
3.83 ± 4.00 b B 5.90 ± 0.91 aC<br />
5.37 ± 0.51 a C 9.15±3.22 a<br />
(S¸engo¨ r et al., 2002; Shirai et al., 2006; Mol & Turan,<br />
2008). Our moisture <strong>and</strong> ash contents supported the<br />
values obtained by Duyar et al. (2008), <strong>and</strong> protein<br />
content was similar to values of S¸engo¨ r et al. (2002) <strong>and</strong><br />
Karakas¸ (2008).<br />
Fatty acid <strong>and</strong> proximate composition of Pacific mullet S. Köse et al. 1597<br />
1.21 ± 0.70 a<br />
0.55 ± 0.16 a<br />
0.45 ± 0.22 a<br />
0.15 ± 0.06 a<br />
0.45 ± 0.57 a<br />
0.57 ± 0.16 b<br />
1.97 ± 0.59 a<br />
4.88 ± 1.94 a<br />
1.18 ± 0.15 b<br />
6.21 ± 2.89 a<br />
1.42 ± 0.30<br />
0.45 ± 0.14<br />
0.44 ± 0.02<br />
0.16 ± 0.00<br />
0.59 ± 0.20<br />
0.76 ± 0.26<br />
2.24 ± 0.38<br />
4.48 ± 0.57<br />
0.74 ± 0.63<br />
7.68 ± 2.08<br />
20.23±2.86 a A 19.75 ± 1.73 aB 15.30 ± 2.69 b B 13.08 ± 3.52 aC 12.95 ± 0.52 a C 19.57 ± 4.90 a 16.56 ± 3.84 a 18.06 ± 1.28<br />
PUFA\SFA 0.91 ± 0.04 aA<br />
0.72 ± 0.11 b A 0.66 ± 0.01 aB<br />
0.48 ± 0.01 b B 0.40 ± 0.02 aC<br />
0.42 ± 0.01 a B 0.67 ± 0.08 a<br />
0.55 ± 0.06 b<br />
P<br />
n6<br />
aA<br />
4.64 ± 1.67 3.14 ± 0.95<br />
0.61 ± 0.05<br />
a A 1.84 ± 0.05 aB<br />
2.37 ± 0.05 b B 1.89 ± 0.75 aB<br />
2.24 ± 0.54 a B 2.95 ± 1.73 a<br />
2.63 ± 0.74 a<br />
P<br />
n3<br />
aA<br />
17.27 ± 1.14 13.24 ± 1.15<br />
2.79 ± 1.22<br />
b A 15.71 ± 0.28 aA 11.71 ± 0.27 b B 8.04 ± 0.56 aB 10.02 ± 0.68 b B 14.38 ± 4.14 a 11.86 ± 2.11 b 13.12 ± 1.78<br />
n6\n3 0.27 ± 0.11b aA<br />
0.24 ± 0.08 b A 0.12 ± 0.00 aB<br />
0.21 ± 0.00 b A 0.24 ± 0.04 aA<br />
0.23 ± 0.00 a A 0.20 ± 0.02 a<br />
0.22 ± 0.04 a<br />
0.21 ± 0.04<br />
n3 ⁄ n6 4.23 ± 2.06 aA<br />
4.51 ± 1.32 a A 8.54 ± 0.09 aB<br />
4.91 ± 0.01 b A 4.36 ± 0.53 aA<br />
4.73 ± 0.02 a A 4.87 ± 0.03 a<br />
4.50 ± 0.05 a<br />
4.70 ± 0.07<br />
DHA\EPA 2.68 ± 0.24 aA<br />
2.68 ± 0.34 a A 1.89 ± 0.01 aB<br />
0.62 ± 0.01 b B 3.98 ± 0.51 aC<br />
1.34 ± 0.02 b C 2.24 ± 0.03 a<br />
1.27 ± 0.02 b<br />
1.71±0.01<br />
Unidentified 26.15 ± 1.45 29.09 ± 2.02 20.51 ± 2.21 14.45 ± 1.78 25.14 ± 1.72 24.24 ± 1.22 23.77 ± 1.36 22.38±1.45 23.12 ± 1.12<br />
n:3 (mean ± SD.)<br />
Superscript ‘a, b’ in the same line followed by different letter is significantly different (P < 0.05) between mean values between sexes within the same<br />
month.<br />
Superscript ‘A, B, C’ in the same line followed by the different letter represents significant differences (P < 0.05) amongst months for female samples.<br />
Subscript ‘A, B, C’ in the same line followed by the different letter represents significant differences (P < 0.05) amongst months for male samples.<br />
ND, Not detected; DHA, docosahexaenoic acid; EPA, eicosapentaenoic acid; SFA, saturated fatty acids; MUFA, monosaturated fatty acids; PUFA,<br />
polyunsaturated fatty acids.<br />
Table 2 represents the fatty acid profile (% of total<br />
FAs) of P. mullet for muscle tissues representing three<br />
different months for both sex groups. The most abundant<br />
FA in muscle was palmitic acid (C16:0) with the<br />
mean values ranging from 13.38% to 23.84% for<br />
Ó 2010 The Authors. Journal compilation Ó 2010 Institute of Food Science <strong>and</strong> Technology International Journal of Food Science <strong>and</strong> Technology 2010
1598<br />
Fatty acid <strong>and</strong> proximate composition of Pacific mullet S. Köse et al.<br />
Table 3. Mean values representing fatty acid profile of female gonads <strong>and</strong> livers for different months<br />
Fatty Acid Type<br />
C14:0 1.05 ± 0.56 a<br />
C15:0 0.04 ± 0.01 a<br />
C16:0 3.53 ± 1.44 a<br />
C17:0 0.99±0.29 a<br />
C18:0 20.94 ± 0.27 a<br />
C20:0 3.24 ± 0.82 a<br />
C23:0 0.16 ± 0.07 a<br />
C24:0 1.74 ± 0.61 a<br />
P<br />
SFA<br />
a<br />
30.26 ± 1.80<br />
C14:1 0.04 ± 0.02 a<br />
C15:1 0.03 ± 0.01 a<br />
C16:1 20.41 ± 2.90 a<br />
C17:1 0.28 ± 0.26 a<br />
C18:1 10.20 ± 1.82 a<br />
C20:1 6.38 ± 1.45 a<br />
C22:1 n9 0.14 ± 0.04 a<br />
P<br />
MUFA<br />
a<br />
37.47 ± 3.49<br />
C18:2cis 1.85 ± 0.22 b<br />
C18:3 n3 0.54 ± 0.07 a<br />
C18:3 n6 1.00 ± 0.26 a<br />
C18:4 n3 0.18 ± 0.04 a<br />
C20:2 cis 0.07 ± 0.06 a<br />
C20:3 n6 0.23 ± 0.07 a<br />
C20:4 n6 0.76 ± 0.40 a<br />
C20:5 n3 5.02 ± 1.92 b<br />
C22:2 cis 0.09 ± 0.00 a<br />
C22:6 n3 5.34 ± 1.65 a<br />
P<br />
PUFA<br />
a<br />
14.88 ± 2.69<br />
PUFA\SFA 0.49 ± 0.08 a<br />
P a<br />
n6 1.83 ± 0.78<br />
P a<br />
n3 11.09 ± 1.84<br />
n6\n3 0.16 ± 0.07 a<br />
n3 ⁄ n6 6.06 ± 0.12 a<br />
DHA\EPA 1.06 ± 0.06 a<br />
Unidentified 15.74 ± 0.73 a<br />
Mean values of gonads Mean values of livers<br />
May June July Mixed May Mixed June<br />
0.86 ± 0.09 a<br />
0.14 ± 0.08 b<br />
2.84 ± 0.31 a<br />
2.18 ± 0.57 b<br />
23.26 ± 0.33 a<br />
3.12 ± 0.21 a<br />
0.15 ± 0.01 a<br />
1.52 ± 0.48 a<br />
33.23 ± 0.87 a<br />
0.06 ± 0.02 a<br />
0.17 ± 0.09 b<br />
18.27 ± 1.07 a<br />
0.32 ± 0.22 a<br />
10.30 ± 1.13 a<br />
5.86 ± 1.52 a<br />
0.18 ± 0.06 a<br />
35.17 ± 3.07 a<br />
1.97 ± 0.21 b<br />
0.57 ± 0.04 a<br />
1.17 ± 0.15 a<br />
0.17 ± 0.04 a<br />
0.05 ± 0.05 a<br />
0.23 ± 0.08 a<br />
0.91 ± 0.27 a<br />
3.02 ± 0.63 a<br />
0.05 ± 0.01 a<br />
4.74 ± 0.79 a<br />
12.86 ± 1.19 a<br />
0.38 ± 0.06 b<br />
2.32 ± 0.21 a<br />
8.48 ± 0.78 b<br />
0.27 ± 0.01 b<br />
3.65 ± 0.08 b<br />
1.56 ± 0.08 b<br />
17.85 ± 1.43 a<br />
females <strong>and</strong> 12.63% to 21.09% for males amongst<br />
months. The major FA in female gonads was stearic<br />
acid (C18:0) ranging between 20.72% <strong>and</strong> 23.26%<br />
(Table 3). For liver samples, only two different months<br />
were analysed. While 16:0 was found as the main FA in<br />
May as 22.21%, palmitoleic (16:1) was the most<br />
abundant FA in June as 33.23% (Table 3). C16:0 was<br />
also primary saturated fatty acids (SFA) for both muscle<br />
0.93 ± 0.06 a<br />
0.17 ± 0.00 b<br />
1.90±0.32 a<br />
2.05 ± 0.16 b<br />
20.72 ± 0.04 a<br />
3.45 ± 0.11 a<br />
0.11 ± 0.01 a<br />
1.42 ± 0.09 a<br />
30.56 ± 0.70 a<br />
0.04 ± 0.00 a<br />
0.18 ± 0.01 b<br />
18.54 ± 0.09 a<br />
0.38 ± 0.01 a<br />
11.50 ± 0.15 a<br />
5.68 ± 2.04 a<br />
0.40±0.16 b<br />
36.71 ± 3.02 a<br />
3.47 ± 0.07 a<br />
2.64 ± 0.01 b<br />
0.50 ± 0.03 a<br />
1.56 ± 0.01 b<br />
22.21 ± 0.43 a<br />
14.54 ± 0.04 b<br />
0.22 ± 0.01 a<br />
0.88 ± 0.01 b<br />
5.55 ± 0.07 a<br />
1.06 ± 0.04 b<br />
ND ND<br />
ND ND<br />
1.17 ± 0.06 a<br />
0.91 ± 0.01 a<br />
33.11 ± 0.36 a<br />
21.57 ± 0.01 b<br />
0.07 ± 0.01 a<br />
0.06 ± 0.01 a<br />
ND 0.25 ± 0.01<br />
14.80 ± 0.57 a<br />
33.23 ± 0.04 b<br />
0.31 ± 0.00 a<br />
1.11 ± 0.01 b<br />
16.71 ± 0.11 a<br />
16.20 ± 0.00 b<br />
0.21 ± 0.00 a<br />
0.11 ± 0.02 b<br />
ND ND<br />
32.89 ± 0.67 a<br />
50.96 ± 0.07 b<br />
0.56 ± 0.01 a<br />
0.88 ± 0.01 a<br />
1.41 ± 0.01 b<br />
0.66 ± 0.01 a<br />
0.56 ± 0.01 a<br />
0.86 ± 0.08 b<br />
1.64 ± 0.02 a<br />
0.23 ± 0.00 a<br />
0.36 ± 0.01 b<br />
0.13 ± 0.00 a<br />
ND 0.08 ± 0.00<br />
0.04 ± 0.01 a<br />
ND 0.22 ± 0.03<br />
0.15 ± 0.01 a<br />
ND ND<br />
1.29 ± 0.25 a<br />
2.63 ± 0.11 a<br />
1.44 ± 0.02 b<br />
3.35 ± 0.16 a<br />
5.85 ± 0.01 a<br />
9.54 ± 0.06 b<br />
ND ND ND<br />
4.38 ± 0.28 a<br />
9.94 ± 0.04 a<br />
0.89 ± 0.03 b<br />
11.87 ± 0.99 a<br />
0.38 ± 0.02 b<br />
2.76 ± 0.60 a<br />
8.52 ± 0.42 b<br />
0.32 ± 0.01 c<br />
3.08 ± 0.06 b<br />
1.30 ± 0.14 a<br />
21.36 ± 2.83 b<br />
20.08 ± 0.15 a<br />
0.625 ± 0.01 b<br />
2.86 ± 0.11 a<br />
16.35 ± 0.06 b<br />
0.17 ± 0.01 a<br />
5.71 ± 0.01 b<br />
0.59 ± 0.001 a<br />
14.72 ± 0.46 a<br />
14.78 ± 0.18 b<br />
0.685 ± 0.01 b<br />
1.70 ± 0.01 b<br />
11.37 ± 0.16 a<br />
0.15 ± 0.003 b<br />
6.68 ± 0.14 a<br />
0.09 ± 0.002 b<br />
12.70 ± 0.27 b<br />
The weight of liver samples for individuals in May: Females: 53, 20 <strong>and</strong> 55 g. Males: 27, 35 <strong>and</strong> 32 g, for 1st, 2nd <strong>and</strong> 3rd samples, respectively.<br />
In June for Females: 32, 41 <strong>and</strong> 34 g. Males: 30, 25 <strong>and</strong> 23 g, respectively.<br />
n:3 (mean ± SD); ND, Not Detected. The a,b,c letters in front of data mean that letters in the same line followed by different letter are significantly<br />
different (P < 0.05) amongst months.<br />
DHA, docosahexaenoic acid; EPA, eicosapentaenoic acid; SFA, saturated fatty acids; MUFA, monosaturated fatty acids; PUFA, polyunsaturated fatty<br />
acids.<br />
<strong>and</strong> liver samples, while C18:0 represented gonad<br />
samples. Various authors also reported that C16:0 was<br />
prevalent amongst the SFA in marine species (Luzia<br />
et al., 2003; S¸engo¨ r et al., 2003; O¨ zyurt et al., 2005;<br />
O¨ zogul & O¨ zogul, 2007; O¨ zogul et al., 2007). Other<br />
researchers demonstrated that 16:0 as the major FAs in<br />
liver samples (Jankowska et al., 2009). No data exists<br />
for FA profile relating to M. so-iuy in the literature,<br />
International Journal of Food Science <strong>and</strong> Technology 2010 Ó 2010 The Authors. Journal compilation Ó 2010 Institute of Food Science <strong>and</strong> Technology
% of fatty acids<br />
45<br />
40<br />
35<br />
30<br />
25<br />
20<br />
15<br />
10<br />
5<br />
0<br />
Variation in fatty acid groups amongst 3 months<br />
May<br />
June<br />
July<br />
∑ SFA ∑MUFA ∑PUFA<br />
∑ n6 ∑ n3<br />
Type of fatty acids group<br />
Figure 1 The changes of P SFA, P MUFA, P PUFA, P n6 <strong>and</strong> P n3<br />
amongst the months for the muscle samples of Pacific mullet. SFA,<br />
saturated fatty acids; MUFA, monosaturated fatty acids; PUFA,<br />
polyunsaturated fatty acids.<br />
therefore, our results contribute new data relating to this<br />
species on this respect.<br />
Statistical differences in FA values for muscle samples<br />
were usually observed between different individuals<br />
(P < 0.05) despite their sizes <strong>and</strong> weight (Tables S3–<br />
S5). Statistical differences of individual gonad FAs<br />
occurred (P < 0.05) mainly for SFA (Table S6).<br />
Table 2 <strong>and</strong> Fig. 1 also demonstrate the significance<br />
of variation for the major total FA groups as well as<br />
P n6 <strong>and</strong> P n3 of muscle samples amongst the months.<br />
Total mean value of P SFA for muscle samples was<br />
29.59%, ranged between 25.78% <strong>and</strong> 32.31% for<br />
females <strong>and</strong> between 28.08% <strong>and</strong> 31.58% for males<br />
within the months (Table 2). Although no significant<br />
changes occurred between sexes within the months, the<br />
variation was found significant (P < 0.05) between<br />
May <strong>and</strong> other two months within the same sex of both<br />
males <strong>and</strong> females (Table 2, Fig. 1). Overall, mean<br />
values of different sex groups also confirmed our results<br />
with no significant variation between males <strong>and</strong> females<br />
in terms of P SFA (Table 2). Palmitoleic acid was<br />
observed as the main monosaturated fatty acids<br />
(MUFA) in muscle samples. Mean values of P MUFA<br />
significantly ranged (P < 0.05) from 24.37% to 29.48%<br />
for females <strong>and</strong> from 22.60% to 38.67% for males.<br />
Despite the significant changes (P < 0.05) also occurred<br />
between the sex groups within the same month, the<br />
changes were accounted as insignificant in the overall<br />
total mean values (Table 2). The mean values of<br />
P PUFA for each sex group significantly (P < 0.05)<br />
dropped from 23.70% to 13.08% for females <strong>and</strong> from<br />
20.23% to 12.95% for males from May to July.<br />
Significant variation between sex groups only occurred<br />
in June samples (P < 0.05). Moreover, overall mean<br />
values of both female <strong>and</strong> male samples showed no<br />
significant differences. Luzia et al. (2003) observed no<br />
seasonal changes for total saturated <strong>and</strong> unsaturated<br />
Fatty acid <strong>and</strong> proximate composition of Pacific mullet S. Köse et al. 1599<br />
acid contents of fish samples such as sardine, croaker <strong>and</strong><br />
tilapia despite the changes in EPA <strong>and</strong> DHA levels.<br />
Yanes-Roca et al. (2009) reported a seasonal variation in<br />
total SFA, PUFA <strong>and</strong> DHA levels <strong>and</strong> indicated that<br />
PUFA are functionally essential for normal growth,<br />
development <strong>and</strong> reproduction in fish. O¨ zyurt et al.<br />
(2005) observed a decrease in the level of P SFA in winter<br />
of gilthead sea bream, which was thought to be because of<br />
the catabolisation of saturated fatty acids to compensate<br />
for the extra metabolic energy required in that period. Our<br />
results showed that P SFA (males + females) increased<br />
from May (26.93%) to July (31. 59%) which might<br />
either caused because of significant variation within the<br />
individuals for specific FAs (Tables S3–S5) or other<br />
characteristics that might be use of SFA in such fish<br />
species.<br />
P MUFA has also increased from May to June. On<br />
the other h<strong>and</strong>, P PUFA was decreased sharply from<br />
May (21.97%) to July (13.02%) that represent the<br />
beginning <strong>and</strong> the end of reproduction period, respectively.<br />
Therefore, PUFA may be used more on reproduction<br />
purposes for this species that supports the<br />
reports of Yanes-Roca et al. (2009) in terms of PUFA<br />
functionality in the fish.<br />
Table 3 represents the FA profile of both gonad <strong>and</strong><br />
liver samples. The primary SFA for gonads was found<br />
as 18:0 in this species while Halilog˘ lu et al. (2004)<br />
observed as 16:0 in trout gonads aquacultured at<br />
seawater, <strong>and</strong> the values were similar to their feed used<br />
for aquaculturing. Mean values of P SFA, P MUFA<br />
<strong>and</strong> P PUFA ranged from 30.26% to 33.23%, 35.17%<br />
to 37.47% <strong>and</strong> 11.87% to 14.88%, respectively. Despite<br />
significant differences (P < 0.05) on certain FAs for<br />
individual gonads (Table S6), the variation was not<br />
found significant for any total mean values of those<br />
types of major FA groups. Variation in such parameters<br />
was reported by different researchers for either processed<br />
(as caviars) or fresh gonads (S¸engo¨ r et al., 2003;<br />
Shirai et al., 2006; Mol & Turan, 2008; Yanes-Roca<br />
et al., 2009). S¸engo¨ r et al. (2003) observed 11.9%<br />
P SFA, 42.9% P MUFA <strong>and</strong> 39.3% P PUFA for grey<br />
mullet caviar. Our results were higher for SFA <strong>and</strong><br />
lower for MUFA <strong>and</strong> PUFA than those obtained for<br />
grey mullet. For liver samples, high variation occurred<br />
(P < 0.05) between May <strong>and</strong> June samples for all main<br />
FA groups. The mean values for P SFA <strong>and</strong> P PUFA<br />
have significantly decreased from May to July, from<br />
33.11% to 21.57% <strong>and</strong> from 20.08% to 14.78%,<br />
respectively, whereas the values of P MUFA increased<br />
from 32.89% to 50.96%. Various values were observed<br />
by other researchers for such parameters (Mnari et al.,<br />
2007; Jankowska et al., 2009).<br />
The n3 ⁄ n6 ratio has been suggested to be a useful<br />
indicator for comparing relative nutritional values of<br />
fish oils <strong>and</strong> a ratio of 1 ⁄ 1–1:5 recommended (Osman<br />
et al., 2001). The n3 ⁄ n6 ratio of for all types of samples<br />
Ó 2010 The Authors. Journal compilation Ó 2010 Institute of Food Science <strong>and</strong> Technology International Journal of Food Science <strong>and</strong> Technology 2010
1600<br />
Fatty acid <strong>and</strong> proximate composition of Pacific mullet S. Köse et al.<br />
was higher than the recommended ratio although female<br />
fish samples showed slightly higher value than males.<br />
The n3 ⁄ n6 ratios for female gonads were 3.08–6.06, the<br />
highest occurred with matured gonads (in May). These<br />
levels are found to be close to the levels obtained with<br />
fish flesh, suggesting that gonads of this species are also<br />
as valuable <strong>and</strong> it is advisable to be processed for human<br />
consumption. DHA <strong>and</strong> EPA had been shown to have<br />
preventive effects on human coronary artery disease <strong>and</strong><br />
been suggested as a key component for a healthy diet in<br />
humans (Kinsella, 1987; Lees & Karel, 1990; Simopoulos<br />
et al., 1991). In our study, DHA was the basic<br />
PUFA followed by EPA for muscle of both sexes. The<br />
levels for gonad samples averaged from 4.38% to 5.34%<br />
for DHA <strong>and</strong> 3.02% to 5.02% for EPA. In May, EPA<br />
levels were significantly higher (P < 0.05) compare to<br />
other months. For liver samples, although samples in<br />
May showing high DHA <strong>and</strong> low EPA values, accounting<br />
for 9.94% <strong>and</strong> 5.85%, opposite situation was<br />
observed for June as 0.89% for DHA <strong>and</strong> 9.54% for<br />
EPA. Numerous researchers have reported that DHA<br />
constitutes a majority of the PUFA in most marine fish<br />
(Tanakol et al., 1999; O¨ zyurt et al., 2005). Although the<br />
overall mean values showed no significant differences<br />
between sexes for both DHA <strong>and</strong> EPA in muscle tissues,<br />
significant differences occurred (P < 0.05) in some<br />
months either between sexes or within the same month.<br />
For gonads, no differences were found except for EPA<br />
between May <strong>and</strong> other months. O¨ zogul & O¨ zogul<br />
(2007) found higher EPA levels for M. cephalus muscle<br />
as 10.5%. Their DHA levels supported our overall mean<br />
values. However, S¸engo¨ r et al. (2003) found lower levels<br />
of both DHA <strong>and</strong> EPA for M. cephalus for muscle <strong>and</strong><br />
gonad samples.<br />
The addition of n3 PUFA to diet could improve the<br />
nutritional value <strong>and</strong> protect against diseases. A minimum<br />
value of PUFA ⁄ SFA ratio recommended is 0.45<br />
(HMSO, 1994). The PUFA ⁄ SFA levels in muscle were<br />
higher for females as 0.67 than males as 0.55. Significant<br />
variations (P < 0.05) were observed amongst individuals,<br />
months <strong>and</strong> sexes (Tables 2 <strong>and</strong> S3–S5). O¨ zogul &<br />
O¨ zogul (2007) found 0.75 for grey mullet, while 1.17<br />
obtained by S¸engo¨ r et al. (2003) (obtained from Aegean<br />
sea) indicating the regional effect on the same species.<br />
Our study also indicates that such levels can change<br />
depending on the time of the sampling, particularly<br />
reproduction period. The relating ratio for liver samples<br />
was found as 0.63 in May <strong>and</strong> 0.69 in June. S¸engo¨ r et al.<br />
(2003) observed higher level for the caviar of grey<br />
mullet. The UK Department of Health recommends an<br />
ideal ratio of n6 ⁄ n3 of 4.0 at maximum (HMSO, 1994),<br />
<strong>and</strong> higher values are suggested to be harmful to health<br />
<strong>and</strong> may promote cardiovascular diseases (O¨ zogul &<br />
O¨ zogul, 2007). We observed 0.21 <strong>and</strong> 0.22 for females<br />
<strong>and</strong> males, respectively, for muscle samples, 0.15–0.17<br />
for liver <strong>and</strong> 0.16–0.32 for gonads.<br />
Osman et al. (2001) reported that arachidonic acid<br />
(AA, C20:4n6) is a precursor for prostagl<strong>and</strong>in <strong>and</strong><br />
thromboxan which will influence the blood clot <strong>and</strong> its<br />
attachment to the endothelial tissue during wound<br />
healing. Apart from that, the acid also plays a role in<br />
growth. They also indicated that the contents of AA in<br />
marine fishes were lower than freshwater fishes. This<br />
study represents higher AA levels than those obtained<br />
for marine fish by other researches (Kiessling et al.,<br />
2001; Osman et al., 2001; O¨ zogul & O¨ zogul, 2007),<br />
indicating the genetic effect of this species as originated<br />
from freshwater environment. The values were higher<br />
for edible flesh of females as 4.08% than males<br />
(2.60%) in May samples compared to other samples<br />
obtained in June <strong>and</strong> July. It was suggested that such<br />
fatty acid is more abundant in fish species at the<br />
gonadial maturated period, especially in female samples.<br />
The overall mean value of AA was found as<br />
2.24% which was higher than the values obtained by<br />
O¨ zogul & O¨ zogul (2007) as between 0.08% <strong>and</strong> 0.61%<br />
for several fish species including M. cephalus. The<br />
values of AA in liver samples were similar to those<br />
obtained from muscle of male samples. However,<br />
lower AA observed for gonad samples averaged from<br />
0.76% to 1.29%.<br />
Processing <strong>and</strong> marketing of various types of caviars<br />
from different fish species including waxed grey mullet<br />
caviar have been reported (S¸engo¨ r et al., 2002, 2003;<br />
Shirai et al., 2006; Duyar et al., 2008; Karakas¸, 2008;<br />
Mol & Turan, 2008); however, the processing of caviar<br />
of P. mullet is rarely known <strong>and</strong> may exist only amongst<br />
the locals.<br />
Conclusion<br />
This study demonstrates significant variation in both<br />
proximate composition <strong>and</strong> FA of flesh, gonad <strong>and</strong> liver<br />
of P. mullet amongst the months, especially at the<br />
beginning <strong>and</strong> end of reproduction period. Although<br />
grey mullet is extensively studied for its nutritional<br />
value, there has been little information on P. mullet in<br />
regarding this aspect. As this species has been reported<br />
to have a rapid increase <strong>and</strong> exp<strong>and</strong>ing its population in<br />
different regions, biochemical composition, <strong>and</strong> FA<br />
profile will be valuable information for seafood industry<br />
<strong>and</strong> human consumption. Our study showed that both<br />
edible muscle <strong>and</strong> gonads of this species are useful<br />
source of fatty acid profile in terms of health diet for<br />
human consumption despite the low protein <strong>and</strong> lipid<br />
content in muscle tissue. Although P. mullet is commercially<br />
marketed for human consumption, caviar is<br />
not known commercially processed. This study indicates<br />
their commercial importance. The results may also<br />
contribute useful information on the euryhaline fish<br />
species in terms of proximate composition <strong>and</strong> FA<br />
profile.<br />
International Journal of Food Science <strong>and</strong> Technology 2010 Ó 2010 The Authors. Journal compilation Ó 2010 Institute of Food Science <strong>and</strong> Technology
Acknowledgments<br />
This study was supported by Karadeniz Technical<br />
University under the project number 2006.117.01.4.<br />
References<br />
AOAC. (1980). Official Methods of Analysis, 13th edn. Washington,<br />
DC: Association of Official Analytical Chemists, Official methods.7.009<br />
<strong>and</strong> 2.507<br />
AOAC. (1995). Official Methods of Analysis. Gaithersburg, MD:<br />
Association of Official Analytical Chemists, Official methods.985.14.<br />
Bas¸çınar, N. & Okumus¸, _I. (2005). I-VI yas¸larındaki Pasifik kefali<br />
ag˘ ırlık-karkas ve ag˘ ırlık – bas¸ oranı ilis¸kileri. Tu¨rk Sucul Yas¸am<br />
Dergisi. Ulusal Su Gu¨nleri Sempozyumu. Yıl. 3, 4, 539–544. In Turkish.<br />
C¸elik, M. (2008). Seasonal changes in the proximate chemical<br />
compositions <strong>and</strong> fatty acids of chub mackerel (Scomber japonicus)<br />
<strong>and</strong> horse mackerel (Trachurus trachurus) from the north eastern<br />
Mediterranean Sea. International Journal of Food Science <strong>and</strong><br />
Technology, 43, 933–938.<br />
Chugunova, N.I. (1959). Age <strong>and</strong> Growth Studies in Fishes. Pp. 67–110.<br />
Translated by Yasski, D. (1963). Jarusalem: Israel Program for<br />
Scientific Translations Ltd.<br />
Duyar, H.A., Ög˘ retmen, Y.Ö. & Ekici, K. (2008). Composition of<br />
Waxed caviar <strong>and</strong> the determination of its shelf-life. Journal of<br />
Animal <strong>and</strong> Veterinary Advances, 7, 1029–1033.<br />
Erdem, M.E., Kalaycı, F. & Samsun, N. (2006). Sinop Kıyılarında<br />
Avlanan Pasifik Kefali (Mugil so-iuy, Basilevsky, 1855) Filetolarında<br />
Besin _Ic¸eriklerinin Dag˘ ılımı. EU Journal of Fisheries <strong>and</strong> Aquatic<br />
Sciences, 23(Suppl. 1 ⁄ 3), 421–424. In Turkish with English Abstract.<br />
Go¨ zler, A.M., Engin, S., Koral, S., S¸ahin, C. & Ag˘ ırbas¸, E. (2005).<br />
Dog˘ u Karadenizde 2004 Yılı Avlanma Sezonunda Avlanan Pasifik<br />
Kefali (Mugil so-iuy, Basilewski, 1885)’nin Bazı Populasyon Parametreleri,<br />
In Proceedings of ‘XIII. Ulusal Su U¨ru¨nleri Sempozyumu’,<br />
C¸anakkale, Turkey. In Turkish.<br />
Halilog˘ lu, H.I. (2001). A research on fatty acid composition of some<br />
tissues of Rainbow trout’s (Onchorhynchus mykiss) raised in<br />
different fish farms in Ezurum. Ph.D. Thesis. Turkey: Atatu¨ rk<br />
Uni. Fisheries Dept., Erzurum. In Turkish with English Abstract.<br />
Halilog˘ lu, H._I., Bayır, A., Sirkecig˘ lu, A.N., Aras, N.M. & Atamanalp,<br />
M. (2004). Comparison of fatty acid composition in some tissues of<br />
rainbow trout (Oncorhynchus mykiss) living in seawater <strong>and</strong><br />
freshwater. Food Chemistry, 86, 55–59.<br />
HMSO, (1994). Nutritional Aspects of Cardiovascular Disease. Report<br />
on health <strong>and</strong> social subjects N. 46. Pp. 37–46. London: HMSO.<br />
Department of Health: UK.<br />
Ichihara, K., Shibahara, A., Yamamoto, K. & Nakayama, T. (1996).<br />
An improved method for rapid analysis of the fatty acids of<br />
glycerolipids. Lipids, 31, 535–539.<br />
Jankowska, B., Zakes´, Z., _Zmijewski, T. & Szczepkowski, M.<br />
(2010). Fatty acid profile of muscles, liver <strong>and</strong> mesenteric fat in<br />
wild <strong>and</strong> reared perch (Perca fluviatilis L.). Food Chemistry, 118,<br />
764–768.<br />
Karakas¸, Y. (2008). Kefal balıg˘ ında havyar u¨ retimi ve kalitesinin<br />
belirlenmesi. Master Thesis. Isparta, Turkey: Süleyman Demirel<br />
U¨ niversitesity. In Turkish with English Abstract.<br />
Karl, H., Lehmann, I., Rehbein, H. & Schubring, R. (2010).<br />
Composition <strong>and</strong> quality attributes of conventionally <strong>and</strong> organically<br />
farmed Pangasius fillets (Pangasius hypophthalmus) on the<br />
German market. International Journal of Food Science <strong>and</strong> Technology,<br />
45, 56–66.<br />
Kaya, M., Mater, S. & Korkut, A.Y. (1998). A New Grey Mullet<br />
Species ‘‘Mugil so–iuy Basilewsky’’ (Teleostei: Mugilidae) From the<br />
Aegean Coast of Turkey. Turkish Journal of Zoology, 22, 303–306.<br />
Kiessling, A., Pickova, J., Johansson, L., A˚ sga˚ rd, T., Storebakken, T.<br />
& Kiessling, K-H. (2001). Changes in fatty acid composition in<br />
Fatty acid <strong>and</strong> proximate composition of Pacific mullet S. Köse et al. 1601<br />
muscle <strong>and</strong> adipose tissue of farmed rainbow trout (Oncorhynchus<br />
mykiss) in relation to ration <strong>and</strong> age. Food Chemistry, 73, 271–284.<br />
Kinsella, J.E. (1987). Seafoods <strong>and</strong> Fish Oils in Human Health <strong>and</strong><br />
Disease. Pp. 1–23. New York: Marcel Dekker.<br />
Lees, R.S. & Karel, M. (1990). Omega-3 Fatty Acids in Health <strong>and</strong><br />
Disease. Pp. 39–69. New York: Marcel Dekker.<br />
Luzia, L.A., Sampaio, G.R., Castellucci, C.M.N. & Torres, E.A.F.S.<br />
(2003). The influence of season on the lipid profiles of five commercially<br />
important species of Brazilian fish. Food Chemistry, 83, 93–97.<br />
Mnari, A., Bouhlel, I., Chraief, I. et al. (2007). Fatty acids in muscles<br />
<strong>and</strong> liver of Tunisian wild <strong>and</strong> farmed gilthead sea bream, (Sparus<br />
aurata). Food Chemistry, 100, 1393–1397.<br />
Mol, S. & Turan, S. (2008). Comparison of proximate, fatty acid <strong>and</strong><br />
amino acid compositions of various types of fish roes. International<br />
Journal of Food Properties, 11, 669–677.<br />
Okumus¸, _I. & Bas¸c¸ınar, N. (1997). Population structure, growth <strong>and</strong><br />
reproduction of introduced Pacific mullet, (Mugil so-iuy) in the<br />
Black Sea. Fisheries Research, 33, 131–137.<br />
Omelchenko, V.T., Salmenkova, E.A., Makhotkin, M.A. et al. (2004).<br />
Far Eastern Mullet Mugil soiuy Basilewsky (Mugilidae, Mugiliformes):<br />
the Genetic Structure of Populations <strong>and</strong> Its Change under<br />
Acclimatization. Russian Journal of Genetics, 40, 910–918.<br />
Osman, H., Suriah, A.R. & Law, E.C. (2001). Fatty acid composition<br />
<strong>and</strong> cholesterol content of selected marine fish in Malaysian waters.<br />
Food Chemistry, 73, 55–60.<br />
Özogul, Y. & Özogul, F. (2007). Fatty acid profiles of commercially<br />
important fish species from the Mediterranean, Aegean <strong>and</strong> Black<br />
Seas. Food Chemistry, 100, 1634–1638.<br />
Özog˘ ul, Y., Özog˘ ul, F. & Alago¨ z, S. (2007). Fatty acid profiles <strong>and</strong> fat<br />
contents of commercially important marine water <strong>and</strong> freshwater<br />
fish species of Turkey: a comparative study. Food Chemistry, 103,<br />
217–223.<br />
Özyurt, G., Polat, A. & Özku¨ tu¨ k, S. (2005). Seasonal changes in the<br />
fatty acids of gilthead sea bream (Sparus aurata) <strong>and</strong> white sea<br />
bream (Diplodus sargus) captured in Iskenderun Bay, eastern<br />
Mediterranean coast of Turkey. European Food Research <strong>and</strong><br />
Technology, 220, 120–124.<br />
Schmidt, E.B., Rasmussena, L.H., Rasmussena, J.G., Joensena, A.M.,<br />
Madsena, M.B. & Christensen, J.H. (2006). Fish, marine n-3<br />
polyunsaturated fatty acids <strong>and</strong> coronary heart disease: a minireview<br />
with focus on clinical trial data. Prostagl<strong>and</strong>ins, Leukotrienes <strong>and</strong><br />
Essential Fatty Acids, 75, 191–195.<br />
S¸engör, G.F., Cihaner, A., Erkan, N., Özden, O¨ . & Varlık, C. (2002).<br />
Topan kefali (Mugil cephalus, L. 1758) yumurtasından havyar eldesi,<br />
r<strong>and</strong>ımanı ve kimyasal kompozisyonunun belirlenmesi. Turkish<br />
Journal of Veterinary <strong>and</strong> Animal Sciences, 26, 183–187. In Turkish<br />
with English Abstract.<br />
S¸engör, G.F., Özden, Ö., Erkan, N., Tu¨ ter, M. & Aksoy, H.A. (2003).<br />
Fatty acid compositions of flathead grey mullet (Mugil cephalus L.,<br />
1758) fillet, raw <strong>and</strong> beeswaxed caviar oils. Turkish Journal of<br />
Fisheries <strong>and</strong> Aquatic Sciences, 3, 93–96.<br />
Shirai, N., Higuchi, T. & Suzuki, H. (2006). Analysis of lipid classes<br />
<strong>and</strong> the fatty acid composition of the salted fish roe food<br />
products, Ikura, Tarako, Tobiko <strong>and</strong> Kazunoko. Food Chemistry,<br />
94, 61–67.<br />
Simopoulos, A.P. (1991). Omega-3 fatty acids in health <strong>and</strong> disease<br />
<strong>and</strong> in growth <strong>and</strong> development. American Journal of Clinical<br />
Nutrition, 54, 438–463.<br />
Simopoulos, A.P., Kifer, R.R., Martin, R.E. & Barlow, S.M. (1991).<br />
Health Effects of Omega 3 Polyunsaturated Fatty Acids in Seafoods,<br />
Vol. 66. Basel, Switzerl<strong>and</strong>: S. Karger Publishing; World Review of<br />
Nutrition <strong>and</strong> Dietetics.<br />
Sokal, R.R. & Rohlf, F.J. (1987). Introduction to Biostatistics, 2nd edn.<br />
New York: W.H. Freeman <strong>and</strong> Company.<br />
Starushenko, L.I. & Kazansky, A.B. (1996). Introduction of Mullet<br />
Haader (Mugil soiuy Basilevsky) into the Black Sea <strong>and</strong> the Sea of<br />
Azov. GFCM Studies <strong>and</strong> Reviews No. 67. Rome: FAO.<br />
Ó 2010 The Authors. Journal compilation Ó 2010 Institute of Food Science <strong>and</strong> Technology International Journal of Food Science <strong>and</strong> Technology 2010
1602<br />
Fatty acid <strong>and</strong> proximate composition of Pacific mullet S. Köse et al.<br />
Tanakol, R., Yazıcı, Z., Sener, E. & Sencer, E. (1999). Fatty acid<br />
composition of 19 species of fish from the Black Sea <strong>and</strong> the<br />
Marmara Sea. Lipids, 34, 291–297.<br />
Unsal, S. (1992). A new mullet species for Turkish seas: Mugil soiuy,<br />
Basilevsky. Dog˘a, Turkish Journal of Veterinary <strong>and</strong> Animal<br />
Sciences, 16, 427–432.<br />
Vlieg, P. (1988). Proximate composition of New Zeal<strong>and</strong> Marine<br />
Finfish <strong>and</strong> Shellfish, FAO Corporate Document Repository, Home<br />
page. http://www.fao.org/docrep/007/ae581e/ae581e00.htm#Contents,<br />
Accessed 28th July 2009.<br />
Yanes-Roca, C., Rhody, N., Nystroma, M. & Main, K.L. (2009).<br />
Effects of fatty acid composition <strong>and</strong> spawning season patterns on<br />
egg quality <strong>and</strong> larval survival in common snook (Centropomus<br />
undecimalis). Aquaculture, 287, 335–340.<br />
Yildiz, M., S¸ener, E. & Timur, M. (2008). Effects of differences in diet<br />
<strong>and</strong> seasonal changes on the fatty acid composition in fillets from<br />
farmed <strong>and</strong> wild sea bream (Sparus aurata L.) <strong>and</strong> sea bass<br />
(Dicentrarchus labrax L.). International Journal of Food Science <strong>and</strong><br />
Technology, 43, 853–858.<br />
Supporting Information<br />
Additional supporting Information may be found in the<br />
online version of this article<br />
Table S1. Proximate composition (% wet basis) values<br />
for muscle tissues of individual Pacific mullet samples<br />
obtained from three different months.<br />
Table S2. Proximate composition of gonads of individual<br />
Pacific mullet samples representing three different<br />
months.<br />
Table S3. Fatty acid profile for muscle tissues of<br />
individual Pacific mullet samples obtained in May.<br />
Table S4. Fatty acid profile for muscle tissues of<br />
individual Pacific mullet samples obtained in June.<br />
Table S5. Fatty acid profile for muscle tissues of<br />
individual Pacific mullet samples obtained in July.<br />
Table S6. Fatty acid profile of individual female<br />
gonads obtained in May <strong>and</strong> July.<br />
Please note: Wiley-Blackwell are not responsible for<br />
the content or functionality of any supporting information<br />
supplied by the authors. Any queries (other than<br />
missing material) should be directed to the corresponding<br />
author for the article.<br />
International Journal of Food Science <strong>and</strong> Technology 2010 Ó 2010 The Authors. Journal compilation Ó 2010 Institute of Food Science <strong>and</strong> Technology
International Journal of Food Science <strong>and</strong> Technology 2010, 45, 1603–1609 1603<br />
Original article<br />
Volatile composition <strong>and</strong> nutritional quality of the edible<br />
mushroom Polyporus tenuiculus grown on different agro-industrial<br />
waste<br />
Alej<strong>and</strong>ra Omarini, 1 Cynthia Henning, 2 Jorge Ringuelet, 2 Julio A. Zygadlo 3 & Edgardo Albertó 1 *<br />
1 Laboratorio de Micología y Cultivo de Hongos Comestibles, IIB-INTECH (UNSAM-CONICET) Camino Circunv. Laguna km 6, C.C. 164;<br />
C.P. B7130IWA, Chascomús, Argentina<br />
2 Laboratorio de Fitoquímica, Facultad de Ciencias Agrarias y Forestales, Universidad Nacional de La Plata, Calle 60 Nº 119, La Plata (1900),<br />
Argentina<br />
3 Instituto de Ciencia y Tecnología de Alimentos (ICTA), IMBIV-CONICET, FCEFyN-UNC, Av. Velez Sarsfield 1611, (5016), Co´ rdoba,<br />
Argentina<br />
(Received 23 December 2009; Accepted in revised form 4 May 2010)<br />
Summary The volatile composition <strong>and</strong> the nutritional value of Polyporus tenuiculus grown on supplemented <strong>and</strong><br />
nonsupplemented wheat straw <strong>and</strong> willow sawdust were determined. Thirty-nine volatile compounds were<br />
detected, including acids, esters, alcohols, hydrocarbons, aldehydes <strong>and</strong> ketones. The main volatile<br />
compound in all samples was 1-octen-3-ol, with increasing levels in mushrooms cropped on supplemented<br />
substrate. In addition, several precursors of this alcohol were identified in lower percentages. Mushrooms<br />
grown on supplemented substrates showed lower fat (5.2–5.7%) <strong>and</strong> carbohydrate contents (48.2%) <strong>and</strong><br />
higher protein content (22–22.5%). Fibre <strong>and</strong> ash contents showed some variations between types of<br />
substrates. Compared to other edible fungi, P. tenuiculus high fibre <strong>and</strong> protein contents point to this species<br />
as a healthy nutritional alternative of interest for the food industry. Moreover, the wide spectrum of volatile<br />
compounds of P. tenuiculus reveals great potential for biotechnological applications such as the production<br />
of ‘‘non artificial’’ mushroom flavour.<br />
Keywords Edible mushroom, flavour, nutrients, Polyporus tenuiculus, volatile compounds.<br />
Introduction<br />
Mushrooms, the fruiting bodies of fungi, are appreciated<br />
not only for their texture <strong>and</strong> flavour but also for their<br />
chemical <strong>and</strong> nutritional characteristics (Manzi et al.,<br />
1999). Nutritionally, mushrooms provide key nutrients<br />
<strong>and</strong> bioactive components such as high-quality proteins,<br />
some vitamins (including riboflavin, niacin, thiamine,<br />
folic acid <strong>and</strong> ascorbic acid), minerals (potassium, phosphorus,<br />
magnesium, zinc, copper, <strong>and</strong> selenium), unsaturated<br />
fatty acids <strong>and</strong> fibre (Buswell & Chang, 1993).<br />
Research on the quality <strong>and</strong> diversity of the cultivated<br />
fungal species is as important as the conducted research<br />
on agronomic techniques to obtain mushrooms with<br />
higher nutritional <strong>and</strong> medicinal value as well as suitable<br />
biological material for biotechnological applications for<br />
industrial purposes (Liu et al., 2004; C¸ ag˘ larırmak, 2007).<br />
Relevant targets are the pharmaceutical, diet supplements<br />
<strong>and</strong> food industries, which can attain products of<br />
*Correspondent: E-mail: ealberto@intech.gov.ar<br />
doi:10.1111/j.1365-2621.2010.02306.x<br />
Ó 2010 The Authors. Journal compilation Ó 2010 Institute of Food Science <strong>and</strong> Technology<br />
higher added value by enriching their products with<br />
edible fungi (GRAS organisms) <strong>and</strong> therefore obtain<br />
new aromas, flavours <strong>and</strong> nutritional values.<br />
Fungal aroma is a typical <strong>and</strong> special trait of each<br />
edible mushroom species. The potential of basidiomycetes<br />
to produce natural flavours de novo or by<br />
biotransformation is of considerable interest for biotechnological<br />
purposes because, at present, flavour<br />
supply is quite restricted to the natural biosynthetic<br />
capability of plants (Abraham & Berger, 1994). As<br />
fungal metabolites represent a wide diversity of chemical<br />
species, research on fungal secondary metabolism is of<br />
great interest. Furthermore, along with certain Ascomycota,<br />
several species of the Polyporaceae family have<br />
been studied in recent years as a good source of<br />
biologically active compounds (Wu et al., 2005). Thus,<br />
fungal biotransformation of low-cost substrates into<br />
high-value flavour <strong>and</strong> aroma compounds reveals to be<br />
of great commercial potential. For this reason, it is of<br />
great importance to learn about the volatile composition<br />
of each fungal species under natural conditions.
1604<br />
Volatile composition <strong>and</strong> nutritional quality of Polyporus tenuiculus A. Omarini et al.<br />
Therefore, a detailed research of this kind is a basic<br />
starting point for revealing the underlying mechanisms<br />
in flavour <strong>and</strong> aroma formation in fungal fruiting bodies<br />
(Wu et al., 2005).<br />
Both volatiles <strong>and</strong> nutrients can be affected by<br />
substrate or growth media, which is of great importance<br />
given that one of the most important factor for<br />
consumer acceptance of food is flavour (Shashirekha<br />
et al., 2005; Wu et al., 2005; Valencia del Toro et al.,<br />
2006; C¸ ag˘ larırmak, 2007; Cho et al., 2007, 2008; Silva<br />
et al., 2007; ). Substrates used for mushroom cultivation,<br />
mixtures of different agro-industrial wastes (wheat,<br />
rice, paddy straw, sawdust, corn cobs) <strong>and</strong> nitrogen<br />
supplements (wheat bran, soybean hull, millet) influence<br />
chemical composition <strong>and</strong>, consequently, the nutritional<br />
value of the cultivated mushrooms (Bonatti et al., 2004;<br />
Shashirekha et al., 2005).<br />
Many studies focus on the search of new wild species<br />
of edible mushrooms to enrich the number of available<br />
species for human consumption. Mushrooms of the<br />
genus Polyporus are known to have a great capacity for<br />
producing <strong>and</strong> transforming high-value compounds<br />
(Wu et al., 2005), which makes them an interesting<br />
subject for further study. We have focused on Polyporus<br />
tenuiculus, a species widely distributed in America which<br />
is harvested by different ethnic groups for human<br />
consumption <strong>and</strong> to be sold in the markets in Me´ xico<br />
(Omarini et al., 2009). Recently, Omarini et al. (2009)<br />
managed to obtain fruiting bodies of P. tenuiculus on<br />
agriculture waste. They also studied the sensory attributes<br />
of dried specimens <strong>and</strong> proved that they can vary<br />
with the substrate where it is cultivated (Omarini et al.,<br />
2010). This species, being massively consumed in different<br />
American countries, indicates a clear preference over<br />
other native edible mushrooms but its flavour profile<br />
<strong>and</strong> the nutritional traits are still unknown. Therefore,<br />
we examined the volatile flavour compounds <strong>and</strong><br />
nutritional value of P. tenuiculus <strong>and</strong> their variations<br />
according to growth substrate.<br />
Materials <strong>and</strong> methods<br />
Strain<br />
Cultures used in this study are conserved in the IIB-<br />
INTECH Collection of Fungal Cultures (ICFC) reference<br />
in the WDCM data base (WDCM 826). P. tenuiculus<br />
ICFC 383 ⁄ 00, Brazil, Rı´ o Gr<strong>and</strong>e do Soul, Porto Alegre,<br />
Parque Faroupilla (fallen trunks of Musa sp. trees).<br />
Culture condition for mushroom cultivation<br />
Culture media <strong>and</strong> spawn preparation<br />
Potato dextrose agar (39 g L )1 PDA; Britania, Buenos<br />
Aires, Argentina) culture medium was used for routine<br />
culture <strong>and</strong> storage purposes. Spawn was prepared from<br />
Table 1 Substrate formulation (%)<br />
Substrates Main component (%)<br />
Supplements (%)<br />
Wheat<br />
br<strong>and</strong><br />
Soybean<br />
flour CaCO 3<br />
NS-Wt Wheat straw (98) 0 0 2<br />
S-Wt Wheat straw (78) 15 5 2<br />
NS-Sd Willow sawdust (98) 0 0 2<br />
S-Sd Willow sawdust (78) 15 5 2<br />
boiled wheat seeds (Triticum sp.) supplemented with 2%<br />
w ⁄ w calcium carbonate (CaCO 3), placed in polypropylene<br />
bags <strong>and</strong> then sterilised at 121 °C for 2 h (Stamets,<br />
1993). As the bags were cooled, they were inoculated<br />
with mycelia grown on PDA <strong>and</strong> incubated in darkness<br />
at 25 °C until mycelia had completely covered the wheat<br />
grains.<br />
Substrate formulation<br />
Dried willow tree (Salix sp.) sawdust <strong>and</strong> wheat<br />
(Triticum sp.) straw were chopped at 1.5–3 mm <strong>and</strong> of<br />
30–50 mm long, respectively. These substrates were used<br />
with <strong>and</strong> without supplements (Table 1). Distilled water<br />
was added to all formulas <strong>and</strong> left overnight to<br />
moisturise completely to obtain 70% w ⁄ w of water<br />
content. Polypropylene bags (25 · 45 cm, 30 lm thick)<br />
were filled with 1 kg of wet substrate <strong>and</strong> stoppered with<br />
cotton plugs held by polyvinyl chloride cylinders, before<br />
they were sterilised twice at 121 °C for 2.5 h. After<br />
cooling, the bags were inoculated with 5% w ⁄ w spawn<br />
<strong>and</strong> incubated in the dark at 25 °C for 60 days until the<br />
mycelium completely colonised the substrate.<br />
Culture condition<br />
Cropping conditions to induce fruiting bodies formation<br />
for all substrates were 22 ± 2 °C, 9-h light ⁄ 15-h dark<br />
photoperiod (20 W fluorescent light), 75–85% relative<br />
humidity levels <strong>and</strong> watering by spray (fog type) <strong>and</strong><br />
automatically watering with a fog system for 5 min<br />
every 8 h. Fruiting bodies were harvested when mature<br />
(see Omarini et al., 2009) <strong>and</strong> they were frozen at<br />
)20 °C for assays.<br />
Fruiting body analysis<br />
Analysis of volatile compounds<br />
Samples of fresh fruiting bodies (50 g) harvested from<br />
wheat straw (NS-Wt <strong>and</strong> S-Wt) <strong>and</strong> sawdust (NS-Sd<br />
<strong>and</strong> S-Sd) were placed in a glass recipient seal. Extraction<br />
of headspace volatile compounds was carried out<br />
using a solid-phase microextraction (SPME) device<br />
(Supelco, Bellefonte, PA, USA) with a 100-lm polydimethylsiloxane<br />
fibre. Capped vials were placed in a<br />
40 °C water bath, <strong>and</strong> volatiles were sampled for 20 min<br />
International Journal of Food Science <strong>and</strong> Technology 2010 Ó 2010 The Authors. Journal compilation Ó 2010 Institute of Food Science <strong>and</strong> Technology
(Ouzouni et al., 2009). After extraction, volatiles from<br />
the SPME fibre were desorbed at the injection port of a<br />
gas chromatograph coupled to a mass spectrometer (HP<br />
5890II-HP 5971MSD, Hewlett-Packard), with a potential<br />
of 70 eV for ionisation by electron impact. The<br />
injector <strong>and</strong> detector temperatures were 200 <strong>and</strong> 270 °C,<br />
respectively. The column was temperature programmed<br />
as follows: 50 °C (2 min) to 200 °C (3 °C ⁄ min). The<br />
carrier gas was helium with a constant flow rate set close<br />
to 0.9 mL per minutes.<br />
Compounds were resolved on a DB-5 column (25 m<br />
length · 0.25 mm inside diameter · 0.25 lm film thickness)<br />
<strong>and</strong> identified on the basis of comparison of their<br />
mass spectra with authentic st<strong>and</strong>ards when this was<br />
possible; or with commercial mass spectral databases of<br />
the Wiley library (Wiley 275; J. Wiley & Sons Ltd, Wet<br />
Sussex, UK) <strong>and</strong> NIST 98 MS Library (Rev. D. 01.00;<br />
HP, Ringoes, NJ, USA)). Volatile analyses of the<br />
samples were done in triplicate.<br />
Proximate analysis<br />
Samples of fresh fruiting bodies of P. tenuiculus (250 g<br />
of a combination of young <strong>and</strong> old sporophores) were<br />
collected by culture bags of supplemented <strong>and</strong> nonsupplemented<br />
wheat straw (S-Wt <strong>and</strong> NS-Wt) <strong>and</strong><br />
sawdust (S-Sd <strong>and</strong> NS-Sd) <strong>and</strong> were dried until constant<br />
weight at 50 °C.<br />
The proximate composition of mushroom samples<br />
(based on the official AOAC method, 1990) was carried<br />
out by triplicate to obtain the following fractions<br />
(expressed in percentage): (i) moisture content (drying<br />
in oven at 100 °C), (ii) ash content (by incineration at<br />
550 °C), (iii) crude fat content (determined by Soxhlet<br />
using hexane as solvent), (iv) crude fibre content (by acid<br />
<strong>and</strong> alkali digestion), <strong>and</strong> (v) crude protein content (by<br />
Kjeldahl method (the total nitrogen content was<br />
determined by the Kjeldahl (AOAC, 1990) method).<br />
The total protein was determined from the total<br />
nitrogen content, using the correction factor 4.38<br />
(Breene, 1990). Non-nitrogen extractive fraction (%<br />
ENN), which includes soluble carbohydrates, was calculated<br />
as dry matter not accounted in the sum of<br />
humidity, ash, crude fibre, crude fat <strong>and</strong> crude protein.<br />
Statistical analysis<br />
Statistical analyses were performed using SigmaStat Ò<br />
program for windows, version 3.1 (Systat software Inc.,<br />
Point Richmond, CA, USA). Volatile compounds analysis<br />
of mushrooms samples was calculated as the<br />
average of two replicates performed in each substrate<br />
sample whereas proximate analysis of mushrooms<br />
composition samples was calculated as the average of<br />
three replicates. Means <strong>and</strong> st<strong>and</strong>ard deviations were<br />
calculated, <strong>and</strong> significant differences were estimated<br />
using Tukey multiple-range test at P < 0.05.<br />
Volatile composition <strong>and</strong> nutritional quality of Polyporus tenuiculus A. Omarini et al. 1605<br />
Results <strong>and</strong> discussion<br />
Volatile compounds of fruiting bodies<br />
Volatile compounds identified in P. tenuiculus fruiting<br />
bodies grown on lignocellulose substrates (Wt <strong>and</strong> Sd)<br />
consisted of acids, esters, alcohols, carbohydrates,<br />
aldehydes <strong>and</strong> ketones. Table 2 includes the 39 identified<br />
volatile compounds, their retention indexes (IRs) <strong>and</strong><br />
relative percentages based on GC ⁄ MS peak area.<br />
Independently of the culture substrate used in this<br />
study, the major volatile compounds identified in all<br />
samples was 1-octen-3-ol, widely referred in the literature<br />
for its characteristic ‘‘mushroom’’ aroma (Chiron &<br />
Michelot, 2005; Combet et al., 2006) contributing<br />
significantly to aroma intensity. It is frequently found<br />
in many mushroom species such as Agaricus bisporus,<br />
Fomitopsis pinicola, Piptoporus betulinus, Cantharellus<br />
cibarius, Polyporus sulfureus, Pleurotus ostreatus, P. florida,<br />
Hericium erinaceum, Boletus edulis, Tricholoma<br />
matsutake (Ro¨ secke et al., 2000; Liu et al., 2004; Chiron<br />
& Michelot, 2005; Wu et al., 2005; Combet et al., 2006;<br />
Guedes de Pinho et al., 2008). Also, several compounds<br />
with intermediate to low percentages were identified,<br />
such as (Z,Z)-9,12-octadecadienoic acid methyl ester,<br />
(Z)-9-octadecenoic acid methyl ester, (Z,Z)-9,12-octadecadienoic<br />
acid methyl ester, <strong>and</strong> hexadecanoic acid, <strong>and</strong><br />
all of them are precursors in the synthesis of 1-octen-<br />
3-ol. As informed for A. bisporus, this alcohol is the<br />
product of a series of enzymatic reactions starting with<br />
the oxidation of (Z,Z)-9,12-octadecadienoic acid (linoleic<br />
acid), by a lipoxygenase, <strong>and</strong> the further cleavage of<br />
the intermediate fatty acid hydroperoxide by a hydroperoxide<br />
lyase (Chiron & Michelot, 2005; Wu et al.,<br />
2005; Combet et al., 2006). The fruiting bodies of<br />
P. tenuiculus harvested on supplemented substrates<br />
(S-Wt <strong>and</strong> S-Sd) showed a small increase in 1-octen-3-ol<br />
percentages. As it was reported by Wu et al. (2005) <strong>and</strong><br />
C¸ ag˘ larırmak (2007), the flavours of mushrooms were<br />
affected by the compositions of growth medium, growth<br />
conditions, age <strong>and</strong> genetics variation. Therefore, our<br />
results showed that either the addition of supplements in<br />
the substrates of P. tenuiculus, such as wheat bran <strong>and</strong><br />
soybean flour, could provide precursors for C8 acids<br />
synthesis leading to increasing relative percentages or<br />
the increase in the nutrient availability for mushrooms<br />
nutrition could allow the increase in certain metabolites<br />
level (Shashirekha et al.,2005).<br />
The fungal aroma of P. tenuiculus is mainly associated<br />
with the occurrence of C8 aliphatic chains despite the<br />
contribution of other kind of compounds to it. Linoleic<br />
acid is the precursor to eight-carbon volatiles formation<br />
in fungi (1-octen-3-ol, 1-octen-3-one <strong>and</strong> 3-octanol),<br />
acting as substrate to a fatty acid oxygenase (lipoxygenase),<br />
<strong>and</strong> then that of a hydroperoxide lyase (Combet<br />
et al., 2006). This process occurs generally in the late<br />
Ó 2010 The Authors. Journal compilation Ó 2010 Institute of Food Science <strong>and</strong> Technology International Journal of Food Science <strong>and</strong> Technology 2010
1606<br />
Volatile composition <strong>and</strong> nutritional quality of Polyporus tenuiculus A. Omarini et al.<br />
Table 2 Volatiles composition of fresh Polyporus tenuiculus fruiting bodies harvested from the different lignocellulose wastes<br />
Compound<br />
IR %*<br />
phase of cultivation, indicating an increasing contact<br />
of enzyme <strong>and</strong> substrate as a result of increased cell<br />
lyses (Abraham & Berger, 1994). It has also been<br />
demonstrated for A. bisporus that 1-octen-3-ol can be<br />
produced by enzymatic reduction or self-oxidation of<br />
1-octen-3-one (Chen & Wu, 1984).<br />
Among the volatiles identified in P. tenuiculus fruiting<br />
bodies were two benzoid compounds of pleasant weak<br />
floral fragrance, benzaldehyde <strong>and</strong> phenylacetic acid,<br />
both in a low percentage in all samples analysed but<br />
specially in those grown on sawdust. A reason for the<br />
DB-5 NS-Sd S-Sd NS-Wt WS-t<br />
2-methylbutanoic acid methyl ester 770 Tr Tr Tr 0.15 ± 0.02<br />
Hexanal 785 2.75 ± 0.35 b Tr Tr 0.35 ± 0.07 a<br />
2-methyl propanoic acid 793 Tr 0.25 ± 0.07 a 0.30 ± 0 a 0.4 ± 0.14 a<br />
4-hidroxy-4-methyl-2-pentanone 809 Tr Tr Tr Tr<br />
4-hexen-3-one 811 Tr 0.45 ± 0.07 a 0.55 ± 0.07 a Tr<br />
3-methylbutanoic acid 850 0.90 ± 0.14 b 0.05 ± 0.07 a 0.05 ± 0.07 a Tr<br />
5-(1-methylethylidene)-1,3-cyclopentadiene 858 Tr Tr Tr Tr<br />
c-butyrolactone 870 0.30 ± 0.14 c 0.15 ± 0.07 b 0.05 ± 0.07 Tr<br />
Hexanoic acid methyl ester 911 Tr Tr Tr Tr<br />
c-valerolactone 918 0.15± 0.07 ab 0.10 ± 0 a 0.25 ± 0.07 b Tr<br />
2-heptenal 930 Tr Tr Tr Tr<br />
Benzaldehyde 935 0.20 ± 0.2 b 0.05 ± 0.07 a 0.35 ± 0.07 c Tr<br />
2-methylhexanoic acid 941 Tr 0.51 ± 0.07 a 0.51 ± 0.07 a Tr<br />
1-octen-3-one 952 0.35 ± 0.07 a 1.20 ± 0 b 0.45 ± 0.07 a Tr<br />
3-octanone 960 12.55 ± 0.78 b 8.25 ± 0.35 a 11.55 ± 1.20 b 10.95 ± 0.21b<br />
1-octen-3-ol 970 38.45 ± 1.06 a 40.80 ± 0.42b 37.85 ± 0.21 a 44.05 ± 0.21c<br />
Octanal 980 Tr Tr Tr 0.75 ± 0.07<br />
3-octanol 984 5.90 ± 0.14 a 8.90 ± 0.14 c 7.90 ± 0.28 b 11.05 ± 0.21d<br />
Hexanoic acid methyl ester 990 Tr 0.20 ± 0 a 0.20 ± 0 a Tr<br />
1-octanol 1063 0.90 ± 0.14 a 2.45 ± 0.49 b 3.80 ± 0.28 c 2.50 ± 0.42 b<br />
Nonanal 1085 0.80 ± 0.14 a 0.25 ± 0.21 a 0.15 ± 0.07 a 2.50 ± 0.42 b<br />
2-phenylethanol 1088 0.70 ± 0.28 b 0.25 ± 0.07ab 0.50 ± 0.14 b Tr<br />
2-octenol phenylacetic acid 1248 4.95 ± 0.07 b 2.20 ± 0.28 a 2.00 ± 0.28 a Tr<br />
Nonanoic acid 1273 0.70 ± 0.28 a 0.70 ± 0.14 a 0.50 ± 0.14 a 1.85 ± 0.21 b<br />
Hexadecane 1602 Tr Tr Tr Tr<br />
Dodecanoic acid 1-methylethyl ester 1618 Tr Tr Tr Tr<br />
Heptadecane 1702 Tr Tr Tr Tr<br />
Octadecane 1802 Tr Tr Tr Tr<br />
Pentadecanoic acid methyl ester 1814 Tr 0.05 ± 0.07 a 0.15 ± 0.21 a 3.05 ± 0.21 b<br />
Pentadecanoic acid 1857 Tr Tr Tr Tr<br />
(Z)-9-hexadecenoic acid methyl ester 1890 Tr Tr 0.20 ± 0.14 Tr<br />
Hexadecanoic acid methyl ester 1916 Tr 0.95 ± 0.07 c 0.45 ± 0.07b 0.05 ± 0.07 a<br />
Hexadecanoic acid 1958 7.60 ± 0.57 c 4.90 ± 0.14 a 6.20 ± 0.28 b Tr<br />
Eicosane 2002 Tr Tr Tr Tr<br />
(Z,Z)-9,12-octadecadienoic acid methyl ester 2079 2.65 ± 0.92 a 8.60 ± 0.71bc 7.85 ± 0.21 b 9.85 ± 0.21 c<br />
(Z)-9-octadecenoic acid methyl ester 2087 3.15 ± 0.21 b 0.65 ± 0.35 a 0.85 ± 0.21 a 0.90 ± 0.14 a<br />
(Z,Z)-9,12-octadecadienoic acid 2126 10.50 ± 0.70 a 10.60 ± 0.70 10.60 ± 1.13 a 9.50 ± 0.70 a<br />
Octadecanoic acid 2157 1.25 ± 0.35 b Tr Tr 0.20 ± 0.14 a<br />
*Relative percentages of the volatiles are based on the peak areas obtained, without MS detector response factor correction. Values are average of two<br />
replicates. In each file, different letters indicate significant differences (P < 0.05). Substrates: NS-Wt: wheat straw; S-Wt: wheat straw supplemented with<br />
soybean flour (5%) <strong>and</strong> wheat br<strong>and</strong> (15%); NS-Sd: willow sawdust; S-Sd: willow sawdust supplemented with soybean flour (5%) <strong>and</strong> wheat br<strong>and</strong><br />
(15%); Tr, trace.<br />
small number <strong>and</strong> amounts of aldehydes could be the<br />
rapid oxidation by different oxidising fungal enzyme<br />
systems, as they have particularly been reported for<br />
white rot fungi (Abraham & Berger, 1994).<br />
An odd-long-chain fatty acid, identified as the pentadecanoic<br />
acid, was detected in trace amounts as well as<br />
its methyl ester. Both were previously reported for<br />
P. sulfurous by Wu et al. (2005) <strong>and</strong> the relevance of this<br />
finding resides in the rarity of their occurrence in nature.<br />
The role of fatty acids in the aroma of microorganisms,<br />
plants <strong>and</strong> animal products is well known. Not only do<br />
International Journal of Food Science <strong>and</strong> Technology 2010 Ó 2010 The Authors. Journal compilation Ó 2010 Institute of Food Science <strong>and</strong> Technology
they contribute to the odour by themselves but also act<br />
as flavour precursors under enzymatic oxidation, decarboxylation<br />
or esterification reactions. Therefore, fatty<br />
acid profiles <strong>and</strong> their variations in fungi are important<br />
factors in the synthesis <strong>and</strong> transformation of volatile<br />
compounds (Wu et al., 2005). Several authors have<br />
stated that the profile of compounds compromising<br />
fungal aroma varies according to species, varieties,<br />
grade <strong>and</strong> mushroom tissues (pileus ⁄ stipe) (Wu et al.,<br />
2005; Cho et al., 2007, 2008). The profile of volatile<br />
compounds can also be influenced by substrate composition.<br />
Shashirekha et al. (2005) reported a 35% increase<br />
in total lipids of samples grown on supplemented<br />
substrates, with the linoleic acid (C8 volatile precursor)<br />
as the predominant unsaturated fatty acid.<br />
Data on volatile composition represents an important<br />
contribution to the chemosystematic approach. Callac &<br />
Guinberteau (2005) measured the relative amounts of<br />
volatile benzoic <strong>and</strong> C8 volatile compounds of several<br />
species of Agaricus <strong>and</strong> were able to identify a relationship<br />
between ratio <strong>and</strong> phylogenetic closeness, indicating<br />
a potential importance of volatile chemicals as<br />
taxonomic marker. Also, a profile of the major volatile<br />
enables the development of biotechnological strategies<br />
to obtain compounds of interest at industrial scale by<br />
adding precursors to the culture media in optimised<br />
conditions. Such an application was carried out by Liu<br />
et al. (2004) who incremented the content of 1-octen-<br />
3-ol in fresh grounded A. bisporus samples cultured on a<br />
hydrolysed soybean media <strong>and</strong>, after several extractionconcentration<br />
steps, microencapsulated the achieved<br />
aroma by means of a aspersion drying technique,<br />
obtaining a suitable product for the food industry.<br />
Our results reveal a wide volatile compound spectrum<br />
for P. tenuiculus, which could be of technological<br />
interest for ‘‘natural’’ fungal aroma production. Among<br />
these, the most abundant compounds were 1-octen-3-ol,<br />
3-octanol, 1-octanol, <strong>and</strong> 3-octanone, allowing us to<br />
conclude that their contribution to the aroma is the<br />
most important.<br />
Nutritional components of Polyporus tenuiculus<br />
Table 3 shows moisture content, protein, fibre, ash,<br />
crude fat <strong>and</strong> soluble carbohydrates (compounds without<br />
nitrogen) contents of P. tenuiculus fruiting bodies<br />
harvested from the different lignocellulose substrates:<br />
nonsupplemented <strong>and</strong> supplemented wheat straw<br />
(NS-Wt <strong>and</strong> S-Wt) <strong>and</strong> sawdust culture media (NS-Sd<br />
<strong>and</strong> S-Sd).<br />
Moisture content was not significantly different<br />
among fruiting bodies harvested from all substrates <strong>and</strong><br />
their average, around 90%, was consistent with the typical<br />
high water content of these products (Breene, 1990).<br />
Similar moisture content (85.2–93.5%) was reported for<br />
Pleurotus ostreatus, P. eryngii, P. pulmonarius, P. florida,<br />
Volatile composition <strong>and</strong> nutritional quality of Polyporus tenuiculus A. Omarini et al. 1607<br />
Table 3 Proximal composition of the fruiting bodies of Polyporus<br />
tenuiculus harvested from the different lignocellulose substrate (dry<br />
weight basis)<br />
Components (%)<br />
Substrates*<br />
Ash 5.7 ± 0.2 a<br />
Crude fat 8.6 ± 0.1 c<br />
Crude Protein 15.5 ± 0.3 a<br />
Carbohydrates 47.2 ± 0.9 a<br />
Crude fibre 12.1 ± 0.2 c<br />
Moisture 89.1 ± 0.7 a<br />
NS-Wt S-Wt NS-Sd S-Sd<br />
6.6 ± 1.1 b<br />
5.2 ± 0.1 a<br />
22.5 ± 0.6 b<br />
48.2 ± 1.0 a<br />
7.5 ± 0.4 a<br />
90.0 ± 0.2 a<br />
6.5 ± 0.2 b<br />
9.2 ± 0.2 d<br />
15.1 ± 0.2 a<br />
51.6 ± 0.7 c<br />
7.6 ± 0.2 a<br />
89.9 ± 0.3 a<br />
6.6 ± 0.1 b<br />
5.7 ± 0.4 b<br />
22.0 ± 0.3 b<br />
48.2 ± 0.2 a<br />
8.3 ± 0.4 b<br />
90.8 ± 0.1 a<br />
*Values (average of three replicates) express as percentage. In each file<br />
different letters indicate significant differences (P < 0.05). Protein:<br />
N · 4.38. NS-Wt, wheat straw; S-Wt, wheat straw supplemented with<br />
soybean flour (5%) <strong>and</strong> wheat br<strong>and</strong> (15%); NS-Sd, willow sawdust; S-<br />
Sd, willow sawdust supplemented with soybean flour (5%) <strong>and</strong> wheat<br />
br<strong>and</strong> (15%).<br />
P. sajor-caju <strong>and</strong> Lentinula edodes, none of them having<br />
found differences among different growth substrates<br />
(Manzi et al., 1999; Bonatti et al., 2004; Ponmurugan<br />
et al., 2007). This variable is exclusively dependent on the<br />
fungal species <strong>and</strong> on the temperature <strong>and</strong> relative<br />
humidity conditions during growth (Bano & Rajarathnam,<br />
1988).<br />
Differences in ash content among samples from<br />
different substrates were found lower levels of whose<br />
harvested from nonsupplemented wheat straw media<br />
(NS-Wt) (5.7%; P < 0.05). Similar results were<br />
reported by Bonatti et al. (2004) for P. ostreatus <strong>and</strong><br />
P. sajor-caju´. It is important to point out that N2-rich<br />
substrates (S-Wt <strong>and</strong> S-Sd) positively condition ash<br />
content, inducing its increase <strong>and</strong> thus enhancing<br />
mineral bioavailability in human diet associated with<br />
edible fungi consumption (Silva et al., 2007). Still,<br />
higher values (by a factor of 0.3) have been reported<br />
in literature for P. ostreatus grown on wheat straw<br />
supplemented with beetroot (Manzi et al., 1999).<br />
Protein content was estimated as total nitrogen corrected<br />
by a conversion factor of 4.38% (Breene, 1990).<br />
Results varied within a range of 15.1–22.5% (Table 3),<br />
with higher percentages on fruiting bodies harvested from<br />
supplemented substrates, S-Wt <strong>and</strong> S-Sd (P < 0.05).<br />
These values are within the ranges informed for P. ostreatus,<br />
P. sajor caju´ <strong>and</strong> L. edodes, although a great<br />
variability of protein content is observed among species<br />
<strong>and</strong> strains (Manzi et al., 1999; Bonatti et al., 2004).<br />
Higher protein content was obtained for fruiting bodies<br />
grown on N 2-rich substrates (S-Wt <strong>and</strong> S-Sd), indicating<br />
that the nutritional value of mushrooms is compromised<br />
by substrate composition. Probably the fungus used the<br />
N 2 available in the substrate to produce larger amounts<br />
of protein. The same effect was observed in species of<br />
the genus Pleurotus showing varied nutritional values<br />
Ó 2010 The Authors. Journal compilation Ó 2010 Institute of Food Science <strong>and</strong> Technology International Journal of Food Science <strong>and</strong> Technology 2010
1608<br />
Volatile composition <strong>and</strong> nutritional quality of Polyporus tenuiculus A. Omarini et al.<br />
according to strain, growth substrate <strong>and</strong> fruiting body<br />
stage of development (Shashirekha et al., 2005; Valencia<br />
del Toro et al., 2006; Silva et al., 2007;).<br />
Crude fat content increased when nonsupplemented<br />
substrates were used, the highest values were obtained for<br />
mushrooms harvested from sawdust (P < 0.05). Apparently,<br />
the supplements provided nutrients that stimulated<br />
the fungus to produce less crude compounds but more<br />
protein content. In the case of supplemented substrates,<br />
sawdust also afforded fat-richer mushrooms than those<br />
grown on wheat straw (P < 0.05). The levels of P. tenuiculus<br />
fat components were higher than those obtained<br />
with Agrocybe cylindracea (Uhart et al., 2008) but similar<br />
to those reported for P. ostreatus <strong>and</strong> P. sajor caju,<br />
which have also shown substrate-dependent fat content<br />
variation (Ortega et al.,1993; Bonatti et al., 2004).<br />
The highest <strong>and</strong> lowest values of soluble carbohydrates<br />
were obtained for mushrooms grown on nonsupplemented<br />
sawdust (NS-Sd) <strong>and</strong> wheat straw (NS-Ws)<br />
substrates, respectively (P < 0.05). Similar data have<br />
been reported by other authors for several species of the<br />
genus Pleurotus grown on different agro-industrial<br />
wastes, in the range of 42.8–47.7% (Patrabansh &<br />
Madan, 1997; Ragunathan & Swaminathan, 2003).<br />
As to fibre content, the highest values were obtained<br />
for mushrooms harvested from nonsupplemented wheat<br />
straw substrate (P < 0.05). Addition of supplements to<br />
substrate led to opposite effects on fibre content<br />
depending on the substrate used, resulting in higher<br />
values for sawdust <strong>and</strong> lower values in the case of wheat<br />
straw (P < 0.05).This behaviour can be ascribed to<br />
differences of wheat <strong>and</strong> sawdust composition. Fibre<br />
percentages of P. tenuiculus were lower to those<br />
described for P. ostreatus grown on wheat straw, which<br />
is in the range of 20.0–34.8% (Justo et al., 1999). On the<br />
other h<strong>and</strong>, similar fibre percentages have been reported<br />
for other species of the genus Pleurotus grown on<br />
different agro-industrial residues (7.6–18.0%) (Patrabansh<br />
& Madan, 1997; Bonatti et al., 2004; Valencia del<br />
Toro et al., 2006).<br />
When compared to other highly consumed species like<br />
A. bisporus, L. edodes <strong>and</strong> P. ostreatus, the nutritional<br />
feature of P. tenuiculus which outst<strong>and</strong>s is fibre content,<br />
by a factor of 2.5, approximately. Protein content,<br />
although lower than that of A. bisporus, has shown to be<br />
similar to that of L. edodes <strong>and</strong> P. ostreatus (Buswell &<br />
Chang, 1993), pointing to P. tenuiculus as a valuable<br />
specie for human consumption.<br />
Conclusions<br />
Our results reveal a wide volatile compound spectrum<br />
for P. tenuiculus where thirty-nine volatile compounds<br />
were detected. Among these, the most abundant<br />
compounds were 1-octen-3-ol, 3-octanol, 1-octanol,<br />
<strong>and</strong> 3-octanone, allowing us to conclude that their<br />
contribution to the aroma is the most important. The<br />
main volatile compound in all samples was 1-octen-3-ol,<br />
with increasing levels in mushrooms cropped on supplemented<br />
substrate. In addition, several precursors of<br />
this alcohol were identified in lower percentages.<br />
An overall view shows that, in the case of P. tenuiculus,<br />
supplemented substrates (S-Wt <strong>and</strong> S-Sd) promote<br />
protein-rich, fat-poor <strong>and</strong> carbohydrate-poor<br />
fruiting bodies, compared to those grown on nonsupplemented<br />
substrates. Also, a comparative examination<br />
of fat <strong>and</strong> protein levels obtained for supplemented<br />
substrates shows that a decrease in the former is<br />
associated with an increase in the latter. This correlation<br />
had been previously reported by Silva et al. (2007) for<br />
P. sajor caju´ grown on different N 2-rich substrates. On<br />
the other h<strong>and</strong>, fibre <strong>and</strong> ash content varied according<br />
to substrate type rather than according to supplements<br />
(Wt <strong>and</strong> Sd). According to Sturion & Oetterer (1995),<br />
fungi nutritional value can be greatly affected by its<br />
growth substrate, as supported by our results.<br />
Compared to other edible fungi, P. tenuiculus high<br />
fibre <strong>and</strong> protein contents point to this species as a<br />
healthy nutritional alternative of interest for the food<br />
industry or for biotechnological applications such as the<br />
production of ‘‘non artificial’’ mushroom flavour.<br />
Acknowledgments<br />
This work was partially supported by the research<br />
project PIP 5516 from National Research Council<br />
(CONICET, Argentina).<br />
References<br />
Abraham, B.G. & Berger, R. (1994). Higher fungi for generating<br />
aroma components through novel biotechnologies. Journal of<br />
Agricultural <strong>and</strong> Food Chemistry, 42, 2344–2348.<br />
AOAC (1990). Official methods of the Association of Official Analytical<br />
Chemists, 15th edn. Arlington, VA, USA: Association of Official<br />
Analytical Chemists.<br />
Bano, Z. & Rajarathnam, S. (1988). Pleurotus mushrooms. Part ii,<br />
nutritional value, post-harvest physiology, preservation <strong>and</strong> role as<br />
human food. CRC Critical Reviews in Food Science <strong>and</strong> Nutrition,<br />
27, 87–158.<br />
Bonatti, M., Karnopp, P., Soares, H.M. & Furlan, S.A. (2004).<br />
Evaluation of Pleurotus ostreatus <strong>and</strong> Pleurotus sajor-caju nutritional<br />
characteristics when cultivated in different lignocellulosic<br />
wastes. Food Chemistry, 88, 425–428.<br />
Breene, W.M. (1990). Nutritional <strong>and</strong> medicinal value of specialty<br />
mushrooms. Journal of Food Protection, 53, 883–894.<br />
Buswell, J.A. & Chang, S.T. (1993). Edible Mushrooms: attributes <strong>and</strong><br />
applications. In: Genetics <strong>and</strong> Breeding of Edible Mushroom (edited<br />
by S.T. Chang, J.A. Buswell & P.G. Miles). Pp. 297–306. Amsterdam:<br />
Gordon & Breach Science Publishers.<br />
C¸ ag˘ larırmak, N. (2007). The nutrients of exotic mushrooms (Lentinula<br />
edodes <strong>and</strong> Pleurotus ostreatus species) <strong>and</strong> an estimated approach<br />
to the volatile compounds. Food Chemistry, 105, 1188–1194.<br />
Callac, P. & Guinberteau, J. (2005). Morphological <strong>and</strong> molecular<br />
characterization of two novel species of Agaricus section xanthodermatei.<br />
Mycologia, 97, 416–424.<br />
International Journal of Food Science <strong>and</strong> Technology 2010 Ó 2010 The Authors. Journal compilation Ó 2010 Institute of Food Science <strong>and</strong> Technology
Chen, C.C. & Wu, C.M. (1984). Studies on the Enzymic Reduction of<br />
1-Octen-3-one in Mushroom (Agaricus bisporus). Journal of Agricultural<br />
<strong>and</strong> Food Chemistry, 32, 1342–1344.<br />
Chiron, N. & Michelot, D. (2005). Odeurs des champignons: chimic et<br />
roles dans les interactions biotiques- une revue. Cryptogamie<br />
Mycologie, 26, 299–364.<br />
Cho, I.N., Lee, S.M., Kim, S.Y. & Chol, H.K. (2007). Differentiation<br />
of aroma characteristics of pine-mushrooms (Tricholoma matsutake<br />
Sing.) of different grade using gas chromatography-olfactometry<br />
<strong>and</strong> sensory analysis. Journal of Agricultural <strong>and</strong> Food Chemistry, 55,<br />
2323–2328.<br />
Cho, I.H., Namgung, H.J., Choi, H.K. & Kim, Y.S. (2008). Volatiles<br />
<strong>and</strong> key odorants in the pileus <strong>and</strong> stipe of pine-mushroom<br />
(Tricholoma matsutake Sing.). Food Chemistry, 106, 71–76.<br />
Combet, E., Henderson, J., Eastwood, D.C. & Burton, K. (2006).<br />
Review: eight-carbon volatiles in mushrooms <strong>and</strong> fungi: properties,<br />
analysis <strong>and</strong> biosynthesis. Mycoscience, 47, 317–326.<br />
Guedes de Pinho, P., Ribeiro, B., Gonçalves, R.F. et al. (2008).<br />
Correlation between the pattern volatiles <strong>and</strong> the overall aroma of<br />
wild edible mushrooms. Journal of Agricultural <strong>and</strong> Food Chemistry,<br />
56, 1704–1712.<br />
Justo, M.B., Guzmán, G.A., Mejía, E.G., Díaz, C.L.G., Martinez, G.<br />
& Corona, E.B. (1999). Calidad proteínica de tres cepas mexicanas<br />
de setas (Pleurotus ostreatus). Archivos Latinoamericanos de Nutricio´n,<br />
49, 81–85.<br />
Liu, Z., Zhou, J.H., Zeng, Y.L. & Ouyang, X.L. (2004). The<br />
enhancement <strong>and</strong> encapsulation of Agaricus bisporus flavour.<br />
Journal of Food Engineering, 65, 391–396.<br />
Manzi, P., Gambelli, L., Marconi, S., Vivanti, V. & Pizzoferrato,<br />
L. (1999). Nutrients in edible mushrooms an inter-species comparative<br />
study. Food Chemistry, 65, 477–482.<br />
Omarini, A., Lechner, B.E. & Alberto´ , E. (2009). Polyporus tenuiculus:<br />
a new naturally occurring mushroom that can be industrially<br />
cultivated on agricultural waste. Journal of Industrial Microbiology<br />
& Biotechnology, 36, 635–642.<br />
Omarini, A., Nepote, V., Grosso, N., Zygadlo, J. & Albertó, E. (2010).<br />
Analysis <strong>and</strong> fruiting bodies characterization of the edible mushrooms<br />
Pleurotus ostreatus <strong>and</strong> Polyporus tenuiculus obtained on leaf<br />
waste from the essential oil production industry. International<br />
Journal of Food Science <strong>and</strong> Technology, 45, 466–474.<br />
Ortega, G.M., Martinez, E.O., Betancourt, D., Gonzalez, A.E. &<br />
Otero, M.A. (1993). Enzyme activities <strong>and</strong> substrate degradation<br />
Volatile composition <strong>and</strong> nutritional quality of Polyporus tenuiculus A. Omarini et al. 1609<br />
during white rot fungi growth on sugar-cane straw in a solid state<br />
fermentation. World Journal of Microbiology <strong>and</strong> Biotechnology, 9,<br />
210–212.<br />
Ouzouni, P.K., Koller, W.-D., Badeka, A.V. & Riganakos, K.A.<br />
(2009). Volatile compounds from the fruiting bodies of three<br />
Hygrophorus mushroom species from Northern Greece. International<br />
Journal of Food Science <strong>and</strong> Technology, 44, 854–859.<br />
Patrabansh, S. & Madan, M. (1997). Studies on cultivation, biological<br />
efficiency <strong>and</strong> chemical analysis of Pleurotus sajor-caju (FR.) Singer<br />
on different bio-wastes. Acta Biotechnology, 17, 107–122.<br />
Ponmurugan, P., SeKhar, Y.N. & Sreesakthi, T.R. (2007). Effect of<br />
various substrates on the growth <strong>and</strong> quality of mushrooms.<br />
Pakistan Journal of Biological Science, 10, 171–173.<br />
Ragunathan, R. & Swaminathan, K. (2003). Nutritional status of<br />
Pleurotus spp. grown on various agro-wastes. Food Chemistry, 80,<br />
371–375.<br />
Rösecke, J., Pietsch, M. & Ko¨ nig, W.A. (2000). Volatile constituents of<br />
wood-rotting basidiomycetes. Phytochemistry, 54, 747–750.<br />
Shashirekha, M.N, Rajarathnam, S. & Bano, Z. (2005). Effects of<br />
supplementing rice straw growth substrate with cotton seeds on the<br />
analytical characteristics of the mushroom, Pleurotus florida (Block<br />
& Tsao). Food Chemistry, 92, 255–259.<br />
Silva, G.E., Souza Díaz, E., Siqueira, F.G. & Schwan, R.F. (2007).<br />
Chemical analysis of fructification bodies of Pleurotus sajor-caju<br />
cultivated in several nitrogen concentrations. Cieˆncia e Tecnolgia de<br />
Alimentos, 27, 72–75.<br />
Stamets, P.S. (1993). Growing Gourmet <strong>and</strong> Medicinal Mushrooms. Pp.<br />
554. Berkeley, USA: Ten Speed Press.<br />
Sturion, G.L. & Oetterer, M. (1995). Composição química de<br />
cogumelos comestíveis (Pleurotus spp.) originados de cultivos em<br />
diferentes substratos. Cieˆncia e Tecnolgia de Alimentos, 15, 189–193.<br />
Uhart, M., Piscera, J.M. & Alberto´ , E. (2008). Utilization of new<br />
naturally occurring strains <strong>and</strong> supplementation to improve the<br />
biological efficiency of the edible mushroom Agrocybe cylindracea.<br />
Journal of Industrial Microbiology <strong>and</strong> Biotechnology, 35, 595–602.<br />
Valencia del Toro, G., Castelán Vega, R., Garín-Aguilar, M.E. & Leal<br />
Lara, H. (2006). Biological quality of proteins from three strains of<br />
Pleurotus spp. Food Chemistry, 94, 494–497.<br />
Wu, S., Zorn, H., Krings, U. & Berger, R. (2005). Characteristic<br />
volatile from young <strong>and</strong> aged fruiting bodies of wild Polyporus<br />
sulfureus (Bull.: FR.) Fr. Journal of Agricultural <strong>and</strong> Food Chemistry,<br />
53, 4524–4528.<br />
Ó 2010 The Authors. Journal compilation Ó 2010 Institute of Food Science <strong>and</strong> Technology International Journal of Food Science <strong>and</strong> Technology 2010
1610<br />
Original article<br />
Use of HR-NMR to classify propolis obtained using different<br />
harvesting methods<br />
Giulia Papotti, 1 Davide Bertelli, 1 * Maria Plessi 1 & Maria Cecilia Rossi 2<br />
1 Dipartimento di Scienze Farmaceutiche, Università di Modena e Reggio Emilia, via Campi 183, 41100 Modena, Italy<br />
2 Centro Interdipartimentale Gr<strong>and</strong>i Strumenti, Università degli Studi di Modena e Reggio Emilia, via Campi 213 ⁄ A, 41100 Modena, Italy<br />
(Received 2 February 2010; Accepted in revised form 4 May 2010)<br />
Summary Propolis has various biological activities closely related to the composition which varies according to<br />
environmental factors <strong>and</strong> also to the method of production. This study was aimed at determining whether<br />
or not HR-NMR <strong>and</strong> multivariate statistical analysis were able to classify propolis according to the method<br />
used to harvest it. Sixty propolis samples were analysed in all. The ethanolic propolis extracts were initially<br />
analysed for quantification of the main bioactive substances, balsams <strong>and</strong> waxes. The 1 H NMR <strong>and</strong><br />
heteronuclear multiple bond correlation spectra were then acquired. Spectral data were analysed by the<br />
application of multivariate statistical techniques (Factor Analysis <strong>and</strong> General Discriminant Analysis).<br />
The best results were obtained using the 1 H NMR which furnishes a sufficiently effective model by analysing<br />
the spectral region between 4.50 <strong>and</strong> 13.00 ppm (predictive capacity: 96.7%).<br />
Keywords Chemical fingerprint, chemometrics, harvesting methods, NMR, propolis.<br />
Introduction<br />
Propolis or bee glue is a product based on resins<br />
collected by bees from plant exudates <strong>and</strong> contains more<br />
than 160 constituents. The propolis is used to defend the<br />
beehive from the intruders, to prevent decomposition of<br />
animals killed after invading the colony <strong>and</strong> for the<br />
thermal isolation (Greenaway et al., 1990). It is characterised<br />
by a mean content of 50% balsams <strong>and</strong> resins,<br />
30% waxes, 10% essential <strong>and</strong> aromatic oils, 5% pollen,<br />
5% various other substances <strong>and</strong> usually contains a<br />
variety of chemical compounds, such as polyphenols<br />
(flavonoids, phenolic acids <strong>and</strong> their esters), terpenoids,<br />
steroids <strong>and</strong> amino acids. Flavonoids are thought to be<br />
responsible for many of its biological <strong>and</strong> pharmacological<br />
activities including anticancer (Matsuno, 1995),<br />
anti-inflammatory (Wang et al., 1993), antimicrobial<br />
(Kujumgiev et al., 1999) <strong>and</strong> antioxidant effects (Nieva<br />
Moreno et al., 2000). It is generally accepted <strong>and</strong><br />
demonstrated that in temperate zones, including Europe,<br />
Asia <strong>and</strong> North America, the bud exudates of<br />
Populus species are the main source of propolis (Nagy<br />
et al., 1986; Greenaway et al., 1987); indeed this is the<br />
main propolis type also in Italy <strong>and</strong> in particular in the<br />
limited geographic area from which the samples of this<br />
*Correspondent: Fax: +39 059 2055131;<br />
e-mail: davide.bertelli@unimore.it<br />
International Journal of Food Science <strong>and</strong> Technology 2010, 45, 1610–1618<br />
study derive, where the Populus species are the dominant<br />
ones. The poplar propolis can be characterised by its<br />
content of bioactive components. In 2007, Popova et al.<br />
suggested the following minimum contents for the<br />
poplar propolis, which could be used for st<strong>and</strong>ardisation<br />
<strong>and</strong> quality control: balsam 45%, total phenolics (TP)<br />
21%, total flavones <strong>and</strong> flavonols (TFF) 4%, total<br />
flavanones <strong>and</strong> dihydroflavonols (TFD) 4%. Smell,<br />
colour, constitution, <strong>and</strong> composition of propolis vary<br />
according to not only the different botanical sources,<br />
but also the geographical origin <strong>and</strong> the climatic<br />
conditions (Bankova et al., 2002). Besides, also the<br />
method of harvest can effect composition (Rossi, 2006;<br />
Ramanauskiene et al., 2008) <strong>and</strong> properties of propolis.<br />
Sales et al. (2006) <strong>and</strong> Bedascarrasbure et al. (2004)<br />
reported the effect of the method of harvest on the lead<br />
propolis content caused by the metal chelating capacity<br />
of flavonoids, <strong>and</strong> it can be concluded that the harvesting<br />
methods employed for gathering propolis cause<br />
chemical composition to vary. The influence of the<br />
harvesting method on composition <strong>and</strong> properties of<br />
propolis seems to be related to the recognised behaviour<br />
of the bees that cover the smooth <strong>and</strong> narrow surfaces,<br />
as the thin space created by the wedges, with propolis<br />
that is purer <strong>and</strong> richer in balsams <strong>and</strong> therefore in<br />
bioactive compounds such as flavonoids, whereas they<br />
use the propolis mixed with major amount of waxes to<br />
cover the largest <strong>and</strong> irregular surfaces of the beehive or<br />
doi:10.1111/j.1365-2621.2010.02310.x<br />
Ó 2010 The Authors. Journal compilation Ó 2010 Institute of Food Science <strong>and</strong> Technology
the propolis mat used for the production (Alı` et al.,<br />
1997). The amount of balsams is an important characteristic<br />
because high percentage of balsams means the<br />
propolis contained a low percentage of wax <strong>and</strong><br />
insoluble matter <strong>and</strong> a higher content of biologically<br />
active components (Kujumgiev et al., 1999). In Italy, the<br />
propolis is commonly harvested using one of the<br />
following three methods: (i) the scraping, which consists<br />
in scraping the inner surface of the beehive including the<br />
frames holding the wax combs; (ii) the wooden wedges,<br />
which is obtained through scraping propolis deposed by<br />
bees to close the space created by thin wooden wedges<br />
(3–5 mm thick) interposed between the super <strong>and</strong> the<br />
cover of the hive to maintain the microenvironment;<br />
(iii) the propolis mat, in which the beekeeper scrapes the<br />
plastic mesh placed between the super <strong>and</strong> the cover of<br />
the hive. The propolis has been used since the ancient<br />
time; however, it has recently achieved more popularity<br />
as it is widely used in drinks <strong>and</strong> foods to improve the<br />
health <strong>and</strong> prevent diseases (Banskota et al., 2001).<br />
Considering the widespread use of propolis <strong>and</strong> the<br />
increased interest on the propolis characterisation, this<br />
study was conducted to evaluate whether the highresolution<br />
nuclear magnetic resonance (HR-NMR) used<br />
as chemical fingerprint analysis coupled with multivariate<br />
statistical methods is able to classify poplar propolis<br />
samples according to the method of harvest. In this<br />
regard, sixty raw propolis, collected with different<br />
methods, were extracted with ethanol <strong>and</strong>, before<br />
performing the NMR experiments, were analysed for<br />
quantification of the three main groups of bioactive<br />
substances (TP, TFF, TFD), balsams <strong>and</strong> waxes to<br />
confirm the poplar source.<br />
In recent years, the use of much higher magnetic fields<br />
<strong>and</strong> the greater sensitivity that they bring have stimulated<br />
interest in one-dimensional (1D) <strong>and</strong> bidimensional<br />
(2D) NMR spectroscopy as a routine method for the<br />
analysis of complex mixtures (Fan, 1996; Charlton<br />
et al., 2002). In general, there have been several applications<br />
of NMR spectroscopy to propolis analysis<br />
(Watson et al., 2006; Cuesta-Rubio et al., 2007;<br />
Kumazawa et al., 2007); however the 1D <strong>and</strong> 2D<br />
NMR, to our knowledge, have never been previously<br />
applied to propolis in effort to classify samples according<br />
to the method of harvest.<br />
Material <strong>and</strong> methods<br />
Chemicals <strong>and</strong> apparatus<br />
All reagents, solvents (analytical grade) <strong>and</strong> st<strong>and</strong>ard<br />
compounds (caffeic <strong>and</strong> ferulic acids, apigenin, chrysin,<br />
galangin, kaempferol, pinocembrin, pinostrobin <strong>and</strong><br />
quercetin) were purchased from Fluka (Buchs, Switzerl<strong>and</strong>).<br />
Dinitrophenylhydrazine reagent was prepared by<br />
dissolving 1 g of 2,4-dinitrophenylhydrazine (2,4-D) in<br />
Classification of different propolis by HR-NMR G. Papotti et al. 1611<br />
2 mL of 96% sulphuric acid <strong>and</strong> then diluting to<br />
100 mL with methanol. The absorbances were measured<br />
with a Varian Cary 50 Bio UV-Visible spectrometer<br />
(Torino, Italy). Wilmad NMR tube, 5 mm, Ultra-<br />
Imperial grade, 7 in. L, 526-PP were purchased from<br />
Sigma-Aldrich (Milan, Italy). One-dimensional <strong>and</strong><br />
bidimensional NMR spectra were acquired with a<br />
Bruker FT-NMR Avance 400 spectrometer (Ettlingen,<br />
Germany).<br />
Propolis samples<br />
To reduce the influence of the geographical origin, the<br />
botanical source <strong>and</strong> the climatic variability on the<br />
propolis composition, all the samples were provided by<br />
several local beekeepers <strong>and</strong> by CRA-API (Consiglio<br />
per la Ricerca e la Sperimentazione in Agricoltura-<br />
Istituto Nazionale di Apicoltura e Bachicoltura) (Bologna,<br />
Italy) in the early summer of 2007 <strong>and</strong> were<br />
obtained from colonies located in a restricted area of<br />
the Emilia Romagna in which it is known that bees<br />
produce propolis mainly from poplar exudates. Sixty<br />
samples were supplied in all: seventeen obtained by<br />
scraping, twenty-six obtained by wooden wedges <strong>and</strong><br />
seventeen obtained by propolis mat. For each sample,<br />
about 50 g was furnished. Because the sampling<br />
conditions ensured minimal influence from environmental<br />
factors on the propolis composition, all the<br />
samples were considered individually. All the analyses<br />
were carried out in triplicate, <strong>and</strong> the results are<br />
reported as mean ± SD.<br />
Propolis extraction<br />
Ethanol was used because it is the extraction solvent for<br />
the most common commercial propolis products. Each<br />
propolis sample was frozen, chopped into small pieces<br />
<strong>and</strong> homogenised, <strong>and</strong> from this bulk material, 1 g<br />
propolis, exactly weighed, was extracted with 10 mL of<br />
solvent with continuous stirring at room temperature<br />
(twice after 24 h). Each extract was filtered into a<br />
volumetric flask, <strong>and</strong> the volume made up to 25 mL<br />
with ethanol.<br />
Total phenolics content<br />
Total phenolics were estimated by the Folin-Ciocalteau<br />
method properly modified (Singleton et al., 1999).<br />
A volume of 50 lL of extract diluted 1:50 (v ⁄ v) in<br />
ethanol was mixed with 2.5 mL of the Folin-Ciocalteau<br />
reagent 1:10 (v ⁄ v) <strong>and</strong> 2.0 mL of Na 2CO 3 hot saturated<br />
solution. Absorbance was measured at 760 nm after<br />
5-min incubation at 50 °C. Gallic acid was used for the<br />
calibration curve (20–800 lg mL )1 ). TP were expressed<br />
as milligram gallic acid equivalents per gram of propolis<br />
(GAEs g )1 ).<br />
Ó 2010 The Authors. Journal compilation Ó 2010 Institute of Food Science <strong>and</strong> Technology International Journal of Food Science <strong>and</strong> Technology 2010
1612<br />
Classification of different propolis by HR-NMR G. Papotti et al.<br />
Total flavones <strong>and</strong> flavonols content<br />
The procedure described by Woisky & Salatino (1998)<br />
was employed. For the calibration, quercetin st<strong>and</strong>ard<br />
solutions in 80% ethanol (25, 50, 100 <strong>and</strong> 200 lg mL )1 )<br />
were used. The st<strong>and</strong>ard solutions (0.5 mL) were mixed<br />
with 1.5 mL of 95% ethanol, 0.1 mL of 10% AlCl3 in<br />
water (w ⁄ v), 0.1 mL of 1 m potassium acetate <strong>and</strong><br />
2.8 mL of 80% ethanol. After incubation at 20 °C for<br />
30 min, the absorbance was measured at 425 nm. The<br />
amount of 10% AlCl3 was substituted by distilled water<br />
in blank. Similarly, 0.5 mL of each extract diluted 1:50<br />
(v ⁄ v) in 80% ethanol was reacted with AlCl3 as<br />
described earlier. The results were expressed as mg g )1<br />
propolis.<br />
Total flavanones <strong>and</strong> dihydroflavonols content<br />
The method described by Nagy & Grancai (1996) was<br />
used, with minor modifications. Four st<strong>and</strong>ard solutions<br />
of pinocembrin in methanol (200, 500, 1000 <strong>and</strong><br />
1500 lg mL )1 ) were used for the calibration. One<br />
millilitre of these solutions was separately reacted with<br />
2 mL of 2,4-D reagent <strong>and</strong> 2 mL of methanol at 50 °C<br />
for 50 min. After cooling, the reaction mixture was<br />
mixed with 5 mL of 10% KOH in 70% methanol (w ⁄ v)<br />
<strong>and</strong> incubated at 20 °C for 2 min. Then, the mixture was<br />
mixed with 5 mL of methanol <strong>and</strong> centrifuged at<br />
671 · g for 5 min. The supernatant was collected <strong>and</strong><br />
adjusted to 25 mL, <strong>and</strong> the absorbance was measured at<br />
495 nm. A blank solution with 1 mL of methanol<br />
instead of the pinocembrin was used in an analogous<br />
procedure. The extracts were reacted with 2,4-D as<br />
described earlier. A blank sample solution with 2 mL of<br />
methanol instead of 2,4-D reagent was used. The results<br />
were expressed as mg g )1 propolis.<br />
Balsams <strong>and</strong> waxes contents<br />
The method described by Popova et al. was used for<br />
balsams (2007). Two millilitres of each extract was<br />
evaporated under vacuum until constant weight, <strong>and</strong> the<br />
percentages of balsam in the extracts were therefore<br />
calculated as the ethanol soluble fraction.<br />
Waxes were estimated using the method described by<br />
Woisky & Salatino (1998). Each row propolis sample<br />
was extracted with petroleum ether at 40–60 °C, <strong>and</strong><br />
after evaporation, the residue was heated under reflux<br />
with ethanol until clear solution was obtained. After<br />
cooling, the solid waxes were filtered <strong>and</strong> weighed. The<br />
results were expressed as mg g )1 propolis.<br />
Sample preparation for spectroscopic analysis<br />
To prepare NMR samples, 1 mL of each extract was<br />
transferred to a NMR tube <strong>and</strong> evaporated to dryness at<br />
room temperature under nitrogen flow. The residue was<br />
dissolved in 0.5 mL of methyl sulphoxide-d 6 (DMSOd6),<br />
selected for its high solvent capacity, <strong>and</strong> 20 lL of<br />
tetramethylsilane (TMS) was added as reference compound.<br />
Each sample was immediately analysed <strong>and</strong> used<br />
for both 1D <strong>and</strong> 2D NMR experiments. Also st<strong>and</strong>ard<br />
samples, prepared by dissolving 15 mg in 0.5 mL of<br />
DMSO-d6 <strong>and</strong> adding 20 lL of TMS as reference<br />
compound, were analysed.<br />
NMR experiments<br />
To obtain comparable spectra, the propolis <strong>and</strong> st<strong>and</strong>ard<br />
samples were analysed using the same acquisition<br />
parameters. All experiments were performed at 300 K.<br />
The 1 H NMR spectra were measured at 400.13 MHz.<br />
Time domain (number of data points) was 16K, the<br />
acquisition time 1.3665 s, the delay time 1.0 s, <strong>and</strong> the<br />
numbers of scans 256. Spectral width was 5995.204 Hz.<br />
Total acquisition time was 10 min 19 s. The 1 H- 13 C<br />
heteronuclear multiple bond correlation (HMBC) spectra<br />
are a 2D 1 H ⁄ 13 C correlation via heteronuclear zero<br />
<strong>and</strong> double-quantum coherence optimised on longrange<br />
couplings with low-pass j-filter to suppress one-bond<br />
correlations, no decoupling during acquisition, <strong>and</strong><br />
gradient pulses for selection. The acquisition parameters<br />
were as follows: number of scans, 32; dummy scans,<br />
16; time domain (number of data points), 3K in F2 ( 1 H)<br />
<strong>and</strong> 100 in F1 ( 13 C); spectral width, 5592.841 Hz in F2<br />
( 1 H) <strong>and</strong> 20124.465 Hz in F1 ( 13 C); digital resolution,<br />
1.8206 Hz in F2 ( 1 H) <strong>and</strong> 201.207 Hz in F1 ( 13 C);<br />
acquisition time, 0.2747 s; delay time, 0.5 s; HMBC<br />
delay time, 62.5 ms. Total acquisition time was 82 min<br />
<strong>and</strong> 11 s. The choice of 1 H- 13 C HMBC instead of other<br />
2D NMR techniques depends on the fact that it<br />
provides a relatively high number of well-defined signals<br />
<strong>and</strong> does not need a phasing process, avoiding the<br />
introduction of a source of variability during the<br />
spectral calculation. Therefore, it appears to be suitable<br />
as a fingerprint technique. Besides, sensitivity appears to<br />
be sufficient for the aim of this study because signals are<br />
acquired on the proton channel, preventing partially the<br />
low sensitivities typical of 13 C spectroscopy. On the<br />
contrary, the HMBC is a time-consuming approach with<br />
respect to the simpler 1 H NMR.<br />
Spectral calculation<br />
The application of HR-NMR technique to propolis<br />
samples generates very complicated spectra that need to<br />
be previously processed <strong>and</strong> subsequently analysed by<br />
chemometric methods. First of all, 1 H-NMR spectra<br />
were calibrated using the TMS signal, whereas the<br />
1 13<br />
H- C HMBC spectra were calibrated using the residual<br />
ethanol signal (-CH3, 57.5 ppm in F1 ( 13 C) <strong>and</strong><br />
1.1 ppm in F2 ( 1 H)) which is present in all the spectra.<br />
International Journal of Food Science <strong>and</strong> Technology 2010 Ó 2010 The Authors. Journal compilation Ó 2010 Institute of Food Science <strong>and</strong> Technology
1 H-NMR<br />
The 1 H NMR spectra were used as intensity. Each<br />
spectrum generated a file containing 16K data points<br />
corresponding to time domain that is the number of<br />
points acquired <strong>and</strong> digitalised by the instrument along<br />
the spectral width of 5995.204 Hz to obtain the Free<br />
Induction Decay <strong>and</strong> then converted into a frequency<br />
domain spectrum by Fourier transform; these files were<br />
collected in a data set consisting of 16K spectral<br />
variables <strong>and</strong> sixty samples. Then, to reduce the number<br />
of data points, all the spectral regions devoid of signals<br />
<strong>and</strong> the solvents signals were not considered; besides,<br />
also the spectral resolution was reduced, obtaining a<br />
data set with 2159 variables <strong>and</strong> sixty samples. Three<br />
other data sets were prepared: the first one referred to<br />
the spectral region between 4.50 <strong>and</strong> 13.00 ppm, the<br />
second one that contains principally the aromatic<br />
compounds signals, between 4.50 <strong>and</strong> 8.25 ppm <strong>and</strong><br />
the third one that contains the carbonylic <strong>and</strong> carboxylic<br />
protons signals between 8.25 <strong>and</strong> 13.00 ppm. These<br />
three data sets contain 1930, 1087 <strong>and</strong> 1350 variables,<br />
respectively. The 1 H NMR spectra were also integrated<br />
using the software Amix 3.7.10 (Bruker Biospin GMBH,<br />
Rheinstetten, Germany). The integration was performed<br />
by considering the signals present in the spectra<br />
obtained from all the samples analysed. Thirty-seven<br />
signals were integrated in all <strong>and</strong> used for chemometric<br />
analyses.<br />
1 H- 13 C HMBC<br />
To apply chemometric analysis to HMBC spectra<br />
previously calibrated, the spectral correlations were<br />
integrated, <strong>and</strong> the volume was calculated by the<br />
spectrometer software. This program adds together the<br />
intensity of the points located in previously manually<br />
defined areas surrounding the correlations; all spectra<br />
were processed using the same map of regions of<br />
interest. The integrated signals selection was performed<br />
by verifying the signals present in the spectra of all the<br />
samples analysed <strong>and</strong> the absence of overlapping<br />
adjacent signals, consequently 161 regions of interest<br />
were defined <strong>and</strong> used for chemometric analyses.<br />
Besides, even in this case, a data set of 112 variables<br />
<strong>and</strong> sixty samples was obtained, considering only the<br />
spectral region between 4.50 <strong>and</strong> 13.00 ppm in F2 ( 1 H).<br />
Statistical analysis<br />
For the propolis composition, the analysis of variance<br />
(anova) was used to evaluate the statistical significance<br />
of measured differences between the propolis. To<br />
evaluate the most important variables which discriminate<br />
between the propolis, post hoc test was performed<br />
using the Tukey ‘honest significant difference test’. For<br />
all these monovariate tests, the P level was set at 0.05.<br />
Before the analyses on NMR spectra were performed,<br />
Classification of different propolis by HR-NMR G. Papotti et al. 1613<br />
all data were normalised. To achieve a reliable classification<br />
of the different propolis samples, unsupervised<br />
<strong>and</strong> supervised pattern recognition procedures were<br />
applied to the data sets. Factor analysis (FA) (Burt,<br />
1950) <strong>and</strong> general discriminant analysis (GDA)<br />
(McLachlan, 1992) were used in this work to classify<br />
propolis according to their NMR fingerprint. FA is a<br />
multivariate procedure that allows a large portion of the<br />
total variance of data to be expressed with a smaller<br />
number of variables <strong>and</strong> can be used to identify the most<br />
significant of original factors. GDA is a supervised<br />
technique used to determine whether a given classification<br />
of cases into a number of groups is an appropriate<br />
one. In this work, to perform GDA, a reduction in<br />
variables with respect to complete data sets was necessary;<br />
therefore the number of variables was reduced,<br />
considering only the signals which presented a factorial<br />
weight during FA > |0.8|. The data set of thirty-seven<br />
variables <strong>and</strong> sixty samples obtained by applying the<br />
integration pattern was statistically analysed by anova<br />
test; therefore only the statistically significant variables<br />
(P < 0.05) were considered <strong>and</strong> used for the following<br />
GDA analysis. After the construction of the models, to<br />
evaluate the classification performance, the leave-one<br />
out method (Henrion & Henrion, 1994) was used as a<br />
validation procedure. All statistical calculations were<br />
performed using Statistica 6.1 (StatSoft Ò Italia, Vigonza,<br />
Italy) <strong>and</strong> spss 13.0 (SPSS Inc., Chicago, IL, USA).<br />
Results <strong>and</strong> discussion<br />
Propolis composition<br />
In Table 1 the phenolics, balsams <strong>and</strong> waxes mean<br />
contents are reported. As shown, the results are in large<br />
agreement with the literature data (Popova et al., 2007)<br />
for poplar propolis <strong>and</strong> this confirmed poplar as the<br />
source of the samples in the current study. The anova<br />
<strong>and</strong> the post hoc tests show statistically significant<br />
differences between scraping <strong>and</strong> wedges <strong>and</strong> propolis<br />
mat for TP, TFF <strong>and</strong> TFD. Considering these results,<br />
the NMR experiments were performed.<br />
1<br />
H NMR spectra (0–13.00 ppm)<br />
In Table 2, the NMR assignments of the most important<br />
propolis components, obtained by analysing<br />
st<strong>and</strong>ards, which are readily identifiable in our monodimensional<br />
spectra, are reported.<br />
A typical 1 H-NMR spectrum of a propolis extract is<br />
shown in Fig. 1. All the 1 H NMR spectra of the propolis<br />
obtained with different harvesting methods were compared<br />
using the spectra positional matching technique<br />
available with the software Amix 3.7.10 (BRUKER<br />
BIOSPIN GMBH). The goal of this strategy is to<br />
calculate similarities using the peaks distributions of<br />
Ó 2010 The Authors. Journal compilation Ó 2010 Institute of Food Science <strong>and</strong> Technology International Journal of Food Science <strong>and</strong> Technology 2010
1614<br />
Classification of different propolis by HR-NMR G. Papotti et al.<br />
Table 1 Phenolic compounds, balsams <strong>and</strong> waxes mean content of propolis samples a<br />
Samples n<br />
Total phenolics<br />
mg GAEs g )1<br />
Total flavones<br />
<strong>and</strong> flavonols<br />
mg g )1<br />
automatically calibrated spectral regions. For this purpose,<br />
the entire spectral region between 0 <strong>and</strong> 13.00 ppm<br />
was used. A match factor of 95.22% was obtained. This<br />
fact confirmed that the samples showed limited <strong>and</strong> not<br />
significant qualitative differences, <strong>and</strong> they derived from<br />
the same botanical species. After applying the FA, a<br />
data set of thirty variables <strong>and</strong> sixty samples was<br />
obtained. The GDA did not provide good graphic<br />
classification results. The best model was obtained using<br />
the forward stepwise method which introduced twentyfive<br />
variables, <strong>and</strong> it was only marginally able to group<br />
samples as a function of the method of harvest. The<br />
first canonical function (CF) explains 68.2% of the<br />
total variance, <strong>and</strong> the results of the leave-one out<br />
cross-validation show a predictive capacity of 83.3%<br />
(Table S1). The first CF appears to be particularly<br />
correlated with signals of the phenolic compounds.<br />
Considering these results, the next step was to analyse<br />
only the spectral region between 4.50 <strong>and</strong> 13.00 ppm,<br />
which includes the aromatic signals of flavonoids except<br />
the low frequency region between 0 <strong>and</strong> 4.50 ppm,<br />
which contains the signals of aliphatic moiety of<br />
different compounds <strong>and</strong> in particular of waxes.<br />
1<br />
H NMR spectra (4.50–13.00 ppm)<br />
After applying the FA, a data set of fifty-three variables<br />
<strong>and</strong> sixty samples was obtained. Figure 2 shows the<br />
results of the GDA. Also in this case, the best model was<br />
obtained using the forward stepwise method which<br />
introduced twenty-three variables, <strong>and</strong> it is able to<br />
group the propolis samples in three evident clusters. The<br />
first CF explains 79.4% of the total variance, <strong>and</strong> the<br />
results of the leave-one out cross-validation show a<br />
predictive capacity of 96.7% (Table S1). The first <strong>and</strong><br />
the second CF are particularly correlated with the<br />
signals of the 5OH protons of chrysin, quercetin,<br />
kemferol, galangin, pinostrobin <strong>and</strong> pinocembrin. Also<br />
the broad <strong>and</strong> unresolved signal attributed to 7OH of<br />
chrysin, quercetin <strong>and</strong> pinostrobin <strong>and</strong> the evident<br />
signal of unknown compound at 11.40 ppm are significantly<br />
correlated with CFs. Besides, the phenolic<br />
Total flavanones<br />
<strong>and</strong> dihydroflavonols<br />
mg g )1<br />
Balsams<br />
mg g )1<br />
Waxes<br />
mg g )1<br />
Scraping 17 301 ± 44(A) 44 ± 10(A) 54 ± 18(A) 564 ± 87 235 ± 26 (A)<br />
Wedges 26 321 ± 60(A) 50 ± 11(A) 52 ± 18(A) 633 ± 82 150 ± 43 (B)<br />
Propolis mat 17 256 ± 54(B) 29 ± 10(B) 37 ± 14(B) 601 ± 58 235 ± 46 (A)<br />
P (ANOVA) b<br />
0.002
Table 2 Assignment of 1 H signals of phenolic compounds identified in sample spectra using DMSO-d6 as solvents<br />
Compound<br />
Chemical<br />
shift (d)<br />
1 H multiplicity Assignment Compound<br />
bioactive compounds of propolis, such as flavonoids,<br />
phenolic acids <strong>and</strong> their esters, provide signals in both<br />
the spectral regions considered.<br />
1<br />
H NMR spectra analysed by the integration pattern<br />
After applying the anova test, a data set of twenty-nine<br />
variables <strong>and</strong> sixty samples was obtained. Also in this<br />
case, the GDA did not provide good graphic results;<br />
Chemical<br />
shift (d)<br />
1 H multiplicity Assignment<br />
Apigenin 6.19 d 6H Chrysin 6.22 d 6H<br />
6.46 d 8H 6.51 d 8H<br />
6.75 s 3H 6.94 s 3H<br />
6.92 d 3¢H; 5¢H 7.58 m 3¢H; 4¢H; 5¢H<br />
7.90 d 2¢H; 6¢H 8.04 d 2¢H; 6¢H<br />
10.40 s 4¢OH 10.90 s (bb) 7OH<br />
10.75 s 7OH 12.82 s 5OH<br />
12.96 s 5OH Galangin 6.16 d 6H<br />
Kaempferol 6.20 d 6H 6.40 d 8H<br />
6.44 d 8H 7.44 m 3¢H; 4¢H; 5¢H<br />
6.93 d 3¢H; 5¢H 8.08 d 2¢H; 6¢H<br />
8.05 d 2¢H; 6¢H 9.59 s 3OH<br />
9.35 s 3OH 10.59 s 7OH<br />
10.10 s 4¢OH 12.31 s 5OH<br />
10.78 s 7OH Caffeic Acid 6.17 d C2H<br />
12.48 s 5OH 6.76 d 5¢H<br />
Quercetin 6.19 d 6H 6.96 dd 2¢H<br />
6.41 d 8H 7.03 d 6¢H<br />
6.89 d 5¢H 7.42 d 3H<br />
7.54 d 6¢H 9.13 s 3¢OH<br />
7.73 d 2¢H 9.52 s 4¢OH<br />
9.18 s 3OH 12.10 s COO(H)<br />
9.45 s 3¢OH Ferulic Acid 3.82 s 3¢O-CH 3<br />
9.59 s 4¢OH 6.36 d 2H<br />
10.75 s(bb) 7OH 6.79 d 5¢H<br />
12.48 s 5OH 7.08 dd 2¢H<br />
Pinostrobin 2.83 dd 3bH 7.28 d 6¢H<br />
3.29 dd 3aH 7.49 d 3H<br />
3.80 s O-CH3 9.54 s 4¢OH<br />
5.62 dd 2H 12.07 s COO(H)<br />
6.11 d 6H<br />
6.15 d 8H<br />
7.42 m 3¢H; 4¢H; 5¢H<br />
7.54 d 2¢H; 6¢H<br />
12.12 s 5OH<br />
Pinocembrin 2.79 dd 3bH<br />
3.23 dd 3aH<br />
5.58 dd 2H<br />
5.93 dd 6H; 8H<br />
7.41 m 3¢H; 4¢H; 5¢H<br />
7.52 d 2¢H; 6¢H<br />
10.79 s(bb) 7OH<br />
12.13 s 5OH<br />
s, singlet; d, doublet; dd, doublet of doublets; m, multiplet; bb, broad b<strong>and</strong>.<br />
Classification of different propolis by HR-NMR G. Papotti et al. 1615<br />
however the best model was achieved using the forcedentry<br />
method which introduces all independent variables<br />
that satisfy tolerance criteria simultaneously. The first<br />
CF explains 76.3% of the total variance, <strong>and</strong> the results<br />
of the leave-one out cross-validation show a predictive<br />
capacity of 61.7% (Table S1). The poor results could be<br />
explained by the fact that the propolis extracts provided<br />
spectra which were too complicated to be correctly<br />
integrated, besides also the manual phasing process<br />
Ó 2010 The Authors. Journal compilation Ó 2010 Institute of Food Science <strong>and</strong> Technology International Journal of Food Science <strong>and</strong> Technology 2010
1616<br />
Classification of different propolis by HR-NMR G. Papotti et al.<br />
Figure 2 Score plot of the first two canonical functions for the data set<br />
obtained by 1 H NMR spectra related to spectral region between 4.50<br />
<strong>and</strong> 13.00 ppm showing the separation of samples in three evident<br />
clusters corresponding to the harvesting methods: scraping (4),<br />
wedges (+), propolis mat (h), group centroids (d).<br />
introduced a source of variability during the spectral<br />
calculation. All this explains the importance of directly<br />
applying the chemical fingerprint analysis to the spectral<br />
signals avoiding other processing procedures.<br />
1 13<br />
H- C HMBC spectra<br />
A typical 1 H- 13 C HMBC spectrum of a propolis extract<br />
is shown in Fig. 3. After applying the FA, data sets of<br />
ninety-six variables <strong>and</strong> sixty samples for the complete<br />
spectral region <strong>and</strong> sixty-one variables <strong>and</strong> sixty samples<br />
for the spectral region between 4.50 <strong>and</strong> 13.00 ppm in<br />
Figure 1 1 H-NMR spectrum of a propolis extract.<br />
Figure 3 1 H- 13 C heteronuclear multiple bond correlation spectrum of a<br />
propolis extract.<br />
F2 ( 1 H) were obtained. Figures 4 <strong>and</strong> 5 show the GDA<br />
results. With respect to the model obtained by the first<br />
data set (complete spectral region), the best result was<br />
achieved using the forward stepwise method which<br />
introduced thirty-eight variables. The first CF explains<br />
82.1% of the total variance, <strong>and</strong> the results of the leaveone<br />
out cross-validation show a predictive capacity of<br />
91.7% (Table S1). The most correlated signals are not<br />
only those of the phenolic compounds, but also few<br />
other ones in the low frequency region, in which<br />
aliphatic moiety signals of other substances (i.e. terpenoids,<br />
alcohols, esters <strong>and</strong> acids) are present. Considering<br />
the model obtained by the second data set [spectral<br />
region between 4.50 <strong>and</strong> 13.00 ppm in F2 ( 1 H)], also in<br />
this case the best result was achieved using the forward<br />
International Journal of Food Science <strong>and</strong> Technology 2010 Ó 2010 The Authors. Journal compilation Ó 2010 Institute of Food Science <strong>and</strong> Technology
Figure 4 Score plot of the first two canonical functions for the data set<br />
obtained by 1 H- 13 C heteronuclear multiple bond correlation spectra<br />
related to complete spectral region showing the separation of samples<br />
in three evident clusters corresponding to the harvesting methods:<br />
scraping (4), wedges (+), propolis mat (h), group centroids (d).<br />
Figure 5 Score plot of the first two canonical functions for the data set<br />
obtained by 1 H- 13 C heteronuclear multiple bond correlation spectra<br />
related to the spectral region between 4.50 <strong>and</strong> 13.00 ppm in F2 ( 1 H)<br />
showing the separation of samples in three different clusters corresponding<br />
to the harvesting methods: scraping (4), wedges (+),<br />
propolis mat (h), group centroids (d).<br />
stepwise method which introduced thirty-eight variables.<br />
The first CF explains 63.6% of the total variance,<br />
<strong>and</strong> the results of the leave-one out cross-validation<br />
show a predictive capacity of 81.7% (Table S1). In this<br />
model, the most correlated signals are those of phenolic<br />
compounds, in particular, aromatic protons of flavonoids.<br />
In general, comparing these models with the<br />
corresponding 1 H NMR results, it is possible to affirm<br />
that 1 H- 13 C HMBC technique provided useful information<br />
from the complete spectra because it was able to<br />
furnish well-defined signals also in the low-frequency<br />
region (0–4.50 ppm), which appeared not to be well<br />
resolved in the 1 H NMR spectra owing to the presence<br />
of confused <strong>and</strong> overlapped signals.<br />
Conclusion<br />
Considering the obtained results, it can be concluded<br />
that the use of HR-NMR coupled with an appropriate<br />
data processing procedure <strong>and</strong> multivariate statistical<br />
methods enabled development of sufficiently effective<br />
<strong>and</strong> appropriate models for classifying propolis according<br />
to the harvesting methods. It is interesting to note<br />
that the best results were obtained using the 1 HNMR<br />
which is the simplest <strong>and</strong> fastest technique. Furthermore,<br />
the differences in chemical constituents’ profiles of<br />
the samples analysed (Table 1) give useful information<br />
to partly explain the cluster classification reported. As<br />
shown in Figs 2, 4 <strong>and</strong> 5, the first CF is always able to<br />
distinguish the wedges propolis samples from the<br />
scraping <strong>and</strong> propolis mat ones. The wedges propolis<br />
samples, in particular, showed higher TP, TFF <strong>and</strong><br />
balsams contents <strong>and</strong> the lowest amount of waxes<br />
compared with the other samples. As reported in<br />
literature <strong>and</strong> already mentioned in this work<br />
(Kujumgiev et al., 1999), the amount of balsams is an<br />
important characteristic because, in general, a high<br />
percentage of balsam corresponds to a low waxes <strong>and</strong><br />
insoluble matter percentages <strong>and</strong> to a higher content of<br />
biologically active compounds. Moreover, the developed<br />
models seem to be particularly related to flavonoids as<br />
suggested by the fact that the most influencing <strong>and</strong><br />
significant signals were identified in the spectral region<br />
between 4.50 <strong>and</strong> 13.00 ppm.<br />
Acknowledgments<br />
The authors thank the staff of CRA-API (Consiglio per<br />
la Ricerca e la Sperimentazione in Agricoltura-Istituto<br />
Nazionale di Apicoltura e Bachicoltura) (Bologna, Italy),<br />
in particular Dr Anna Gloria Sabatini for assistance<br />
during the experimental work <strong>and</strong> for providing useful<br />
suggestions <strong>and</strong> discussions, <strong>and</strong> the Fondazione Cassa<br />
di Risparmio di Modena, for financial support given<br />
towards the purchase of the Bruker Avance 400 spectrometer.<br />
References<br />
Classification of different propolis by HR-NMR G. Papotti et al. 1617<br />
Alì, A., Mearelli, F., Sgrignani, M. & Camporese, A. (1997). La propoli,<br />
chimica, farmacologia e terapia. Firenze, Italy: Planta Medica.<br />
Bankova, V., Popova, M., Bogdanov, S. & Sabatini, A. (2002).<br />
Chemical composition of European propolis: expected <strong>and</strong> unexpected<br />
results. Zeitschrift fu¨r Naturforschung, 57c, 530–533.<br />
Banskota, A.H., Tezuka, Y. & Kadota, S. (2001). Recent progress in<br />
pharmacological research of propolis. Phytotherapy Research, 15,<br />
561–571.<br />
Ó 2010 The Authors. Journal compilation Ó 2010 Institute of Food Science <strong>and</strong> Technology International Journal of Food Science <strong>and</strong> Technology 2010
1618<br />
Classification of different propolis by HR-NMR G. Papotti et al.<br />
Bedascarrasbure, E., Maldonado, L. & Alvarez, A. (2004). Preliminary<br />
results about method of harvest’s effect on the propolis’ content of<br />
lead. Honeybee Science, 25, 129–131.<br />
Burt, C. (1950). The factorial analysis of qualitative data. British<br />
Journal of Psychology, 3, 166–185.<br />
Charlton, A.J., Farrington, W.H.H. & Brereton, P. (2002). Application<br />
of 1 H NMR <strong>and</strong> multivariate statistics for screening complex<br />
mixtures: quality control <strong>and</strong> authenticity of instant coffee. Journal<br />
of Agricultural <strong>and</strong> Food Chemistry, 50, 3098–3103.<br />
Cuesta-Rubio, O., Piccinelli, A.L., Campo Fern<strong>and</strong>ez, M., Marquez<br />
Hern<strong>and</strong>ez, I., Rosado, A. & Rastrelli, L. (2007). Chemical<br />
characterization of cuban propolis by HPLC-PDA, HPLC-MS,<br />
<strong>and</strong> NMR: the brown, red, <strong>and</strong> yellow cuban varieties of propolis.<br />
Journal of Agricultural <strong>and</strong> Food Chemistry, 55, 7502–7509.<br />
Fan, T.W.M. (1996). Metabolite profiling by one- <strong>and</strong> two-dimensional<br />
NMR analysis of complex mixtures. Progress in Nuclear<br />
Magnetic Resonance Spectroscopy, 28, 161–219.<br />
Greenaway, W., Scaysbrook, T. & Whatley, F.R. (1987). The analysis<br />
of bud exudate of Populus x euramericana, <strong>and</strong> of propolis, by gas<br />
chromatography-mass spectrometry. Proceedings of the Royal Society<br />
of London, 232, 249–272.<br />
Greenaway, W., Scaysbrook, T. & Whatley, F.R. (1990). The<br />
composition of plant origins of propolis. Bee World, 71, 107–118.<br />
Henrion, R. & Henrion, G. (1994). Uberwachte klassifikation. In:<br />
MultiVariate Datenanaly. Pp. 71–73. Berlin, Germany: Springer-<br />
Verlag.<br />
Kujumgiev, A., Tsvetkova, I., Serkedjieva, Y., Bankova, V.S., Christov,<br />
R. & Popov, S. (1999). Antibacterial, antifungal <strong>and</strong> antiviral<br />
activity of propolis of different geographic origin. Journal of<br />
Ethnopharmacology, 64, 235–240.<br />
Kumazawa, S., Ueda, R., Hamasaka, T., Fukumoto, S., Fujimoto,<br />
T. & Nakayama, T. (2007). Antioxidant prenylated flavonoids from<br />
propolis collected in Okinawa, Japan. Journal of Agricultural <strong>and</strong><br />
Food Chemistry, 55, 7722–7725.<br />
Matsuno, T. (1995). A new clerodane diterpenoid isolated from<br />
propolis. Zeitschrift fu¨r Naturforschung, 50C, 93–97.<br />
McLachlan, G.J. (1992). Discriminant Analysis <strong>and</strong> Statistical Pattern<br />
Recognition. New York: Wiley.<br />
Nagy, M. & Grancai, D. (1996). Colorimetric determination of<br />
flavanones in propolis. Pharmazie, 51, 100–101.<br />
Nagy, E., Papay, V., Litkei, G. & Dinya, Z. (1986). Investigation of the<br />
chemical constituents, particularly the flavonoid components, of<br />
propolis <strong>and</strong> Populi gemma by the GC ⁄ MS method. Studies in<br />
Organic Chemistry, 23, 223–232.<br />
Nieva Moreno, M.I., Isla, M.I., Sampietro, A.R. & Vattuone, M.A.<br />
(2000). Comparison of the free radical – scavenging activity of<br />
propolis from several regions of Argentine. Journal of Ethnopharmacology,<br />
71, 109–114.<br />
Popova, M.P., Bankova, V.S., Bogdanov, S. et al. (2007). Chemical<br />
characteristics of poplar type propolis of different geographic origin.<br />
Apidologie, 38, 306–311.<br />
Ramanauskiene, K., Savickas, A., Ivanauskas, L. et al. (2008).<br />
Analysis of phenolic acids in propolis using the high-performance<br />
liquid chromatography technique. Current Nutrition <strong>and</strong> Food<br />
Science, 4, 209–212.<br />
Rossi, P. (2006). Comparazione di metodi di produzione della propoli.<br />
APOidea, 3, 27–32.<br />
Sales, A., Alvarez, A., Rodriguez Areal, M. et al. (2006). The effect of<br />
different propolis harvest methods on its lead contents determined<br />
by ET AAS <strong>and</strong> UV-visS. Journal of Hazardous Materials, 137,<br />
1352–1356.<br />
Singleton, V.L., Orthofer, R. & Lamuela-Raventos, R.M. (1999).<br />
Analysis of total phenols <strong>and</strong> other oxidation substrates <strong>and</strong><br />
antioxidants by means of Folin-Ciocalteau reagent. Methods in<br />
Enzymology, 299, 152–178.<br />
Wang, L., Mineshita, S. & Ga, I. (1993). Anti inflammatory effects of<br />
propolis. Japanese Journal of Pharmacology, 24, 223–226.<br />
Watson, D.G., Peyfoon, E., Zheng, L. et al. (2006). Application of<br />
principal components analysis to 1 H-NMR data obtained from<br />
propolis samples of different geographical origin. Phytochemical<br />
Analysis, 17, 323–331.<br />
Woisky, R. & Salatino, A. (1998). Analysis of propolis: some<br />
parameters <strong>and</strong> procedures for chemical quality control. Journal of<br />
Food <strong>and</strong> Drug Analysis, 37, 99–105.<br />
Supporting Information<br />
Additional supporting Information may be found in the<br />
online version of this article:<br />
Table S1. Leave-one out cross-validation results.<br />
Please note: Wiley-Blackwell are not responsible for<br />
the content or functionality of any supporting information<br />
supplied by the authors. Any queries (other than<br />
missing material) should be directed to the corresponding<br />
author for the article.<br />
International Journal of Food Science <strong>and</strong> Technology 2010 Ó 2010 The Authors. Journal compilation Ó 2010 Institute of Food Science <strong>and</strong> Technology
International Journal of Food Science <strong>and</strong> Technology 2010, 45, 1619–1625 1619<br />
Original article<br />
Supercritical CO 2 <strong>and</strong> N 2O pasteurisation of peach <strong>and</strong> kiwi juice<br />
Sara Spilimbergo 1 * & Lara Ciola 2<br />
1 Department of Materials Engineering <strong>and</strong> Industrial Technologies, University of Trento, via Mesiano 77, 38123 Trento, Italy<br />
2 Trentofrutta S.p.a., via A. Degasperi 130, 38123 Trento, Italy<br />
(Received 4 December 2009; Accepted in revised form 6 May 2010)<br />
Summary The microbial inactivation <strong>and</strong> qualitative parameters (pH, sugar content, titratable acidity, absorbance at<br />
420 nm <strong>and</strong> turbidity) of peach <strong>and</strong> kiwi juices treated at 35 °C with supercritical carbon dioxide (SC-CO 2)<br />
<strong>and</strong> nitrous oxide (SC-N2O) were determined as a function of pressure <strong>and</strong> treatment time. Total inactivation<br />
of both naturally occurring microorganisms <strong>and</strong> Saccharomyces cerevisiae strain (10 5 cfu mL )1 ) was<br />
obtained after 15 min of SC-CO 2 ⁄ N 2O treatment, 10 MPa <strong>and</strong> 35 °C, for both juices. No significant changes<br />
in chemical-physical or in sensorial characteristics between untreated <strong>and</strong> treated juice were detected. The<br />
results obtained demonstrate the feasibility <strong>and</strong> the potential of SC-CO 2 ⁄ N 2O treatment as an alternative<br />
low temperature pasteurisation process for peach <strong>and</strong> kiwi juices.<br />
Keywords CO 2, juice, kiwi , N 2O, pasteurisation, peach, supercritical fluids.<br />
Introduction<br />
Research efforts for the development of nonthermal<br />
food preservation techniques has been growing in the<br />
last decade because of the consumer dem<strong>and</strong> for<br />
natural <strong>and</strong> minimally treated food products (Raso &<br />
Barbosa-Canovas, 2003). Thermal pasteurisation is the<br />
traditional <strong>and</strong> most common method in the food<br />
industry to prevent microbial spoilage of juices; however,<br />
it may cause degradation of flavour, nutrients,<br />
colour <strong>and</strong> texture (Gunes et al., 2005). Nonthermal<br />
processes, like supercritical carbon dioxide (SC-CO2), may offer better retention of natural flavour <strong>and</strong><br />
nutrients in treated foods compared to the traditional<br />
thermal processes (Kincal et al., 2006). Microbial <strong>and</strong><br />
enzymatic inactivation with SC-CO2 has been mostly<br />
applied to liquid food products, such as fruit juices,<br />
beer, wine <strong>and</strong> milk, etc; in particular, SC-CO2 has<br />
been shown to be a promising alternative for pasteurisation<br />
of fruit juice (Arreola et al., 1991; Del Pozo-<br />
Insfran et al., 2006).<br />
Three recent reviews compile the relevant current<br />
knowledge about the potential of SC-CO2 as a nonthermal<br />
inactivation technology <strong>and</strong> summarise the most<br />
significant state of the art, including relevant applications<br />
<strong>and</strong> data, in both simple suspensions <strong>and</strong> complex<br />
media, for the treatment of a wide range of microorganisms<br />
in both liquid <strong>and</strong> solid substrates (Spilimbergo<br />
& Bertucco, 2003a; Damar & Balaban, 2006; Garcia-<br />
Gonzalez et al., 2007).<br />
*Correspondent: E-mail: sara.spilimbergo@ing.unitn.it<br />
doi:10.1111/j.1365-2621.2010.02305.x<br />
Ó 2010 The Authors. Journal compilation Ó 2010 Institute of Food Science <strong>and</strong> Technology<br />
Little information is available on the effects of the<br />
perceivable <strong>and</strong> chemical-physical properties of the<br />
products immediately after CO2 treatment <strong>and</strong> during<br />
storage; mainly orange <strong>and</strong> apple juice have been tested.<br />
Physical <strong>and</strong> chemical properties of orange juice, pH,<br />
Brix values <strong>and</strong> titratable acidity (TA) do not appear to<br />
be influenced by CO2 treatment. Yellowness <strong>and</strong> lightness<br />
seem to increase whereas redness seems to decrease<br />
(Arreola et al., 1991; Wei et al., 1991; Park et al., 2002).<br />
Three recent papers report about physical changes of<br />
apple products: no visual changes or modifications in<br />
total soluble solid content of apple cider have been<br />
found (Van Ginneken et al., 2002), whereas Gui et al.<br />
(2006) reported a significant reduction of the browning<br />
degree in CO 2-treated cloudy apple juice processed at<br />
55 °C, 30 MPa for 60 min, after storage at 4 °C.<br />
Gasperi <strong>and</strong> co-workers investigated quantitatively the<br />
sensorial modification induced by CO2 treatment in<br />
apple juice. Sensory analyses were performed on fresh<br />
control (i.e., untreated) <strong>and</strong> CO2-processed juices using<br />
both difference-from-control <strong>and</strong> ranking tests. No<br />
significant differences were detected between the CO 2treated<br />
sample <strong>and</strong> control (Gasperi et al., 2009).<br />
In the last year, a few interesting papers have been<br />
published in the field: they confirm the feasibility <strong>and</strong> the<br />
effectiveness of this innovative technique on different<br />
foodstuff. We quote the study of Garcia-Gonzalez et al.<br />
(2009) who investigated the effect of CO 2 at high pressure<br />
on the inactivation of naturally occurring microorganisms<br />
in liquid whole eggs; they concluded that CO2<br />
processing extends the shelf-life of the sample up to<br />
5 weeks at 4 °C, which is the current shelf-life of heat
1620<br />
Supercritical CO2 <strong>and</strong> N2O pasteurisation S. Spilimbergo <strong>and</strong> L. Ciola<br />
pasteurised liquid whole eggs. Chen et al. (2009) studied<br />
the influence of thermal <strong>and</strong> dense-phase carbon dioxide<br />
pasteurisation on physicochemical properties <strong>and</strong> flavour<br />
compounds in Hami melon juice. They found CO2<br />
efficiently induced microbial inactivation as well as<br />
preserved more quality attributes, including aroma compounds,<br />
than thermal treatment; Zhong et al. (2008)<br />
demonstrated that CO 2 has potential as a pasteurisation<br />
technology for application to leafy green vegetables.<br />
Interestingly, few studies reported in literature investigate<br />
the bactericidal action of another gas under<br />
pressure, N2O: Enomoto et al. (1997) showed a 5 log<br />
reduction of Saccharomyces cerevisiae using N2O at<br />
4 MPa <strong>and</strong> 40 °C for 240 min, whereas Fraser (1951)<br />
observed 58% reduction of Escherichia coli after N 2O<br />
treatment at 38 °C <strong>and</strong> 3.45 MPa for 3 min. A recent<br />
study reports total inactivation of microbes in fresh<br />
apple juice using SC-N 2O at 10 MPa <strong>and</strong> 36 °C with no<br />
significant chemical-physical, nutritional or sensory<br />
differences between N2O-treated <strong>and</strong> untreated sample<br />
(Spilimbergo et al., 2007a,b; Gasperi et al., 2009).<br />
To our knowledge, a few observations quoted in<br />
literature concern other fruits juices than apple <strong>and</strong><br />
orange ones, in particular carrot (Park et al., 2002),<br />
grape (Gunes et al., 2005), grapefruit (Ferrentino et al.,<br />
2009), coconut (Damar & Balaban, 2005), m<strong>and</strong>arin<br />
(Lim et al., 2006), watermelon juice (Lecky, 2005), <strong>and</strong><br />
no papers concern other kind of juices such as peach or<br />
kiwi juices some of the most critical products to be<br />
pasteurised without inducing chemical-physical modifications<br />
(personal communication by Trentofrutta<br />
S.p.A., Trento, Italy). Usually the absorbance at<br />
420 nm, tightly related to the oxidation of sugars <strong>and</strong><br />
proteins contained in juice, is the most important<br />
parameter for product acceptability after pasteurisation.<br />
After thermal treatments an increase in absorbance in<br />
the range within 0.100 ‚ 0.200 <strong>and</strong> 0.200 ‚ 0.300 is<br />
usually detected in peach <strong>and</strong> kiwi juice respectively<br />
compared to 0.050 ‚ 0.100 in apple juice (confidential<br />
data kindly provided by Trentofrutta S.p.A.). Peach<br />
chemical composition includes thermostable compounds<br />
like vitamins (B1, C), monoterpens (linalol <strong>and</strong> geraniol)<br />
<strong>and</strong> carotenoids, precursors of vitamin A (Riu-Aumatell<br />
et al., 2005). Moreover, peach juice has a high content<br />
of potassium, fibres, proteins <strong>and</strong> sugars, which can be<br />
oxidised in severe conditions such as high hydrostatic<br />
pressure treatment (400 MPa, 20 °C for 10 min) (Dogan<br />
& Erkmen, 2003); increased levels of benzaldehyde has<br />
been attributed to b-glucosidase activity (Sumitani<br />
et al., 1994).<br />
Kiwi juice has significant amounts of biologically<br />
active compounds including ascorbic acid <strong>and</strong> antioxidant<br />
capacity because of the content of phytonutrients,<br />
such as carotenoids, lutein, phenolics <strong>and</strong> flavonoids:<br />
most of these compounds offer benefits for specific<br />
health conditions (Tasselli et al., 2007). The dark green<br />
colour of kiwi fruit, which is attributed to the chlorophylls,<br />
in plastids in the pericarp cellsonce solubilised<br />
can be converted into the olive brown pheophorbide by<br />
low pH <strong>and</strong> high temperature. Pheophorbide is oxidised<br />
into a colourless compound (Cano, 1992; Cano et al.,<br />
1993).<br />
In this context, the aim of this paper consists on<br />
extending the potentiality of SC pasteurisation to other<br />
high-sensitive products such as peach <strong>and</strong> kiwi juices. In<br />
detail,<br />
1 The efficiency of both SC-CO 2 ⁄ N 2O on microbial<br />
inactivation of peach <strong>and</strong> kiwi juice will be checked;<br />
2 The effect of SC-CO 2 ⁄ N 2O on chemical-physical<br />
parameters such as Brix value, pH, TA, absorbance<br />
<strong>and</strong> turbidity of fresh juice will be measured <strong>and</strong><br />
compared to the untreated one.<br />
Materials <strong>and</strong> methods<br />
Peach <strong>and</strong> kiwi juices<br />
Freshly squeezed fruit juices were produced by Trentofrutta<br />
S.p.A.; the juice, some of which was inoculated<br />
with S. cerevisiae (ATCC 9763) to obtain a bioburden,<br />
N0, of 10 5 CFU mL )1 , was frozen in plastic bags<br />
(1000 mL). The evening before the treatment, the juice<br />
bags were thawed at 4 °C (overnight). After the treatment,<br />
reference <strong>and</strong> treated samples were stored at 4 °C<br />
before microbiological <strong>and</strong> chemical-physical analysis.<br />
High-pressure equipment <strong>and</strong> procedure<br />
The experiments were performed with the multi-batch<br />
pilot plant described by Spilimbergo & Mantoan (2006).<br />
CO2 (4.5; Messer, Torino, Italy) or N2O (2.0; Messer)<br />
was cooled down to 3 °C <strong>and</strong> then pumped into highpressure<br />
vessels by a volumetric pump (LEWA, mod.<br />
LCD1 ⁄ M910 s, Leonberg, Germany) with a maximum<br />
flow rate of 13 L h )1 . The vessels consist of two 310-ml<br />
cylinders <strong>and</strong> of ten 15-ml cylinders equipped with a<br />
magnetic system for stirring (micro-stirrer; Velp, New<br />
York, NY, USA). The vessels, immersed in a water<br />
bath, were thermally controlled inside one small <strong>and</strong> one<br />
big reactor, while pressure gauges measured the operative<br />
pressure inside the vessels (Gefran, Brescia, Italy<br />
<strong>and</strong> Wika, Lawrenceville, NJ, USA). Gefran probe has a<br />
pressure range within 0 ‚ 50 MPa, an accuracy £0.5%<br />
FSO (Full Scale Outputs) while Wika one has a pressure<br />
range of 0 ‚ 40 MPa, an accuracy £0.25% FSO. The<br />
operating temperature <strong>and</strong> pressure were continuously<br />
recorded by a real-time acquisition data system (NA-<br />
TIONAL INSTRUMENTS, field point FP-1000 RS<br />
232 ⁄ RS 485, Austin, TX, USA) <strong>and</strong> monitored by the<br />
software LabVIEWÔ 5.0, (NATIONAL INSTRU-<br />
MENTS).<br />
International Journal of Food Science <strong>and</strong> Technology 2010 Ó 2010 The Authors. Journal compilation Ó 2010 Institute of Food Science <strong>and</strong> Technology
Microbial <strong>and</strong> chemical-physical trial<br />
Seven millilitres of juice was introduced in each vessel<br />
(Vmax = 20 mL) <strong>and</strong> exposed to SC gas at 35 °C for a<br />
treatment time within 0 ‚ 15 min, with a stirring rate of<br />
300 r.p.m.<br />
Turbidity ⁄ pH <strong>and</strong> organoleptic trial<br />
Seventy-five millilitres of juice was introduced in each<br />
vessel (Vmax = 310 mL) <strong>and</strong> exposed to SC gas at 35 °C<br />
for 10 min with a stirring rate of 300 r.p.m. Two<br />
consecutive experimental runs were performed to produce<br />
the total volume of 300 mL needed for sensorial,<br />
turbidity <strong>and</strong> pH analyses.<br />
Microbiological analysis<br />
Before <strong>and</strong> after each treatment, the viable cell counts<br />
were determined by st<strong>and</strong>ard plating technique (Speck<br />
et al., 1975).<br />
Every sample was diluted in ringer solution, (Oxoid,<br />
Milan, Italy) (dilution 1:10), plated onto Plate Count<br />
Agar (PCA), incubated at their optimal condition<br />
(28 °C for 48 h) before counting. PCA is a not selective<br />
microbiological medium, commonly used to detect total<br />
microbial count of a sample. The same medium was<br />
used to analyse samples with inoculum to count both<br />
S. cerevisiae <strong>and</strong> all natural occurring microorganism<br />
colonies in the juice. In the result section the inactivation<br />
data are expressed as survival % (N ⁄ N0%) vs. time,<br />
where N0 is the initial number of cells in the control<br />
sample <strong>and</strong> N is the number of cells in the sample after<br />
treatment (CFU ⁄ ml). Each result is the mean value of<br />
four different runs.<br />
Chemical-physical analysis<br />
Typical chemical <strong>and</strong> physical parameters (Benitez<br />
et al., 2007) such as pH, sugar content (°BX), TA,<br />
absorbance (A) at 420 nm <strong>and</strong> turbidity [Nephelometric<br />
Turbidity Units (NTU)] were measured before <strong>and</strong> after<br />
each SC treatment.<br />
NTU is a widely used parameter in food industry to<br />
measure the limpidity of the fruit products (Morais<br />
et al., 2006). After an acceptable pasteurisation treatment<br />
no modification of NTU should be detected. In<br />
some cases, a slight decrease in NTU can be measured<br />
after a thermal process because of the presence of<br />
thermolabile proteins in the juice.<br />
Absorbance is a crucial parameter tightly related to<br />
the juice browning which induces changes in visual<br />
characteristics of the final product.<br />
The initial pH, °BX, TA, A <strong>and</strong> NTU values, reported<br />
in Tables 1–4 for both juices, are indicated as ‘untreated’.<br />
No st<strong>and</strong>ard deviations are indicated because the resulted<br />
values were particularly stable, thus the st<strong>and</strong>ard deviation<br />
was insignificant.<br />
Supercritical CO2 <strong>and</strong> N2O pasteurisation S. Spilimbergo <strong>and</strong> L. Ciola 1621<br />
Table 1 °BX, TA <strong>and</strong> A at 420 nm values in peach juice before <strong>and</strong><br />
after treatments at different pressures, 35 °C <strong>and</strong> 15 min, both with<br />
CO 2 <strong>and</strong> N 2O<br />
Gas<br />
Pressure<br />
(MPa)<br />
Untreated Treated<br />
°BX TA A<br />
D°BX<br />
(SD) DTA (SD) DA (SD)<br />
CO 2 6.3 8.8 4.4 0.225 0 (0.1) 0.4 (0.1) 0 (0.02)<br />
8 9.2 4.7 0.121 0 (0.1) 0.1 (0.0) 0 (0.01)<br />
10 10 5.3 0.123 0 (0.0) 0.2 (0.0) 0.061 (0.02)<br />
N2O 5.3 8.8 4.6 0.117 0 (0.0) 0 (0.1) 0 (0.01)<br />
8 9.1 4.7 0.128 0 (0.1) 0 (0.0) 0 (0.01)<br />
10 10 5.3 0.123 0 (0.1) 0 (0.1) 0.012 (0.01)<br />
D indicates variation compared to the untreated sample.<br />
SD, st<strong>and</strong>ard deviation; TA, titratable acidity.<br />
Table 2 A at 420 nm of peach <strong>and</strong> kiwi juice before <strong>and</strong> after thermal<br />
treatments at 90 ± 5 °C performed for 46 s in a tube in tube heat<br />
exchanger<br />
Fruit juice<br />
Untreated Treated<br />
A (SD) DA (SD)<br />
Peach 0.170 0.505<br />
Kiwi 0.147 (0.007) 0.395 (0.035)<br />
D indicates variation compared to the untreated.<br />
SD, st<strong>and</strong>ard deviation.<br />
pH was measured using a digital pH meter (WTW<br />
Inolab, FlightTech, Belluno, Italy), °BX determined<br />
with a digital refractometer (model RFM 91; Bellingham<br />
+ Stanley, Kent, UK) at 20 °C, TA calculated with<br />
an automatic titolator (DL50; Mettler, Milano, Italy)<br />
using a NaOH solution (0.1 N), A at 420 nm measured<br />
with a spectrophotometer (model lambda 25; Perkin<br />
Elmer, Waltham, MA, USA) <strong>and</strong> NTU calculated with<br />
a calibrated turbidimeter (Turbiquant 1500 T, HACH<br />
18900-00, Merck, Whitehouse Station, NJ, USA).<br />
Tables 1–4 show the variation (D) of pH, °BX, TA, A<br />
<strong>and</strong> NTU with respect to the ‘untreated’ value together<br />
with the st<strong>and</strong>ard deviation (SD). Each value of DBX°,<br />
DA, DTA, DpH <strong>and</strong> DNTU is the mean of three different<br />
replicates.<br />
Organoleptic analysis<br />
After microbiological <strong>and</strong> chemical-physical analyses<br />
(2 h after SC treatment), each treated sample (75 mL)<br />
were poured from the 310-mL reactor into a colourless<br />
glass at ambient temperature <strong>and</strong> tasted by three trained<br />
judges to evaluate colour, flavour <strong>and</strong> taste. The used<br />
method follows competent indications (Poretta, 2000),<br />
developed from Trentofrutta according to an established<br />
method (Anon., 1987). Untreated juice was taken as<br />
Ó 2010 The Authors. Journal compilation Ó 2010 Institute of Food Science <strong>and</strong> Technology International Journal of Food Science <strong>and</strong> Technology 2010
1622<br />
Supercritical CO2 <strong>and</strong> N2O pasteurisation S. Spilimbergo <strong>and</strong> L. Ciola<br />
Table 3 °BX, TA, A at 420 nm, pH <strong>and</strong> NTU values in peach juice before <strong>and</strong> after treatments at 35 °C, 10 MPa <strong>and</strong> 15 min, both with CO2 <strong>and</strong><br />
N2O<br />
Gas<br />
Untreated Treated<br />
°BX TA A pH NTU D°BX (SD) DTA (SD) DA (SD) DpH (SD) DNTU (SD)<br />
CO 2 9.2 4.2 0.103 3.7 0.20 0 (0.0) 0.2 (0.1) 0.007 (0.001) 0 (0.0) 0 (0.0)<br />
N2O 9.2 4.2 0.098 3.7 0.20 0 (0.0) 0 (0.0) 0 (0.001) 0 (0.0) 0 (0.0)<br />
D indicates variation compared to the untreated sample.<br />
SD, st<strong>and</strong>ard deviation; NTU, nephelometric turbidity units; TA, titratable acidity.<br />
Table 4 °BX, TA, A at 420 nm, pH <strong>and</strong> NTU values in kiwi juice before <strong>and</strong> after treatments at 35 °C, 10 MPa <strong>and</strong> 15 min, both with CO2 <strong>and</strong><br />
N2O<br />
Gas<br />
Untreated Treated<br />
°BX TA A pH NTU D°BX (SD) DTA (SD) DA (SD) DpH (SD) DNTU (SD)<br />
CO 2 13.5 10.2 0.345 3.6 1.4 0 (0.1) 0.4 (0.0)) 0.021 (0.02) 0 (0.0) 0 (0.0)<br />
N2O 13.5 10.2 0.098 3.5 1.2 0 (0.1) 0 (0.1) 0 (0.01) 0 (0.0) 0 (0.0)<br />
D indicates variation compared to the untreated sample.<br />
SD, st<strong>and</strong>ard deviation; NTU, nephelometric turbidity units; TA, titratable acidity.<br />
reference <strong>and</strong> any changes in colour, taste <strong>and</strong> flavour<br />
recorded by the judges. The selection <strong>and</strong> the training of<br />
all of judges were considered compulsory steps to<br />
guarantee reproducible assessments <strong>and</strong> good discriminatory<br />
ability.<br />
Results <strong>and</strong> discussion<br />
Microbial inactivation<br />
In all experimental runs the sample volume was kept<br />
constant at 7 mL with a stirring rate of 300 r.p.m. <strong>and</strong><br />
temperature at 35 °C. This value was considered low<br />
enough to maintain the sensorial properties of the<br />
product <strong>and</strong> sufficiently high to reach a satisfactory rate<br />
of inhibition in a short treatment time (Spilimbergo &<br />
Mantoan, 2006). Pressure conditions were varied from<br />
cylinder pressure (5.3 <strong>and</strong> 6.3 MPa for N 2O, CO 2,<br />
respectively) to 8 <strong>and</strong> 10 MPa bar. Higher pressure has<br />
been demonstrated not to be beneficial (Spilimbergo &<br />
Mantoan, 2006).<br />
To check SC treatments efficiency in a freshly<br />
squeezed juice, in the first set of experiments, SC<br />
treatments were performed on natural juice without<br />
inoculum: the initial microbial count consists of naturally<br />
occurring microorganisms in the untreated sample<br />
(roughly 10 2 cfu mL )1 ).<br />
The inactivation kinetics of natural microflora performed<br />
at different pressures are shown in Fig. 1a <strong>and</strong> b.<br />
CO2 <strong>and</strong> N2O inactivation kinetics appear quite similar,<br />
<strong>and</strong> complete inactivation was achieved at 10 MPa after<br />
15 min, while at lower pressures the inactivation kinetic<br />
results quite slow with 90% inactivation after 15 min.<br />
The effect of the pressure on inactivation ratio could<br />
be explained by considering the diffusion process of the<br />
SC gases inside the liquid phase. It is well known that an<br />
increase in pressure induces an increase in diffusivity.<br />
In the second set of experiments, the inactivation rate<br />
of S. cerevisiae was evaluated to check whether the<br />
kinetic ratio was dependent on N0. In other words, the<br />
same matrix was tested with a higher initial N 0<br />
compared to the previous experiments (roughly<br />
10 2 cfu mL )1 ). Figure 2a shows the inactivation kinetics<br />
in peach juice obtained with both SC-CO 2 <strong>and</strong> SC-N 2O<br />
at 10 MPa <strong>and</strong> 35 °C with N0 of 10 5 CFU mL )1 while<br />
Fig. 2b shows the inactivation kinetic in kiwi juice<br />
obtained with both gases at the same operative conditions<br />
<strong>and</strong> N0.<br />
It is worth noticing that the time needed to obtain<br />
total inactivation seems to be independent of N0, at least<br />
at the temperature, pressure <strong>and</strong> in the range of N 0<br />
considered, with total inactivation resulting after<br />
15 min.<br />
Also, in this case, peach <strong>and</strong> kiwi juice inactivation<br />
kinetics appear quite similar. This observation suggests<br />
that both the gases are able to be solubilised in different<br />
fruit juices with similar kinetics. Solubilisation of the<br />
gases into the juice has been demonstrated to be the<br />
limiting step of the entire process (Spilimbergo et al.,<br />
2003b). N2O <strong>and</strong> CO2 do not have very different<br />
solubility in water (1.1485 <strong>and</strong> 0.739 mol kg )1 at 50 °C<br />
<strong>and</strong> 100 bar, 1.133 mol kg )1 <strong>and</strong> 0.936 mol kg )1 at<br />
60 bar <strong>and</strong> 25 °C, for CO2 <strong>and</strong> N2O respectively)<br />
(Sun, 2003; Arao et al., 2005), similar critical temperature<br />
<strong>and</strong> pressure (Green & Perry, 2008), or capability to<br />
suppress fungal growth (El-Goorani & Sommer, 1981).<br />
International Journal of Food Science <strong>and</strong> Technology 2010 Ó 2010 The Authors. Journal compilation Ó 2010 Institute of Food Science <strong>and</strong> Technology
(a) 100<br />
N/N 0 %<br />
10<br />
1<br />
0.1<br />
10 MPa<br />
8 MPa<br />
1E–4<br />
1E–5<br />
6.3 MPa<br />
0 2 4 6 8 10 12 14 16<br />
100 (b)<br />
N/N 0 %<br />
10<br />
1<br />
0.1<br />
1E–4<br />
1E–5<br />
10 MPa<br />
8 MPa<br />
6.3 MPa<br />
Time (min)<br />
0 2 4 6 8 10 12 14 16<br />
Time (min)<br />
Figure 1 Microbial inactivation kinetics in peach juice (a) after SC-CO 2<br />
treatment at 35 °C <strong>and</strong> different pressures; (b) after SC-N2O treatment<br />
at 35 °C <strong>and</strong> different pressures. N0 (10 2 CFU mL )1 ), represents the<br />
number of CFU mL )1 initially present in the untreated sample.<br />
In conclusion, we would like to remark that in the last<br />
decade many studies have been addressed on microbial<br />
aspects of SC treatment as an alternative pasteurisation<br />
treatment with attractive results.<br />
Chemical-physical analysis<br />
The second aim of this study was the investigation of the<br />
effect of SC treatments on chemical-physical qualities of<br />
peach <strong>and</strong> kiwi juice. In particular, sugar content (°BX),<br />
acidity (TA) <strong>and</strong> absorbance (A) at 420 nm values have<br />
been measured. Table 1 shows °BX, TA, A variations in<br />
peach juice after both CO2 <strong>and</strong> N2O treatment at<br />
different pressure conditions.<br />
Treatments with SC-CO2 <strong>and</strong> SC-N2O do not cause<br />
any significant changes in °BX, TA <strong>and</strong> A at 420 nm in<br />
peach juice; however, SC-CO2 seems to cause a slight<br />
variation in acidity, whereas SC-N2O does not seem to<br />
Supercritical CO2 <strong>and</strong> N2O pasteurisation S. Spilimbergo <strong>and</strong> L. Ciola 1623<br />
(a)<br />
N/N 0 %<br />
(b)<br />
N/N 0 %<br />
100<br />
10<br />
1<br />
0.1<br />
1E–4<br />
1E–5<br />
0 2 4 6 8 10 12 14 16 18 20<br />
100<br />
10<br />
1<br />
0.1<br />
1E–4<br />
Time (min)<br />
N 2 O<br />
CO 2<br />
1E–5<br />
0 2 4 6 8 10 12 14 16 18 20<br />
Time (min)<br />
N 2 O<br />
CO 2<br />
Figure 2 Microbial inactivation kinetics after SC-CO2 <strong>and</strong> SC-N2O<br />
at 10 MPa <strong>and</strong> 35 °C, (a) in peach juice, inoculated sample,<br />
N 0 =10 5 CFU mL )1 ; (b) in kiwi juice, uninoculated sample,<br />
N0 =10 2 CFU mL )1 .<br />
induce any. A probable reason may be the acidic<br />
property of CO2, which, after dissolution in aqueous<br />
phase, probably induces a decrease in solution pH<br />
whereas N2O does not.<br />
In whole, both SC treatments do not cause significant<br />
chemical-physical alterations in peach juice, especially<br />
with regard to A, where a variation within 0.061 <strong>and</strong><br />
0.012 after CO 2 <strong>and</strong> N 2O treatment, respectively, at any<br />
pressure considered, was measured. The values correspond<br />
to a one order of magnitude purportedly less<br />
compared to thermal treatment. Table 2 shows typical<br />
absorbance variations after a thermal treatment of both<br />
peach <strong>and</strong> kiwi juice at 90 ± 5 °C for 46 s in a tube <strong>and</strong><br />
tube heat exchanger (confidential data kindly given by<br />
Trentofrutta S.p.A.). The other parameters (°BX, TA,<br />
NTU, pH) were not significantly influenced by the<br />
thermal process (data not shown).<br />
To check all chemical-physical parameters (°BX, TA,<br />
A at 420 nm, pH <strong>and</strong> NTU) of peach <strong>and</strong> kiwi juice<br />
Ó 2010 The Authors. Journal compilation Ó 2010 Institute of Food Science <strong>and</strong> Technology International Journal of Food Science <strong>and</strong> Technology 2010
1624<br />
Supercritical CO2 <strong>and</strong> N2O pasteurisation S. Spilimbergo <strong>and</strong> L. Ciola<br />
after SC treatment, additionally, sets of experiment were<br />
performed with the 310-mL reactor to collect enough<br />
sample volume. The treatments were performed at<br />
10 MPa, 35 °C <strong>and</strong> 15 min to assure total microbial<br />
inactivation (see Fig. 2a <strong>and</strong> b). Tables 3 <strong>and</strong> 4 summarise<br />
the chemical-physical data measured in peach<br />
<strong>and</strong> kiwi juices; they confirm the result of Table 1 – no<br />
significant modification in °BX, TA or A – <strong>and</strong><br />
demonstrate no NTU or pH variations in peach <strong>and</strong><br />
kiwi juice after SC treatments, compared to the control.<br />
Our results, in accordance with previous works<br />
(Ferrentino et al., 2009; Gasperi et al., 2009), demonstrate<br />
that SC treatments have less effect than thermal<br />
treatments on peach <strong>and</strong> kiwi juices properties.<br />
Organoleptic analysis<br />
Organoleptic analyses have been performed on untreated<br />
<strong>and</strong> treated samples. Peach juice treated samples<br />
with both gases were compared to the control; they<br />
appeared slightly lighter <strong>and</strong> clouded, SC-CO2–treated samples had the taste of hazel whereas SC-N2O treated<br />
ones did not show any modifications in taste or flavour.<br />
Concerning kiwi juice, the judges could not detect any<br />
appreciable differences between treated <strong>and</strong> untreated<br />
samples either in colour, taste or flavour after any SC<br />
treatments.<br />
The results obtained show the high potential of<br />
SC-N2O process to be exploited as a low-temperature<br />
pasteurisation technique. However, a quantitative analysis<br />
by means of a panel test should be performed to deep<br />
further the sensorial effects on peach <strong>and</strong> kiwi juices.<br />
Conclusion<br />
The effect of SC-CO2 <strong>and</strong> SC-N2O on the microbial <strong>and</strong><br />
chemical-physical quality of fresh peach <strong>and</strong> kiwi juices<br />
has been investigated.<br />
The feasibility of CO2 <strong>and</strong> N2O treatment as innovative<br />
pasteurisation technique has been confirmed: a 15-min<br />
treatment at 10 MPa <strong>and</strong> 35 °C is sufficient to assure a<br />
total inactivation of natural or inoculated (S. cerevisiae,<br />
N0 10 5 CFU mL )1 ) microorganisms in the samples.<br />
CO 2 <strong>and</strong> N 2O treatment do not modify the chemical,<br />
physical <strong>and</strong> organoleptic qualities of the fresh product.<br />
In particular, SC-N2O treated juice shows no differences<br />
in °BX, TA, pH <strong>and</strong> NTU when compared to fresh<br />
juice, whereas SC-CO 2 causes a slight impact in TA.<br />
Nevertheless, knowledge about the inactivation mechanism<br />
of SC-CO2 is still under debate. It probably<br />
involves the peculiar ability of CO 2, a lipophilic compound,<br />
to solubilise into the phospholipid bilayer of the<br />
cell membrane <strong>and</strong> to highly increase its permeability. So,<br />
CO 2 can penetrate through the membrane <strong>and</strong> hence<br />
accumulate in the cytoplasmic interior of the cells. If too<br />
much dissolved CO2 enters the cytoplasm, the cells may be<br />
unable to expel all the resulting protons <strong>and</strong> intracellular<br />
pH may start decreasing (Garcia-Gonzalez et al., 2007).<br />
As concerns SC-N2O, no mechanism has ever been<br />
postulated. What it is known so far is just that N2O isa<br />
lipophilic <strong>and</strong> anaesthetic gas which can easily penetrate<br />
through the phospholipidic cell membrane. The anaesthetic<br />
potency is closely correlated with the lipid<br />
solubility (Overton, 1901). Anaesthetics exert their<br />
primary effects by dissolving in the lipid bilayer of cell<br />
membranes inducing changes in membrane fluidity,<br />
volume <strong>and</strong> thickness (Miller, 1985).<br />
In medical practice, N2O is used as an analgesic <strong>and</strong><br />
anaesthetic gas (Leshem & Wills, 1998), binds lipids <strong>and</strong><br />
protein <strong>and</strong> inhibits some enzymes, like cytochrome<br />
c activity in mitochondrial particle isolated from seed,<br />
leaf or cellular suspension (Qadir & Hashinaga, 2001).<br />
N2O inhibits methionine synthase activity (Frasca et al.,<br />
1986) producing a methionine deficit, that alters protein<br />
synthesis in the cell <strong>and</strong> giving rise to an accumulation<br />
of homocysteine (Young et al., 1997). It is known that<br />
homocysteine has pro-oxidative activity on phospholipids<br />
in presence of some cellular ions; this reaction<br />
increases cells membrane permeability.<br />
This could be an explanation of N2O microbial<br />
inactivation effect. However, experiments are needed<br />
to confirm this hypothesis.<br />
Acknowledgments<br />
This work was supported by Provincia Autonoma di<br />
Trento project. The authors are grateful for the skilful<br />
technical assistance of Laura Genetti <strong>and</strong> Giorgia<br />
Bortolameotti <strong>and</strong> of all the technicians in the Microbiological<br />
<strong>and</strong> Chemical-Physical Laboratory (Trentofrutta<br />
S.p.A.). We also thank Giovanni Gallerani<br />
(Mace` s.r.l.) for his helpful suggestions <strong>and</strong> Claudia<br />
Contrini <strong>and</strong> Stefano Castioni for their help in carrying<br />
out the experimental runs.<br />
References<br />
Anon. (1987). RSK-Werte Die Gesamtdarstellung - Richtwerte und<br />
Schwankungsbreiten bestimmter Kennzahlen mit ueberarbeiteten<br />
Analysenmethoden - V d F Verb<strong>and</strong> der deutschen Fruchtsaftindustrie<br />
e. V. - Bonn, Verlag Flussiges Obst, Shonborn.<br />
Arao, T., Hara, Y. & Tamura, K. (2005). Effect of high pressure gas on<br />
yeast growth. Bioscience Biotechnology <strong>and</strong> Biochemistry, 69, 1365–<br />
1371.<br />
Arreola, A.G., Balaban, M.O., Wei, C.I., Peplow, A. & Marshall, M.<br />
(1991). Effect of supercritical carbon dioxide on microbial populations<br />
in single strength orange juice. Journal of Food Quality, 14, 275–284.<br />
Benitez, E.I., Genovese, D.B. & Lozano, J.E. (2007). Scattering<br />
efficiency of a cloudy apple juice: effects of particles characteristics<br />
<strong>and</strong> serum composition. Food Research International, 40, 915–922.<br />
Cano, M.P. (1992). Freezing preservation of four Spanish kiwi fruit<br />
cultivars (Actinidia chinensis, Planch): chemical aspects. Zeitschrift<br />
fuer Lebensmittel-Untersuchung und-Forschung, 196, 142–146.<br />
Cano, M.P., Marin, M.A. & De Ancos, B. (1993). Pigment <strong>and</strong> colour<br />
stability of frozen kiwi-fruit slices during prolonged storage.<br />
International Journal of Food Science <strong>and</strong> Technology 2010 Ó 2010 The Authors. Journal compilation Ó 2010 Institute of Food Science <strong>and</strong> Technology
Zeitschrift fuer Lebensmitteluntersuchung und Forschung, 197, 346–<br />
352.<br />
Chen, J.L., Zhang, J., Feng, Z.S., Song, L.J., Wu, J.H. & Hu, X.S. (2009).<br />
Influence of thermal <strong>and</strong> dense-phase carbon dioxide pasteurization<br />
on physicochemical properties <strong>and</strong> flavor compounds on hami melon<br />
juice. Journal of Agricultural <strong>and</strong> Food Chemistry, 57, 5805–5808.<br />
Damar, S. & Balaban, M.O. (2005). Cold pasteurization of coconut<br />
water with a dense phase CO2 system. In: IFT Annual Meeting Book<br />
of Abstracts. New Orleans, La. Chicago. Abstract nr 54F-2.<br />
Damar, S. & Balaban, M.O. (2006). Review of dense phase CO 2<br />
technology: microbial <strong>and</strong> enzyme inactivation, <strong>and</strong> effects on food<br />
quality. Journal of Food Science, 71, R1–R11.<br />
Del Pozo-Insfran, D., Balaban, M.O. & Talcott, S.T. (2006). Microbial<br />
stability phytochemical retention, <strong>and</strong> organoleptic attributes of<br />
dense phase CO2 processed muscadine grape juice. Journal of<br />
Agricultural <strong>and</strong> Food Chemistry, 54, 5468–5473.<br />
Dogan, C. & Erkmen, O. (2003). Ultra high hydrostatic pressure<br />
inactivation of Escherichia coli in milk, <strong>and</strong> orange <strong>and</strong> peach juices.<br />
Food Science <strong>and</strong> Technology International, 9, 403–409.<br />
El-Goorani, M.A. & Sommer, N.F. (1981). Effects of modified<br />
atmospheres on postharvest pathogens of fruits <strong>and</strong> vegetables.<br />
Horticultural Reviews, 3, 412–461.<br />
Enomoto, A., Nakamura, K., Nagai, K., Hashimoto, T. & Hakoda,<br />
M. (1997). Inactivation of food microorganisms by high-pressure<br />
carbon dioxide treatment with or without explosive decompression.<br />
Bioscience Biotechnology Biochemistry, 61, 1133–1137.<br />
Ferrentino, G., Plaza, M.L., Ramirez-Rodrigues, M., Ferrari, G. &<br />
Balaban, M.O. (2009). Effects of dense phase carbon dioxide<br />
pasteurization on the physical <strong>and</strong> quality attributes of a red<br />
grapefruit juice. Journal of Food Science, 74, E333–E341.<br />
Frasca, V., Stephenson Riazzi, B. & Matthews, R.G. (1986). In vitro<br />
inactivation of methionine synthase by nitrous oxide. Journal of<br />
Biological Chemistry, 261, 15823–15826.<br />
Fraser, D. (1951). Bursting bacteria by release of gas pressure. Nature,<br />
167, 33–34.<br />
Garcia-Gonzalez, L., Geeraerd, A.H., Spilimbergo, S., Elst, K., Van<br />
Ginneken, L. & Debevere, L. (2007). High pressure carbon dioxide<br />
inactivation of microorganisms in foods: the past, the present <strong>and</strong><br />
the future. International Journal of Food Microbiology, 117, 1–28.<br />
Garcia-Gonzalez, L., Geeraerd, A.H., Elst, K., Van Ginneken, L., Van<br />
Impe, J.F. & Debevere, L. (2009). Inactivation of naturally<br />
occurring microorganisms in liquid whole egg using high pressure<br />
carbon dioxide processing as an alternative to heat pasteurization.<br />
Journal of Supercritical Fluids, 51, 74–82.<br />
Gasperi, F., Aprea, E., Biasioli, F. et al. (2009). Effects of supercritical<br />
CO2 <strong>and</strong> N2O pasteurisation on the quality of fresh apple juice. Food<br />
Chemistry, 115, 129–136.<br />
Green, D.W. & Perry, R.H. (2008). Perry’s Chemical Engineers’<br />
H<strong>and</strong>book, 8th edn. New York, USA: McGraw-Hill.<br />
Gui, F.Q., Wu, J.H., Chen, F. et al. (2006). Change of polyphenol<br />
oxidase activity, color, <strong>and</strong> browning degree during storage of<br />
cloudy apple juice treated by supercritical carbon dioxide. European<br />
Food Research <strong>and</strong> Technology, 223, 427–432.<br />
Gunes, G., Blum, L.K. & Hotchkiss, J.H. (2005). Inactivation of yeasts<br />
in grape juice using a continuous dense phase carbon dioxide<br />
processing system. Journal of Science of Food <strong>and</strong> Agriculture, 85,<br />
2362–2368.<br />
Kincal, D., Hill, W.S., Balabam, M. et al. (2006). A continuous highpressure<br />
carbon dioxide system for cloud <strong>and</strong> quality retention in<br />
orange juice. Journal of Food Science, 71, C338–C344.<br />
Lecky, M. (2005). Shelf life evaluation of watermelon juice after<br />
processing with a continuous high pressure CO 2 system. in: IFT<br />
Annual Meeting book of Abstract, New Orleans, La. Chicago.<br />
Abstract nr 54F-5.<br />
Leshem, Y.Y. & Wills, R.H.B. (1998). Harnessing senescence <strong>and</strong><br />
delaying gases nitric oxide <strong>and</strong> nitrous oxide: a novel approach to<br />
postharvest control of fresh horticultural produce. Biologia Plantarum,<br />
41, 1–10.<br />
Supercritical CO2 <strong>and</strong> N2O pasteurisation S. Spilimbergo <strong>and</strong> L. Ciola 1625<br />
Lim, S., Yagiz, Y. & Balaban, M.O. (2006). Continuous high pressure<br />
carbon dioxide processing of m<strong>and</strong>arin juice. Food Science <strong>and</strong><br />
Biotechnology, 15, 13–18.<br />
Miller, K.W. (1985). The nature of the site of general anesthesia. In:<br />
International Review of Neurobiology (edited by J. Smythies & R.<br />
Bradley). Pp. 1–61. Vol. 27. Orl<strong>and</strong>o, FL: Academic Press.<br />
Morais, I.P.A., Toth, I.V. & Rangel, A.O.S.S. (2006). Turbidimetric<br />
<strong>and</strong> nephelometric flow analysis: concepts <strong>and</strong> applications. Spectroscopy<br />
Letters, 39, 547–579.<br />
Overton, E. (1901). Studien uber die Narkose Zugleich ein Beitrag zur<br />
Allgemeinen Pharmakologie. Jena, Germany: Gustav Fischer Verlag<br />
Jena GmbH.<br />
Park, S.-J., Lee, J.-I. & Park, J. (2002). Effects of a combined process<br />
of high-pressure carbon dioxide <strong>and</strong> high hydrostatic pressure on the<br />
quality of carrot juice. Food Engineering <strong>and</strong> Physical Properties, 67,<br />
1827–1834.<br />
Poretta, S. (2000). Analisi sensoriale & consumer science. Edited by<br />
Chirotti Editor, Pinerolo (TO), Italy.<br />
Qadir, A. & Hashinaga, F. (2001). Inhibition of postharvest decay of fruits<br />
by nitrous oxide. Postharvest Biology <strong>and</strong> Technology, 22, 279–283.<br />
Raso, J. & Barbosa-Canovas, G.V. (2003). Nonthermal preservation<br />
of foods using combined processing techniques. Critical Reviews in<br />
Food Science <strong>and</strong> Nutrition, 43, 265–285.<br />
Riu-Aumatell, M., Lopez-Tamames, E. & Buxaderas, S. (2005).<br />
Assessment of the volatile composition of juices of apricot, peach<br />
<strong>and</strong> pear according to two pectolytic treatments. Journal of<br />
Agricultural <strong>and</strong> Food Chemistry, 53, 7837–7843.<br />
Speck, M.L., Ray, B. & Read, R.B. (1975). Repair <strong>and</strong> enumeration of<br />
injured coliforms by a plating procedure. Applied Microbiology, 29,<br />
549–550.<br />
Spilimbergo, S. & Bertucco, A. (2003a). Non-thermal microbial<br />
inactivation with dense CO2. Biotechnologies <strong>and</strong> Bioengineering,<br />
84, 627–638.<br />
Spilimbergo, S. & Mantoan, D. (2006). Kinetic analysis of microorganisms<br />
inactivation in apple juice by high pressure carbon dioxide.<br />
International Journal of Food Engineering, 2, 6.<br />
Spilimbergo, S., Elvassore, N. & Bertucco, A. (2003b). Inactivation of<br />
microorganisms by supercritical CO2 in a semi-continuous process.<br />
Italian Journal of Food Science, 15, 115–124.<br />
Spilimbergo, S., Mantoan, D. & Dalser, A. (2007a). Supercritical gases<br />
pasteurization of apple juice. Journal of Supercritical Fluids, 40, 485–<br />
489.<br />
Spilimbergo, S., Mantoan, D. & Cavazza, A. (2007b). Yeast inactivation<br />
in fresh apple juice by high pressure nitrous oxide. International<br />
Journal of Food Engineering, 3, n2.<br />
Sumitani, H., Suekane, S., Nakatani, A. & Tatsuka, K. (1994). Changes<br />
in composition of volatile compounds in high pressure treated peach.<br />
Journal of Agricultural <strong>and</strong> Food Chemistry, 42, 785–790.<br />
Sun, D. (2003). An improved model calculating CO 2 solubility in pure<br />
water <strong>and</strong> aqueous NaCl solution from 273 to 533 K <strong>and</strong> from 0 to<br />
2000 bar. Chemical Geology, 193, 257–271.<br />
Tasselli, F., Cassano, A. & Drioli, E. (2007). Ultrafiltration of kiwifruit<br />
juice using modified poly(ether ether ketone) hollow fibre membranes.<br />
Separation <strong>and</strong> Purification Technology, 57, 94–102.<br />
Van Ginneken, L., Weyten, H., Willems, L. & Lodewijckx, B. (2002).<br />
In: Method <strong>and</strong> Apparatus for the Inactivation of Microorganisms in<br />
Liquid Food <strong>and</strong> Feed Products. Vol. (Ed. WO Patent 2004 ⁄ 039180<br />
A1) (May 13).<br />
Wei, C.I., Balaban, M.O., Fern<strong>and</strong>o, S.Y. & Peplow, A.J. (1991).<br />
Bacterial effect of high-pressure CO2 treatment on foods spiked with<br />
Listeria or Salmonella. Journal of Food Protection, 4, 189–193.<br />
Young, P.B., Kennedy, S., Molloy, A.M., Scott, J.M., Weir, D.G. &<br />
Kennedy, D.G. (1997). Lipid peroxidation induced in vivo by<br />
hyperhomocysteinaemia in pigs. Atherosclerosis, 129, 67–71.<br />
Zhong, Q.X., Blanck, D.G., Davidson, P.M. & Golden, D.A. (2008).<br />
Nonthermal inactivation of Escherichia coli K-12 on spinach leaves,<br />
using dense phase carbon dioxide. Journal of Food Protection, 7,<br />
1015–1017.<br />
Ó 2010 The Authors. Journal compilation Ó 2010 Institute of Food Science <strong>and</strong> Technology International Journal of Food Science <strong>and</strong> Technology 2010
1626<br />
Original article<br />
Determination of biochemical properties of foam-mat dried mango<br />
powder<br />
Dattatreya M. Kadam,* Robin A. Wilson & Sum<strong>and</strong>eep Kaur<br />
Central Institute of Post-Harvest Engineering <strong>and</strong> Technology (CIPHET), PO: PAU, Ludhiana-141004, Punjab, India<br />
(Received 12 January 2010; Accepted in revised form 6 May 2010)<br />
Summary Investigations were carried out to see the impact of drying air temperature (65, 75 <strong>and</strong> 85 °C) <strong>and</strong> milk as<br />
foaming agent in different concentration levels (0%, 10%, 15%, 20% <strong>and</strong> 25%) on the chemical properties of<br />
foam-mat dried mango juice powder. Chemical properties such as total sugars, ascorbic acid, total carotenes,<br />
minerals, total acid, pH, total soluble solids (TSS) <strong>and</strong> microbial load (fungal <strong>and</strong> bacterial) of foam-mat<br />
dried mango powder were determined. Data were analysed as per two-way anova, Duncan’s multiple range<br />
test <strong>and</strong> l.s.d. of AgRes Software statistical package. Almost all chemical properties show decreasing trend<br />
with increase in drying air temperature. Microbial load was not detected in foam-mat dried mango powder.<br />
It was found that addition of 10% milk as foaming agent <strong>and</strong> drying at 65 °C temperature gave better<br />
results.<br />
Keywords Chemical properties, drying, foam-mat, foaming, microbial load, milk.<br />
Introduction<br />
Mango (Mangifera indica L.) is an important tropical<br />
fruit crop normally accredited with king of fruits. India<br />
is the largest producer of the mango, <strong>and</strong> it contributes<br />
37% of total 30.5 million tons of global production.<br />
Annually, India exports about 50 000 tons mangoes to<br />
different parts of the world including Middle East,<br />
Europe <strong>and</strong> United States (P<strong>and</strong>it et al., 2009), <strong>and</strong> its<br />
dem<strong>and</strong> is increasing all the time. Compared with<br />
several temperate fruits, the tropical <strong>and</strong> subtropical<br />
fruit such as mango presents greater problems in storage<br />
<strong>and</strong> transportation because of its perishable nature<br />
(Mitra & Baldwin, 1997). The production, marketing<br />
<strong>and</strong> consumption of mango fruits are restricted because<br />
of improper h<strong>and</strong>ling, inadequate transport <strong>and</strong> storage<br />
facility, disease problems <strong>and</strong> sensitivity to low storage<br />
temperature (Mitra & Baldwin, 1997). Products derived<br />
from mango fruit are increasingly used in beverage,<br />
dairy <strong>and</strong> confectionery industries, where fruit purees<br />
<strong>and</strong> concentrate are the major intermediates. Dehydrated<br />
powders can be reconstituted into juice <strong>and</strong><br />
used as a starter for the preparation of products like<br />
beverages <strong>and</strong> baby foods. Thus, dehydrated mango<br />
juices have promising <strong>and</strong> potential scope in domestic<br />
*Correspondent: Fax: +91 161 2308670;<br />
e-mails: kadam1k@yahoo.com, kadam1k@gmail.com<br />
International Journal of Food Science <strong>and</strong> Technology 2010, 45, 1626–1632<br />
<strong>and</strong> international market (Kadam & Balasubramanian,<br />
2010).<br />
Drying is an important post-harvest technology<br />
among the agricultural processing technologies. The<br />
major objective in drying agricultural products is<br />
the reduction in moisture content, weight <strong>and</strong> volume,<br />
minimising packaging, storage <strong>and</strong> transportation costs<br />
(Okos et al., 1992; Singh, 1994 <strong>and</strong> Kadam et al., 2008).<br />
The traditional drying methods viz. sun drying require<br />
long drying time <strong>and</strong> final product may be contaminated<br />
from dusts, insects <strong>and</strong> microbes. Thus, an alternative<br />
method of drying such as foam mat drying is a beneficial<br />
process of mango juice preservation in the form of<br />
powder.<br />
Foaming of liquid <strong>and</strong> semi-liquid materials has long<br />
been recognised as one of the efficient methods to<br />
shorten drying time. Over the past decade, this<br />
relatively old technology, known as foam-mat drying,<br />
received renewed attention because of its added ability<br />
to process hard-to-dry materials to produce products of<br />
desired properties, retaining its volatiles that otherwise<br />
would be lost during the drying of non-foamed<br />
materials (Ratti & Kudra, 2006; Kadam & Balasubramanian,<br />
2010). Thus, current research is directed not<br />
only to convective drying of purposely foamed materials<br />
in spray dryers, plate dryers <strong>and</strong> b<strong>and</strong> dryers but<br />
also to conventional freeze-drying, as well as microwave<br />
drying of frozen foams with <strong>and</strong> without dielectric<br />
inserts as complementary heat sources (Ratti &<br />
doi:10.1111/j.1365-2621.2010.02308.x<br />
Ó 2010 Institute of Food Science <strong>and</strong> Technology
Kudra, 2006). Foam-mat drying involves the incorporation<br />
of foaming agent into liquid foods with<br />
subsequent whipping to form stiff foam (Morgan et al.,<br />
1961; Hart et al., 1963). In general, drying rate of<br />
foamed materials is faster than non-foamed materials<br />
<strong>and</strong> is greatly accelerated at the end. Many researchers<br />
have reported that the increased interfacial areas of<br />
foamed materials are the responsible factors for its<br />
induced drying rate. Certain foams such as the ones<br />
from soymilk (Akintoye & Oguntunde, 1991) or starfruit<br />
(Karim & Wai, 1999) exhibit higher drying rates in<br />
the beginning of foam-mat drying, whereas for other<br />
materials such as tomato paste (Lewicki, 1975), tomato<br />
juice (Kadam & Balasubramanian, 2010), bananas<br />
(Sankat & Castaigne, 2004) <strong>and</strong> mango (Cooke et al.,<br />
1976), drying rates are greatly accelerated at the end of<br />
drying.<br />
Mango is prone to post-harvest losses. Thus, technology<br />
is needed to be developed that can reduce such<br />
losses during transportation <strong>and</strong> storage. Foam-mat<br />
drying is an alternative way to preserve the quality<br />
<strong>and</strong> also to add value to the mango. In spite of its<br />
importance, the information on the foam drying of<br />
mango has received less attention. The objectives of this<br />
study were to study the effect of foam-mat drying air<br />
temperature <strong>and</strong> foaming concentration on some chemical<br />
properties <strong>and</strong> quality of foam-mat dried mango<br />
juice powder.<br />
Material <strong>and</strong> methods<br />
Foam-mat drying of mango juice experiment was<br />
carried out at Central Institute of Post-Harvest Engi-<br />
neering <strong>and</strong> Technology (CIPHET), Ludhiana, Punjab<br />
(India) using tray dryer to prepare a mango powder.<br />
Mango juice powder preparation<br />
Ripe mangoes (M. indica L.) were purchased from the<br />
local market of Ludhiana. Fruits of similar ripeness,<br />
having uniform visual quality <strong>and</strong> size were selected.<br />
Mangoes were subjected to washing with running water,<br />
peeling of skin <strong>and</strong> stone removal before juice ⁄ pulp<br />
preparation using mixer. Foaming was achieved adding<br />
liquid milk (0%, 10%, 15%, 20% <strong>and</strong> 25% concentrations)<br />
having solid non fat (SNF) – 8.5%, fat – 4.5%,<br />
minerals – 0.6%, carbohydrates – 4.6% <strong>and</strong> proteins –<br />
¼<br />
Quality of foam-mat dried mango powder D. M. Kadam et al. 1627<br />
3.3%, pasteurised st<strong>and</strong>ardised milk, processed by Verka,<br />
Milkfed, Verka milk Plant, Ludhiana, in homogenised<br />
mango juice using h<strong>and</strong> blender for 3 min whipping to<br />
obtain consistent foam. Foamed juice was poured in<br />
food-grade stainless steel trays <strong>and</strong> spread to obtain<br />
3-mm-thick foam-mat <strong>and</strong> dried at 65, 75 <strong>and</strong> 85 °C air<br />
temperature in tray dryer. The dried product was scraped<br />
<strong>and</strong> pulverised before packing for further studies.<br />
Rehydration for sample preparation<br />
Foam-mat dried mango powder was reconstituted in<br />
distilled water in the ratio of 1.2: 10 (Mango Powder:<br />
Water) <strong>and</strong> was used for estimations of chemical<br />
properties such as total sugar, ascorbic acid, total<br />
carotene content, minerals, titratable acidity, pH <strong>and</strong><br />
microbial load (fungi <strong>and</strong> bacteria).<br />
Chemical properties determination<br />
Total sugar<br />
Estimation of total carbohydrates was done using<br />
phenol–sulphuric acid method (Sadasivam & Manikam,<br />
1996). Reconstituted sample was appropriately diluted<br />
from which 0.1 mL was further diluted to 1 mL with<br />
distilled water. To this, 1 mL of 5% phenol was added<br />
followed by addition of 5 mL of H2SO4 after 10 min.<br />
Test tubes were incubated at 37 °C for 30 min, <strong>and</strong><br />
absorbance was noted at 490 nm against reagent blank<br />
on UV visible spectrophotometer (LABINDIA UV-<br />
3000 + ,UV⁄ VIS Spectrophotometer, Thane, India). Percentage<br />
of total carbohydrates was worked out from the<br />
st<strong>and</strong>ard curve of glucose <strong>and</strong> calculated as:<br />
Sugar value from the graph ðlgÞ Total volume of extract ðmLÞ<br />
Total sugarð%Þ ¼<br />
Aliquot of the sample used ðmLÞ Volume of sample 1000<br />
Ascorbic acid<br />
Ascorbic acid of foam-mat dried powder was estimated<br />
using 2, 6 dichlorophenol-indophenol visual titration<br />
method (Sadasivam & Manikam, 1996). Aliquot of the<br />
reconstituted sample was diluted to a fixed volume with<br />
3% HPO 3 <strong>and</strong> then titrated with 2, 6 dichlorophenolindophenol.<br />
St<strong>and</strong>ard ascorbic acid solution of 5 mL<br />
was added to 5 mL of HPO3 <strong>and</strong> titrated with dye<br />
solution to a pink colour, which persisted for 15 s. The<br />
dye factor was determined, i.e. mg of ascorbic acid<br />
per mL of the dye, using the formula: Dye factor<br />
= 0.5 per titre.<br />
Ascorbic acid (mg per 100 ml) of reconstituted juice<br />
was calculated using the formula:<br />
Titre Dye factor Volume made up 100<br />
Aliquot of extract taken for estimation Weight or volume of sample taken for estimation<br />
Ó 2010 Institute of Food Science <strong>and</strong> Technology International Journal of Food Science <strong>and</strong> Technology 2010, 45, 1626–1632
1628<br />
Quality of foam-mat dried mango powder D. M. Kadam et al.<br />
Total carotene content<br />
Carotene was estimated following <strong>and</strong> modifying the<br />
method of Rangana (1995). Dry mango powder<br />
(500 mg) was homogenised <strong>and</strong> agitated with 5 mL of<br />
acetone ⁄ hexane (4:6), allowed to settle down <strong>and</strong> then<br />
supernatant was decanted. The procedure was repeated<br />
until no colour was obtained, <strong>and</strong> supernatants were<br />
pooled <strong>and</strong> final volume was made up to 10 mL. The<br />
absorption of supernatant was recorded at 490 nm on<br />
UV visible spectrophotometer. Carotene content was<br />
calculated as follows:<br />
Carotene ðmg per 100 gÞ ¼<br />
pH <strong>and</strong> titratable acidity<br />
Digital pH meter was used to measure the pH of the<br />
samples, <strong>and</strong> titratable acidity of reconstituted sample<br />
was estimated diluting the aliquot of the sample with<br />
water to a fixed volume <strong>and</strong> then titrated with 0.1 N<br />
NaOH using phenolphthalein as an indicator. Percentage<br />
acidity was calculated as the percentage of anhydrous<br />
citric acid using the formula:<br />
Minerals<br />
Ash solution<br />
Food samples (5 g) in triplicate were taken in crucibles.<br />
These were burnt on hot plate <strong>and</strong> were placed in an<br />
electric muffle furnace at 600 °C for 6 h. After cooling<br />
the crucibles to room temperature in desiccator, the ash<br />
in the crucibles is dissolved in 25 mL of dilute hydrochloric<br />
acid (1:4) on a water bath. The contents are<br />
transferred to 250-mL volumetric flask <strong>and</strong> the volume<br />
is made up. The above solution was filtered <strong>and</strong> used as<br />
ash solution for the estimation of calcium, iron <strong>and</strong><br />
phosphorous.<br />
Calcium (AOAC, 1980)<br />
To 50 mL of ash solution, 10 mL of saturated ammonium<br />
oxalate solution was added. Two drops of methyl<br />
red indicator was added after boiling, <strong>and</strong> dilute ammonium<br />
hydroxide (1:1) was added to neutralise. Crystalline<br />
precipitates were obtained after boiling followed by<br />
the addition of few drops of dilute HCl (1:4) until the<br />
colour was faint pink. After overnight st<strong>and</strong>ing, precipitates<br />
were filtered through Whatman filter paper no. 42<br />
<strong>and</strong> washed thoroughly with hot distilled water till the<br />
precipitates are free of oxalates (tested with silver nitrate<br />
solution). The precipitates along with the filter paper are<br />
added in the original beaker dissolved in 20 mL of 10%<br />
H 2SO 4. The contents are heated to about 70 °C <strong>and</strong><br />
titrated against 0.1 N KMnO4 to faint pink colour. One<br />
millilitre of KMnO4 used is equivalent to the product of<br />
0.002 g of calcium <strong>and</strong> dilution factor.<br />
Iron (AOAC, 1980)<br />
Ten millilitres of ash solution was pipetted out into the<br />
25-mL volumetric flask, <strong>and</strong> 1 mL of 10% hydroxylamine<br />
hydrochloride solution was added. After a few<br />
minutes, 5 mL of acetate buffer solution <strong>and</strong> 1 mL of<br />
concentration of carotene in solution as read from st<strong>and</strong>ard curve (mg/mL) Final volume Optical density 100<br />
Weight of sample taken ðgÞ 1000<br />
0.1% ortho-phenanthroline solution were added. The<br />
contents are mixed, <strong>and</strong> the volume is made up with<br />
distilled water up to the mark. The intensity of the<br />
colour developed is measured at 452 nm. In the place of<br />
sample, 10 mL of HCl (2 mL per 100 mL) was taken<br />
<strong>and</strong> treated as blank. The concentration of iron in the<br />
known sample is calculated from the st<strong>and</strong>ard curve <strong>and</strong><br />
is multiplied by the dilution factor.<br />
Titre Normality of alkali Volume made up Equivalent weight of acid 100<br />
Total acid ð%Þ ¼<br />
Volume of sample taken for estimation Weight or volume of sample taken 1000<br />
Phosphorus (Fisher, 1971)<br />
Ash solution of 0.2 mL was diluted to 1 mL with<br />
distilled water. To this, 2 mL of ammonium molybdate<br />
solution (25 g ammonium molybdate per 300 mL +<br />
75 mL concentrated H 2SO 4 per 200 mL), 1 mL of<br />
(0.5%) hydroquinone <strong>and</strong> 1 mL of 20% sodium sulphate<br />
solution are added <strong>and</strong> mixed, followed by the<br />
addition of 5 mL of distilled water. Absorbance of the<br />
solution was observed at 660 nm against a reagent<br />
blank. The concentration of phosphorous in the known<br />
sample is calculated from the st<strong>and</strong>ard curve <strong>and</strong> is<br />
multiplied by the dilution factor.<br />
Total soluble solids<br />
TSS of the rehydrated mango juice sample (1.2:10 i.e.<br />
mango powder ⁄ water) was measured with the help of<br />
h<strong>and</strong> refractrometer.<br />
Microbial load (fungal <strong>and</strong> bacterial)<br />
Microbial load analyses of reconstituted samples were<br />
done for fungal <strong>and</strong> bacterial load. For fungal <strong>and</strong><br />
bacterial load, Mortin Rose Bengal agar [peptone (5 g),<br />
glucose (10.0 g), KH2PO4 (1 g), MgSO4 7H2O (0.5 g),<br />
Rose Bengal (0.035 g) <strong>and</strong> agar (18.0 g) were dissolved<br />
International Journal of Food Science <strong>and</strong> Technology 2010, 45, 1626–1632 Ó 2010 Institute of Food Science <strong>and</strong> Technology
in 1000 mL of distilled water] <strong>and</strong> st<strong>and</strong>ard plate count<br />
agar [peptone ⁄ trypton (5 g), yeast extract (2.5 g), beef<br />
extract (2.0 g), glucose (10.0 g) <strong>and</strong> agar (18.0 g) were<br />
dissolved in 1000 mL of water] media were used,<br />
respectively. Water blanks were prepared by adding<br />
1.0 g of sample to 10 mL of autoclaved water. For dry<br />
powder <strong>and</strong> fresh juice samples, the dilution was made<br />
up to 10 )1 <strong>and</strong> 10 )2 , respectively, for both enumerations<br />
of fungi <strong>and</strong> bacteria. From different dilutions made<br />
from different samples, 1 mL was poured into each petri<br />
dish followed by the addition of 20–25 mL of media.<br />
The petri dish was circumvolved for proper mixing. The<br />
plates were allowed to solidify <strong>and</strong> then kept in<br />
incubator at 37 <strong>and</strong> 30 °C for bacteria <strong>and</strong> fungi,<br />
respectively. Colonies were counted after 72 <strong>and</strong> 24 h<br />
for fungi <strong>and</strong> bacteria, respectively.<br />
Statistical analysis<br />
Chemical properties <strong>and</strong> microbial load evaluation were<br />
carried out to check the effect of treatments <strong>and</strong> safety<br />
of food quality in terms of fungal <strong>and</strong> bacterial loads.<br />
Data were analysed as per two-way anova, Duncan’s<br />
multiple range test (DMRT) <strong>and</strong> l.s.d. of AgRes<br />
Software statistical package for microbial load <strong>and</strong><br />
chemical properties, respectively, to get the best treatment.<br />
Quality of foam-mat dried mango powder D. M. Kadam et al. 1629<br />
Results <strong>and</strong> discussions<br />
Total sugar<br />
Fresh mangoes have sugar concentration of about<br />
40–41%. In this study, the gr<strong>and</strong> mean sugar content<br />
was 31.35%. Higher temperature treatments resulted in<br />
decrease in sugar concentrations, which could be<br />
attributed to Maillard reactions. Temperature treatments<br />
do have some negative effect on the sugar<br />
concentrations (Table 1). Sugar content of foam-mat<br />
dried mango powder at 65 °C air temperature was the<br />
best, followed by 85 <strong>and</strong> 75 °C air temperature. Sugar<br />
content was higher at 85 °C when compared to 75 °C,<br />
because although the temperature was high, the duration<br />
of drying was short at 85 °C. In case of foam-mat<br />
dried mango at 65 °C air temperature treatment, the<br />
time duration was longer than those of the two highertemperature<br />
treatments but was compensated by low<br />
temperature. Generally, there was a decreasing trend of<br />
sugars with increasing concentrations of milk. Among<br />
concentrations, 5% milk was the best. Decrease in<br />
sugar content with the increasing concentration of<br />
milk could be owed to the increase in protein content,<br />
which in turn was because of added milk that leads<br />
to higher chance of Maillard reaction. Pooled l.s.d.<br />
results showed that 15% milk at 65 °C was the best<br />
Table 1 Effect of drying air temperatures <strong>and</strong> milk as foaming agent on some chemical properties of foam-mat dried mango powder<br />
Temperature (°C) Milk (%) Sugar (%) Ascorbic acid (mg per 100 g) Total carotenes (mg per 100 g)* Total acid (%) pH<br />
65 0 41.354 a<br />
5.600 a<br />
12.055 0.079 d<br />
6.687 a<br />
10 40.080 b<br />
4.800 b<br />
10.547 0.091 c<br />
6.327 b<br />
15 39.285 c<br />
4.800 b<br />
9.719 0.091 c<br />
6.190 d<br />
20 37.344 e<br />
4.800 b<br />
9.166 0.091 c<br />
6.077 f<br />
25 35.493 g<br />
4.800 b<br />
7.236 0.091 c<br />
5.853 j<br />
75 0 41.328 h<br />
4.053 c<br />
3.700 0.117 b<br />
5.403 k<br />
10 31.504 j<br />
3.200 d<br />
3.539 0.125 a<br />
5.337 l<br />
15 28.346 m<br />
3.200 d<br />
3.294 0.125 a<br />
5.230 m<br />
20 26.133 n<br />
3.200 d<br />
3.047 0.125 a<br />
5.220 n<br />
25 22.912 o<br />
3.200 d<br />
2.880 0.125 a<br />
5.203 o<br />
85 0 41.397 d<br />
3.200 d<br />
6.489 0.065 e<br />
6.227 c<br />
10 35.562 f<br />
3.200 d<br />
3.225 0.065 e<br />
6.170 e<br />
15 35.146 i<br />
3.200 d<br />
2.936 0.090 c<br />
6.050 g<br />
20 29.168 k<br />
3.200 d<br />
2.641 0.090 c<br />
6.007 h<br />
25 27.882 l<br />
3.200 d<br />
2.452 0.090 c<br />
5.943 i<br />
SED (T) 0.011 0.004 1.595 0.001 0.002<br />
SED (C) 0.014 0.006 2.060 0.002 0.003<br />
SED (T · C) 0.025 0.009 3.568 0.003 0.004<br />
CD (0.05) (T) 0.023 0.009 3.259 0.003 0.004<br />
CD (0.05) (C) 0.029 0.011 4.207 0.004 0.005<br />
CD (0.05) (T · C) 0.051 0.019 7.287 0.007 0.009<br />
Superscripts a, b, c, d ….. indicate the best performing treatment followed by poor performing treatments. Mean values with the same superscript<br />
letters are not significantly different.<br />
*Indicates non-significant effect of milk concentrations on carotenes.<br />
Ó 2010 Institute of Food Science <strong>and</strong> Technology International Journal of Food Science <strong>and</strong> Technology 2010, 45, 1626–1632
1630<br />
Quality of foam-mat dried mango powder D. M. Kadam et al.<br />
treatment. Marwaha & P<strong>and</strong>ey (2006) reported similar<br />
decline in sugar content during the preparation of<br />
dehydrated chips, <strong>and</strong> Leite et al. (2007) in banana<br />
drying, <strong>and</strong> Bondaruk et al. (2007) in dried potato<br />
cubes.<br />
Ascorbic acid<br />
Ascorbic acid content of fresh mangoes ranged<br />
between 23 <strong>and</strong> 25 mg per 100 g fresh weight of<br />
sample. In this study, the average ascorbic acid content<br />
was about 3.844 mg per 100 mL of reconstituted sample<br />
that corresponds to about 32.03 mg per 100 g of<br />
dried powder. The temperature treatments resulted in<br />
decrease in ascorbic acid content of the mango powder<br />
(Table 1). Degradation was highest in case of 85 °C<br />
treatment, which becomes less pronounced at 75 °C<br />
<strong>and</strong> least at 65 °C. Mean comparison by l.s.d. showed<br />
that the 65 °C temperature was the best among the<br />
three temperatures. Additions of milk at different concentrations<br />
as foaming agents did not have any marked<br />
effect on the ascorbic acid content of the dried mango<br />
powder. Mean comparison by l.s.d. showed that milk<br />
at the rate of 10–25% has equal effect on the ascorbic<br />
acid content of the powder. Even the control sample<br />
showed higher ascorbic acid content when compared to<br />
the milk-added samples. Pooled l.s.d. results showed<br />
that 10% milk at 65 °C was the best treatment among<br />
milk concentrations as well as at different temperatures.<br />
The decrease in ascorbic acid content of foammat<br />
dried mango powder could be because of its<br />
heat-sensitive nature. Similar decline in ascorbic acid<br />
content was noticed in other studies with potato<br />
(Marwaha & P<strong>and</strong>ey, 2006), pulses (Mehta et al.,<br />
2007), muskmelon (Fern<strong>and</strong>ez et al., 2007), cauliflower<br />
(Kadam et al., 2005) <strong>and</strong> onion (Kadam et al., 2009)<br />
following heat treatment.<br />
Total carotenes<br />
The overall mean of the total carotene content was<br />
6.177 mg per 100 g of the dry mango powder. With the<br />
increase in temperature, the carotene content decreased<br />
with highest content at 65 °C followed by 75 °C <strong>and</strong><br />
then 85 °C (Table 1). This was supported by the l.s.d.<br />
analysis, which showed that 65 °C treatment is the best<br />
among the three temperature treatments. With the<br />
addition of milk, there was a decreasing trend virtually,<br />
but statistically, addition of milk at all concentrations<br />
did not have any significant change in the carotene<br />
content at P < 0.05 level of significance. Such decline in<br />
carotene content was observed by Chen et al. (2007)<br />
in Taiwanese mango, Hymavathi & Khader (2005) in<br />
dehydrated ripe mango powder, Wen-pingI et al. (2008)<br />
in fruits of Lycjum barbarum, <strong>and</strong> Lavelli et al. (2007) in<br />
dehydrated carrots.<br />
Titratable acidity<br />
Mean total acid (%) in the mango powder of this study<br />
was about 0.097%. There was no apparent trend with<br />
the temperature treatments affecting the titratable acidity<br />
of the powder (Table 1). However, statistically,<br />
75 °C was the one with the highest total acid (%) <strong>and</strong><br />
was the best, followed by 65 <strong>and</strong> 85 °C drying treatment.<br />
Addition of milk at different concentrations<br />
resulted in a minor increase in the total acid (%) only<br />
in the initial one or two concentrations. Further rise in<br />
concentrations did not add to any total acid (%) rise.<br />
Various researchers with peanuts (Tsai et al., 2007),<br />
apples (Pereira et al., 2008) <strong>and</strong> tomatoes (Radwan &<br />
Lobna, 2002) reported similar results of total acid (%)<br />
decline.<br />
pH<br />
The overall mean pH content of the foam-mat dried<br />
mango powder was 5.862. There was a decreasing trend<br />
in the pH of the dried mango powder with the addition<br />
of foaming agents (Table 1). Effect of different foaming<br />
agents as well as different concentration levels was<br />
highly significant (P < 0.01) at all temperatures. Pooled<br />
l.s.d. analysis showed that among different milk concentrations,<br />
10% milk at 65 °C showed the highest pH<br />
content, whereas 25% milk at 75 °C showed the lowest<br />
pH content.<br />
Minerals<br />
Concentration of calcium in fresh mango is about<br />
10 mg per 100 g fresh weight. The mean calcium content<br />
of the mango powder was 296.89 mg per 100 g dry<br />
powder. The calcium content at 65 °C was the highest<br />
among the three temperature treatments (Table 2).<br />
Mean comparison by l.s.d. showed that the temperature<br />
treatments differ significantly at P < 0.01 level of<br />
significance. Calcium concentration enhanced linearly<br />
with the addition of milk at all concentrations of milk.<br />
This could be attributed to the calcium contribution by<br />
milk, which has calcium concentration of about<br />
113 mg per 100 g. This is further supported by the<br />
statistical analysis showing that treatment with 25%<br />
milk had the highest concentration of calcium. Pooled<br />
analysis by l.s.d. showed that 25% milk at 65 °C was the<br />
best treatment regarding calcium concentration.<br />
Iron concentration in fresh mangoes is about<br />
0.13 mg per 100 g fresh weight. The overall average<br />
iron content in foam-mat dried mango powder was<br />
97.05 mg per 100 g dry powder. All treatments with<br />
different temperatures <strong>and</strong> different concentrations of<br />
milk have significant (P < 0.01) effect on the iron<br />
concentration of the dry powder (Table 2). The iron<br />
concentration usually declined with the increasing<br />
International Journal of Food Science <strong>and</strong> Technology 2010, 45, 1626–1632 Ó 2010 Institute of Food Science <strong>and</strong> Technology
Table 2 Effect of drying air temperatures <strong>and</strong> milk as foaming agent on mineral properties <strong>and</strong> TSS of foam-mat dried mango powder<br />
Temperature (°C) Milk (%) Calcium (mg per 100 g) Iron (mg per 100 g) Phosphorous (mg per 100 g) TSS (°Brix)<br />
65 0 226.667 j<br />
128.204 a<br />
88.912 j<br />
9.100 a<br />
10 286.667 g<br />
122.653 b<br />
102.482 i<br />
9.000 b<br />
15 340.000 e<br />
115.536 c<br />
121.480 g<br />
8.800 d<br />
20 406.667 c<br />
111.123 d<br />
138.443 e<br />
8.600 f<br />
25 486.667 a<br />
106.853 f<br />
154.389 d<br />
8.400 h<br />
75 0 140.000 m<br />
109.842 e<br />
115.035 h<br />
9.000 b<br />
10 180.000 l<br />
83.509 k<br />
137.426 e<br />
9.000 b<br />
15 210.000 k<br />
80.378 l<br />
153.371 d<br />
8.867 c<br />
20 246.667 i<br />
79.523 l<br />
177.797 b<br />
8.733 e<br />
25 283.333 g<br />
78.954 m<br />
188.654 a<br />
8.533 g<br />
85 0 243.333 i<br />
98.455 g<br />
81.787 k<br />
9.000 b<br />
10 270.000 h<br />
91.053 h<br />
104.178 i<br />
9.000 b<br />
15 300.000 f<br />
86.925 i<br />
126.909 f<br />
8.800 d<br />
20 386.667 d<br />
85.359 j<br />
137.086 e<br />
8.600 f<br />
25 446.667 b<br />
77.388 n<br />
163.548 c<br />
8.400 h<br />
SED (T) 2.309 0.195 0.731 0.009<br />
SED (C) 2.981 0.253 0.943 0.012<br />
SED (T · C) 5.165 0.438 1.634 0.021<br />
CD (0.05) (T) 4.716 0.400 1.429 0.019<br />
CD (0.05) (C) 6.089 0.516 1.927 0.025<br />
CD (0.05) (T · C) 10.546 0.894 3.337 0.043<br />
concentrations of milk. Pooled analysis showed that<br />
foam-mat dried mango at 65 °C air temperature with<br />
10% milk as foaming agent was the best.<br />
Fresh mangoes have about 11 mg per 100 g (fresh<br />
weight) of phosphorous. In this study, the overall<br />
phosphorous content of the foam-mat dried mango<br />
powder was about 132.767 mg per 100 g dry powder.<br />
Phosphorous concentration augmented with the addition<br />
of milk as foaming agent that went on increasing as<br />
we move from lower milk concentration to the highest<br />
(Table 2). Temperatures do have a significant (P <<br />
0.01) effect on the concentration of phosphorous with<br />
65 °C being the best among the three temperatures.<br />
Pooled mean comparison by l.s.d. showed that foamed<br />
mango juice dried at 65 °C with 25% milk as foaming<br />
agent was the best.<br />
Total soluble solids<br />
The mean TSS of the foam-mat dried mango powder<br />
was 8.79°Brix ranging from 8.4 to 9.1°Brix (Table 2).<br />
The TSS has a decreasing trend with the increasing<br />
concentrations of the milk. All treatments with different<br />
temperatures <strong>and</strong> different concentrations of milk have<br />
significant (P < 0.01) effect on the TSS of the dry<br />
powder. Mean comparison by l.s.d. showed that foamed<br />
mango juice dried at 65 °C with 10% milk as foaming<br />
agent was the best with highest TSS among different<br />
temperatures <strong>and</strong> milk concentrations.<br />
Microbial load<br />
Microbial load for fungi <strong>and</strong> bacteria was determined for<br />
reconstituted juice of mango powder. There was no<br />
fungal <strong>and</strong> bacterial growth detected in the freshly<br />
prepared mango powder, whereas the fresh mango pulp<br />
showed a huge microbial load for both fungi <strong>and</strong><br />
bacteria with about 3.5 · 10 4 CFU <strong>and</strong> 2.7 · 10 4 CFU,<br />
respectively. This clearly indicates that the drying process<br />
of mango juice to obtain powder greatly reduced the<br />
microbial load. Similar results were reported in solardried<br />
cauliflower (Kadam et al., 2005) <strong>and</strong> onion<br />
(Kadam et al., 2009).<br />
Conclusion<br />
Quality of foam-mat dried mango powder D. M. Kadam et al. 1631<br />
TSS, total soluble solids.<br />
Superscripts a, b, c, d ….. indicate the best performing treatment followed by poor performing treatments. Mean values with the same superscript<br />
letters are not significantly different.<br />
The most serious constraint for shelf life enhancement<br />
is the activity of microorganisms. Drying <strong>and</strong> dehydration<br />
of fresh fruit juice is one of the most<br />
energy-intensive processes in the food industry <strong>and</strong> a<br />
promising method in reducing post-harvest losses.<br />
Foam mat drying is a profitable process for drying of<br />
mango in powdered form. From this study, it can be<br />
concluded that the powder obtained as a result of the<br />
addition of 10% milk as foaming agent <strong>and</strong> drying at<br />
65 °C air temperature was the best. Mango powder<br />
developed by foam-mat drying has a better nutritional<br />
quality, increased food safety <strong>and</strong> enhanced shelf life.<br />
The sugar content of the mango powder is high enough<br />
Ó 2010 Institute of Food Science <strong>and</strong> Technology International Journal of Food Science <strong>and</strong> Technology 2010, 45, 1626–1632
1632<br />
Quality of foam-mat dried mango powder D. M. Kadam et al.<br />
so that there is no need to add extra sugar to the<br />
powder preparations. High contents of ascorbic acid,<br />
total carotenes <strong>and</strong> mineral are a boon to human<br />
health. It can be used for the preparation of a variety<br />
of products viz. beverages as a juice concentrate, <strong>and</strong><br />
in ice creams, jellies, cakes <strong>and</strong> c<strong>and</strong>ies as flavouring<br />
<strong>and</strong> colouring agents.<br />
Acknowledgment<br />
The authors express sincere thanks to Department of<br />
Science <strong>and</strong> Technology (DST), New Delhi, for funding<br />
the subproject under cluster project on food processing.<br />
References<br />
AOAC (1980). Official Methods of Analysis, 11th edn. Washington,<br />
DC: Association of official analytical chemists.<br />
Akintoye, O.A. & Oguntunde, O.A. (1991). Preliminary investigation<br />
on the effect of foam stabilizers on the physical characteristics <strong>and</strong><br />
reconstitution properties of foam-mat dried soymilk. Drying Technology,<br />
9, 245–262.<br />
Bondaruk, J., Markowski, M. & Baszczak, W. (2007). Effect of drying<br />
conditions on the quality of vacuum-microwave dried potato cubes.<br />
Journal of Food Engineering, 81, 306–312.<br />
Chen, J.P., Tai, C.Y. & Chen, B.H. (2007). Effects of different drying<br />
treatments on the stability of carotenoids in Taiwanese mango<br />
(Mangifera indica L.). Food Chemistry, 100, 1005–1010.<br />
Cooke, R.D., Breag, G.R., Ferber, C.E.M., Best, P.R. & Jones, J.<br />
(1976). Studies of mango processing. 1. The foam-mat drying of<br />
mango (Alphonso cultivar) puree. Journal of Food Technology, 11,<br />
463–473.<br />
Fern<strong>and</strong>ez, R., Norena, C.P.Z., Silveira, S.T. & Br<strong>and</strong>elli, A. (2007).<br />
Osmotic dehydration of muskmelon (Cucumis melo): influence of<br />
blanching <strong>and</strong> syrup concentration. Journal of Food Processing <strong>and</strong><br />
Preservation, 31, 392–405.<br />
Fisher, I. (1971). Modern Food Analysis. p. 22. Washington, DC:<br />
Freeman & Co.<br />
Hart, M.R., Graham, R.P., Ginnette, L.F. & Morgan, A.I. (1963).<br />
Foams for foam mat drying. Food Technology, 17, 1302–1304.<br />
Hymavathi, T.V. & Khader, V. (2005). Carotene, ascorbic acid <strong>and</strong><br />
sugar content of vacuum dehydrated ripe mango powders stored in<br />
flexible packaging material. Journal of Food Composition <strong>and</strong><br />
Analysis, 18, 181–192.<br />
Kadam, D.M. & Balasubramanian, S. (2010). Foam mat drying of<br />
tomato juice. Journal of Food Processing <strong>and</strong> Preservations,<br />
(accepted).<br />
Kadam, D.M., Lata, D.V.K.S. & P<strong>and</strong>ey, A.K. (2005). Influence of<br />
different treatments on dehydrated cauliflowwer quality. International<br />
Journal of Food Science <strong>and</strong> Technology, 40, 849–856.<br />
Kadam, D.M., Samuel, D.V.K., Ch<strong>and</strong>ra, P. & Sikarwar, H.S. (2008).<br />
Impact of processing treatments <strong>and</strong> packaging material on some<br />
properties of stored dehydrated cauliflower. International Journal of<br />
Food Science <strong>and</strong> Technology, 43, 1–14.<br />
Kadam, D.M., Nangare, D.M. & Oberoi, H.S. (2009). Influence of<br />
pre- treatment on microbial load of stored dehydrated onion slices.<br />
International Journal of Food Science <strong>and</strong> Technology, 44, 1902–<br />
1908.<br />
Karim, A.A. & Wai, C.C. (1999). Foam-mat drying of starfruit<br />
(Averrhoa carambola L.) puree. Stability <strong>and</strong> air drying characteristics.<br />
Food Chemistry, 64, 337–343.<br />
Lavelli, V., Zanoni, B. & Zaniboni, A. (2007). Effect of water activity<br />
on carotenoid degradation in dehydrated carrots. Food Chemistry,<br />
104, 1705–1711.<br />
Leite, J.B., Mancini, M.C. & Borges, S.V. (2007). Effect of drying<br />
temperature on the quality of dried bananas cv. prata <strong>and</strong> d’a¢gua.<br />
Lebensmittel-Wissenschaft und- Technologie, 11, 38–41.<br />
Lewicki, P.P. (1975). Mechanisms concerned in foam-mat drying of<br />
tomato paste. Transactions of Agricultural Academy in Warsaw, 55,<br />
1–67 (in Polish).<br />
Marwaha, R.S. & P<strong>and</strong>ey, S.K. (2006). Suitability of cultivars <strong>and</strong><br />
methods for the production of dehydrated chips. Potato Journal, 33,<br />
110–117.<br />
Mehta, M.B., Mehta, B., Bapodra, A.H. & Joshi, H.D. (2007). Effect<br />
of germination <strong>and</strong> heat processing on protein, riboflavin, vit-C <strong>and</strong><br />
niacin content in peas, cowpea, red gram <strong>and</strong> wheat. Asian Journal<br />
of Home Science, 2, 34–38.<br />
Mitra, S.K. & Baldwin, E.Z. (1997). Mango. In: Postharvest Physiology<br />
<strong>and</strong> Storage of Tropical <strong>and</strong> Subtropical Fruits (edited by S.K.<br />
Mitra). Pp. 85–122. West Bengal, India: CAB International.<br />
Morgan, A.I., Graham, R.P., Ginnette, L.F. & Williams, G.S. (1961).<br />
Recent developments in foam mat drying. Food Technology, 15,<br />
37–39.<br />
Okos, M.R., Narsimhan, G., Singh, R.K. & Witnauer, A.C. (1992).<br />
Food dehydration. In: H<strong>and</strong>book of food engineering (edited by<br />
D.R. Heldman & D.B. Lund). Pp. 75–79. New York: Marcel<br />
Dekker.<br />
P<strong>and</strong>it, S.S., Chidley, H.G., Kulkarni, R.S., Pujari, K.H., Giri, A.P. &<br />
Gupta, V.S. (2009). Cultivar relationships in mango based on fruit<br />
volatile profiles. Food Chemistry, 114, 363–372.<br />
Pereira, E.A., Machado, M.T., Borges, S.V., Maia, M.C.A. &<br />
Augusta, I.M. (2008). Influence of osmotic agent on the physiochemical<br />
composition <strong>and</strong> drying kinetics of Gala apples. Revista<br />
Ciencia Agronomica, 39, 173–176.<br />
Radwan, H.M. & Lobna, A.M.H. (2002). Production of tomato<br />
powder <strong>and</strong> dried slices for use in some foodstuffs. Egyptian Journal<br />
of Agricultural Research, 80, 1751–1762.<br />
Rangana, S. (1995). H<strong>and</strong> Book of Analysis <strong>and</strong> Quality Control for<br />
Fruits <strong>and</strong> Vegetable Products, 2nd edn. P. 1112. New Delhi: Tata<br />
McGraw-Hill publication Co. Ltd.<br />
Ratti, C. & Kudra, T. (2006). Foam-mat drying: Energy <strong>and</strong> cost<br />
analyses. Canadian Biosystem Engineering, 48, 27–32.<br />
Sadasivam, S. & Manikam, A. (1996). Biochemical Methods, 2nd edn.<br />
New Delhi <strong>and</strong> TNAU, Coimbatore: New Age International (P)<br />
Ltd. Publisher.<br />
Sankat, C.K. & Castaigne, F.F. (2004). Foaming <strong>and</strong> drying behaviour<br />
of ripe bananas. Lebensmittel Wissenshaft und Technolgie, 37, 517–<br />
525.<br />
Singh, K.K. (1994). Development of a small capacity dryer for<br />
vegetable. Journal of Food Engineering, 21, 19–30.<br />
Tsai, S.J., Wu, T.Y., Yang, K., Liu, H., Liaw, H. & Liang, C. (2007).<br />
Effects of cooking methods <strong>and</strong> rehydration on the chemical<br />
composition <strong>and</strong> texture of peanut. Journal of Taiwan Agricultural<br />
Research, 6, 189–205.<br />
Wen-ping, M., Zhi-jing, N., He, L. & Min, C. (2008). Changes of the<br />
Main Carotenoid Pigment Contents During the Drying Processes of<br />
the Different Harvest Stage Fruits of Lycium barbarum L. Agricultural<br />
Sciences in China, 7, 363–369.<br />
International Journal of Food Science <strong>and</strong> Technology 2010, 45, 1626–1632 Ó 2010 Institute of Food Science <strong>and</strong> Technology
International Journal of Food Science <strong>and</strong> Technology 2010, 45, 1633–1640 1633<br />
Original article<br />
On the use of ultrafiltration for the concentration <strong>and</strong> desalting of<br />
phosvitin from egg yolk protein concentrate<br />
Bertr<strong>and</strong> P. Chay Pak Ting, 1 Yves Pouliot, 1 * Lekh R. Juneja, 2 Tutomu Okubo, 2 Sylvie F. Gauthier 1 & Yoshinori<br />
Mine 3<br />
1 Institute of Nutraceuticals <strong>and</strong> Functional Foods (INAF), Pavillon Paul-Comtois, Université Laval, Québec, QC, Canada G1V 0A6<br />
2 Research Laboratories, Taiyo Kagaku, Co Ltd., 1-3 Takaramachi, Yokkaichi, Mie 510 0844, Japan<br />
3 Department of Food Science, University of Guelph, Guelph, ON, Canada N1G 2W1<br />
(Received 3 March 2010; Accepted in revised form 6 May 2010)<br />
Summary An ultrafiltration-based approach was integrated in the preparation of phosvitin (PVs) from delipidated egg<br />
yolk proteins. An attempt was made to concentrate PVs as well as to desalt by means of the diafiltration<br />
technique. Primary experiments were devoted to optimise the ultrafiltration performance as function of<br />
parameters such as the effects of pH, feed concentration <strong>and</strong> transmembrane pressure on permeate flux with<br />
the 10-kDa molecular weight cut-off (MWCO) polyethersulfone membrane at laboratory scale. Higher<br />
permeate flux values were observed at low concentration <strong>and</strong> at alkaline pH, whatever transmembrane<br />
pressure studied. Then, desalting of PVs was carried out at 50 °C with 10- <strong>and</strong> 30-kDa MWCO membranes.<br />
The results showed that desalting of PVs was obtained with both the 10- <strong>and</strong> 30-kDa MWCO membranes<br />
<strong>and</strong> with a few loss of protein in the permeate side.<br />
Keywords Concentration, delipidated egg yolk proteins, desalting, phosvitin, ultrafiltration.<br />
Introduction<br />
Hen egg yolk phosvitin (PVs) is a phosphoprotein found<br />
in egg yolk, with a molecular mass of 35 kDa, containing<br />
10% of phosphorus <strong>and</strong> has a specific amino acid<br />
composition which comprises 123 serine residues. The<br />
phosphorus in PVs is found as phosphoserines (Mecham<br />
& Olcott, 1949) arranged in clusters that can carry up<br />
fifteen consecutive residues (Byrne et al., 1984). Abundance<br />
of phosphate groups provides PVs with a strong<br />
binding ability for metal ions (Fe, Ca <strong>and</strong> Mg), <strong>and</strong> they<br />
are acting as antioxidants (Lu & Baker, 1986). Moreover,<br />
the antioxidant activity of PVs can be improved by<br />
conjugating with galactomannan (Nakamura et al.,<br />
1998). Egg yolk PVs <strong>and</strong> PVs–galactomannan can<br />
inhibit the growth of pathogenic Escherichia coli under<br />
thermal stress, which results in the synergic effect of the<br />
strong metal-chelating ability <strong>and</strong> the surface properties<br />
(Sattar Khan et al., 2000; Choi et al., 2004). Low<br />
molecular weight (1–3 kDa) phosphopeptides obtained<br />
by PVs tryptic hydrolysis show calcium-binding capacity<br />
<strong>and</strong> inhibit the formation of insoluble calcium phosphate<br />
(Jiang & Mine, 2000, 2001). PVs peptides also<br />
*Correspondent: Fax: 418 656 3353;<br />
e-mail: Yves.Pouliot@inaf.ulaval.ca<br />
doi:10.1111/j.1365-2621.2010.02311.x<br />
Ó 2010 The Authors. Journal compilation Ó 2010 Institute of Food Science <strong>and</strong> Technology<br />
showed antioxidant activity against oxidative stress in<br />
human intestinal epithelial cells (Katayama et al., 2006)<br />
as well as against oxidation of linoleic acid <strong>and</strong> radicalscavenging<br />
activity (Xu et al., 2007).<br />
Egg yolk is a complex mixture of particles, mainly<br />
composed of granules, suspended in a protein solution<br />
called plasma. The granules can be separated from egg<br />
yolk after dilution into a saline solution followed by<br />
centrifugation <strong>and</strong> consist mainly of a <strong>and</strong> b-lipovitellins<br />
[high-density lipoproteins (HDL)], PVs <strong>and</strong> LDLg. The<br />
apoproteins of HDL consist of five major polypeptides<br />
with molecular weight ranging from 32 to 105 kDa, the<br />
latter being the main one. Egg yolk plasma also contains<br />
low-density lipoproteins (LDL) but also livetins (Burley<br />
& Cook, 1961). Different studies reported that apoproteins<br />
of LDL consisted in up to eighteen polypeptides of<br />
molecular weight ranging mostly between 15 <strong>and</strong><br />
180 kDa <strong>and</strong> sometimes higher molecular weights up<br />
to 225–240 kDa (Mine, 1998; Anton et al., 2003).<br />
Water-soluble livetins consist of a, b, c-livetins with<br />
molecular weight of 80, 45 <strong>and</strong> 150 kDa, respectively<br />
(Martin et al., 1957).<br />
At laboratory scale, PVs has been isolated by diluting<br />
egg yolk with a magnesium sulphate solution to form an<br />
insoluble complex (Mecham & Olcott, 1949), <strong>and</strong><br />
several chromatographic methods have been carried
1634<br />
Ultrafiltration of crude phosvitin B. P. Chay Pak Ting et al.<br />
out for the separation of egg yolk PVs. After defatting,<br />
PVs has been separated into several components with<br />
molecular weight from 27 000 to 38 000 by using gelpermeation<br />
chromatography (Tsutsui & Obara, 1984)<br />
<strong>and</strong> into two fractions by ion-exchange chromatography<br />
(Connelly & Taborsky, 1961). Abe et al. (1982) fractionated<br />
PVs into a <strong>and</strong> b-PVs, having different phosphorus<br />
content <strong>and</strong> molecular weights, by gel filtration.<br />
Castellani et al. (2003) have developed a new purification<br />
method based on the insolubility of Mg 2+ ⁄ PVs salt<br />
following by an ion-exchange chromatographic fractionation.<br />
Although chromatographic methods are suitable<br />
for protein purification, these methods involve the<br />
use of chemicals <strong>and</strong> organic solvents <strong>and</strong> strong<br />
chemical conditions of pH that can potentially alter<br />
PVs structure (Taborsky, 1968).<br />
Defatting egg yolk granules is considered as a<br />
necessary step in the purification of PVs. Losso &<br />
Nakai (1994) developed a simple procedure for the<br />
isolation of PVs from chicken egg yolk. After removal of<br />
water-soluble proteins, the precipitate (lipids, granules)<br />
was extracted with organic solvents, such as hexane ⁄ ethanol<br />
(3:1), to liberate proteins bound to lipids <strong>and</strong> then<br />
filtered. PVs was isolated from the delipidated granules<br />
by means of salting-out, the precipitated egg yolk<br />
material is discarded <strong>and</strong> the PVs solution is then<br />
dialysed.<br />
Jiang & Mine (2000) have developed laboratory-scale<br />
experimental conditions to separate PVs from delipidated<br />
egg yolk proteins by salting-out using 10% NaCl<br />
followed by a 5000 g · 30 min centrifugation. The<br />
supernatant so-called crude PVs was desalted by means<br />
of extensive dialysis for 3 days at 4 °C.<br />
Despite these advances on PVs purification, there is<br />
still a need for a fractionation approach that would be<br />
potentially cost-effective at industrial scale.<br />
Pressure-driven membrane processes such as ultrafiltration<br />
(UF) can be carried out simultaneously for<br />
fractionation, concentration, purification <strong>and</strong> desalting<br />
food proteins <strong>and</strong> are already used at industrial scale.<br />
However, to our knowledge, only a few studies have<br />
reported the using of UF membrane processes for egg<br />
yolk proteins. Akita & Nakai (1992) have used a<br />
100-kDa molecular weight cut-off (MWCO) to extract<br />
immunoglobulins from a yolk water-soluble fraction<br />
upon the separation of crude immunoglobulin by<br />
ammonium sulphate precipitation. A maximal recovery<br />
of immunoglobulin (>98%) was obtained, <strong>and</strong> this<br />
value was comparable to the degree of purity obtained<br />
by gel filtration. In another study, Kim & Nakai (1996)<br />
developed a serial filtration approach involving dilutions,<br />
paper filtration <strong>and</strong> delipidation using hydrophobic<br />
filters. The delipidated water-soluble fraction was<br />
thereafter purified using 100-kDa UF membranes, <strong>and</strong><br />
both high recoveries (72–89%) <strong>and</strong> purity (74–99%)<br />
were obtained.<br />
In this study, the procedure of Jiang & Mine (2000)<br />
was brought to a pilot-scale by using a centrifugal<br />
clarifier to remove the precipitated material from 10%<br />
NaCl-treated egg yolk proteins, <strong>and</strong> a UF–diafiltration<br />
(DF) procedure was designed to concentrate <strong>and</strong> replace<br />
the laboratory-scale dialysis procedure. In addition, a<br />
commercial delipidated egg yolk proteins’ concentrate<br />
was used as starting material to avoid the use of solvents<br />
<strong>and</strong> to focus on the potential of using membrane<br />
separation processes to concentrate PVs.<br />
The objective of our study was thus to evaluate the<br />
performance of UF membranes process followed by DF<br />
as an alternative approach for the production of<br />
desalted PVs. Considering that PVs molecular weight<br />
is 35 kDa, two different UF membranes, namely 10- <strong>and</strong><br />
30-kDa MWCO polyethersulfone elements, were<br />
selected. The effect of process parameters such as pH,<br />
transmembrane pressure <strong>and</strong> feed concentration on<br />
permeate flux was investigated. Permeation flux values,<br />
selectivity <strong>and</strong> yield of PVs from the desalting procedure<br />
were determined.<br />
Materials <strong>and</strong> methods<br />
Materials<br />
Defatted egg yolk proteins were a gift from Taiyo<br />
Kagaku Co., Ltd. (Yokkaichi, Japan). The powdered<br />
product contained 79.20% protein, 9.86% fat <strong>and</strong><br />
5.60% water according to manufacturer’s certificate of<br />
analysis. PVs st<strong>and</strong>ards for gel electrophoresis analyses<br />
were purchased from Sigma Chemical Co. (# catalogue:<br />
P1253-50MG, St Louis, MO, USA).<br />
Preparation of crude PVs from egg yolk proteins<br />
Extraction of crude PVs was performed according to<br />
Jiang & Mine (2000). Egg yolk proteins were suspended<br />
at 10% (w ⁄ v) in 10% NaCl (20 L) <strong>and</strong> stirred overnight<br />
at 4 °C. The precipitate was separated by a pilot plant<br />
centrifuge CEPA, type TZ 5 (Carl Padberg Zentrifugenbau<br />
GMBH, Lahr, Germany) at 25 °C <strong>and</strong> a feed<br />
flow rate of 735–1450 L min )1 . The sludge was discarded,<br />
<strong>and</strong> the supernatant was freeze-dried <strong>and</strong> stored<br />
at )35 °C.<br />
Ultrafiltration experiments<br />
Membranes<br />
UF was carried out using a polyethersulfone UF<br />
membrane Prep ⁄ scaleÔ-TFF 1 ft 2 cartridge (Millipore<br />
Corp., Bedford, MA, USA) having a MWCO of 10 <strong>and</strong><br />
30 kDa with the effective area of 0.09 m 2 . The pure<br />
water permeation flux (Jw) was determined volumetrically<br />
at 25 °C at transmembrane pressure (PT) ranging<br />
from 0.35 to 1.75 bar.<br />
International Journal of Food Science <strong>and</strong> Technology 2010 Ó 2010 The Authors. Journal compilation Ó 2010 Institute of Food Science <strong>and</strong> Technology
Jw were determined using the following equation:<br />
Jw ¼ 1 DV<br />
Dt<br />
ð1Þ<br />
Am<br />
where Am is the effective membrane area (m 2 ) <strong>and</strong><br />
(DV ⁄Dt) is the permeate volume DV collected over time<br />
Dt (L h )1 ).<br />
The membrane retention coefficient was calculated<br />
according to the following relation:<br />
Rð%Þ ¼1 Cp<br />
Cr<br />
ð2Þ<br />
in which Cp (g L )1 ) <strong>and</strong> Cr (g L )1 ) are the measured<br />
component concentrations of phosphorus in the permeate<br />
<strong>and</strong> in the retentate, respectively.<br />
Permeation fluxes of crude phosvitin solutions<br />
The study of permeation flux changes as a function of<br />
pH was performed with the 10-kDa MWCO UF<br />
membrane by preparing a feed solution to a specific<br />
concentration (1.0%, w ⁄ v) <strong>and</strong> operating pressure of 1.4<br />
bar in recirculation mode. Then, the desired pH was<br />
decreased or increased stepwise using HCl 0.1 N or<br />
NaOH 0.1 N, respectively.<br />
Feed phases were prepared by rehydrating crude PVs<br />
at 0.5%, 1.0%, 5.0% <strong>and</strong> 10.0% (w ⁄ v) <strong>and</strong> adjusted to<br />
pH 8.0 using NaOH 0.1 N. The solutions were ultrafiltered<br />
with the 10-kDa MWCO UF membrane, <strong>and</strong><br />
permeate fluxes of crude PVs solution (Jp) was determined<br />
at PT between 0.35 <strong>and</strong> 1.75 bar. Permeate flux<br />
values were calculated using eqn 1.<br />
Concentration mode<br />
A 900-mL solution of crude PVs was prepared (5.0%,<br />
w ⁄ v <strong>and</strong> pH 8.0) <strong>and</strong> equilibrated at 50 °C. The PT was<br />
set at 1.4 bar. The retentate was sent back to the feed<br />
tank, but the permeate was not recycled. UF concentration<br />
was performed with the 10- <strong>and</strong> 30-kDa UF<br />
membrane until a volume concentration factor (VCF) of<br />
6X was reached following a DF step where 10 diavolumes<br />
(DV) of distilled water was added to retentate.<br />
UF re-concentration was stopped when the VCF<br />
reached 11X. Retentate <strong>and</strong> permeate samples were<br />
collected during UF for further analysis.<br />
Analytical methods<br />
Phosphorus content <strong>and</strong> protein phosphorylation<br />
Phosphorus (P) content was determined by the colorimetric<br />
molybdenum method of Allen (1940).<br />
The Pierce Ò Phosphoprotein Phosphate Estimation<br />
Assay Kit was used to determine the extent of phosphorylation<br />
of purified protein (# catalog: 23270, Pierce,<br />
Rockford, IL, USA). Briefly, protein samples were<br />
dissolved in Tris-buffered saline <strong>and</strong> were mixed with<br />
Ultrafiltration of crude phosvitin B. P. Chay Pak Ting et al. 1635<br />
phosphate reagent. Protein samples were incubated for<br />
30 min at room temperature, <strong>and</strong> absorbance was<br />
measured at 650 nm.<br />
Sodium content<br />
Sodium content was determined by inductively coupled<br />
plasma (ICP-OES, Optima 4300, Dual View, Perkin–<br />
Elmer, Shelton, CT, USA). The wavelength used to<br />
determine Na element was 589.592 nm. Sodium analyses<br />
were carried out in radial view.<br />
Total nitrogen content<br />
The protein content was determined by the nitrogen<br />
combustion method with a LECO FP-528 apparatus<br />
(Model 601-500, LECO Corporation, St Joseph, MI,<br />
USA). The instrument was previously calibrated with<br />
ethylenediaminetetraacetic acid (EDTA). Total nitrogen<br />
was converted to protein using N factor 6.25 (%<br />
protein = % N · 6.25).<br />
SDS–polyacrylamide gel electrophoresis<br />
SDS–polyacrylamide gel electrophoresis (SDS–PAGE)<br />
was carried out using a Mini Protean 3 cell (Bio-rad<br />
Laboratories Ltd, Mississauga, ON, Canada) under<br />
denaturing conditions. The stacking <strong>and</strong> running gels<br />
were 4.0% <strong>and</strong> 12.5% polyacrylamide, respectively. The<br />
electrophoresis was run at a constant voltage of 30 mA<br />
for 1 h 30 min. About 10 lL of protein sample was placed<br />
on the gel. Protein b<strong>and</strong>s were first stained with the<br />
modified Coomassie blue method by Hegenauer et al.<br />
(1977) to allow a more sensitive detection of phosphorylated<br />
proteins <strong>and</strong> followed by the normal Coomassie<br />
blue procedure. Destaining procedure containing acetic<br />
acid ⁄ methanol ⁄ water (1:8:12, v ⁄ v ⁄ v). Molecular<br />
weights were estimated with molecular weight markers<br />
from Bio-rad Laboratories Ltd (Hercules, CA, USA)<br />
composed of myosin (200 kDa), b-galactosidase<br />
(116.25 kDa), bovine serum albumin (84.79 kDa),<br />
carbonic anhydrase (37.41 kDa), trypsin inhibitor from<br />
soybean (29.05 kDa), lysozyme (19.81 kDa) <strong>and</strong> aprotinin<br />
(6.84 kDa).<br />
Results <strong>and</strong> discussion<br />
Preliminary observations at laboratory scale<br />
The effect of PT, pH <strong>and</strong> feed concentration on the flux<br />
values of crude PVs from egg yolk proteins using<br />
10-kDa UF membrane was investigated as preliminary<br />
laboratory-scale experiments.<br />
Effect of pH<br />
Flux values (Jp) of crude PVs solution were found to be<br />
influenced by the pH values between 4 <strong>and</strong> 10 (Fig. 1).<br />
The curve shows that Jp increased by 60% as the pH<br />
was raised from 4 to 10. Flux showed a minimum value<br />
Ó 2010 The Authors. Journal compilation Ó 2010 Institute of Food Science <strong>and</strong> Technology International Journal of Food Science <strong>and</strong> Technology 2010
1636<br />
Ultrafiltration of crude phosvitin B. P. Chay Pak Ting et al.<br />
Flux (L h –1 m –2 )<br />
40<br />
35<br />
30<br />
25<br />
20<br />
15<br />
10<br />
5<br />
0<br />
0 2 4 6 8 10 12<br />
pH<br />
Figure 1 Effect of pH on flux values (L h )1 m )2 ) of crude phosvitin at<br />
1.0% (w ⁄ v) in a 0.09 m 2 PES spiral wound ultrafiltration (10-kDa<br />
molecular weight cut-off) membrane at 1.4 bar. Each value is the mean<br />
of triplicates ± st<strong>and</strong>ard error.<br />
(J p = 15.5 L h )1 m )2 ) at pH values close to the PVs<br />
isoelectric point (pHi = 4.0) where PVs is at its lowest<br />
solubility. According to Causeret et al. (1991), yolk<br />
granules are insoluble at pH from 4.2 to 6.5 <strong>and</strong> low<br />
ionic strength because they form non-soluble HDL–PVs<br />
complexes linked by phosphocalcic bridges as HDL <strong>and</strong><br />
PVs contain a high proportion of phosphoserine residues<br />
that are able to bind calcium. A study on the<br />
influence of pH adjustments shows a minimum flux at a<br />
pH equal to the isoelectric point of protein solutions. It<br />
was suggested that the above may be attributed to<br />
fouling membrane (Nystro¨ m et al., 1994). Several explanations<br />
could be explaining this phenomenon.<br />
At isoelectric point, because of reduced electrostatic<br />
repulsion between protein molecules, a higher protein<br />
concentration is found at the membrane. This may also<br />
explain the lower flux at pH 4.0. As PVs global net charge<br />
is decreased, it is likely to adsorb onto the membrane<br />
surface, <strong>and</strong> the constituents of granules (HDL <strong>and</strong> PVs),<br />
which are found as microparticles (0.3–8 lm), can form a<br />
densely packed layer that may explain the low fluxes<br />
observed at the isoelectric point (Fane et al., 1983). An<br />
acidic precipitation phenomenon was also mentioned by<br />
Taborsky (1980), <strong>and</strong> aggregates would explain the<br />
lower flux at acidic pH. As pH values were raised<br />
above the isoelectric point, the permeate flux gradually<br />
increased (J p = 35.10 L h )1 m )2 ), probably as a result<br />
of increased solubility. Castellani et al. (2003) studied<br />
the solubility of PVs at different pH values <strong>and</strong> showed<br />
the highest solubility (97%) at neutral pH. Because of the<br />
fact that both PVs <strong>and</strong> polyethersulfone UF membranes<br />
are negatively charged at neutral pH, protein interactions<br />
with membrane’s surface are weakened because of<br />
increased electrostatic repulsions (Nystro¨ m et al.,<br />
1998). As a result, high flux levels can be achieved.<br />
Effect of transmembrane pressure <strong>and</strong> feed concentration<br />
Figure S1 illustrates the effect of operating pressure<br />
(between 0.35 <strong>and</strong> 1.75 bar) on Jp at pH 8.0 of 0.5%,<br />
1.0%, 5.0% <strong>and</strong> 10.0% (w ⁄ v) of crude PVs solution<br />
when 10-kDa MWCO membrane is used. The Jw value<br />
corresponds to the water flux of the UF membrane<br />
measured before the UF experiment. In accordance with<br />
Darcy’s law, the increase in Jw value was linear over the<br />
entire P T range from 6.71 to 122.15 L h )1 m )2 . At 0.5%<br />
<strong>and</strong> 1.0% PVs, Jp values still increased linearly with PT<br />
from 4.80 to 48.44 L h )1 m )2 <strong>and</strong> from 7.73 to<br />
46.67 L h )1 m )2 , respectively. When increasing protein<br />
concentration from 1.0% to 5.0% or 10.0%, the flux<br />
values levelled off at pressures greater than 1.4 bar. As<br />
feed concentration was increased, the membrane surface<br />
concentration increased, leading to an increase in the<br />
pressure osmotic of the solution to the membrane. This<br />
reduced the net driving force for the solvent flux. This<br />
effect was more prominent at feed concentration at<br />
10.0% over the PT studied. In the pressure-independent<br />
UF, a limiting concentration <strong>and</strong> operating pressure<br />
were considered at 5.0% (w ⁄ v) <strong>and</strong> 1.4 bar, respectively.<br />
From this first series of observations, a feed concentration<br />
of 5.0% was chosen to concentrate PVs to have a<br />
reasonable permeate flux for concentration <strong>and</strong> desalting<br />
experiments at pH 8.0, under an operating pressure<br />
of 1.4 bar. Also, the operating temperature was set up<br />
at 50 °C, which is above the optimal temperature<br />
(30–35 °C) for microbial growth <strong>and</strong> below denaturation<br />
temperature of PVs (Td = 79.7 ± 1.4 °C) (Chung<br />
& Ferrier, 1995). Moreover, a higher temperature is<br />
favourable to the membrane filtration because of the<br />
reduction in feed viscosity.<br />
Comparative performance of 10- <strong>and</strong> 30-kDa ultrafiltration<br />
membranes<br />
The objective of using UF was to increase purity of<br />
crude PVs by removing as much of the salt <strong>and</strong> other<br />
solutes as possible in a UF–DF step, whereas minimising<br />
protein losses.<br />
The effect of operating time on the permeate flux on 10- <strong>and</strong><br />
30-kDa molecular weight cut-off ultrafiltration membrane<br />
As shown in Fig. S2, the initial permeate fluxes of<br />
10 <strong>and</strong> 30 kDa were similar (52 <strong>and</strong> 56 L h )1 m )2 ,<br />
respectively), <strong>and</strong> as expected, Jp was generally higher<br />
with the 30-kDa MWCO membrane than with the<br />
10-kDa MWCO membrane as a result of its higher<br />
MWCO. However, an important permeate flux decline<br />
was observed for both membranes within the first<br />
12 min of filtration. The initial permeate flux of 52<br />
<strong>and</strong> 56 L h )1 m )2 decreased about 48% <strong>and</strong> 42% when<br />
a final VCF value of 6 was reached for the 10- <strong>and</strong><br />
30-kDa UF membranes, respectively. This phenomenon<br />
could be attributed to the fact that PVs is retained by the<br />
membrane <strong>and</strong> accumulation on membrane surface<br />
form a layer at the membrane surface with increasing<br />
operating time, which cause the resistance of the<br />
permeate flux, resulting in the decline of the flux.<br />
International Journal of Food Science <strong>and</strong> Technology 2010 Ó 2010 The Authors. Journal compilation Ó 2010 Institute of Food Science <strong>and</strong> Technology
Adding DF deionised water (10 DV) restored the flux<br />
close to initial value for the 30-kDa MWCO membrane<br />
but not for the 10-kDa MWCO membrane. Because of<br />
these discrepancies in membrane permeability, the final<br />
VCF (11X) was reached after 34 min with the 30-kDa<br />
membrane, whereas only after 56 min with the 10-kDa<br />
membrane. It can be thought that the greater porosity of<br />
the 30-kDa membrane compared to that of the 10-kDa<br />
membrane may have resulted in less pore blocking of the<br />
membrane upon UF concentration (Cheryan, 1998).<br />
Concentration <strong>and</strong> desalting of crude phosvitin<br />
The efficiency of UF membrane to desalt crude PVs has<br />
been evaluated by determining the changes in the<br />
sodium content in retentates during the UF–DF process,<br />
while the losses in PVs was estimated by the changes in<br />
phosphorus content.<br />
Table S1 reports the sodium content of the PVs 10<strong>and</strong><br />
30-kDa UF retentates of samples collected during<br />
concentration <strong>and</strong> DF steps. It can be seen that, except<br />
for the dilution effect before DF, the Na values<br />
remained unchanged during concentration <strong>and</strong> DF<br />
mode. For a DF ratio of 1.67 (1500 mL of deionised<br />
water was added to the initial 900 mL of crude PVs<br />
solution), the Na content of crude PVs solution was<br />
reduced by 86% for both UF membranes. Some<br />
apparent limitations in the passage of Na during UF–<br />
DF may result from the occurrence of salt binding by<br />
proteins such as PVs <strong>and</strong> are known to possess mineralbinding<br />
activity for cations such as Fe, Ca, Mg <strong>and</strong> Na<br />
(Lu & Baker, 1986).<br />
Figure 2a–d summarises the effect of VCF on retentate<br />
<strong>and</strong> permeate of phosphorus with 10- <strong>and</strong> 30-kDa<br />
MWCO membranes before <strong>and</strong> with DF. As expected,<br />
with increasing VCF, the phosphorus content in the<br />
retentate increased from an initial value of 0.153 up to<br />
0.390 g L )1 when the VCF was equal to 6 for both<br />
membranes. A 2.6-fold increase in concentration was<br />
achieved. At the end of the last DF step, phosphorus<br />
content is slightly higher (0.441 <strong>and</strong> 0.405 g L )1 for 10<br />
<strong>and</strong> 30 kDa, respectively) than initial phosphorus content<br />
(before DF) for both UF membranes, meaning that<br />
few losses of phosphoproteins occurred during DF.<br />
Phosphorus in the permeate averaged 0.019–0.017 g L )1<br />
for 10- <strong>and</strong> 30-kDa MWCO membranes, respectively.<br />
This indicates that limited amounts of phosphorylated<br />
proteins permeated through the membrane. It can be<br />
seen that protein retention was not affected by the<br />
concentration of PVs in the feed <strong>and</strong> was 80% or higher<br />
for both UF membranes.<br />
Compositional characteristics of crude delipidated egg yolk<br />
proteins, phosvitin <strong>and</strong> ultrafiltration retentates<br />
The compositional data reported in Table 1 show that,<br />
in comparison with delipidated egg yolk proteins, the<br />
crude PVs had lower protein content (7.25% vs.<br />
(a)<br />
Phosphorus content (g L –1 )<br />
(b)<br />
Phosphorus content (g L –1 )<br />
(c)<br />
Phosphorus content (g L –1 )<br />
(d)<br />
Phosphorus content (g L –1 )<br />
0.50<br />
0.40<br />
0.30<br />
0.20<br />
0.10<br />
0.00<br />
0.50<br />
0.40<br />
0.30<br />
0.20<br />
0.10<br />
0.00<br />
0.50<br />
0.40<br />
0.30<br />
0.20<br />
0.10<br />
0.00<br />
0.50<br />
0.40<br />
0.30<br />
0.20<br />
0.10<br />
0.00<br />
Ultrafiltration of crude phosvitin B. P. Chay Pak Ting et al. 1637<br />
UF Retentate 10 kDa UF-Permeate 10 kDa Retention<br />
1.5 1.8 2.25 3 6<br />
VCF<br />
UF-Retentate 10 kDa (with DF) UF-Permeate 10 kDa (with DF) Retention<br />
1.32 1.94 3 6.6 11<br />
VCF<br />
UF-Retentate 30 kDa UF-Permeate 30 kDa Retention<br />
1.5 1.8 2.25 3 6<br />
VCF<br />
UF-Retentate 30 kDa (with DF) UF-Permeate 30 kDa (with DF) Retention<br />
1.32 1.94 3 6.6 11<br />
VCF<br />
Figure 2 Effect of the volume concentration factor on phosphorus<br />
during ultrafiltration (UF) concentration ⁄ diafiltration (DF) of crude<br />
phosvitin in a 0.09 m 2 PES spiral wound UF membranes: (a) UF<br />
concentration <strong>and</strong> (b) UF–DF 10-kDa molecular weight cut-off<br />
(MWCO) membrane, (c) UF concentration <strong>and</strong> (d) UF–DF 30-kDa<br />
MWCO membrane.<br />
77.31%). However, the atomic ratio of nitrogen to<br />
phosphorus (N ⁄ P), which reflects PVs purity (Castellani<br />
et al., 2003), decreased from 31.13 to 7.92 from delipidated<br />
egg yolk proteins to crude PVs, approaching the<br />
value of 2.85 for PVs st<strong>and</strong>ard (data not shown). The<br />
dissociation of granules under high saline conditions<br />
enabled the precipitation of non-PVs protein material<br />
Ó 2010 The Authors. Journal compilation Ó 2010 Institute of Food Science <strong>and</strong> Technology International Journal of Food Science <strong>and</strong> Technology 2010<br />
100<br />
90<br />
80<br />
70<br />
60<br />
50<br />
40<br />
30<br />
20<br />
10<br />
0<br />
100<br />
90<br />
80<br />
70<br />
60<br />
50<br />
40<br />
30<br />
20<br />
10<br />
0<br />
100<br />
90<br />
80<br />
70<br />
60<br />
50<br />
40<br />
30<br />
20<br />
10<br />
0<br />
100<br />
90<br />
80<br />
70<br />
60<br />
50<br />
40<br />
30<br />
20<br />
10<br />
0<br />
Retention ( ) Retention ( )<br />
Retention ( )<br />
Retention ( )
1638<br />
Ultrafiltration of crude phosvitin B. P. Chay Pak Ting et al.<br />
Table 1 Comparative composition of egg yolk proteins, crude phosvitin<br />
<strong>and</strong> UF retentates <strong>and</strong> proteins yield (%) upon desalting of crude<br />
phosvitin using 10- <strong>and</strong> 30-kDa UF membranes<br />
Delipidated<br />
egg yolk<br />
proteins Crude PVs<br />
UF retentates<br />
10 kDa 30 kDa<br />
N [Protein] † (%) 12.37 [77.31] 1.18 [7.25] 7.22 [45.12] 6.86 [42.89]<br />
Phosphorus (%) 0.88 [11.8] à<br />
0.33 [50.23] 2.11 [56.47] 2.29 [60.80]<br />
Atomic ratio N ⁄ P 31.13 7.92 7.58 6.64<br />
Protein yield (%) §,–<br />
– 89<br />
100 84.7 84.4<br />
PVs, phosvitin; UF, ultrafiltration; DF, diafiltration.<br />
†<br />
Values in brackets are N values converted into proteins (N · 6.25).<br />
à<br />
Values in brackets are calculated phosphorus molecules per molecule of<br />
protein.<br />
§<br />
Protein yield (%) = protein (g) in final retentate ⁄ protein (g) in feed<br />
solution · 100.<br />
–<br />
First row reports yield upon preparation of crude PVs <strong>and</strong> second row<br />
reports yield upon UF–DF desalting of PVs.<br />
from egg yolk <strong>and</strong> thus, centrifugal separation increased<br />
its purity.<br />
The apparent yield (%) of crude PVs calculated by the<br />
ratio (lyophilised crude PVs weight ⁄ delipidated egg yolk<br />
proteins weight) · 100 was estimated to 89%, but this<br />
value does not adequately reflect the recovery of PVs<br />
because protein losses may have been compensated by<br />
NaCl brought during the precipitation step.<br />
UF–DF generated an increase in the protein content<br />
from crude PVs by a 6.25-fold <strong>and</strong> 5.92-fold factor upon<br />
UF using the 10- <strong>and</strong> 30-kDa membranes, respectively.<br />
Desalting PVs using UF–DF permitted to further<br />
decrease the atomic N ⁄ P ratio to 7.58 <strong>and</strong> 6.64 by UF<br />
retentate of 10 <strong>and</strong> 30 kDa, respectively. Overall, the<br />
protein yield obtained upon UF–DF desalting of PVs<br />
using 10- <strong>and</strong> 30-kDa MWCO membranes averaged 84%.<br />
Protein profile of egg yolk proteins, crude phosvitin <strong>and</strong><br />
ultrafiltration retentates<br />
The results of the SDS–PAGE patterns of st<strong>and</strong>ard PVs,<br />
delipidated egg yolk proteins, crude PVs <strong>and</strong> retentate<br />
of 10- <strong>and</strong> 30-kDa UF membranes are shown in Fig. 3.<br />
The commercial PVs st<strong>and</strong>ard (lane 2) comprises all of<br />
the PVs polypeptides (a1, a2 <strong>and</strong> b-PVs), whereas the<br />
delipidated egg yolk proteins revealed at least fifteen<br />
b<strong>and</strong>s (lane 3) with molecular weights ranging from<br />
around 5 to 200 kDa. Five b<strong>and</strong>s whose theoretical<br />
molecular weight value was estimated to be between<br />
35 <strong>and</strong> 45 kDa may be attributed to PVs. The remaining<br />
b<strong>and</strong>s in the high molecular weight region could<br />
correspond to some protein material in the HDL region<br />
consisting of polypeptides between 32 <strong>and</strong> 105 kDa or<br />
apoproteins LDL with molecular weight between 19 <strong>and</strong><br />
M.W. (kDa) 1 2 3 4 5 6<br />
198.5<br />
116.2<br />
84.8<br />
53.9<br />
37.4<br />
29<br />
19.8<br />
6.8<br />
Figure 3 SDS–PAGE profiles of egg yolk protein, crude phosvitin <strong>and</strong><br />
ultrafiltration (UF) retentates. Lane 1: molecular weight markers;<br />
Lane 2: phosvitin st<strong>and</strong>ard; Lane 3: delipidated egg yolk proteins;<br />
Lane 4: crude phosvitin; Lane 5: 10-kDa UF retentate; Lane 6: 30-kDa<br />
UF retentate.<br />
225 kDa in either delipidated or non-delipidated egg<br />
yolk proteins (Guilmineau et al., 2005).<br />
The salting-out of egg yolk proteins using NaCl 10%<br />
induced the disruption of the phosphocalcic bridges<br />
binding PVs <strong>and</strong> HDL <strong>and</strong> presumably yielded to a<br />
pellet rich in HDL upon centrifugation. The highly<br />
charged crude PVs remained soluble <strong>and</strong> appeared<br />
separated into several sub-units with molecular weight<br />
ranging between 10 <strong>and</strong> 80 kDa (lane 4). Also, different<br />
molecular weights of PVs are reported in the literature<br />
because of their phosphoric acid <strong>and</strong> carbohydrate<br />
content varying between 13 <strong>and</strong> 40 kDa (Wallace &<br />
Morgan, 1986). A double b<strong>and</strong> with an apparent<br />
molecular weight of 35–36 kDa for both commercial<br />
<strong>and</strong> our laboratory-prepared PVs was observed. The<br />
b-PVs was composed mainly of polypeptide of 45 kDa,<br />
<strong>and</strong> the a-PVs contained b<strong>and</strong>s between 37.5 <strong>and</strong><br />
45 kDa. However, a-PVs migrated faster than b-PVs,<br />
because its molar mass was lower (Abe et al.,<br />
1982). However, additional polypeptides of HDL that<br />
migrated in the same region than PVs could be present<br />
given their close molecular weight.<br />
The SDS–PAGE patterns of UF retentates from<br />
10 <strong>and</strong> 30 kDa (lane 5 <strong>and</strong> 6), respectively, show that<br />
intensity of PVs b<strong>and</strong>s increased after UF–DF, compared<br />
to crude PVs (lane 4) but no noticeable difference<br />
between the b<strong>and</strong>s profile of the two retentates can be<br />
observed. This observation suggests that using either a<br />
10-kDa or a 30-kDa MWCO membrane for the UF–DF<br />
procedure did not alter significantly the protein profile<br />
of PVs <strong>and</strong> that the procedure mainly resulted in a<br />
desalting of the extract.<br />
International Journal of Food Science <strong>and</strong> Technology 2010 Ó 2010 The Authors. Journal compilation Ó 2010 Institute of Food Science <strong>and</strong> Technology
Conclusion<br />
Our observations suggest that an UF-based process,<br />
under the conditions studied, can be used to partially<br />
concentrate <strong>and</strong> desalt PVs from delipidated egg yolk<br />
proteins. The performances, in terms of production,<br />
protein yield <strong>and</strong> desalting capacity, are similar for both<br />
UF membranes. However, UF–DF using membrane<br />
with MWCO of 30 kDa has been shown to result in<br />
increase in term of permeation flux. Further investigations<br />
into the influence of hydrodynamic conditions on<br />
fouling would be necessary to explain the differences in<br />
permeation flux.<br />
Acknowledgments<br />
This work was supported by a grant from Advanced<br />
Food <strong>and</strong> Materials Network (AFMnet) <strong>and</strong> the Natural<br />
Sciences <strong>and</strong> Engineering Research Council of<br />
Canada (NSERC).<br />
References<br />
Abe, Y., Itoh, T. & Adachi, S. (1982). Fractionation <strong>and</strong> characterization<br />
of hen’s egg yolk phosvitin. Journal of Food Science, 47,<br />
1903–1907.<br />
Akita, E.M. & Nakai, S. (1992). Immunoglobulins from egg yolk:<br />
isolation <strong>and</strong> purification. Journal of Food Science, 57, 629–634.<br />
Allen, R.J.L. (1940). The estimation of phosphorus. Biochemical<br />
Journal, 34, 858–865.<br />
Anton, M., Martinet, V., Dalralarrondo, V., Beaumal, V., David<br />
Brian, E. & Rabesona, H. (2003). Chemical <strong>and</strong> structural characterisation<br />
of low-density lipoproteins purified from hen egg yolk.<br />
Food Chemistry, 83, 175–183.<br />
Burley, R.W. & Cook, W.H. (1961). Isolation <strong>and</strong> composition of<br />
avian egg yolk granules <strong>and</strong> their constituents a <strong>and</strong> b-lipovitellins.<br />
Canadian Journal of Biochemistry <strong>and</strong> Physiology, 39, 1295–1307.<br />
Byrne, B.M., Van het Schip, A.D., Van de Klundert, J.A.M., Arnberg,<br />
A.C., Gruber, M. & Geert, A.B. (1984). Amino acid sequence of<br />
phosvitin derived from the nucleotide sequence of part of the<br />
chicken vitellogenin gene. Biochemistry, 23, 4275–4279.<br />
Castellani, O., Martinet, V., David-Bri<strong>and</strong>, E., Guerin-Dubiard, C. &<br />
Anton, M. (2003). Egg yolk phosvitin: preparation of metal-free<br />
purified protein by fast protein liquid chromatography using<br />
aqueous solvents. Journal of Chromatography. B, Analytical Technologies<br />
in the Biomedical <strong>and</strong> Life Sciences, 791, 273–284.<br />
Causeret, D., Matringe, E. & Lorient, D. (1991). Ionic strength <strong>and</strong> pH<br />
effects on composition <strong>and</strong> microstructure of yolk granules. Journal<br />
of Food Science, 56, 1532–1536.<br />
Cheryan, M. (1998). Ultrafiltration <strong>and</strong> Microfiltration H<strong>and</strong>book. Pp.<br />
237–291. Lancaster, PA: Technomic.<br />
Choi, I., Jung, C., Seog, H. & Choi, H. (2004). Purification of<br />
phosvitin from egg yolk <strong>and</strong> determination of its physicochemical<br />
properties. Food Science <strong>and</strong> Biotechnology, 13, 434–437.<br />
Chung, S.L. & Ferrier, L.S. (1995). Heat denaturation <strong>and</strong> emulsifying<br />
properties of egg yolk phosvitin. Journal of Food Science, 60, 906–<br />
908.<br />
Connelly, C. & Taborsky, G. (1961). Chromatographic fractionation<br />
of phosvitin. The Journal of Biological Chemistry, 236,<br />
1364–1368.<br />
Fane, A.G., Fell, C.J.D. & Suki, A. (1983). The effect of pH <strong>and</strong> ionic<br />
environment on the ultrafiltration of protein solutions with retentive<br />
membranes. Journal of Membrane Science, 16, 195–210.<br />
Ultrafiltration of crude phosvitin B. P. Chay Pak Ting et al. 1639<br />
Guilmineau, F., Krause, I. & Kulozik, U. (2005). Efficient analysis of<br />
egg yolk proteins <strong>and</strong> their thermal sensitivity using sodium dodecyl<br />
sulfate polyacrylamide gel electrophoresis under reducing <strong>and</strong><br />
nonreducing conditions. Journal of Agricultural <strong>and</strong> Food Chemistry,<br />
53, 9329–9336.<br />
Hegenauer, J., Ripley, L. & Nace, G. (1977). Staining acidic<br />
phosphoproteins (phosvitin) in electrophoretic gels. Analytical<br />
Biochemistry, 78, 308–311.<br />
Jiang, B. & Mine, Y. (2000). Preparation of novel functional<br />
oligophosphopeptides from hen egg yolk phosvitin. Journal of<br />
Agricultural <strong>and</strong> Food Chemistry, 48, 990–994.<br />
Jiang, B. & Mine, Y. (2001). Phosphopeptides derived from hen egg yolk<br />
phosvitin: effect of molecular size on the calcium-binding properties.<br />
Bioscience, Biotechnology, <strong>and</strong> Biochemistry, 65, 1187–1190.<br />
Katayama, S., Xu, X., Fan, M.Z. & Mine, Y. (2006). Antioxidative stress<br />
activity of oligophosphopeptides derived from hen egg yolk phosvitin<br />
in Caco-2 cells. Journal of Agricultural <strong>and</strong> Food Chemistry, 54, 773–<br />
778.<br />
Kim, H. & Nakai, S. (1996). Immunoglobulin separation from<br />
egg yolk: a serial filtration system. Journal of Food Science, 61,<br />
510–513.<br />
Losso, J.N. & Nakai, S. (1994). A simple procedure for the isolation of<br />
phosvitin from chicken egg yolk. In: Egg uses <strong>and</strong> Processing<br />
Technologies: New Developments (edited by J.S. Sim & S. Nakai).<br />
Pp. 150–157. Oxon, U.K: Cab International.<br />
Lu, C.H.-L. & Baker, R.C. (1986). Characteristics of egg-yolk<br />
phosvitin as an antioxidant for inhibiting metal-catalyzed phospholipid<br />
oxidations. Poultry Science, 65, 2065–2070.<br />
Martin, W.G., V<strong>and</strong>egaer, J.E. & Cook, W.H. (1957). Fractionation of<br />
livetin <strong>and</strong> the molecular weights of the a- <strong>and</strong> b-components.<br />
Canadian Journal of Biochemistry <strong>and</strong> Physiology, 35, 241–250.<br />
Mecham, D.K. & Olcott, H.S. (1949). Phosvitin, the principal phosphoproteins<br />
of egg yolk. Journal of the American Chemical Society, 71,<br />
3670–3679.<br />
Mine, Y. (1998). Adsorption behaviour of egg yolk low-density<br />
lipoproteins in oil-in-water emulsions. Journal of Agricultural <strong>and</strong><br />
Food Chemistry, 46, 36–41.<br />
Nakamura, S., Ogawa, M., Nakai, S., Kato, A. & Kitts, D.D. (1998).<br />
Antioxidant activity of a maillard-type phosvitin-galactomannan<br />
conjugate with emulsifying properties <strong>and</strong> heat stability. Journal of<br />
Agricultural <strong>and</strong> Food Chemistry, 46, 3958–3963.<br />
Nyström, M., Pihlajamäki, A. & Ehsani, N. (1994). Characterization<br />
of ultrafiltration membranes by simultaneous streaming potential<br />
<strong>and</strong> flux measurements. Journal of Membrane Science, 87, 245–256.<br />
Nyström, M., Aimar, P., Luque, S., Kulovaara, M. & Metsämuuronen,<br />
S. (1998). Fractionation of model proteins using their physiochemical<br />
properties. Colloids <strong>and</strong> Surfaces A: Physicochemical <strong>and</strong><br />
Engineering Aspects, 138, 185–205.<br />
Sattar Khan, M.A., Nakamura, S., Ogawa, M., Akita, E., Azakami,<br />
H. & Kato, A. (2000). Bactericidal action of egg yolk phosvitin<br />
against Escherichia coli under thermal stress. Journal of Agricultural<br />
<strong>and</strong> Food Chemistry, 48, 1503–1506.<br />
Taborsky, G. (1968). Optical rotatory dispersion <strong>and</strong> circular dichroism<br />
of phosvitin at low pH. The Journal of Biological Chemistry, 243,<br />
6014–6020.<br />
Taborsky, G. (1980). Iron binding by phosvitin <strong>and</strong> its conformational<br />
consequences. The Journal of Biological Chemistry, 255, 2976–2984.<br />
Tsutsui, T. & Obara, T. (1984). Preparation <strong>and</strong> characterization of<br />
phosvitin from hen’s egg-yolk granule. Agricultural <strong>and</strong> Biological<br />
Chemistry, 48, 1153–1160.<br />
Wallace, R.A. & Morgan, J.P. (1986). Chromatographic resolution of<br />
chicken phosvitin: multiple macromolecular species in a classic<br />
vitellogenin-derived phosphoprotein. Biochemical Journal, 240, 871–<br />
878.<br />
Xu, X., Katayama, S. & Mine, Y. (2007). Antioxidant activity of<br />
tryptic digests of hen egg yolk phosvitin. Journal of Agricultural <strong>and</strong><br />
Food Chemistry, 87, 2604–2608.<br />
Ó 2010 The Authors. Journal compilation Ó 2010 Institute of Food Science <strong>and</strong> Technology International Journal of Food Science <strong>and</strong> Technology 2010
1640<br />
Ultrafiltration of crude phosvitin B. P. Chay Pak Ting et al.<br />
Supporting Information<br />
Additional Supporting Information may be found in the<br />
online version of this article:<br />
Figure S1. Effect of transmembrane pressure <strong>and</strong><br />
phosvitin concentration (0.5%, 1.0%, 5.0% <strong>and</strong><br />
10.0%, w ⁄ v) on flux values (L h )1 m )2 ) at pH 8.0 in a<br />
0.09 m 2 PES spiral wound ultrafiltration (10-kDa<br />
molecular weight cut-off) membrane. Each value is the<br />
mean of triplicates ± st<strong>and</strong>ard error.<br />
Figure S2. Permeation flux (L h )1 m )2 ) of crude phosvitin<br />
(5.0%, w ⁄ v <strong>and</strong> pH 8.0) at 1.4 bar during ultrafiltration<br />
(UF) concentration in a 0.09 m 2 PES spiral<br />
wound UF (10- <strong>and</strong> 30-kDa molecular weight cut-off)<br />
membranes.<br />
Table S1. Sodium content (g L )1 ) of the UF retentate<br />
during the concentration <strong>and</strong> DF steps of crude phosvitin<br />
using 10- <strong>and</strong> 30-kDa molecular weight cut-off<br />
membranes.<br />
Please note: Wiley-Blackwell are not responsible for<br />
the content or functionality of any supporting materials<br />
supplied by the authors. Any queries (other than missing<br />
material) should be directed to the corresponding author<br />
for the article.<br />
International Journal of Food Science <strong>and</strong> Technology 2010 Ó 2010 The Authors. Journal compilation Ó 2010 Institute of Food Science <strong>and</strong> Technology
International Journal of Food Science <strong>and</strong> Technology 2010, 45, 1641–1646 1641<br />
Original article<br />
Effects of cellulosic fibre on physical <strong>and</strong> rheological properties of<br />
starch, gluten <strong>and</strong> wheat flour<br />
Avi Goldstein, Lida Ashrafi & Koushik Seetharaman*<br />
Laboratory of Cereal Science, Department of Food Science, University of Guelph, Guelph, ON N1G 2W1, Canada<br />
(Received 21 February 2010; Accepted in revised form 18 May 2010)<br />
Summary In this study, we report on the effects of cellulose fibres of different particle size on changes to dough water<br />
absorption <strong>and</strong> rheology; <strong>and</strong> on effects of fibre on starch <strong>and</strong> gluten, separately, at different levels of fibre<br />
incorporation (0.1–10%). Water absorption <strong>and</strong> dough-mixing properties were affected with fibre<br />
incorporation, with 40-lm fibre incorporation resulting in greater absorption values. Dough stickiness<br />
<strong>and</strong> extensibility were affected by cellulose fibre particle size, <strong>and</strong> decreased with increasing fibre addition.<br />
Flour or starch <strong>and</strong> fibre mixtures were evaluated using a Micro ViscoAmlyoGraph (MVAG), <strong>and</strong> the<br />
resulting gel firmness was measured using a texture analyzer. MVAG peak <strong>and</strong> final viscosities of flour<br />
samples decreased with increasing fibre content. Starch–fibre interactions followed a similar trend as flour–<br />
fibre treatments. Gluten–fibre interactions were also measured using a Gluten Peak Tester on flour–fibre <strong>and</strong><br />
gluten–fibre mixtures. Cellulose fibre enhanced the kinetics of gluten aggregation.<br />
Keywords Cellulose, dough, extensibility, gel texture, gluten, insoluble fibre, pasting profile, starch, stickiness.<br />
Introduction<br />
The dem<strong>and</strong> for healthier food products with excellent<br />
sensory qualities is increasing (Ang, 2001). Dietary fibre<br />
consumption leads to reduction in serum cholesterol<br />
levels <strong>and</strong> the risk of colon cancer (Seguchi et al., 2007).<br />
Cellulose, an insoluble, high molecular weight, linear,<br />
homopolymer of glucose joined by (1,4) glycosidic<br />
linkages increases the insoluble dietary fibre content<br />
when incorporated in food products.<br />
Several studies have demonstrated the use of dietary<br />
fibre in baked products (Pomeranz, 1977; Chen et al.,<br />
1988; Gomez et al., 2003; Seguchi et al., 2007; Kohajdova<br />
& Karovicova, 2008). A significant problem with dietary<br />
fibre addition in bread-type products is the reduction in<br />
loaf volume <strong>and</strong> poor textural quality (Gomez et al.,<br />
2003). Tortilla dough containing 8% soluble fibre exhibited<br />
poor gluten development <strong>and</strong> extensive gelatinisation<br />
during baking, which resulted in tortillas with a dense,<br />
pasty crumb (Seetharaman et al., 1997). Furthermore,<br />
insoluble fibres physically disrupted the gluten network in<br />
tortilla dough resulting in collapsed air bubbles, <strong>and</strong><br />
decreased shelf stability of tortillas (Seetharaman et al.,<br />
1997). Soluble fibres affected bread dough stability,<br />
provided a higher water absorption capacity, increased<br />
mixing tolerance, <strong>and</strong> decreased extensibility of fortified<br />
*Correspondent: E-mail: kseethar@uoguelph.ca<br />
doi:10.1111/j.1365-2621.2010.02323.x<br />
Ó 2010 Institute of Food Science <strong>and</strong> Technology<br />
samples when compared to control samples (Gomez<br />
et al., 2003). Overall, insoluble fibres can be used as<br />
bulking or as texturing agents, but they can also impart a<br />
mouth feel, <strong>and</strong> degrade certain functional properties of<br />
food products (Guillon & Champ, 2000).<br />
Dietary fibres from a variety of sources may be<br />
incorporated in tortillas acceptably at £12% fibre incorporation<br />
(Seetharaman et al., 1994). Seguchi et al. (2007)<br />
examined the effect of size of cellulose fibre (6–650 lm)<br />
on bread-making properties. They observed that normal<br />
bread-making properties were obtained with the use of<br />
cellulose fibres >154 lm. Cellulose fibres
1642<br />
Effects of cellulosic fibre on physical <strong>and</strong> rheological properties A. Goldstein et al.<br />
Table 1 Water <strong>and</strong> Oil retention capacities of SC40 <strong>and</strong> SC200<br />
cellulose fibre<br />
Sample<br />
(40 lm) <strong>and</strong> SC200 (200 lm) cellulose fibre was supplied<br />
by Creafill Fibre Inc. (Chestertown, MD, USA).<br />
The fibres are 98.4% insoluble fibre, <strong>and</strong> only size of the<br />
fibres was different in this study. Water <strong>and</strong> oil retention<br />
capacities determined using AACC method 56-11.02<br />
(AACC International, 2000b) are reported in Table 1.<br />
Hard wheat flour (HWF) (12% moisture, 12% protein)<br />
<strong>and</strong> soft wheat flour (SWF) (12% moisture, 8% protein)<br />
was provided by Griffith Laboratories (Toronto, ON,<br />
Canada). Gluten was provided by ADM (ADM, Montreal,<br />
QC, Canada).<br />
Starch–fibre interactions<br />
Water retention<br />
capacity (g of<br />
water ⁄ gof<br />
sample)<br />
Oil retention<br />
capacity (g<br />
of oil ⁄ gof<br />
sample)<br />
SC40 2.88 ± 0.09 2.30 ± 0.13<br />
SC200 4.30 ± 0.26 5.07 ± 0.21<br />
The pasting profiles of starch–fibre blends were determined<br />
using a Micro ViscoAmlyoGraph (MVAG)<br />
(Brabender Inc., Duisburg, Germany). Starch–fibre<br />
blends were prepared on an 8% db. Starch was replaced<br />
with cellulose fibre at 0.1%, 1%, 5% or 10%. Samples<br />
were initially held at 25 °C for 3 min; then, heated from<br />
25 to 95 °C at10°C min )1 ; held at 95 °C for 3 min,<br />
cooled from 95 to 25 °C at a rate of 10 °C min )1 ; <strong>and</strong><br />
finally held at 25 °C for 3 min. The different pasting<br />
attributes such as peak <strong>and</strong> final viscosity were recorded<br />
using the software.<br />
The resulting pastes were immediately poured into<br />
35 · 10 mm petri dishes, covered with parafilm <strong>and</strong><br />
stored for 1 day at room temperature or for 7 days at<br />
4 °C. Gel texture was determined using a TAXT2-plus<br />
texture analyzer (Stable Micro Systems, Surrey, UK)<br />
fitted with a 35-mm cylindrical compression probe.<br />
Immediately prior to texture analysis, the gel surface<br />
was sliced so that a fresh surface was available for<br />
texture analysis. The gel was compressed at a rate of<br />
1.0 mm s )1 to a distance of 3.0 mm. All measurements<br />
were conducted in duplicate.<br />
Gluten–fibre interactions<br />
Gluten–fibre blends were analysed using a Brabender<br />
Gluten Peak Tester (GPT). Gluten blends were<br />
prepared by replacement with cellulose fibre at 0.1%,<br />
1%, 5% or 10%. The GPT was operated at 30 °C for<br />
20 min at a speed of 3000 rpm. The sample to water<br />
ratio was 5.5 g gluten to 12 mL water. Data for peak<br />
torque, lift off time <strong>and</strong> peak maximum time were<br />
obtained from the software. All measurements were<br />
conducted in duplicate.<br />
Flour–fibre interactions<br />
The pasting profile <strong>and</strong> gel texture of flour–fibre blends<br />
(12% db) was determined using a Brabender MVAG<br />
<strong>and</strong> TAXT2-plus texture analyzer. The percentage of<br />
cellulose fibre replacement <strong>and</strong> methods did not differ<br />
from those listed in starch–fibre interactions methods.<br />
A Brabender Farinograph-E was used to measure the<br />
water absorption properties using the st<strong>and</strong>ard AACC<br />
Method 54-21A (AACC International, 2000a), but using<br />
a 50-g mixing bowl. Cellulose fibre was incorporated at<br />
0.1%, 1%, 5% or 10% replacement levels. Farinograph<br />
attributes that were measured included water absorption,<br />
dough development time, stability <strong>and</strong> mixing<br />
time. The stickiness of the dough was determined using<br />
a Chen <strong>and</strong> Hoseney Stickiness Cell (Stable Micro<br />
Systems) according to the method described by Chen &<br />
Hoseney (1995). A Brabender Extensograph-E was used<br />
[ICC st<strong>and</strong>ard method no. 114 ⁄ 1 (International Association<br />
of Cereal Science <strong>and</strong> Technology, 1992)] to<br />
further analyse the visco-elastic characteristics of flour–<br />
fibre samples. Flour–fibre blends were also analysed<br />
using a GPT. Flour blends were prepared by replacement<br />
with cellulose fibre at 0.1%, 1%, 5% or 10%. The<br />
GPT was operated at 30 °C for 20 min at a speed of<br />
3000 rpm. The sample to water ratio was 9.9 g SWF or<br />
8.5 g HWF to 10 mL water. Data for peak torque, lift<br />
off time <strong>and</strong> peak maximum time were obtained from<br />
the software. All measurements were conducted in<br />
duplicate.<br />
Statistical analysis<br />
Statistical determinations including analysis of variance<br />
(anova) followed by Tukey’s test to distinguish the<br />
responses of different fibre treatments was performed<br />
using spss 16.0 (SPSS Inc., Chicago, IL, USA). The<br />
level at which significant differences are reported is<br />
0.05.<br />
Results <strong>and</strong> Discussion<br />
Starch–fibre interactions<br />
The replacement of starch with SC40 cellulosic fibre<br />
significantly (P < 0.05) affected the pasting properties<br />
of starch systems (Fig. 1a). The peak <strong>and</strong> final viscosities<br />
of starch–fibre blends decreased with increasing<br />
amount of cellulose fibre. The longer fibre (SC200)<br />
exhibited a similar trend to that reported for SC40 (data<br />
not shown). Decrease in viscosity is likely indicative of a<br />
reduced degree of starch granule swelling (Collar et al.,<br />
International Journal of Food Science <strong>and</strong> Technology 2010, 45, 1641–1646 Ó 2010 Institute of Food Science <strong>and</strong> Technology
(a)<br />
Peak viscosity/final viscosity (cp)<br />
(b)<br />
Peak viscosity/final viscosity (cp)<br />
1200<br />
1000<br />
800<br />
600<br />
400<br />
200<br />
1600<br />
1400<br />
1200<br />
1000<br />
Starch peak viscosity Starch final viscosity<br />
0<br />
0 2 4 6 8 10<br />
Cellulose fibre replacement (%)<br />
800<br />
600<br />
400<br />
200<br />
Soft wheat peak viscosity Soft wheat final viscosity<br />
Hard wheat peak viscosity Hard wheat final viscosity<br />
0<br />
0 2 4 6 8 10<br />
Cellulose fibre replacement (%)<br />
Figure 1 Peak <strong>and</strong> final viscosity values of (a) wheat starch <strong>and</strong><br />
(b) hard <strong>and</strong> soft wheat flour when measured with a Micro<br />
ViscoAmlyoGraph at different replacement levels of SC40<br />
cellulosic fibre.<br />
2006) <strong>and</strong> ⁄ or reduced leaching of polymers into the<br />
extragranular spaces.<br />
The firmness of starch–fibre gels decreased with<br />
increasing amount of cellulose fibre replacement<br />
(Fig. 2a). The lower firmness values may be indicative<br />
of the ability of cellulose fibre to interfere with the<br />
retrogradation of starch polymers. Santos et al. (2008)<br />
also reported a decrease in starch retrogradation in the<br />
presence of insoluble fibre when measured using a<br />
calorimetric technique.<br />
Gluten–fibre interactions<br />
The GPT is a new instrument that measures gluten<br />
aggregation properties. Figure 3a,b represents a sample<br />
GPT curve depicting locations of lift off time, peak time,<br />
<strong>and</strong> maximum torque for gluten <strong>and</strong> flour samples,<br />
respectively. Research in our laboratory has demonstrated<br />
that native starch or other flour components do<br />
not affect attributes measured by the GPT (data not<br />
shown). The addition of SC40 cellulose fibre decreased<br />
the peak development time <strong>and</strong> lift off time of gluten–<br />
fibre systems (Fig. 4a). With the exception of 0.1%<br />
Effects of cellulosic fibre on physical <strong>and</strong> rheological properties A. Goldstein et al. 1643<br />
(a)<br />
(b)<br />
Figure 2 Firmness <strong>and</strong> gradient of (a) wheat starch <strong>and</strong> (b) hard wheat<br />
<strong>and</strong> soft wheat flour gels with SC40 replacement as determined by<br />
compression with texture analyzer.<br />
replacement level, a strong negative relationship existed<br />
between lift off time of gluten <strong>and</strong> replacement level of<br />
cellulose fibre (r 2 = 0.84). The longer fibre (SC200)<br />
exhibited a similar trend (data not shown) to data<br />
reported for SC40. The decrease in peak time is likely<br />
related to the ability of cellulose fibre to enhance the<br />
kinetics of gluten network aggregation.<br />
Flour–fibre interactions<br />
The addition of SC40 fibre to SWF resulted in significant<br />
differences (P < 0.05) to the flour-pasting properties.<br />
Significant differences (P < 0.05) in peak <strong>and</strong><br />
final viscosities of SWF were observed between flour<br />
samples with 0.1–1% cellulose fibre replacement <strong>and</strong><br />
Ó 2010 Institute of Food Science <strong>and</strong> Technology International Journal of Food Science <strong>and</strong> Technology 2010, 45, 1641–1646
1644<br />
Effects of cellulosic fibre on physical <strong>and</strong> rheological properties A. Goldstein et al.<br />
(a)<br />
Torque (BE)<br />
(b)<br />
Torque (BE)<br />
70<br />
60<br />
50<br />
40<br />
30<br />
20<br />
Max torque (BE)<br />
Lift off time<br />
(min)<br />
10<br />
0<br />
Peak max time<br />
(min)<br />
0 5 10<br />
Time (min)<br />
15 20<br />
30<br />
25<br />
20<br />
15<br />
10<br />
5<br />
Lift off time<br />
(min)<br />
Max torque (BE)<br />
Peak max time<br />
(min)<br />
Soft wheat flour<br />
Gluten<br />
0<br />
0 2 4 6<br />
Time (min)<br />
8 10<br />
Figure 3 Sample Gluten Peak Tester curve of (a) gluten (5.5 g gluten<br />
⁄ 12 mL H2O) <strong>and</strong> (b) soft wheat flour (9.9 g flour ⁄ 10 mL H2O),<br />
with location of lift off time, peak time, <strong>and</strong> max torque.<br />
flour systems with 5–10% fibre replacement (Fig. 1b).<br />
Trends for HWF were similar to trends for SWF.<br />
Trends in the firmness <strong>and</strong> gradient of flour–fibre gels<br />
(Fig. 2b) were supported by results of starch–fibre gels.<br />
The longer fibre (SC200) exhibited similar trends to that<br />
reported for SC40 (data not shown).<br />
The data from using GPT for flour–fibre interactions<br />
exhibited significant differences. For SWF, a consistent<br />
decrease in lift off time <strong>and</strong> peak time was observed with<br />
an increasing percentage of SC40 fibre replacement<br />
(Fig. 4b), although lift off <strong>and</strong> peak times were not<br />
significantly different (P < 0.05) at 0.1% <strong>and</strong> 1.0%<br />
replacement levels. Trends for HWF were similar to<br />
those observed for SWF. A weak flour will have a rapid<br />
build up in dough consistency to a sharply defined peak<br />
followed by a rapid break down, while a strong flour will<br />
have a much slower build up in dough consistency <strong>and</strong> a<br />
relatively more time to achieve peak consistency. At the<br />
0.1% <strong>and</strong> 1.0% replacement levels, there was no<br />
significant (P < 0.05) effect of cellulose on the strength<br />
of the HWF, while the replacement levels of 5% <strong>and</strong><br />
10% significantly (P < 0.05) weakened the flour, in<br />
particular the gluten network. The longer fibre (SC200)<br />
(a)<br />
12<br />
Lift off time/Peak time (min)<br />
10<br />
8<br />
6<br />
4<br />
2<br />
0<br />
(b)<br />
2.5<br />
Lift off time/Peak time (min)<br />
2<br />
1.5<br />
1<br />
0.5<br />
0<br />
Gluten lift off time<br />
Gluten peak time<br />
0 0.1 1 5 10<br />
Cellulose fibre replacement (%)<br />
Soft wheat lift off time Hard wheat lift off time<br />
Soft wheat peak time Hard wheat peak time<br />
0 0.1 1 5 10<br />
Cellulose fibre replacement (%)<br />
Figure 4 Effect of cellulose fibre replacement on (a) gluten <strong>and</strong> (b)<br />
hard wheat <strong>and</strong> soft wheat flour using Gluten Peak Tester.<br />
exhibited a similar trend to that reported for SC40 (data<br />
not shown).<br />
Significant differences (P < 0.05) in water absorption<br />
were observed between dough systems containing hard<br />
<strong>and</strong> soft wheat flours (Fig. 5). Systems containing HWF<br />
maintained greater water absorption values than those<br />
containing SWF. This result agrees with values reported<br />
in the literature (Gomez et al., 2003; Seguchi et al.,<br />
2007). The differences in water absorption between hard<br />
<strong>and</strong> SWF are believed to be attributed to the protein<br />
content of the flours. Proteins which are naturally<br />
present in flour, including gluten-forming proteins, are<br />
able to absorb 1–2· their weight in water (Pareyt &<br />
Delcour, 2008). Therefore, slight changes in the protein<br />
content of flours can contribute to large differences in<br />
the water absorption of samples.<br />
As the amount of cellulose fibre increased, the<br />
increase in water absorption for the SWF to achieve a<br />
dough consistency of 500 BU was higher than that for<br />
International Journal of Food Science <strong>and</strong> Technology 2010, 45, 1641–1646 Ó 2010 Institute of Food Science <strong>and</strong> Technology
Water absorption (%)<br />
75<br />
70<br />
65<br />
60<br />
Hard wheat Sc40<br />
55<br />
Soft wheat Sc40<br />
Hard wheat Sc200<br />
Soft wheat Sc200<br />
50<br />
0 2 4 6 8 10<br />
Cellulose fibre replacement (%)<br />
Figure 5 The effect of cellulosic fibre replacement on the water<br />
absorption of hard <strong>and</strong> soft wheat flour systems.<br />
HWF. The increase in water absorption is believed to be<br />
related to the presence of cellulose fibre (Gomez et al.,<br />
2003). Cellulose fibres are able to hold many times their<br />
initial weight in water, <strong>and</strong> the hydroxyl groups present<br />
in cellulose fibre allows for more interactions with water<br />
through hydrogen bonding (Gomez et al., 2003). The<br />
starch content of the flour is not believed to influence the<br />
water absorption of flour samples as the starch granules<br />
will not absorb water at ambient temperature. The<br />
addition of cellulosic fibre to dough systems did not<br />
appear to have a significant (P < 0.05) influence on the<br />
mixing time, stability, <strong>and</strong> development time of the<br />
dough samples.<br />
The addition of SC40 <strong>and</strong> SC200 cellulose fibre to<br />
SWF dough resulted in dough with decreased stickiness<br />
values (Fig. 6). At cellulose fibre replacement levels of<br />
1–10%, SWF dough with SC40 replacement were<br />
significantly (P < 0.05) more sticky than dough with<br />
SC200 fibre replacement. With HWF, significant<br />
(P < 0.05) decreases in stickiness were observed at<br />
5–10% fibre replacement levels, although no significant<br />
(P < 0.05) differences in stickiness were observed at<br />
0–1% fibre replacement levels. The decrease in stickiness<br />
in HWF from 5% to 10% cellulose replacement was<br />
proportionally greater in HWF dough treated with<br />
SC200 when compared to SC40. In general, HWF<br />
dough was stickier than SWF dough. This may be<br />
attributed to the greater protein <strong>and</strong> gluten content<br />
present in HWF. Glutenin, a component of gluten, is<br />
believed to be contributing to stickiness of dough<br />
systems (Eliasson & Larrson, 1993).<br />
The effect of cellulose fibre replacement on the viscoelastic<br />
properties of HWF <strong>and</strong> SWF are listed in<br />
Effects of cellulosic fibre on physical <strong>and</strong> rheological properties A. Goldstein et al. 1645<br />
Figure 6 The effect of cellulosic fibre replacement on the stickiness<br />
of hard <strong>and</strong> soft wheat flour systems.<br />
Table 2. In general, significant (P < 0.05) reductions<br />
in energy required to tear both HWF <strong>and</strong> SWF dough<br />
was observed at 10% replacement levels. The reduction<br />
in the energy required was less in the case of the HWF<br />
dough (approximately 10% <strong>and</strong> 20% reduction was<br />
observed when both fibre sizes were replaced at 5% <strong>and</strong><br />
10%, respectively) compared to the SWF dough. The<br />
energy required to tear the SWF dough was reduced<br />
22.5% <strong>and</strong> 47.5% when SC40 was used at 5% <strong>and</strong> 10%<br />
replacement level; <strong>and</strong> 15.0% & 30.0% when SC200 was<br />
used at 5% <strong>and</strong> 10% replacement levels, respectively.<br />
For SWF, the R ⁄ E ratio values were seen to increase<br />
with an increasing percentage of fibre replacement. At<br />
5% <strong>and</strong> 10% replacement levels, SC200 fibre main-<br />
Table 2 Comparison of the visco-elastic nature of hard <strong>and</strong> soft wheat<br />
flour dough with SC40 <strong>and</strong> SC200 cellulose fibre replacement<br />
Flour type Hard wheat flour Soft wheat flour<br />
Fibre replacement (%) SC40 SC200 SC40 SC200<br />
Energy (cm 3 )<br />
0 100ab *<br />
100ab 40a 40a<br />
0.1 108a 103a 37ab 37ab<br />
1 114a 107a 38ab 39a<br />
5 90ab 92ab 31c 34b<br />
10<br />
R ⁄ E Ratio<br />
80b 76b 21d 28c<br />
0 1.1a 1.1a 0.97a 0.97a<br />
0.1 1.0a 1.0a 0.9a 0.89a<br />
1 1.2a 1.2a 1.1a 1.18a<br />
5 1.5b 2.4b 1.43b 1.84b<br />
10 2.3c 3.2c 1.49b 2.55c<br />
*Values in columns sharing the same measurement parameter followed<br />
by the same letter are not significantly different at the 95% confidence<br />
level.<br />
Ó 2010 Institute of Food Science <strong>and</strong> Technology International Journal of Food Science <strong>and</strong> Technology 2010, 45, 1641–1646
1646<br />
Effects of cellulosic fibre on physical <strong>and</strong> rheological properties A. Goldstein et al.<br />
tained greater R ⁄ E ratio values than SC40 fibre<br />
replacement in SWF <strong>and</strong> HWF dough.<br />
The visco-elastic changes observed may be related to<br />
interactions between insoluble fibres <strong>and</strong> protein networks.<br />
The increase in the resistance ⁄ extensibility (R ⁄ E)<br />
ratio observed with increasing fibre replacement is<br />
indicative that the dough became stiffer with increasing<br />
fibre replacement (Sudha et al., 2007). Increase in R ⁄ E<br />
ratio was proportionally greater for HWF samples<br />
compared to SWF. Insoluble fibres such as cellulose<br />
are believed to disrupt <strong>and</strong> weaken the gluten matrix<br />
(Seetharaman et al., 1997). A symptom of the weakened<br />
matrix may be the reduced extensibility values <strong>and</strong><br />
reduced energy required to tear dough observed with<br />
increasing cellulose fibre replacement.<br />
Conclusion<br />
It can clearly be seen that the addition of cellulose fibre<br />
affected many rheological <strong>and</strong> visco-elastic parameters<br />
of starch, gluten <strong>and</strong> flour systems. The size of cellulose<br />
fibre addition was seen to cause significant differences in<br />
water absorption, stickiness <strong>and</strong> visco-elastic properties<br />
of flour–fibre systems. Cellulose fibre affected the<br />
dough-mixing characteristics of wheat flour as greater<br />
water absorption was required to attain a consistency of<br />
500 BU with increasing fibre replacement. The pasting<br />
properties of flour <strong>and</strong> starch systems were similarly<br />
affected by cellulosic fibre replacement, as the competition<br />
for water in the presence of cellulose resulted in<br />
decreased starch granular swelling corresponding to<br />
decreased peak <strong>and</strong> final viscosities. The interaction of<br />
fibres with hard or soft wheat flours had similar trends,<br />
but the extent of change was different in the two flour<br />
systems. The peak <strong>and</strong> lift off time of flour–fibre blends<br />
decreased with increasing fibre replacement, indicating<br />
that cellulose fibre has the ability to enhance the kinetics<br />
of gluten aggregation. Further research is required to<br />
better underst<strong>and</strong> the interactions between cellulose<br />
fibre <strong>and</strong> the major components of dough, including a<br />
better underst<strong>and</strong>ing regarding why in certain situations<br />
hard <strong>and</strong> SWF have disproportionate responses<br />
to cellulose fibre replacement, <strong>and</strong> a better underst<strong>and</strong>ing<br />
of the interactions between gluten <strong>and</strong> cellulose<br />
fibre.<br />
References<br />
AACC International (2000a). Approved Methods of the American<br />
Association of Cereal Chemists, 10th edn. Method 54-21A. St Paul,<br />
MN: The Association.<br />
AACC International (2000b). Approved Methods of the American<br />
Association of Cereal Chemists, 10th edn. Method 56-11.02. St Paul,<br />
MN: The Association.<br />
Ang, J.F. (2001). Powdered cellulose <strong>and</strong> the development of new<br />
generation healthier foods. Cereal Foods World, 46, 107–111.<br />
Chen, W.Z. & Hoseney, R.C. (1995). Development of an objective<br />
method for dough stickiness. Lebensmittel-Wissenschaft <strong>and</strong> Technologie,<br />
28, 467–473.<br />
Chen, H., Rubenthaler, G.L. & Schanus, E.G. (1988). Effect of Apple<br />
Fiber <strong>and</strong> Cellulose on the Physical-Properties of Wheat-Flour.<br />
Journal of Food Science, 53, 304–305.<br />
Collar, C., Santos, E. & Rosell, C.M. (2006). Significance of dietary<br />
fibre on the viscometric pattern of pasted <strong>and</strong> gelled flour-fibre<br />
blends. Cereal Chemistry, 83, 370–376.<br />
Eliasson, A. & Larrson, K. (1993). Cereals in Breadmaking: A<br />
Molecular Colloidal Approach. Pp. 68–69. reissue. USA: CRC Press.<br />
Gomez, M., Ronda, F., Blanco, C.A., Caballero, P.A. & Apesteguia,<br />
A. (2003). Effect of dietary fibre on dough rheology <strong>and</strong> bread<br />
quality. European Food Research <strong>and</strong> Technology, 216, 51–56.<br />
Guillon, F. & Champ, M. (2000). Structural <strong>and</strong> physical properties of<br />
dietary fibres, <strong>and</strong> consequences of processing on human physiology.<br />
Food Research International, 33, 233–245.<br />
International Association of Cereal Science <strong>and</strong> Technology (1992).<br />
ICC St<strong>and</strong>ard Methods-Principles. ICC St<strong>and</strong>ard Method No.<br />
114 ⁄ 1. Vienna, Austria: ICC Secretariat.<br />
Kohajdova, Z. & Karovicova, J. (2008). Influence of hydrocolloids on<br />
quality of baked goods. Acta Scientiarum Polonorum – Technologia<br />
Alimentaria, 7, 43–49.<br />
Pareyt, B. & Delcour, J.A. (2008). The role of wheat flour constituents,<br />
sugar, <strong>and</strong> fat in low moisture cereal based products: a review on<br />
sugar-snap cookies. Critical reviews in food science <strong>and</strong> nutrition, 48,<br />
824–839.<br />
Pomeranz, Y. (1977). Fiber in breadmaking – a review of recent<br />
studies. Bakers’ Digest, 51, 94–96, 142.<br />
Santos, E., Rosell, C.M. & Collar, C. (2008). Gelatinization <strong>and</strong><br />
retrogradation kinetics of high-fibre wheat flour blends: a calorimetric<br />
approach. Cereal Chemistry, 85, 457–465.<br />
Seetharaman, K., Waniska, R.D. & Dexter, L. (1994). An Approach to<br />
Increasing Fiber Content of Wheat Tortillas. Cereal Foods World,<br />
39, 444–447.<br />
Seetharaman, K., McDonough, C.M., Waniska, R.D. & Rooney,<br />
L.W. (1997). Microstructure of wheat flour tortillas: effects of<br />
soluble <strong>and</strong> insoluble fibres. Food Science <strong>and</strong> Technology International,<br />
3, 181–188.<br />
Seguchi, M., Tabara, A., Fukawa, I. et al. (2007). Effects of size of<br />
cellulose granules on dough rheology, microscopy, <strong>and</strong> breadmaking<br />
properties. Journal of Food Science, 72, E79–E84.<br />
Sudha, M.L., Baskaran, V. & Leelavathi, K. (2007). Apple pomace as a<br />
source of dietary fibre <strong>and</strong> polyphenols <strong>and</strong> its effect on the rheological<br />
characteristics <strong>and</strong> cake making. Food Chemistry, 104, 686–692.<br />
International Journal of Food Science <strong>and</strong> Technology 2010, 45, 1641–1646 Ó 2010 Institute of Food Science <strong>and</strong> Technology
International Journal of Food Science <strong>and</strong> Technology 2010, 45, 1647–1658 1647<br />
Original article<br />
Resistance of industrial mango peel waste to pectin degradation<br />
prior to by-product drying<br />
Suparat Sirisakulwat, 1,2 Pittaya Sruamsiri, 2 Reinhold Carle 1 & Sybille Neidhart 1 *<br />
1 Institute of Food Science <strong>and</strong> Biotechnology, Chair of Plant Foodstuff Technology, Hohenheim University, Garbenstrasse 25, 70599 Stuttgart,<br />
Germany<br />
2 Department of Crop Science <strong>and</strong> Natural Resources, Faculty of Agriculture, Chiang Mai University, Chiang Mai 50200, Thail<strong>and</strong><br />
(Received 3 December 2009; Accepted in revised form 19 May 2010)<br />
Summary Susceptibility of industrial mango peel waste to pectin degradation during storage at ambient conditions<br />
(25 °C, 63% relative humidity) for up to 5 h before by-product stabilisation by drying was explored.<br />
Depending on the interim storage period in the wet state, pectins were recovered from the dried peels by hotacid<br />
extraction. Most important, pectin degradation during the temporary storage of the wet peels was<br />
insignificant, as revealed by yields, composition, average molecular properties, <strong>and</strong> techno-functional<br />
quality. Hardly acetylated (DAc 2.5–4.5%), rapid-set high-methoxyl pectins were obtained at starchcorrected<br />
net yields of 14.1–15.6 g hg )1 . Irrelevant de-esterification during peel storage in the wet state was<br />
confirmed by overall uniform setting temperatures. Arabinogalactans, uniformly indicated by high molar<br />
galactose ⁄ rhamnose ratios of 13.8–16.9 mol ⁄ mol <strong>and</strong> an arabinose percentage of 9.5–14.4 mol hmol )1 of<br />
galactose residues, affected the galacturonide contents, intrinsic viscosities, <strong>and</strong> gel strengths throughout.<br />
The wet peels, derived from widespread manual peeling in mango canning, tolerated intermediate storage for<br />
5 h, thus facilitating by-product stabilisation on smaller scales.<br />
Keywords By-product drying, enzymatic degradation, fruit processing, intermediate storage, mango (Mangifera indica L.), pectin, waste<br />
utilisation.<br />
Introduction<br />
Owing to large quantities <strong>and</strong> pectin yields up to 21%<br />
on a dry weight basis (Rehman et al., 2004), mango<br />
(Mangifera indica L.) by-products, chiefly peel waste<br />
from juice production, drying, <strong>and</strong> canning, have been<br />
deemed a promising source not yet commercially<br />
exploited (Panouille´ et al., 2007). Reported pectin yields<br />
from mango peels greatly varied, despite insignificant<br />
depolymerisation of pectins <strong>and</strong> galactans in the peel<br />
during postharvest ripening (Sirisakulwat et al., 2008).<br />
Moreover, the gelling capacities of the rapid-set to ultrarapid-set<br />
pectins from mango peels may be more or less<br />
limited by a characteristic almost monodisperse fraction<br />
that may considerably reduce the average molecular<br />
weight depending on its mass percentage (Neidhart<br />
et al., 2009).<br />
Processing by-products like peels are highly perishable<br />
in the wet state. At present, pectins are commercially<br />
recovered from the dried press cake of apple (Malus<br />
*Correspondent: Tel: +49(0)711 459 22317; Fax: +49(0)711 459 24110;<br />
e-mail: Sybille.Neidhart@uni-hohenheim.de<br />
doi:10.1111/j.1365-2621.2010.02314.x<br />
Ó 2010 The Authors. Journal compilation Ó 2010 Institute of Food Science <strong>and</strong> Technology<br />
domestica Borkh.) juice manufacture <strong>and</strong> the peels<br />
<strong>and</strong> rags of citrus juice processing, chiefly lemon [Citrus<br />
limon (L.) Burm. F.] <strong>and</strong> lime [Citrus aurantiifolia<br />
(Christm.) Swingle], because their pectin properties are<br />
suitable for food applications (Endress et al., 2006).<br />
Because grinding of apples causes severe loss of cell<br />
compartmentalisation, apple pomace requires drying<br />
within a few hours (Voragen et al., 1995), preferably<br />
straight after de-juicing of the mash (Endress et al.,<br />
2006), to inactivate pectin-degrading enzymes <strong>and</strong> to<br />
prevent microbial decay. Due to techniques restricting<br />
de-juicing to the citrus endocarp, tissue damage of citrus<br />
peels is less serious <strong>and</strong> pectins may be produced from the<br />
wet residues in the vicinity of a citrus processing plant<br />
(Endress et al., 2006), especially when the essential<br />
washing of citrus peels is combined with their immediate<br />
blanching after juice extraction (Voragen et al., 1995).<br />
However, shipping, storage, <strong>and</strong> year-round pectin production<br />
independent of raw material availability require<br />
instantaneous by-product drying in each case.<br />
Like numerous microbial enzymes, a so far limited<br />
number of plant enzymes are involved in pectin degradation<br />
(Benen et al., 2003b). Besides depolymerisation
1648<br />
Stability of mango peel by-products S. Sirisakulwat et al.<br />
through endo- (EC 3.2.1.15) <strong>and</strong> exo-acting (EC 3.2.<br />
1.67) polygalacturonases (PG), pectin methyl esterases<br />
(PME, EC 3.1.1.11) affecting the degree of esterification<br />
are most crucial. Without immediate drying or at least<br />
blanching of citrus peels, even slight de-esterification<br />
because of high endogenous PME activities may cause<br />
calcium-sensitive pectins unsuitable as gelling agents<br />
(Voragen et al., 1995). Apart from some soluble forms,<br />
PME is mainly associated with cell wall proteins by<br />
ionic interactions (Benen et al., 2003a). Additionally,<br />
pectin homogalacturonan acetylesterases (PAE, EC 3.1.<br />
1.6) occur in orange <strong>and</strong> a few other plant species<br />
(Benen et al., 2003a). Aside from PG, pectate lyase<br />
(PAL, EC 4.2.2.2) <strong>and</strong> endo-rhamnogalacturonan<br />
hydrolase (endoRGH) have been found in plants as<br />
further pectin backbone depolymerases (Benen et al.,<br />
2003b). Degradation of pectin side chains involves<br />
arabinanases <strong>and</strong> galactanases, such as a carrot<br />
a-l-arabinofuranosidase (EC 3.2.1.55) <strong>and</strong> a tomato<br />
exo-b(1 fi 4)-d-galactanase (De Vries & Visser, 2003).<br />
During fruit ripening, plant b-d-galactosidases (EC<br />
3.2.1.23), increasing in parallel with tissue softening,<br />
cause pectin depolymerisation by side-chain loss <strong>and</strong><br />
enhanced pectin solubilisation (Brummell, 2006). In<br />
ripening mango mesocarp, b-d-galactosidase activity<br />
even rose to the eightfold level from the mature-green<br />
to the ripe stage, but PG <strong>and</strong> b(1 fi 4)-d-glucanase<br />
(EC 3.2.1.4) only to the 1.6- <strong>and</strong> 2.4-fold activities,<br />
while PME declined to 41% (Ali et al., 2004).<br />
Although the mango cultivars may differ in the<br />
properties of three PG isoforms (Prasanna et al.,<br />
2006; Singh & Dwivedi, 2008), mango PG turned out<br />
to be mainly exo-acting (Ali et al., 2004). Homogalacturonan<br />
degradation in mango mesocarp has thus<br />
recently been ascribed to a softening-related PAL<br />
rather than to PG (Chourasia et al., 2006). Consistent<br />
with much lower, rather constant PME <strong>and</strong> PG<br />
activities in the peel relative to the mesocarp (Yanru<br />
et al., 1995), carbohydrate changes in mango peels<br />
because of postharvest ripening were mainly restricted<br />
to the degradation of starch <strong>and</strong> matrix glycan fragments<br />
(Sirisakulwat et al., 2008).<br />
On the other h<strong>and</strong>, the mango fruit may predominantly<br />
be processed at higher ambient temperature <strong>and</strong><br />
humidity than the citrus fruit <strong>and</strong> apples in view of the<br />
climate in the respective growing areas. Therefore,<br />
rather adverse conditions during a temporary storage<br />
of wet mango peels between peeling <strong>and</strong> by-product<br />
drying may occur in practice. Their impact on pectin<br />
quality must be known with respect to minimum<br />
requirements for sustainable by-product stabilisation<br />
processes when evaluating this potential raw material<br />
source, primarily because mango processing represents a<br />
very multifaceted field with a wide range of production<br />
scales (Va´squez-Caicedo et al., 2004, 2007; Pott et al.,<br />
2005).<br />
As regards a secure <strong>and</strong> economic supply of highquality<br />
mango by-products for further upgrading, this<br />
study therefore aimed at evaluating the proneness of<br />
industrial peel waste to pectin degradation during a<br />
temporary dwell time at ambient conditions until<br />
drying. The tolerable period between waste production<br />
(peeling) <strong>and</strong> drying was to be identified, mimicking<br />
different operational situations in mango processing.<br />
The contribution of by-product h<strong>and</strong>ling to the variations<br />
of mango pectins in yield <strong>and</strong> quality was to be<br />
assessed.<br />
Materials <strong>and</strong> methods<br />
Sample material <strong>and</strong> experimental design<br />
Industrial peel waste, originating from ‘Kaew Khiew’<br />
mango fruit, was obtained from a canning factory in<br />
Chiang Mai, Thail<strong>and</strong>, during the mango processing<br />
campaign in April 2005. Nine samples were consecutively<br />
drawn within 4 h. For each of them, 1800 g of<br />
fresh peel waste was quickly collected from three manual<br />
peeling lines by r<strong>and</strong>omly picking the material from<br />
various positions of the lines directly after its removal<br />
from the fruit. To explore the tolerable period between<br />
peeling <strong>and</strong> waste drying, the peels of each sample were<br />
exposed to the ambient conditions of the peeling room<br />
(25 °C; 63% relative humidity, RH) in an open bowl<br />
for holding times (HT25 °C) of 0 (variant MPW1),<br />
15 (MPW2), 30 (MPW3), 60 (MPW4), 90 (MPW5),<br />
120 (MPW6), 180 (MPW7), 240 (MPW8), <strong>and</strong> 300 min<br />
(MPW9), respectively. Subsequently, the peels of each<br />
sample were packed as a thin layer into a polyethylene<br />
(PE) pouch <strong>and</strong> frozen in a freezer, which was temporarily<br />
installed near the peeling lines. So far, the<br />
experiment was performed close to the peeling lines<br />
when they were in full operation. Because of limited<br />
drying capacity, the samples were temporarily stored at<br />
)20 °C until drying. Without previous external thawing,<br />
the frozen peel samples were dried at 80 °C for approximately<br />
4 h in a fluidized-bed laboratory dryer (Rapid<br />
dryer TG 1, Retsch, Haan, Germany) until a moisture<br />
content of 4.5–6.6 g hg )1 . After weighing to record the<br />
yield of the dried mango peel waste (MPW)<br />
(21.6–29.8 g hg )1 of fresh peel waste), the dried peels<br />
were vacuum-packed into PE pouches <strong>and</strong> transported<br />
by airfreight to Hohenheim University, Stuttgart,<br />
Germany, where they were manually crushed, vacuumpacked<br />
into PE pouches, <strong>and</strong> stored at ambient temperature<br />
(approximately 22–25 °C) in a desiccator until<br />
pectin extraction. By using the methodology detailed<br />
earlier (Sirisakulwat et al., 2008), the recovered pectins<br />
were characterised in terms of composition as well as<br />
average molecular <strong>and</strong> techno-functional properties.<br />
Analytical <strong>and</strong> empirical methods commonly used by<br />
pectin producers for quality assessment were included.<br />
International Journal of Food Science <strong>and</strong> Technology 2010 Ó 2010 The Authors. Journal compilation Ó 2010 Institute of Food Science <strong>and</strong> Technology
Ripeness of the fruit processed was assessed at<br />
Chiang Mai University, Chiang Mai, Thail<strong>and</strong>, by<br />
analogy to a previous study (Sirisakulwat et al., 2008)<br />
on the basis of five fruits that were r<strong>and</strong>omly selected<br />
among the fruits provided for peeling. The maturityspecific<br />
properties of the edible part included the pH<br />
value (pH 3.85 ± 0.01) <strong>and</strong> the contents of total<br />
soluble solids (TSS; 18.7 ± 0.07 °Brix) <strong>and</strong> titratable<br />
acids (TA as citric acid, pH 8.1; 0.58 ± 0.01 g hg )1 ),<br />
corresponding to a sugar ⁄ acid ratio (TSS ⁄ TA) of<br />
32.2 ± 0.7. Mesocarp firmness, measured with an<br />
Instron Universal Texture Analyzer type 3365 (Instron,<br />
Canton, MA, USA) as specific maximum load (SFKS)<br />
by using a Kramer shear cell (Va´squez-Caicedo et al.,<br />
2006), ranged at 472 ± 9 N hg )1 . Compared to the<br />
mango fruit of a related study (Sirisakulwat et al.,<br />
2008), the mesocarp properties came overall most close<br />
to those of the ‘Kaew Khiew’ (KAk) batch, which had<br />
previously been examined after major fruit softening<br />
(ripeness stage II). For this batch, a TSS ⁄ TA ratio of<br />
55.2 ± 0.9 was reported. Its mesocarp firmness of<br />
4.4 ± 0.1 N, recorded with a Warner–Bratzler shear<br />
cell, corresponded to a SFKS of 519 ± 19 N hg )1<br />
measured concomitantly. For comparison, full-ripe<br />
fruit (stage III) had then been characterised by a<br />
TSS ⁄ TA ratio of 94.1 ± 2.6 <strong>and</strong> low firmness records<br />
of 1.8 ± 0.04 N <strong>and</strong> 373 ± 12 N hg )1 , respectively<br />
(Sirisakulwat et al., 2008). Compared to these two<br />
batches, the fruit of this study thus had a lower sugar<br />
content <strong>and</strong> TSS ⁄ TA ratio, but mesocarp firmness was<br />
intermediate.<br />
Pectin extraction from dried mango peel waste<br />
Industrial hot-acid extraction was mimicked on a<br />
laboratory scale. Pectin was extracted from the dried<br />
raw material (DRM) at pH 1.5, applying a st<strong>and</strong>ard<br />
protocol (Sirisakulwat et al., 2008) to the dried MPW<br />
on the double scale throughout. Per run, 40 g of MPW<br />
was filled up with distilled water to a total of 800 g. The<br />
suspension was boiled for 15–20 min <strong>and</strong> recooled. The<br />
pH was adjusted to 1.5 with H2SO4 (25% w ⁄ w) prior to<br />
extraction (90 °C, 2.5 h) in an oil bath. Separation of the<br />
extract as well as precipitation in propan-2-ol (‡ 99.9%<br />
v ⁄ v) <strong>and</strong> drying (60 °C, 1–2 h) of the pectins were<br />
performed as described previously (Sirisakulwat et al.,<br />
2008). Nine runs were carried out for each MPW<br />
sample. For each run, the yield of dried crude pectin was<br />
calculated as alcohol-insoluble substance (AIS, g hg )1 of<br />
DRM). Per sample, the AIS of all runs was pooled <strong>and</strong><br />
ground in a centrifugal mill type ZM 1 (Retsch, Haan,<br />
Germany) to particle sizes
1650<br />
Stability of mango peel by-products S. Sirisakulwat et al.<br />
USA) with a Waters 2410 refractive index detector set to<br />
35 °C. An Aminex HPX-87H column (300 · 7.8 mm;<br />
Bio-Rad Laboratories, Hercules, CA, USA) was eluted<br />
at 40 °C with 0.01 n H2SO4 (0.6 mL min )1 ). Samples<br />
were prepared in duplicate with two injections per vial.<br />
Lithium lactate, dissolved in alkaline propan-2-ol,<br />
served as internal st<strong>and</strong>ard.<br />
The moisture content (g hg )1 of AIS) was gravimetrically<br />
determined in duplicate as mass loss after drying<br />
of 1 g of AIS in a porcelain crucible at 105 ± 2 °C ina<br />
hot-air cabinet for 2 h (Joint FAO ⁄ WHO Expert<br />
Committee on Food Additives (JECFA), 2007) <strong>and</strong><br />
recooling in a desiccator until constant weight. After<br />
slow preincineration of the moisture-free AIS on an<br />
electric heating plate, the ash content (g hg )1 of AIS)<br />
was quantified by complete incineration (550 °C, 3 <strong>and</strong><br />
16 h) in a muffle furnace with intermediate wetting of<br />
the recooled sample [2–4 drops of ultra-pure water <strong>and</strong><br />
4–5 drops of H2O2 (30% w ⁄ w)] <strong>and</strong> drying (105 ± 2 °C,<br />
1 h) (Sirisakulwat et al., 2008). The mass of the white<br />
ash was verified after further incineration (550 °C, 1 h)<br />
<strong>and</strong> recooling (60 min).<br />
Quantification of average macromolecular pectin properties<br />
The intrinsic viscosity ([g], mL g )1 ) was assessed as an<br />
average parameter influenced by all polymers of an AIS<br />
sample. Based on the single-point relationship (Solomon-Ciuta<br />
equation), it was computed from the specific<br />
viscosities [gsp ¼ ðgsgoÞ=go] of different AIS solutions<br />
as a mean of ten records <strong>and</strong> verified by the Huggins<br />
plot <strong>and</strong> the Kraemer plot as detailed previously<br />
(Sirisakulwat et al., 2008). The AIS contents (c) of five<br />
solutions per sample were adjusted to the gsp range of<br />
0.2–1 (Morris, 1995) by appropriate dilution of a sample<br />
stock solution (c = 0.3–0.4 g dL )1 ) with the solvent.<br />
The dynamic viscosities (g = Kqt, mPa s) of AIS<br />
solutions (g s) <strong>and</strong> solvent (g o) were calculated from the<br />
flow time (t, s), measured at 20 °C for a test volume of<br />
2mL(2· 3 runs for to <strong>and</strong> ts, respectively) by using a<br />
Micro-Ostwald capillary viscosimeter (capillary constant<br />
K = 0.01181 mm 2 s )2 ). The densities (q, gcm )3 )<br />
of AIS solutions (qs) <strong>and</strong> solvent (qo) were measured at<br />
20 °C with a density meter DMA 48 (Anton Paar, Graz,<br />
Austria). The AIS was dissolved under automatic<br />
shaking (16 h) before adjusting the volume of the stock<br />
solution to 100 mL. A 0.28 m buffer (pH 3.0 ± 0.05) of<br />
potassium acetate (KOAc: 4.57 g L )1 ) <strong>and</strong> lactic acid<br />
[HOLc (90%): 23.59 g L )1 ] served as solvent, mimicking<br />
the gel systems used for the gelation studies in terms of<br />
pH <strong>and</strong> concentration.<br />
Characterisation of techno-functional pectin properties<br />
For pectin-sucrose gels (TSS = 65 °Brix, pH 3) with<br />
AIS doses (cp) of 0.4 <strong>and</strong> 0.55 g hg )1 in a KOAc ⁄ HOLc<br />
buffer (0.25 mol kg )1 of gel), the setting temperatures<br />
were assayed by dynamic rheometric analyses in duplicate<br />
or triplicate, using a Bohlin CVO 120 HR rheometer<br />
(Malvern Intruments, Herrenberg, Germany) with a<br />
Searle cylinder device (C 25) (Sirisakulwat et al., 2008).<br />
The AIS, premixed with a small portion of the sucrose,<br />
was carefully dispersed at ambient temperature in the<br />
diluted buffer that resulted from 68 g of distilled water<br />
<strong>and</strong> 17 g of a KOAc ⁄ HOLc buffer stock solution<br />
[KOAc: 40.48 g L )1 ; HOLc (90%): 188.05 g L )1 ]. When<br />
the AIS was completely dissolved under heating in<br />
the presence of 1–2 drops of defoaming emulsion, the<br />
remaining part of the sugar was stepwise added to the<br />
boiling mixture. TSS was adjusted by cooking to a<br />
precalculated net weight of 170 g under stirring. Subsequently,<br />
the sample was poured into the preheated C 25<br />
device (90 °C). To avoid evaporation <strong>and</strong> superficial<br />
hardening, the free sample surface was covered with hot<br />
low-viscous liquid paraffin. Gel formation was monitored<br />
by measuring the storage (G¢) <strong>and</strong> the loss (G¢¢)<br />
moduli as well as the phase angle [d = arctan (G¢¢ ⁄ G¢)]<br />
at a fixed frequency (f = 1 Hz) <strong>and</strong> strain amplitude<br />
(c = 0.015) as a function of time (t, s) during cooling<br />
from 90 to 20 °C at a constant rate (DT = )0.999 ±<br />
0.002 K min )1 ). In the sol–gel transition range, the d-t<br />
curves were iteratively approximated by a modified<br />
logistic four-parameter model (Neidhart et al., 2003),<br />
using the NLIN procedure (Marquardt method) of the<br />
Statistical Analysis System (SAS) 9.1 (SAS Institute,<br />
Cary, NC, USA). The setting time (td¼45 , s) <strong>and</strong><br />
temperature (Td¼45 , °C) were deduced from the crossover-point<br />
of the moduli [d(1 Hz) = 45°].<br />
The gel properties were characterised by the breaking<br />
strengths (BS) of pectin-sucrose gels (TSS = 65 °Brix,<br />
pH 3) with AIS doses of 0.3 <strong>and</strong> 0.35 g hg )1 in a<br />
KOAc ⁄ HOLc buffer (0.28 mol kg )1 of gel) on the basis<br />
of an empirical tension test established for the st<strong>and</strong>ardisation<br />
of pectins <strong>and</strong> the comparative evaluation of<br />
pectin sources (Endress & Dilger, 1990). By using the<br />
Herbstreith-Pectinometer type Mark III (Herbstreith &<br />
Fox, Neuenbu¨ rg, Germany), the BS was recorded in<br />
device-specific units (Herbstreith-Pectinometer units,<br />
HPE). The AIS dose required for a st<strong>and</strong>ardised gel<br />
(BS = 530 HPE) was calculated by interpolation as the<br />
breaking capacity of the AIS (BC530HPE, ghg )1 of gel).<br />
By dividing the sugar content of this gel (TSS) by<br />
BC530HPE, the gelling capacity of the AIS (SBC530HPE,<br />
gg )1 of AIS) was obtained as the sugar-binding<br />
capacity, i.e., the amount of sugar bound by this AIS<br />
dose in a gel of 530 HPE. Multiplication of SBC530HPE<br />
with the AIS content of the DRM (dried MPW) yielded<br />
the corresponding gelling capacity of the DRM<br />
extracted (SBCDRM, ghg )1 of DRM). With each AIS<br />
dose, a gel was prepared by cooking the AIS-containing<br />
mixture on the basis of 216.0 g of sugar <strong>and</strong> 147.0 g of a<br />
0.65 m KOAc ⁄ HOLc buffer [KOAc: 10.5 g L )1 ; HOLc<br />
International Journal of Food Science <strong>and</strong> Technology 2010 Ó 2010 The Authors. Journal compilation Ó 2010 Institute of Food Science <strong>and</strong> Technology
(90%): 54.25 g L )1 ] to a final net weight of 338 g <strong>and</strong><br />
subsequent hot-filling of 100 ± 1 g into each of three<br />
test cups (Sirisakulwat et al., 2008). After 2 h of gel<br />
curing in a water-bath (20 °C), BS was measured for<br />
each test cup. TSS <strong>and</strong> pH of all gel samples were<br />
experimentally verified. For their normalisation to<br />
constant AUA levels, BC530HPE <strong>and</strong> SBC530HPE were<br />
related to the AUA titr content of the AIS <strong>and</strong> expressed<br />
as BC530HPE (AUAtitr) [in g of AUA hg )1 of gel] <strong>and</strong><br />
SBC530HPE (AUAtitr) [in g of sugar g )1 of AUA],<br />
respectively.<br />
Results <strong>and</strong> discussion<br />
Impact of peel storage on pectin yields<br />
Irrespective of the exposure of the wet peels to the<br />
ambient conditions of the peeling room (25 °C; 63%<br />
RH) for up to 5 h, the crude pectin yields (AIS) from<br />
hot-acid extraction of the dried by-products amounted<br />
to 14.7–16.2 g hg )1 of DRM, with the median ranging<br />
at 15.7 g hg )1 (Table 1). Because of comparatively low<br />
starch contents of 2.2–5.6 g hg )1 of AIS, the net pectin<br />
yields (AISS-corr) were 14.1–15.6 g hg )1 of DRM. The<br />
chronological order of peel sampling is exemplarily<br />
shown in Fig. 1. As revealed by respective sorting of the<br />
samples, the highest crude <strong>and</strong> net pectin yields were<br />
uniformly recorded for the first (MPW9) <strong>and</strong> the last<br />
sample (MPW3), whereas the largest differences were<br />
observed for the three samples collected within the first<br />
64 min (MPW9, MPW1, <strong>and</strong> MPW8). Moreover, the<br />
peel sample dried without previous dwell period at<br />
ambient temperature (MPW1) was among those showing<br />
the lowest net pectin yield, whereas MPW9 peaked<br />
despite the interim storage of the wet peels for 5 h. Thus,<br />
the temporary exposure of the residues to the ambient<br />
conditions of the peeling room did not affect the<br />
achievable pectin yields. In fact, it was the natural<br />
heterogeneity of the peel waste that was reflected by the<br />
observed yield variations.<br />
Industrial hot-acid extraction in pectin recovery from<br />
established sources (MacDougall & Ring, 2004) was<br />
mimicked by the procedure applied on the laboratory<br />
scale. With a median of 15.2 g hg )1 of DRM, the net<br />
pectin yields of the samples roughly matched the<br />
average reported for hot-acid extraction of dried mango<br />
peels (Neidhart et al., 2009), slightly exceeding the<br />
pectin amounts extracted with the same method from<br />
peels of the same cultivar (‘Kaew Khiew’, KAk; 12.9–<br />
13.1 g hg )1 ) when the impact of cultivar <strong>and</strong> fruit<br />
ripeness was studied (Sirisakulwat et al., 2008). Findings<br />
detailed elsewhere for peels of related <strong>and</strong> other mango<br />
cultivars (Berardini et al., 2005a,b; Koubala et al., 2008)<br />
were concordant with the median net pectin yield<br />
Table 1 Yields of alcohol-insoluble substance (AIS) extracted from dried peel waste (MPW) that accrued from the industrial canning of<br />
‘Kaew Khiew’ mango fruit after exposure of the wet peels to the ambient conditions of the peeling room (25 °C, 63% relative humidity) for<br />
different holding times (HT 25 °C) up to 5 h prior to waste stabilisation<br />
Variant MPW1 MPW2 MPW3 MPW4 MPW5 MPW6 MPW7 MPW8 MPW9<br />
HT25 °C (min) 0 15 30 60 90 120 180 240 300<br />
AIS a (g hg )1 DRM) 14.9 ± 0.1 15.6 ± 0.2 16.2 ± 0.2 15.7 ± 0.2 15.8 ± 0.2 15.5 ± 0.3 15.7 ± 0.1 14.7 ± 0.3 16.2 ± 0.1<br />
Starch b (g hg )1 AIS) 5.6 ± 0.1 4.0 ± 0.2 3.7 ± 0.02 3.0 ± 0.1 4.2 ± 0.2 2.2 ± 0.03 3.6 ± 0.2 3.9 ± 0.2 3.8 ± 0.002<br />
AIS S-corr c (g hg )1 DRM) 14.1 ± 0.1 14.9 ± 0.2 15.6 ± 0.2 15.3 ± 0.2 15.1 ± 0.2 15.2 ± 0.3 15.2 ± 0.1 14.1 ± 0.3 15.6 ± 0.1<br />
MPW, mango peel waste.<br />
a Total yield of extractable polymers as AIS in g hg )1 of dried raw material (DRM, here: MPW).<br />
b Starch content of the AIS according to enzymatic quantification.<br />
c Net pectin yield (AISS-corr) as starch-corrected AIS in g hg )1 of DRM (MPW).<br />
[η] (mL g –1 )<br />
700<br />
650<br />
600<br />
550<br />
500<br />
450<br />
400<br />
350<br />
300<br />
250<br />
MPW 9<br />
Stability of mango peel by-products S. Sirisakulwat et al. 1651<br />
MPW 1<br />
MPW 8<br />
MPW 7<br />
MPW 6<br />
MPW 2<br />
MPW 5<br />
0 60 120 180 240<br />
5<br />
300<br />
MPW Sampling relative to the first sampling point (min)<br />
Intrinsic viscosity Gal/Rha AUA c/Rha AUA titr/Rha<br />
Figure 1 Variability of peel quality throughout by-product sampling<br />
for variants MPW1-MPW9: Intrinsic viscosities ([g]) as well as molar<br />
ratios of galactose to rhamnose (Gal ⁄ Rha) <strong>and</strong> colorimetric or<br />
titrimetric anhydrogalacturonic acid to rhamnose (AUAc ⁄ Rha,<br />
AUA titr ⁄ Rha) of the alcohol-insoluble substance extracted from<br />
dried peel waste (MPW) that accrued from the industrial canning of<br />
‘Kaew Khiew’ mango fruit after exposure of the wet peels to the<br />
ambient conditions of the peeling room (25 °C, 63% relative humidity)<br />
for different holding times (variants MPW1-MPW9; cf. Table 1)<br />
prior to waste stabilisation. For each variant, the time of sampling is<br />
expressed on the abscissa relative to that of variant MPW9, which<br />
was collected first.<br />
Ó 2010 The Authors. Journal compilation Ó 2010 Institute of Food Science <strong>and</strong> Technology International Journal of Food Science <strong>and</strong> Technology 2010<br />
MPW 4<br />
MPW 3<br />
40<br />
35<br />
30<br />
25<br />
20<br />
15<br />
10<br />
Sugar residue/Rha (mol mol –1 )
1652<br />
Stability of mango peel by-products S. Sirisakulwat et al.<br />
mentioned above. At last, the mango peels were quite<br />
similar to apple pomace in terms of AIS yields (Endress<br />
et al., 2006).<br />
However, in wet mango peels, the pectic substances<br />
obviously degraded less readily compared to wet apple<br />
pomace, although the mango fruit may predominantly<br />
be processed at higher ambient temperature <strong>and</strong> humidity.<br />
Unlike apple pomace, MPW usually accrues with far<br />
less tissue disintegration. In manual peeling, which is<br />
still usual practice in many canning <strong>and</strong> drying factories,<br />
thick peel strips accumulate. Therefore, cell de-compartmentalisation<br />
is restricted to the thin cutting edges<br />
<strong>and</strong> the mesocarp-facing cut surface. Consistently, cold<br />
storage (2 ± 1 °C) of fresh <strong>and</strong> blanched MPW (moisture<br />
content: 85–89%) for 3 <strong>and</strong> 6 days, respectively,<br />
was considered tolerable without loss of pectin yield<br />
(Sudhakar & Maini, 2000), but pectin quality was not<br />
evaluated in this context.<br />
Impact of peel storage on pectin structure<br />
Like the yield, also the overall composition of the<br />
pectins was apparently unaffected by the exposure of<br />
the wet mango peels to the ambient conditions of the<br />
peeling room for up to 5 h (Table 2). With 4.8 ±<br />
0.2 g hg )1 of AIS, a low starch content within the limits<br />
observed for the nine AIS samples (Table 1) was<br />
previously reported for the pectin, which had been<br />
extracted in the same way (pH 1.5) from the peels of an<br />
experimental full-ripe fruit batch of the same cultivar<br />
(specified as cv. ‘Kaew Khiew’ at ripeness stage III;<br />
Sirisakulwat et al., 2008). Similarities between this<br />
sample <strong>and</strong> the nine pectins from industrial peel waste<br />
were furthermore observed in terms of the total neutral<br />
sugars (ANS, 35.9 ± 0.1 vs. 31–36 g hg )1 ) as well as the<br />
titrimetrically quantified anhydrogalacturonic acid<br />
(AUA titr, 34.7 ± 0.1 vs. 38–42 g hg )1 ) <strong>and</strong> methylester<br />
contents (MeOHtitr, 4.38 ± 0.02 vs. 4.7–5.2 g hg )1 ).<br />
The slightly higher values of the latter nine samples<br />
(Table 2) might largely be ascribed to improved purity,<br />
which became evident in lower ash contents (16.2 ± 0.2<br />
vs. 8–10 g hg )1 ) at comparable moisture levels (4.3 ±<br />
0.1 vs. 4.9–5.7 g hg )1 ). However, it should be noted<br />
that, unlike the previous study (Sirisakulwat et al.,<br />
2008), mass balances of 90–93% [total (2), Table 2],<br />
resulting from the total neutral sugars, both titrimetrically<br />
analysed parameters, ash, <strong>and</strong> moisture, indicated<br />
slight underestimation of the composition for the nine<br />
AIS samples. Proteins reported for acid-extracted<br />
mango peel pectins might contribute further 1.1–3.3%<br />
(Kratchanova et al., 1991). Whereas the AUAtitr <strong>and</strong><br />
MeOHtitr contents were expected to be confirmed by<br />
further methods applied (Sirisakulwat et al., 2008), the<br />
colorimetric anhydrogalacturonic acid contents of<br />
the nine samples (AUAc, 49–58 g hg )1 ) systematically<br />
exceeded the titrimetric values (AUAtitr) by approximately<br />
12 g hg )1 on average, the methoxyl contents<br />
resulting from methanol analysis by HPLC (MeOH,<br />
Table 2 Composition of the alcohol-insoluble substance (AIS) extracted from dried peel waste (MPW) that accrued from the industrial canning of<br />
‘Kaew Khiew’ mango fruit after exposure of the wet peels to the ambient conditions of the peeling room (25 °C, 63 % relative humidity) for<br />
different holding times (HT 25 °C) up to 5 h prior to waste stabilisation: Mass balance a<br />
Variant MPW1 MPW2 MPW3 MPW4 MPW5 MPW6 MPW7 MPW8 MPW9<br />
HT 25 °C (min) 0 15 30 60 90 120 180 240 300<br />
Moisture 5.7 ± 0.1 4.9 ± 0.1 5.1 ± 0.1 5.3 ± 0.03 5.5 ± 0.01 5.5 ± 0.04 5.3 ± 0.1 5.5 ± 0.2 5.2 ± 0.1<br />
Ash 9.0 ± 0.1 8.0 ± 0.1 8.4 ± 0.004 8.2 ± 0.002 8.4 ± 0.001 8.6 ± 0.03 8.7 ± 0.1 8.9 ± 0.02 10.1 ± 0.1<br />
ANS b<br />
35.7 ± 0.5 33.4 ± 0.6 32.9 ± 0.2 32.2 ± 0.2 33.8 ± 0.2 31.1 ± 0.5 33.3 ± 0.3 32.3 ± 0.1 31.7 ± 1.1<br />
AUAc 48.5 ± 1.2 53.1 ± 0.7 50.7 ± 0.7 55.2 ± 1.2 49.9 ± 0.8 54.9 ± 0.8 50.3 ± 1.0 58.0 ± 0.5 51.0 ± 1.2<br />
MeOH c<br />
6.09 ± 0.23 7.27 ± 0.10 7.42 ± 0.11 7.30 ± 0.10 6.80 ± 0.10 7.16 ± 0.08 6.40 ± 0.24 6.74 ± 0.03 6.76 ± 0.08<br />
Ac c<br />
0.55 0.71 0.78 0.72 0.76 0.67 0.69 0.50 0.63<br />
Total (1) 105.4 107.3 105.2 108.9 105.1 107.9 104.7 112.0 105.4<br />
AUAtitr 38.2 ± 0.9 41.2 ± 0.2 40.2 ± 0.3 42.2 ± 0.6 37.5 ± 0.2 40.8 ± 0.1 40.5 ± 0.4 40.4 ± 0.9 38.9 ± 0.5<br />
MeOHtitr 4.69 ± 0.14 5.05 ± 0.03 4.93 ± 0.05 5.23 ± 0.10 4.68 ± 0.04 5.00 ± 0.02 5.06 ± 0.07 4.89 ± 0.16 4.82 ± 0.04<br />
Total (2) 93.1 92.5 91.5 93.1 89.9 91.0 92.9 92.0 90.7<br />
ANS, total content of neutral sugars, calculated as their anhydro forms; AUA c, colorimetric anhydrogalacturonic acid content; MeOH, methoxyl content<br />
(as methanol); Ac, acetyl content (as acetic acid); AUAtitr, titrimetric anhydrogalacturonic acid content; MeOHtitr, titrimetric methylester content; Total<br />
(1), mass balance based on the contents of moisture, ash, ANS, AUAc, MeOH, <strong>and</strong> Ac; Total (2), mass balance based on the contents of moisture, ash,<br />
ANS, AUA titr, <strong>and</strong> MeOH titr.<br />
a Mean content ± st<strong>and</strong>ard error (SE) in g hg )1 of AIS (Ac: SE £ 0.01 g hg )1 ).<br />
b Including the glucose content of starch (cf. Table 1) <strong>and</strong> ribose (£ 0.24 g hg )1 ).<br />
c Quantified by HPLC.<br />
International Journal of Food Science <strong>and</strong> Technology 2010 Ó 2010 The Authors. Journal compilation Ó 2010 Institute of Food Science <strong>and</strong> Technology
Table 3 Esterification indices a of the alcohol-insoluble substance (AIS) extracted from dried peel waste (MPW) that accrued from the<br />
industrial canning of ‘Kaew Khiew’ mango fruit after exposure of the wet peels to the ambient conditions of the peeling room (25 °C, 63%<br />
relative humidity) for different holding times (HT 25 °C) up to 5 h prior to waste stabilisation<br />
Variant MPW1 MPW2 MPW3 MPW4 MPW5 MPW6 MPW7 MPW8 MPW9<br />
HT25 °C (min) 0 15 30 60 90 120 180 240 300<br />
DE (%) 69.7 ± 0.5 69.7 ± 0.1 69.6 ± 0.2 70.4 ± 0.4 70.8 ± 0.1 69.6 ± 0.1 71.0 ± 0.3 68.8 ± 0.7 70.4 ± 0.4<br />
DMe (%) 69.0 ± 3.0 75.2 ± 1.4 80.5 ± 1.6 72.7 ± 1.9 74.9 ± 1.6 71.7 ± 1.3 69.9 ± 3.0 63.9 ± 0.7 72.8 ± 1.9<br />
DAc (%) 3.3 ± 0.1 3.9 ± 0.1 4.5 ± 0.1 3.8 ± 0.1 4.5 ± 0.1 3.6 ± 0.1 4.1 ± 0.1 2.5 ± 0.02 3.6 ± 0.1<br />
DE, degree of esterification (as molar MeOHtitr ⁄ AUAtitr ratio, cf. Table 2); DMe, degree of methylation (as molar MeOH ⁄ AUAc ratio, cf. Table 2); DAc,<br />
degree of acetylation (as molar Ac ⁄ AUAc ratio, cf. Table 2).<br />
a Mean ± st<strong>and</strong>ard error.<br />
6.1–7.4 g hg )1 ) surpassed the titrimetric methylester<br />
contents (MeOHtitr) by approximately 2 g hg )1<br />
(Table 2). As the respective mass balance averaged out<br />
at 106.8% [total (1), Table 2], especially the colorimetric<br />
anhydrogalacturonic acid contents were obviously overestimated<br />
throughout this study, most notably in case of<br />
sample MPW8. Despite the deficiencies of the associated<br />
mass balance [total (2)] in this study, the precision of the<br />
titrimetric results (AUAtitr <strong>and</strong> MeOHtitr) of the nine<br />
samples overall appeared to be better than their AUAc<br />
<strong>and</strong> MeOH contents.<br />
Because the titrimetrically quantified DE of the<br />
galacturonans closely varied around a median of<br />
69.7% (Table 3), de-esterification by PME during peel<br />
storage at 25 °C was irrelevant. A DE of 70% was<br />
uniformly observed when the wet peels had been dried<br />
without a dwell time at 25 °C (MPW1) <strong>and</strong> after storage<br />
for 5 h at this temperature (MPW9). Despite the<br />
problems faced in this study with the colorimetric<br />
AUAc <strong>and</strong> the chromatographic MeOH analysis, the<br />
findings in terms of DE were confirmed by the DMe<br />
displaying a median of 72.7% (Table 3). Evidently, the<br />
two extreme DMe levels of 64% (MPW8) <strong>and</strong> 81%<br />
(MPW3) represented outliers ascribed to overestimated<br />
maximum contents of AUAc <strong>and</strong> MeOH, respectively,<br />
but were not causally related to the storage of the wet<br />
peels at 25 °C. Likewise, the DAc was unaffected by the<br />
storage of the wet peels, as shown by its slight variation<br />
around a median of 3.8% (Table 3). In conformity with<br />
the nine AIS samples from industrial peel waste, the<br />
‘Kaew Khiew’ peel pectin mentioned earlier for comparison<br />
was characterised by a DE of 71.8 ± 0.1%, a<br />
DMe of 77.8 ± 2.0%, <strong>and</strong> a DAc of 3.6 ± 0.1%<br />
(Sirisakulwat et al., 2008).<br />
As detailed above, all nine AIS samples revealed<br />
almost equal contents of anhydrogalacturonic acid <strong>and</strong><br />
total neutral sugars (Table 2). Among the latter, galactose<br />
(Gal) residues were by far prevailing (Table 4) with<br />
a median of 145 mmol hg )1 of AIS S-corr, corresponding<br />
to 23–25 g hg )1 of AISS-corr <strong>and</strong> 59–66 mol hmol )1 of<br />
AUAtitr. Although the galactose contents seemed to<br />
be maximum <strong>and</strong> minimum within that range after<br />
Table 4 Molar sugar composition a of the alcohol-insoluble substance on a starch-free basis (AISS-corr) after recovery from dried peel waste<br />
(MPW) that accrued from the industrial canning of ‘Kaew Khiew’ mango fruit after exposure of the wet peels to the ambient conditions of the<br />
peeling room (25 °C, 63% relative humidity) for different holding times (HT 25 °C) up to 5 h prior to waste stabilisation<br />
Variant MPW1 MPW2 MPW3 MPW4 MPW5 MPW6 MPW7 MPW8 MPW9<br />
HT 25 °C (min) 0 15 30 60 90 120 180 240 300<br />
AUAc 292 ± 7 314 ± 7 299 ± 7 323 ± 9 296 ± 8 319 ± 9 296 ± 7 343 ± 11 301 ± 8<br />
AUAtitr 230 ± 6 244 ± 4 237 ± 5 247 ± 5 223 ± 5 237 ± 6 238 ± 3 239 ± 9 230 ± 4<br />
Gal 151 ± 3 146 ± 5 145 ± 3 145 ± 3 142 ± 3 144 ± 5 145 ± 2 144 ± 5 139 ± 7<br />
Ara 16 ± 0 15 ± 0 17 ± 1 16 ± 0 21 ± 1 14 ± 0 19 ± 1 14 ± 0 17 ± 1<br />
Glc b<br />
19 ± 2 15 ± 1 14 ± 1 14 ± 1 17 ± 1 12 ± 1 15 ± 1 15 ± 1 13 ± 2<br />
Rha 8.9 ± 0.1 10.6 ± 0.6 10.2 ± 0.3 9.9 ± 0.2 9.9 ± 0.2 9.8 ± 0.3 10.0 ± 0.3 9.0 ± 0.3 8.8 ± 0.7<br />
Man 1.8 ± 0.1 2.0 ± 0.04 2.1 ± 0.1 2.2 ± 0.1 2.4 ± 0.1 2.3 ± 0.1 2.2 ± 0.03 1.8 ± 0.1 1.9 ± 0.04<br />
Xyl 1.7 ± 0.03 2.0 ± 0.03 2.2 ± 0.04 1.8 ± 0.1 2.2 ± 0.1 2.0 ± 0.1 2.0 ± 0.1 1.5 ± 0.1 1.6 ± 0.03<br />
Fuc 0.4 ± 0.03 0.4 ± 0.01 0.4 ± 0.02 0.4 ± 0.01 0.5 ± 0.01 0.4 ± 0.01 0.5 ± 0.03 0.4 ± 0.01 0.4 ± 0.03<br />
AUA c, galacturonic acid (colorimetric); AUA titr, galacturonic acid (titrimetric); Gal, galactose; Ara, arabinose; Glc, glucose; Rha, rhamnose; Man,<br />
mannose; Xyl, xylose; Fuc, fucose.<br />
a Mean ± st<strong>and</strong>ard error in mmol hg )1 of AISS-corr.<br />
b Without glucose included in starch.<br />
Stability of mango peel by-products S. Sirisakulwat et al. 1653<br />
Ó 2010 The Authors. Journal compilation Ó 2010 Institute of Food Science <strong>and</strong> Technology International Journal of Food Science <strong>and</strong> Technology 2010
1654<br />
Stability of mango peel by-products S. Sirisakulwat et al.<br />
exposure of the wet peels to 25 °C for 0 (MPW1) <strong>and</strong><br />
5 h (MPW9), respectively, constant levels were observed<br />
for the other seven AIS samples. On the whole, the nine<br />
pectins revealed, regardless of the storage of the wet peel<br />
waste, an almost identical neutral sugar composition<br />
(Table 4) as the peel pectin of the experimental ‘Kaew<br />
Khiew’ fruit batch cited earlier for comparison did<br />
(Sirisakulwat et al., 2008). Their arabinose (Ara) contents<br />
slightly varied around a median of 16 mmol hg )1<br />
of AISS-corr (i.e. 2.1 g hg )1 ), followed by median contents<br />
of 15, 9.9, 2.1, <strong>and</strong> 2.0 mmol hg )1 of AISS-corr<br />
for glucose (Glc) not contained in starch, rhamnose<br />
(Rha), mannose (Man), <strong>and</strong> xylose (Xyl), respectively<br />
(Table 4). Strongest variation among the nine samples<br />
was observed for arabinose <strong>and</strong> the nonstarch glucose<br />
contents. However, no impact of wet peel storage was<br />
noticed.<br />
As shown previously (Neidhart et al., 2009), galactose<br />
contents of mango peel pectins may be considerably high,<br />
but they seemed to be specific to the cultivar <strong>and</strong> were<br />
neither affected by fruit ripeness nor by the extraction<br />
mode. Thus, even in the presence of minor natural starch<br />
contents, the galacturonide content of mango peel AIS<br />
may markedly be limited. This feature also applied to the<br />
nine AIS samples of this study. Because their galacturonic<br />
acid contents (GalUAtitr, Mr = 194.1 g mol )1 )<br />
on an ash- <strong>and</strong> moisture-free base (AISp) after pectin<br />
purification in acidic alcohol amounted to 56–59 g hg )1<br />
of AIS p (Table 5), the nine samples did not meet the<br />
JECFA minimum requirement as to the galacturonide<br />
content (65 g hg )1 of AISp; Joint FAO ⁄ WHO Expert<br />
Committee on Food Additives (JECFA), 2007). However,<br />
the portions of homogalacturonans (HG) <strong>and</strong> rhamnogalacturonans<br />
(RG-I) were obviously not affected by<br />
the wet peel storage, because largely constant molar<br />
AUAtitr ⁄ Rha ratios of 23–26 occurred throughout, as<br />
indicated by the respective sugar amounts displayed<br />
in Table 4. Also the backbone indices (Table 5), which<br />
were estimated from the molar AUAc <strong>and</strong> rhamnose<br />
contents on the basis of a simplified backbone model<br />
consisting of HG <strong>and</strong> RG-I (Sirisakulwat et al., 2008),<br />
did not point to any significant backbone degradation<br />
due to the wet peel storage, because largely constant<br />
maximum percentages of the pectin backbone resulted<br />
for homogalactacuronans (BBP HG, 93.4–94.9%) <strong>and</strong><br />
rhamnogalacturonans type I (BBPRG-I, 5.1–6.6%). If all<br />
galactose residues were ascribed to galactans with one<br />
chain branching off from each rhamnose unit of rhamnogalacturonans<br />
type I, long <strong>and</strong> ⁄ or highly ramified<br />
galactan side chains of 14–17 residues may be assumed<br />
according to the molar Gal ⁄ Rha ratios (Table 5). This<br />
striking peculiarity <strong>and</strong> the AUA titr ⁄ Rha ratio, observed<br />
here for AIS from industrial peel waste, confirmed<br />
the former report (Sirisakulwat et al., 2008) for the<br />
Table 5 Structural indices a of the alcohol-insoluble substance (AIS) extracted from dried peel waste (MPW) that accrued from the industrial<br />
canning of ‘Kaew Khiew’ mango fruit after exposure of the wet peels to the ambient conditions of the peeling room (25 °C, 63 % relative humidity)<br />
for different holding times (HT 25 °C) up to 5 h prior to waste stabilisation<br />
Variant MPW1 MPW2 MPW3 MPW4 MPW5 MPW6 MPW7 MPW8 MPW9<br />
HT25 °C (min) 0 15 30 60 90 120 180 240 300<br />
GalUAtitr (g hg )1 of AISp)<br />
Molecular parameters<br />
55.5 ± 1.3 58.2 ± 0.3 56.7 ± 0.4 59.0 ± 0.8 58.5 ± 0.3 58.5 ± 0.2 59.2 ± 0.6 58.8 ± 1.4 58.1 ± 0.8<br />
[g] (mL g )1 )<br />
Side chain indices<br />
282 ± 2 317 ± 2 341 ± 2 329 ± 2 334 ± 2 308 ± 2 325 ± 3 276 ± 2 271 ± 2<br />
Ara ⁄ Rha (mol mol )1 ) 1.8 ± 0.02 1.4 ± 0.1 1.7 ± 0.1 1.6 ± 0.04 2.1 ± 0.04 1.5 ± 0.03 1.9 ± 0.1 1.5 ± 0.03 1.9 ± 0.2<br />
Gal ⁄ Rha (mol mol )1 ) 16.9 ± 0.3 13.8 ± 0.8 14.2 ± 0.4 14.6 ± 0.1 14.2 ± 0.1 14.7 ± 0.4 14.5 ± 0.4 16.0 ± 0.3 15.7 ± 1.4<br />
Ara ⁄ Gal (mol hmol )1 ) 10.7 ± 0.2 10.4 ± 0.3 11.7 ± 0.5 11.1 ± 0.3 14.4 ± 0.3 10.0 ± 0.3 12.9 ± 0.3 9.5 ± 0.1 12.2 ± 0.7<br />
Backbone indices (of AISS-corr)<br />
HGmax b (mmol hg )1 ) 283 ± 7 304 ± 7 288 ± 7 313 ± 9 286 ± 8 309 ± 9 286 ± 7 334 ± 11 293 ± 8<br />
c )1<br />
RG-Imax (mmol hg ) 17.9 ± 0.2 21.1 ± 1.1 20.4 ± 0.7 19.8 ± 0.3 19.9 ± 0.4 19.6 ± 0.5 20.1 ± 0.5 17.9 ± 0.7 17.6 ± 1.3<br />
d<br />
BBPHG (%) 94.1 93.5 93.4 94.1 93.5 94.0 93.4 94.9 94.3<br />
BBPRG-I e (%) 5.9 6.5 6.6 5.9 6.5 6.0 6.6 5.1 5.7<br />
GalUAtitr, titrimetric galacturonic acid content (g hg )1 of AISp, i.e., of nondestarched AIS after acidic purification before titration); [g], intrinsic viscosity<br />
(AIS dissolved in 0.28 M KOAc ⁄ HOLc buffer, pH 3.0); Ara, arabinose (mmol hg )1 of AIS); Rha, rhamnose (mmol hg )1 of AIS); Gal, galactose (mmol hg )1<br />
of AIS).<br />
a Mean ± st<strong>and</strong>ard error.<br />
b<br />
Estimated maximum units of the total homogalacturonan backbone (HG) calculated from the AUAc <strong>and</strong> Rha contents in mmol hg )1 of AISS-corr (HGmax = AUAc-Rha). c )1<br />
Estimated maximum units of the total rhamnogalacturonan-I backbone (RG-I) calculated from the Rha content in mmol hg of AISS-corr<br />
(RG-Imax = 2 Rha).<br />
d<br />
Maximum homogalacturonan (HG) percentage of the pectin backbone [BBPHG = 100(AUAc ) Rha)/(AUAc + Rha)].<br />
e<br />
Maximum rhamnogalacturonan-I (RG-I) percentage of the pectin backbone [BBPRG)I = 100(2ÆRha)/(AUAc + Rha)].<br />
International Journal of Food Science <strong>and</strong> Technology 2010 Ó 2010 The Authors. Journal compilation Ó 2010 Institute of Food Science <strong>and</strong> Technology
analogously extracted peel AIS from the experimental<br />
‘Kaew Khiew’ fruit batch. But galactan degradation<br />
during storage of the wet peels by b-d-galactosidase<br />
activities was obviously negligible under the conditions<br />
applied. Because of the acid-lability of arabinofuranosyl<br />
linkages, arabinose residues are more or less split off<br />
during hot-acid extraction, depending on the pH conditions<br />
applied (Sirisakulwat et al., 2008; Neidhart et al.,<br />
2009). However, like the Gal ⁄ Rha ratios, also molar<br />
Ara ⁄ Rha ratios of 1.4–2.1 around a median of 1.7 mol ⁄ -<br />
mol <strong>and</strong> Ara ⁄ Gal ratios of 10–14 mol hmol )1 (Table 5)<br />
pointed to insignificant side-chain degradation during the<br />
storage of the wet peels.<br />
The clearest evidence for the preservation of pectin<br />
backbones <strong>and</strong> side chains during the storage of the wet<br />
peels at 25 °C was finally provided by the intrinsic<br />
viscosities ([g]) of the samples (Table 5). Within a range<br />
of 271–341 mL g )1 ,[g] closely varied around a median<br />
of 317 mL g )1 , indicating good consistency among the<br />
nine pectins in terms of their average molecular dimensions<br />
(Morris, 1995). The lowest intrinsic viscosities<br />
(271–282 mL g )1 ) were observed for the AIS group<br />
from the three peel waste samples collected within the<br />
first 64 min of sampling (MPW1, MPW8, MPW9,<br />
Fig. 1), including the extreme situations, i.e. immediate<br />
stabilisation <strong>and</strong> exposure to 25 °C for 5 h prior to<br />
drying, respectively. Thus, the slight differences among<br />
the nine pectins were definitely ascribed to the inherent<br />
heterogeneity of the fruits <strong>and</strong> the reproducibility of<br />
pectin recovery (Sirisakulwat et al., 2008) rather than to<br />
the storage of the wet peels at ambient temperature. The<br />
rhamnose contents were slightly lower in the AIS from<br />
the peel samples MPW1, MPW8, <strong>and</strong> MPW9 (approximately<br />
9 mmol hg )1 of AISS-corr, Table 4) compared to<br />
the remaining pectins. Owing to the minor variation of<br />
galactose contents, these three pectins were further<br />
characterised by maximum Gal ⁄ Rha ratios (Fig. 1).<br />
Thus, their arabinogalactan side chains were possibly<br />
more extended than in the other cases, as equally<br />
indicated by their molar (Ara+Gal) ⁄ Rha ratios of<br />
18–19 relative to 15–16 for the other pectins (Table 5).<br />
The intrinsic viscosity would consistently decline along<br />
with a relative increase in branched neutral sugar side<br />
chains due to overall more condensed coil dimensions<br />
(Morris, 1995). In the present case, this seemed to be<br />
partly compensated by more exp<strong>and</strong>ed homogalacturonan<br />
parts, because especially the AIS from MPW8 <strong>and</strong><br />
MPW9 besides MPW1 also displayed elevated molar<br />
AUA ⁄ Rha ratios (both on the basis of the AUAtitr <strong>and</strong><br />
the AUAc contents; Fig. 1). Nevertheless, their lower<br />
intrinsic viscosities were most probably owing to larger<br />
arabinogalactan parts, because the MPW1 AIS came<br />
quite close to the MPW4 <strong>and</strong> MPW6 samples in terms<br />
of the AUA ⁄ Rha ratios despite the significantly higher<br />
intrinsic viscosities of the latter group ([g] ‡ 308 mL g )1 ;<br />
Fig. 1). Both the maximum <strong>and</strong> minimum [g] levels in<br />
Stability of mango peel by-products S. Sirisakulwat et al. 1655<br />
Table 5 clearly exceeded the intrinsic viscosity of the<br />
reported ‘Kaew Khiew’ peel pectin (234 mL g )1 ), which<br />
had displayed a large arabinogalactan fraction [(Ara +<br />
Gal) ⁄ Rha = 19.2] similar to the MPW1 pectin, but only<br />
molar AUA ⁄ Rha ratios of 23 <strong>and</strong> 24 based on AUA c<br />
<strong>and</strong> AUAtitr, respectively (Sirisakulwat et al., 2008). As<br />
previously shown for this pectin by high-performance<br />
size exclusion chromatography, its comparatively low<br />
intrinsic viscosity resulted from the co-existence of two<br />
distinct major fractions. Apart from a high-molecular<br />
weight fraction also found in commercial apple pectin,<br />
an additional, almost monodisperse fraction with a peak<br />
molecular weight of 17 000 relative to dextran considerably<br />
reduced the average molecular weight of this<br />
pectin (Sirisakulwat et al., 2008). Depending on the<br />
amounts of this characteristic fraction, the gelling <strong>and</strong><br />
thickening properties of mango peel pectins may be<br />
more or less limited, as demonstrated by numerous<br />
samples (Neidhart et al., 2009).<br />
Impact of peel storage on techno-functional pectin<br />
properties<br />
From the similarities in the average composition<br />
(Tables 2-4) <strong>and</strong> the intrinsic viscosity reflecting the mean<br />
molecular weight (Table 5), no differences in the technofunctional<br />
properties were expected among the nine<br />
pectins. On the other h<strong>and</strong>, weak activities of the<br />
respective esterases <strong>and</strong> depolymerising hydrolyses <strong>and</strong><br />
lyases may nevertheless cause enhanced variation among<br />
the molecules in terms of molecular size, side-chain<br />
lengths, <strong>and</strong> the degrees of methylation <strong>and</strong> acetylation.<br />
Likewise, the intramolecular distribution of methylesterified<br />
units might be affected, especially because of<br />
the blockwise mode of action of plant PME (Benen et al.,<br />
2003a). Owing to such differences in their fine structure<br />
(Guillotin et al., 2007), pectins with similar average<br />
characteristics may display different gelling behaviour<br />
(Neidhart et al., 2003).<br />
Consistent with their low galacturonide contents<br />
(Table 2) <strong>and</strong> intrinsic viscosities (Table 5), the nine<br />
samples produced only soft gels. Low breaking strengths<br />
of 369–497 HPE resulted even at an AIS dose of<br />
0.3 g hg )1 of gel (BS 0.3%; Table 6) <strong>and</strong> 0.35 g hg )1 were<br />
necessary to achieve BSs of 452–594 HPE (BS0.35%). As<br />
displayed by the AIS amounts required for 100 g of a<br />
st<strong>and</strong>ard gel with a BS of 530 HPE, the nine samples<br />
were quite uniform in terms of their breaking capacities<br />
(BC530HPE; Table 6). With a BC530HPE range of 0.33–<br />
0.4 g hg )1 of gel, the breaking capacity of the ‘Kaew<br />
Khiew’ peel AIS reported as a reference was confirmed;<br />
but compared to a commercial, unst<strong>and</strong>ardised apple<br />
pectin that was also included in the previous study<br />
(Sirisakulwat et al., 2008), 1.9–2.4 times more AIS was<br />
needed to produce this st<strong>and</strong>ard gel. Consequently, the<br />
sugar amount bound in a sugar-acid st<strong>and</strong>ard gel by 1 g<br />
Ó 2010 The Authors. Journal compilation Ó 2010 Institute of Food Science <strong>and</strong> Technology International Journal of Food Science <strong>and</strong> Technology 2010
1656<br />
Stability of mango peel by-products S. Sirisakulwat et al.<br />
Table 6 Gelling capacity of the alcohol-insoluble substance (AIS) extracted from dried peel waste (MPW) that accrued from the industrial<br />
canning of ‘Kaew Khiew’ mango fruit after exposure of the wet peels to the ambient conditions of the peeling room (25 °C, 63 % relative<br />
humidity) for different holding times (HT 25 °C) up to 5 h prior to waste stabilisation<br />
Variant MPW1 MPW2 MPW3 MPW4 MPW5 MPW6 MPW7 MPW8 MPW9<br />
HT25 °C (min) 0 15 30 60 90 120 180 240 300<br />
Gelling capacity of the AIS <strong>and</strong> the dried raw material (DRM), respectively<br />
BS0.3% (HPE) 458 ± 3 a<br />
478 ± 2 369 ± 3 399 ± 5 463 ± 9 497 ± 8 463 ± 6 416 ± 4 394 ± 1<br />
BS0.35% (HPE) 586 ± 5 a<br />
564 ± 13 452 ± 8 594 ± 5 570 ± 6 563 ± 4 587 ± 14 528 ± 6 509 ± 2<br />
BC530HPE (g hg )1 ) 0.33 0.33 0.40 0.33 0.33 0.33 0.33 0.35 0.36<br />
SBC530HPE (g g )1 of AIS) 198 197 164 195 196 200 199 185 181<br />
SBCDRM (g hg )1 ) 2951 3062 2644 3066 3092 3108 3124 2717 2935<br />
Normalised gelling capacity of the AIS relative to the AUAtitr content of the st<strong>and</strong>ardised gel with 530 HPE<br />
BC530HPE(AUAtitr) (ghg )1 ) 0.13 0.14 0.16 0.14 0.12 0.13 0.13 0.14 0.14<br />
SBC530HPE(AUAtitr) (gg )1 of AUA) 519 478 407 462 523 490 491 459 465<br />
a Mean ± st<strong>and</strong>ard error. BS0.3% <strong>and</strong> BS 0.35%, breaking strength of gels with AIS doses of 0.3 <strong>and</strong> 0.35% (w ⁄ w), respectively, in Herbstreith-Pectinometer<br />
units (HPE); BC 530HPE, breaking capacity of the AIS as gram of AIS required for 100 g of a gel with 530 HPE; SBC 530HPE, sugar-binding capacity of<br />
the AIS as gram of sugar bound per gram of AIS in a gel of 530 HPE; SBCDRM, gelling units (GU) of the dried raw material (DRM; here: MPW) as its<br />
sugar-binding capacity in gram of sugar bound by 100 g of DRM in a gel of 530 HPE; BC530HPE(AUAtitr), normalised breaking capacity of the AIS<br />
(g of AUA hg )1 of a gel with 530 HPE); SBC 530HPE(AUA titr), normalised sugar-binding capacity of the AIS (g of sugar g )1 of AUA for a gel of 530 HPE).<br />
of this apple pectin exceeded the sugar-binding capacities<br />
(SBC530HPE) of the nine mango AIS samples (164–<br />
200 g g )1 ; Table 6) by the same factors. Because of their<br />
uniform AIS yields (AISS-corr; Table 1) that slightly<br />
exceeded that of this former ‘Kaew Khiew’ peel sample<br />
(13.1 ± 0.2 g hg )1 ; Sirisakulwat et al., 2008), the dried<br />
peels MPW1-MPW9 had the capacity to bind more sugar<br />
in a st<strong>and</strong>ard gel by the recovered AIS than the latter<br />
(SBCDRM; 2644–3124 vs. 2250 g hg )1 of dried peel;<br />
Table 6). Thus, the industrial peel waste yielded slightly<br />
more AIS than the cited peel sample, but of comparable<br />
quality. The three samples displaying minimum intrinsic<br />
viscosities of the extractable AIS (MPW1, MPW8,<br />
MPW9; Fig. 1) were among the four samples with a<br />
SBCDRM below the median. However, together with the<br />
other AIS samples from industrial peel waste, their AIS<br />
was almost identical to that of the cited ‘Kaew Khiew’<br />
peel sample (0.14 g hg )1 ; Sirisakulwat et al., 2008) <strong>and</strong><br />
even came close to this apple pectin (0.11 g hg )1 ;<br />
Sirisakulwat et al., 2008) in terms of the normalised<br />
gelling capacity [BC 530HPE(AUA titr); Table 6], when the<br />
breaking capacities (BC530HPE) were expressed as the<br />
respective AUAtitr doses required for a st<strong>and</strong>ard gel of<br />
530 HPE. Thus, the functional weakness of mango peel<br />
AIS shown by the non-normalised parameters in Table 6<br />
was neither caused by the use of industrial peel waste<br />
as an AIS source nor by the extended exposure of the<br />
wet peels to ambient temperature. Also under the given<br />
conditions, deficits seemed to be rather because of<br />
galacturonide contents, which were markedly lowered<br />
in favour of arabinogalactan portions, <strong>and</strong> the presence<br />
of a characteristic fraction that considerably reduced the<br />
average molecular weight, as demonstrated earlier for the<br />
cited AIS sample (Sirisakulwat et al., 2008) in compar-<br />
ison to pectins with improved techno-functionality from<br />
other mango peels (Neidhart et al., 2009).<br />
Like the gel properties, the setting behaviour of the<br />
AIS was also not verifiably affected by the intermediate<br />
exposure of the wet peels to ambient temperature.<br />
Despite some variation of the setting temperature that<br />
was more pronounced at the upper AIS dose, equally<br />
high setting temperatures were recorded for AIS that<br />
was obtained from peels after their wet storage at 25 °C<br />
for 0, 15, <strong>and</strong> 300 min (Fig. 2).<br />
T (δ 1.0 Hz = 45°) (°C)<br />
45<br />
40<br />
35<br />
30<br />
25<br />
20<br />
15<br />
10<br />
5<br />
0<br />
c P (g hg –1 of gel):<br />
0.4<br />
0.55<br />
0 50 100 150 200 250 300 350<br />
HT 25 °C (min)<br />
Figure 2 Gelation of alcohol-insoluble substance (AIS) samples<br />
extracted from dried peel waste (MPW) that accrued from the<br />
industrial canning of ‘Kaew Khiew’ mango fruit after exposure of<br />
the wet peels to the ambient conditions of the peeling room (25 °C,<br />
63% relative humidity) for different holding times (HT 25 °C) upto<br />
5 h prior to waste stabilisation: Setting temperatures (Td=45°) of<br />
st<strong>and</strong>ard gels (64.7 ± 0.3 °Brix <strong>and</strong> pH 3.25 ± 0.02 according to<br />
concomitant refractometer readings <strong>and</strong> pH analyses of the cured gels;<br />
c p, AIS dose). Error bars represent the single st<strong>and</strong>ard deviations.<br />
International Journal of Food Science <strong>and</strong> Technology 2010 Ó 2010 The Authors. Journal compilation Ó 2010 Institute of Food Science <strong>and</strong> Technology
Conclusion<br />
The findings reported for mango peel AIS from experimental<br />
fruit batches (Sirisakulwat et al., 2008; Neidhart<br />
et al., 2009) were overall confirmed by industrial<br />
by-products from the fruit of a further crop year. Most<br />
important, temporary exposure of wet mango peels to<br />
ambient temperature was innocuous in terms of yield,<br />
composition, <strong>and</strong> techno-functionality of the extractable<br />
AIS. The interim storage of the wet peel waste in<br />
the peeling room prior to drying can thus be tolerated<br />
even up to 5 h without notable pectin degradation.<br />
Limited tissue damage during manual peeling <strong>and</strong> low<br />
activities of degrading endogenous enzymes in the peels<br />
(Yanru et al., 1995) might support this storage stability.<br />
On a relatively large part of the peel waste surface, wax<br />
layers <strong>and</strong> the thickness of the cuticle initially still act as<br />
physical barriers. Additionally, minor antimicrobial<br />
effects might still emanate from polyphenolics like<br />
gallotannins <strong>and</strong> alk(en)ylresorcinols present in mango<br />
peels even at consumption ripeness of the fruit (Berardini<br />
et al., 2004; Engels et al., 2009; Kno¨ dler et al.,<br />
2009). Compared to twelve other mango cultivars, peels<br />
of ‘Kaew’ fruit were reported to be comparatively rich<br />
in alk(en)ylresorcinols (1.4 g kg )1 of peel dry matter;<br />
Kno¨ dler et al., 2009), which play a role in plant disease<br />
resistance (Hassan et al., 2007). Because of the enhanced<br />
flexibility, the observed tolerance of intermediate<br />
storage is important for a future exploitation of peel<br />
waste from mango processing on smaller industrial<br />
scales, where immediate peel drying may impose considerably<br />
higher logistic <strong>and</strong> economic investment than<br />
on large scale with completely continuous processing<br />
<strong>and</strong> waste stabilisation. As mango residues result from<br />
multifaceted processing on different scales, the preconditions<br />
for economic by-product drying are rather<br />
individual. Knowledge about the susceptibility of industrial<br />
mango peels to pectin degradation prior to drying<br />
is of utmost importance for the selection of adjusted<br />
drying technologies <strong>and</strong> economic concepts for the<br />
overall processes.<br />
The interim storage of the wet mango peels neither<br />
caused perceptible variations in pectin quality nor the<br />
comparably inferior galacturonide contents <strong>and</strong> gelling<br />
capacities of the pectins, which were observed in spite of<br />
hot-acid extraction that mimicked industrial procedures<br />
for pectin recovery from established sources. Despite<br />
individual promising findings based on laboratory<br />
extraction (Rehman et al., 2004; Koubala et al., 2009;<br />
Neidhart et al., 2009), quality deficiencies of mango peel<br />
pectin, which have repeatedly been reported (Pedroza-<br />
Islas et al., 1994) as in the present case, require further<br />
studies. Research into sustainable recovery of purified<br />
pectins from mango peels like those used in the present<br />
<strong>and</strong> previous trials (Sirisakulwat et al., 2008) are<br />
currently under way.<br />
Acknowledgments<br />
This research was funded by Deutsche Forschungsgemeinschaft,<br />
Bonn, Germany: Project SFB 564-E2.2. It<br />
is part of the Special Research Program ‘Research for<br />
Sustainable L<strong>and</strong> Use <strong>and</strong> Rural Development in<br />
Mountainous Regions of Southeast Asia’ (The Upl<strong>and</strong>s<br />
Program).<br />
The authors thank Herbstreith & Fox KG, Neuenbu¨<br />
rg, Germany, in particular Hans-Ulrich Endress<br />
<strong>and</strong> Christine Rentschler, for providing laboratory<br />
facilities for pectin extraction as well as Northern Food<br />
Co., Ltd., Chiang Mai, Thail<strong>and</strong> for supplying MPW.<br />
Klaus Mix <strong>and</strong> Martin Leitenberger are acknowledged<br />
for their technical assistance with the experiments at<br />
Hohenheim University.<br />
References<br />
Stability of mango peel by-products S. Sirisakulwat et al. 1657<br />
Ali, Z.M., Chin, L.-H. & Lazan, H. (2004). A comparative study on<br />
wall degrading enzymes, pectin modifications <strong>and</strong> softening during<br />
ripening of selected tropical fruits. Plant Science, 167, 317–327.<br />
Benen, J.A.E., van Alebeek, G.-J.W.M., Voragen, A.G.J. & Visser, J.<br />
(2003a). Pectic esterases. In: H<strong>and</strong>book of Food Enzymology (edited<br />
by J.R. Whitaker, A.G.J. Voragen & D.W.S. Wong). Pp. 849–856.<br />
New York, NY, USA: Marcel Dekker.<br />
Benen, J.A.E., Voragen, A.G.J. & Visser, J.. (2003b). Pectic enzymes.<br />
In: H<strong>and</strong>book of Food Enzymology (edited by J.R. Whitaker, A.G.J.<br />
Voragen & D.W.S. Wong). Pp. 845–848. New York, NY, USA:<br />
Marcel Dekker.<br />
Berardini, N., Carle, R. & Schieber, A. (2004). Characterization of<br />
gallotannins <strong>and</strong> benzophenone derivatives from mango (Mangifera<br />
indica L. cv. ‘Tommy Atkins’) peels, pulp <strong>and</strong> kernels by highperformance<br />
liquid chromatography ⁄ electrospray ionization mass<br />
spectrometry. Rapid Communications in Mass Spectrometry, 18,<br />
2208–2216.<br />
Berardini, N., Fezer, R., Conrad, J., Beifuss, U., Carle, R. & Schieber,<br />
A. (2005a). Screening of mango (Mangifera indica L.) cultivars for<br />
their contents of flavonol O- <strong>and</strong> xanthone C-glycosides, anthocyanins,<br />
<strong>and</strong> pectin. Journal of Agricultural <strong>and</strong> Food Chemistry, 53,<br />
1563–1570.<br />
Berardini, N., Kno¨ dler, M., Schieber, A. & Carle, R. (2005b).<br />
Utilization of mango peels as a source of pectin <strong>and</strong> polyphenolics.<br />
Innovative Food Science <strong>and</strong> Emerging Technologies, 6, 442–452.<br />
Brummell, D.A. (2006). Cell wall disassembly in ripening fruit.<br />
Functional Plant Biology, 33, 103–119.<br />
Chourasia, A., Sane, V.A. & Nath, P. (2006). Differential expression of<br />
pectate lyase during ethylene-induced postharvest softening of<br />
mango (Mangifera indica var. Dashehari). Physiologia Plantarum,<br />
128, 546–555.<br />
De Vries, R.P. & Visser, J. (2003). Enzymes releasing L-arabinose <strong>and</strong><br />
D-galactose from the side chains of pectin. In: H<strong>and</strong>book of Food<br />
Enzymology (edited by J.R. Whitaker, A.G.J. Voragen & D.W.S.<br />
Wong). Pp. 867–877. New York, NY, USA: Marcel Dekker.<br />
Endress, H.-U. & Dilger, S. (1990). Checking pectin jelly strength with<br />
the Pektinometer. Food Technology International, 1, 279–282.<br />
Endress, H.-U., Mattes, F. & Norz, K. (2006). Pectins. In: H<strong>and</strong>book<br />
of Food Science, Technology, <strong>and</strong> Engineering (edited by Y.H. Hui),<br />
Vol. 3. Pp. 140 ⁄ 1–140 ⁄ 35. Boca Raton, FL, USA: CRC Press,<br />
Taylor & Francis Group.<br />
Engels, C., Kno¨ dler, M., Zhao, Y.-Y., Carle, R., Ga¨ nzle, M.G. &<br />
Schieber, A. (2009). Antimicrobial activity of gallotannins isolated<br />
from mango (Mangifera indica L.) kernels. Journal of Agricultural<br />
<strong>and</strong> Food Chemistry, 57, 7712–7718.<br />
Ó 2010 The Authors. Journal compilation Ó 2010 Institute of Food Science <strong>and</strong> Technology International Journal of Food Science <strong>and</strong> Technology 2010
1658<br />
Stability of mango peel by-products S. Sirisakulwat et al.<br />
Guillotin, S.E., Bakx, E.J., Boulenguer, P., Schols, H.A. & Voragen,<br />
A.G.J. (2007). Determination of the degree of substitution, degree of<br />
amidation <strong>and</strong> degree of blockiness of commercial pectins by using<br />
capillary electrophoresis. Food Hydrocolloids, 21(3), 444–451.<br />
Hassan, M.K., Dann, E.K., Irving, D.E. & Coates, L.M. (2007).<br />
Concentrations of constitutive alk(en)ylresorcinols in peel of commercial<br />
mango varieties <strong>and</strong> resistance to postharvest anthracnose.<br />
Physiological <strong>and</strong> Molecular Plant Pathology, 71, 158–165.<br />
Joint FAO ⁄ WHO Expert Committee on Food Additives (JECFA)<br />
(2007). Compendium of Food Additive Specifications. FAO JECFA<br />
Monographs 4. Rome, Italy: Food <strong>and</strong> Agriculture Organization<br />
of the United Nations. http://www.fao.org/docrep/010/a1447e/<br />
a1447e00.htm.<br />
Kno¨ dler, M., Reisenhauer, K., Schieber, A. & Carle, R. (2009).<br />
Quantitative determination of allergenic 5-alk(en)yl-resorcinols in<br />
mango (Mangifera indica L.) peel, pulp, <strong>and</strong> fruit products by highperformance<br />
liquid chromatography. Journal of Agricultural <strong>and</strong><br />
Food Chemistry, 57, 3639–3644.<br />
Koubala, B.B., Kansci, G., Mbome, L.I., Crépeau, M.-J., Thibault,<br />
J.-F. & Ralet, M.-C. (2008). Effect of extraction conditions on some<br />
physicochemical characteristics of pectins from ‘‘Améliorée’’ <strong>and</strong><br />
‘‘Mango’’ mango peels. Food Hydrocolloids, 22(7), 1345–1351.<br />
Koubala, B.B., Kansci, G., Garnier, C., Mbome, I.L., Dur<strong>and</strong>, S.,<br />
Thibault, J.-F. & Ralet, M.-C. (2009). Rheological <strong>and</strong> high gelling<br />
properties of mango (Mangifera indica) <strong>and</strong> ambarella (Spondias<br />
cythera) peel pectins. International Journal of Food Science <strong>and</strong><br />
Technology, 44, 1809–1817.<br />
Kratchanova, M., Bénémou, C. & Kratchanov, C. (1991). On the<br />
pectic substances of mango fruits. Carbohydrate Polymers, 15,<br />
271–282.<br />
MacDougall, A.J. & Ring, S.G. (2004). Pectic polysaccharides. In:<br />
Chemical <strong>and</strong> Functional Properties of Food Saccharides (edited by<br />
P. Tomasik). Pp. 181–195. Boca Raton, FL, USA: CRC Press.<br />
Morris, E.R. (1995). Polysaccharide rheology <strong>and</strong> in-mouth perception.<br />
In: Food Polysaccharides <strong>and</strong> Their Applications (edited by<br />
A.M. Stephen). Pp. 517–546. New York, NY, USA: Marcel Dekker.<br />
Neidhart, S., Hannak, C. & Gierschner, K. (2003). Sol-gel transition<br />
of high-esterified pectins <strong>and</strong> their molecular structure. In: Advances<br />
in Pectin <strong>and</strong> Pectinase Research (edited by A.G.J. Voragen, H.A.<br />
Schols & R. Visser). Pp. 431–448. Dordrecht, The Netherl<strong>and</strong>s:<br />
Kluwer Academic Publishers.<br />
Neidhart, S., Sirisakulwat, S., Nagel, A., Sruamsiri, S. & Carle, R.<br />
(2009). Which mango processing residues are suitable for pectin<br />
recovery in terms of yield, molecular <strong>and</strong> techno-functional<br />
properties of extractable pectins? In: Pectins <strong>and</strong> Pectinases<br />
(edited by H.A. Schols, R.G.F. Visser & A.G.J. Voragen). Pp.<br />
177–195. Wageningen, The Netherl<strong>and</strong>s: Wageningen Academic<br />
Publishers.<br />
Panouille´, M., Ralet, M.-C., Bonnin, E. & Thibault, J.-F. (2007).<br />
Recovery <strong>and</strong> reuse of trimmings <strong>and</strong> pulps from fruit <strong>and</strong> vegetable<br />
processing. In: H<strong>and</strong>book of Waste Management <strong>and</strong> Co-product<br />
Recovery in Food Processing (edited by K. Waldron), Vol. 1. Pp.<br />
417–447. Cambridge, UK: Woodhead.<br />
Pedroza-Islas, R., Aquilar-Esperanza, E. & Vernon-Carter, E.J.<br />
(1994). Obtaining pectins from solids wastes derived from mango<br />
(Mangifera indica) processing. AIChE Symposium Series, 300, 36–41.<br />
Pott, I., Neidhart, S., Mu¨ hlbauer, W. & Carle, R. (2005). Quality<br />
improvement of non-sulphited mango slices by drying at high<br />
temperatures. Innovative Food Science & Emerging Technologies,<br />
6(4), 412–419.<br />
Prasanna, V., Prabha, T.N. & Tharanathan, R.N. (2006). Multiple<br />
forms of polygalacturonase from mango (Mangifera indica L. cv.<br />
Alphonso) fruit. Food Chemistry, 95, 30–36.<br />
Rehman, Z.U., Salariya, A.M., Habib, F. & Shah, W.H. (2004).<br />
Utilization of mango peels as a source of pectin. Journal of the<br />
Chemical Society of Pakistan, 26(1), 73–76.<br />
Singh, P. & Dwivedi, U.N. (2008). Purification <strong>and</strong> characterization of<br />
multiple forms of polygalacturonase from mango (Mangifera indica<br />
cv. Dashehari) fruit. Food Chemistry, 111, 345–349.<br />
Sirisakulwat, S., Nagel, A., Sruamsiri, P., Carle, R. & Neidhart, S.<br />
(2008). Yield <strong>and</strong> quality of pectins extractable from the peels of<br />
Thai mango cultivars depending on fruit ripeness. Journal of<br />
Agricultural <strong>and</strong> Food Chemistry, 56(22), 10727–10738.<br />
Sudhakar, D.V. & Maini, S.B. (2000). Isolation <strong>and</strong> characterization<br />
of mango peel pectins. Journal of Food Processing <strong>and</strong> Preservation,<br />
24(3), 209–227.<br />
Vásquez-Caicedo, A.L., Neidhart, S. & Carle, R. (2004). Postharvest<br />
ripening behavior of nine Thai mango cultivars <strong>and</strong> their<br />
suitability for industrial applications. Acta Horticulturae, 645,<br />
617–625.<br />
Vásquez-Caicedo, A.L., Heller, A., Neidhart, S. & Carle, R. (2006).<br />
Chromoplast morphology <strong>and</strong> b-carotene accumulation during<br />
postharvest ripening of mango cv. ‘Tommy Atkins’. Journal of<br />
Agricultural <strong>and</strong> Food Chemistry, 54, 5769–5776.<br />
Vásquez-Caicedo, A.L., Schilling, S., Carle, R. & Neidhart, S. (2007).<br />
Effects of thermal processing <strong>and</strong> fruit matrix on b-carotene stability<br />
<strong>and</strong> enzyme inactivation during transformation of mangoes into<br />
purée <strong>and</strong> nectar. Food Chemistry, 102(4), 1172–1186.<br />
Voragen, A.G.J., Pilnik, W., Thibault, J.-F., Axelos, M.A.V. &<br />
Renard, C.M.G.C.. (1995). Pectins. In: Food Polysaccharides <strong>and</strong><br />
Their Applications (edited by A.M. Stephen). Pp. 287–339. New<br />
York, NY, USA: Marcel Dekker.<br />
Yanru, Z., P<strong>and</strong>ey, M., Prasad, N.K. & Srivastava, G.C. (1995).<br />
Ripening associated changes in enzymes <strong>and</strong> respiratory activities in<br />
three varieties of mango (Mangifera indica L.). Indian Journal of<br />
Plant Physiology, 38(1), 73–76.<br />
International Journal of Food Science <strong>and</strong> Technology 2010 Ó 2010 The Authors. Journal compilation Ó 2010 Institute of Food Science <strong>and</strong> Technology
International Journal of Food Science <strong>and</strong> Technology 2010, 45, 1659–1665 1659<br />
Original article<br />
Comparison of the texture of fresh <strong>and</strong> preserved Agaricus bisporus<br />
<strong>and</strong> Boletus edulis mushrooms<br />
Gra_zyna Jaworska, 1 * Emilia Bernas´, 1 Adriana Biernacka 1 & Ireneusz Maciejaszek 2<br />
1 Department of Raw Materials <strong>and</strong> Fruit <strong>and</strong> Vegetable Processing, University of Agriculture in Krakow, 122 Balicka Street, 30-149 Krakow,<br />
Pol<strong>and</strong><br />
2 Department of Refrigeration <strong>and</strong> Food Concentrate, University of Agriculture in Krakow, 122 Balicka Street, 30-149 Krakow, Pol<strong>and</strong><br />
(Received 7 January 2010; Accepted in revised form 19 May 2010)<br />
Summary This work compares changes during the production process <strong>and</strong> storage period in the texture of canned<br />
Agaricus bisporus <strong>and</strong> Boletus edulis mushrooms previously blanched in water, blanched or soaked <strong>and</strong><br />
blanched in solutions containing citric, l-ascorbic <strong>and</strong> lactic acids. The texture was examined using<br />
instruments [textural profile analysis (TPA), Kramer shear cell (KSC)] <strong>and</strong> sensory analysis [five-point,<br />
profiling (P)]. Canning B. edulis mushrooms reduced their hardness, chewiness <strong>and</strong> gumminess (TPA), the<br />
values for force <strong>and</strong> work (KC), <strong>and</strong> brittleness <strong>and</strong> crispiness (P), although increasing their cohesiveness<br />
(TPA). Canning A. bisporus mushrooms reduced their hardness (TPA) <strong>and</strong> the expenditure of work, but<br />
increased their cohesiveness, hardness, crispiness <strong>and</strong> firmness (P). Twelve-month storage of both species of<br />
canned mushrooms led to a reduction in brittleness <strong>and</strong> crispiness (P). The type of pre-treatment applied<br />
affected the texture only when determined using profile analysis, <strong>and</strong> significant differences in hardness,<br />
crispiness <strong>and</strong> firmness between blanched-only <strong>and</strong> soaked <strong>and</strong> blanched products were mainly found in<br />
B. edulis.<br />
Keywords Canning, mushrooms, preliminary treatment, storage, texture.<br />
Introduction<br />
Edible mushrooms are popular all over the world<br />
because of their unique taste <strong>and</strong> texture (Chang,<br />
2006). The most popular species globally is Agaricus<br />
bisporus, whose fruiting bodies are white or creamcoloured<br />
with crumbly, fragile, dry <strong>and</strong> hard flesh. In<br />
Central <strong>and</strong> Eastern Europe, including Pol<strong>and</strong>, the finest<br />
edible mushrooms are considered to be those of the<br />
Boletus family. Characterised by a particularly high<br />
sensory value is Boletus edulis, with caps ranging from<br />
light to dark brown in colour, greyish-white to greyishbrown<br />
stipes <strong>and</strong> delicate reticulated pattern, white to<br />
light brown in colour. Its flesh is firm, hard <strong>and</strong> does not<br />
stain when cut (Mauseth, 2003).<br />
Edible mushrooms are highly perishable. One of the<br />
most frequently used methods of preserving mushrooms<br />
is canning, either in brine or marinade. As mushrooms<br />
darken quickly during processing <strong>and</strong> subsequent storage,<br />
they are subject to an appropriate form of pretreatment<br />
prior to canning. The most common of these<br />
are washing, soaking, blanching or vacuum impregna-<br />
*Correspondent: E-mail: rrgjawor@cyf-kr.edu.pl<br />
doi:10.1111/j.1365-2621.2010.02319.x<br />
Ó 2010 The Authors. Journal compilation Ó 2010 Institute of Food Science <strong>and</strong> Technology<br />
tion in solutions containing substances that inhibit<br />
browning of the tissue, such as table salt, citric acid,<br />
l-ascorbic acid, hydrogen peroxide, EDTA, sodium<br />
isoascorbate, cysteine hydrochloride <strong>and</strong> metabisulphites.<br />
According to Lin et al. (2001), soaking time of<br />
Agaricus bisporus in water can vary from 15 min to 2 h,<br />
when applied prior to sterilisation. For the blanching<br />
process, the cited authors recommend a water solution<br />
of citric acid (1%). Also, during the pre-treatment prior<br />
to preservation, 15-min soaking of mushrooms in a<br />
water solution of potassium metabisulfite (1%) had been<br />
applied to improve the colour of Agaricus bisporus<br />
fruiting bodies, which were then blanched in hot water<br />
for 8 or 10 min (Vivar-Quintana et al., 1999). Parrish<br />
et al. (1974) reported the shorter 5-min blanching time<br />
of Agaricus bisporus. Kotwaliwale et al. (2007) applied<br />
blanching in hot water for 2 min followed by soaking in<br />
potassium metabisulfite (0.75%, 1% or 1.5%) solutions<br />
for 15 min prior to drying of Pleurotus ostreatus<br />
mushroom. Furthermore, Vivar-Quintana et al. (1999)<br />
propose water solutions of NaCl (2%), citric (0.5%),<br />
<strong>and</strong> ⁄ or ascorbic acid (1000 ppm) as marinades’ components<br />
of the sterilised canned product, while Zivanovic<br />
& Buescher (2004) suggest a solution of NaCl (1%)
1660<br />
Texture of fresh <strong>and</strong> preserved mushrooms G. Jaworska et al.<br />
containing CaCl2 at 5 or 25 mm concentration. In<br />
agreement with Parrish et al. (1974), Vivar-Quintana<br />
et al. (1999), as well as Zivanovic & Buescher (2004) the<br />
process of sterilisation should be carried out at 121 °C<br />
for 18–25 min.<br />
Particular technological treatments used as part of the<br />
preservation process, notably pre-treatment, have an<br />
effect on textural changes in mushrooms, concerning<br />
which there are seemingly conflicting opinions in the<br />
available literature. It should also be pointed out that the<br />
source literature on this question is not extensive.<br />
According to Czapski (1994), blanching has a deleterious<br />
effect on the texture of A. bisporus mushrooms; it is,<br />
however, widely used because of its considerable effectiveness<br />
in inhibiting browning of the tissue. In Steinbuch<br />
(1986) opinion, blanching of A. bisporus in water prior to<br />
freezing results in increased hardness <strong>and</strong> gumminess of<br />
the mushrooms. Zivanovic & Buescher (2004), on the<br />
other h<strong>and</strong>, showed that sterilising A. bisporus blanched<br />
in water increases the firmness of mushrooms.<br />
The aim of the work was to investigate the effect on<br />
the texture of canned Agaricus bisporus <strong>and</strong> Boletus<br />
edulis mushrooms prepared using different methods of<br />
preliminary processing (blanching or soaking <strong>and</strong><br />
blanching), sterilisation <strong>and</strong> long-term frozen storage.<br />
Material <strong>and</strong> methods<br />
Material<br />
The material for the study was fresh <strong>and</strong> canned<br />
Agaricus bisporus (Lange) Sing. <strong>and</strong> Boletus edulis (Bull:<br />
Fr.) mushrooms evaluated directly after processing <strong>and</strong><br />
after 12-month storage. The canned product was<br />
prepared from mushrooms blanched or soaked <strong>and</strong><br />
blanched in solutions containing additional substances.<br />
Fresh A. bisporus mushrooms were obtained from a<br />
specialist farm <strong>and</strong> canned approximately 4 h after<br />
being harvested. B. edulis mushrooms with a cap diameter<br />
of 4–8 cm were obtained from pine forests in<br />
western Pol<strong>and</strong> <strong>and</strong> canned approximately 12 h after<br />
being picked. The pre-treatment prior to canning<br />
involved sorting (rejecting any unsound or wormy<br />
specimens); cleaning the mushrooms of any remaining<br />
litter; in the case of B. edulis, separating the caps from<br />
the stipes; <strong>and</strong> washing in cold, running water. Each<br />
batch of mushroom was then divided into five parts,<br />
each of which is of 10 kg mass. Three parts were<br />
blanched: in water (product code BW); in an aqueous<br />
solution of 0.5% citric acid (INS 330) <strong>and</strong> 0.1%<br />
l-ascorbic acid (INS 300) (product code BCA); <strong>and</strong> in<br />
an aqueous solution of 1% lactic acid (INS 270) <strong>and</strong><br />
0.1% l-ascorbic acid (INS 300) (product code BLA).<br />
The remaining two parts were soaked <strong>and</strong> blanched in<br />
the same solutions as products BCA <strong>and</strong> BLA <strong>and</strong> given<br />
the codes SBCA <strong>and</strong> SBLA, respectively. Soaking lasted<br />
1 h, the proportion of weight of the mushrooms to<br />
solution being 1:2. Blanching was carried out at a<br />
temperature of 96–98 °C, the proportion of weight of<br />
the mushrooms to water or solution being 1:5. The<br />
blanching time, which was determined experimentally,<br />
was 3 min for whole A. bisporus mushrooms <strong>and</strong> the<br />
caps of B. edulis, <strong>and</strong> 1.5 min for the stipes of B. edulis.<br />
For the purposes of textural profile analysis (TPA)<br />
analysis, whole A. bisporus mushrooms <strong>and</strong> the separated<br />
caps <strong>and</strong> stipes of B. edulis were preserved. For the<br />
textural analysis in the Kramer shear cell <strong>and</strong> using<br />
profile analysis, the mushrooms were cut into strips<br />
5 mm thick before being preserved; the cut strips of<br />
B. edulis were packed in the proportion of 1:1.4 caps to<br />
stipes. The 180 g of mushrooms was placed in 300-cm 3<br />
‘twist-off’ glass jars. Then, jars with mushrooms were<br />
poured with 100 cm 3 of hot solution containing 2% of<br />
salt (in a ratio by mass of pilei to the solution of 3:2),<br />
deaerated by immersion, sealed <strong>and</strong> sterilised. The<br />
process of sterilisation was carried out as follows:<br />
elevation of temperature up to 100 °C – 5 min; a rise<br />
in temperature from 100 to 118°C – 10 min, a proper<br />
sterilisation in temperatures from 118 to 121 °C –<br />
12 min; <strong>and</strong> finally, cooling down to 30 °C – 10 min.<br />
Sterilisation took place in a laboratory pressure steriliser<br />
of USA manufacture. The canned mushrooms were kept<br />
in a storage chamber for 12 months at temperature of<br />
8–10 °C.<br />
Methods<br />
Chemical evaluation<br />
The dry matter, ash <strong>and</strong> pH level were determined by<br />
AOAC (1995), the results being calculated from four<br />
replications.<br />
Texture analysis<br />
The textural evaluation of Agaricus bisporus <strong>and</strong> Boletus<br />
edulis was carried out by sensory <strong>and</strong> instrumental<br />
analysis.<br />
The sensory evaluation of texture was conducted using<br />
five-point <strong>and</strong> profile analysis methods. Using procedures<br />
in accordance with Polish st<strong>and</strong>ard PN-ISO 6658<br />
(1998), texture of mushrooms was scored on a 5–1 scale<br />
(5 = excellent, 4 = very good, 3 = good, 2 = bad,<br />
1 = very bad) by a panel of five judges, fulfilling the<br />
requirements for sensory sensitivity in Polish st<strong>and</strong>ard<br />
(PN-ISO 3972, 1998). Each analysis was carried out in<br />
five replications.<br />
The TPA was carried out in accordance with PN-ISO<br />
11036 (1999) <strong>and</strong> ISO 13299 (2003). The canned products<br />
were assessed by a panel of eight experts qualified to<br />
do so according to PN-ISO 8586-2 (1996) st<strong>and</strong>ards. The<br />
profile analysis considered hardness, brittleness, crispiness,<br />
firmness, wateriness, gumminess <strong>and</strong> sliminess.<br />
Each analysis was carried out in eight replications.<br />
International Journal of Food Science <strong>and</strong> Technology 2010 Ó 2010 The Authors. Journal compilation Ó 2010 Institute of Food Science <strong>and</strong> Technology
The instrumental textural examination was carried<br />
out using a TA XT2 texture analyser (Stable Micro<br />
Systems, Haslemere, Surrey, UK). Two types of probes<br />
were used: a P ⁄ 45 cylinder probe (45 mm diameter)<br />
made from aluminium for the TPA <strong>and</strong> a modified<br />
Kramer shear cell with three blades, enabling the<br />
material to be cut. The TPA analysis was carried out<br />
separately on the caps <strong>and</strong> stipes, with cylinders cut out<br />
of the mushrooms 20 mm in length <strong>and</strong> diameter. The<br />
samples were then pressed twice at a rate of test speed<br />
1mms )1 to obtain 50% deformation, with a 20-s<br />
interval between pressings. Each group was analysed in<br />
six replications. From the curves obtained from the<br />
TPA, the textural parameters were determined as<br />
hardness [N], springiness, cohesiveness, chewiness [N]<br />
<strong>and</strong> gumminess.<br />
Cut pieces of mushroom were used for the Kramer<br />
shear cell analysis (KSC). Measurement consisted of<br />
cutting through 50 g of material placed in the cell at a<br />
rate of 1 mm s )1 . From the curves obtained, two<br />
parameters were determined: the maximum force [N]<br />
<strong>and</strong> work [mJ] required to cut through the sample<br />
material. Each analysis was carried out in six replications.<br />
For both TPA <strong>and</strong> KSC, 25-kg load cell was used.<br />
Statistical analysis<br />
The results were statistically evaluated using the<br />
F-Snedecor <strong>and</strong> Student’s t-tests (Statistica 6.1 Pl<br />
program, Stat Soft Inc., Tulsa, OK, USA), the least<br />
Table 1 Content of dry matter, ash <strong>and</strong> pH level in fresh <strong>and</strong> canned mushrooms<br />
Texture parameter Mushroom species<br />
Time of<br />
storage S<br />
significant difference being calculated at a = 0.01. The<br />
linear correlation coefficient was determined between the<br />
textural parameters indicated by instrumental methods<br />
<strong>and</strong> those indicated by the sensory-profiling method.<br />
Results <strong>and</strong> Discussion<br />
Chemical evaluations<br />
Fresh A. bisporus mushrooms contained 20% <strong>and</strong> 4%,<br />
respectively less dry matter than the caps <strong>and</strong> stipes of<br />
B. edulis; however, they contained 22% <strong>and</strong> 85% more<br />
ash, respectively. Fresh caps of B. edulis contained 19%<br />
more dry matter <strong>and</strong> 51% more ash than stipes. pH<br />
values of fresh mushrooms were similar <strong>and</strong> fluctuated<br />
between 6.35 <strong>and</strong> 6.40 (Table 1).<br />
The production of canned mushrooms increased the<br />
level of dry matter in A. bisporus by 1–4% but reduced it<br />
in B. edulis caps by 3–19% <strong>and</strong> stipes by 5–27%.<br />
Adding brine during the production process increased<br />
ash content compared with fresh mushrooms by<br />
46–65% in canned A. bisporus, 64–80% in canned<br />
B. edulis caps <strong>and</strong> 108–126% in canned B. edulis stipes.<br />
An insignificant, not exceeding 3%, rise was observed in<br />
pH values of the canned caps, those blanched in water.<br />
In the remaining products, pH decreased by 3–16% in<br />
Agaricus bisporus <strong>and</strong> by 12–32% in caps <strong>and</strong> stipes of<br />
Boletus edulis, whereas no pH differentiation was found<br />
among products obtained from the edible parts of<br />
Kind of pre-treatment<br />
Texture of fresh <strong>and</strong> preserved mushrooms G. Jaworska et al. 1661<br />
BW BCA SBCA BLA SBLA<br />
Dry matter g ⁄ 100 g f.m. Agaricus bisporus 0 8.71 ± 0.08 9.09 ± 0.08 9.10 ± 0.72 8.76 ± 0.08 9.05 ± 0.08 8.84 ± 0.43 0.153<br />
12 9.08 ± 0.16 9.05 ± 0.66 8.72 ± 0.16 9.07 ± 0.74 8.86 ± 0.65<br />
Boletus edulis caps 0 10.80 ± 0.12 10.36 ± 0.12 10.41 ± 0.12 8.77 ± 0.09 10.50 ± 0.84 8.74 ± 0.55 0.059<br />
12 10.37 ± 0.11 10.43 ± 0.08 8.76 ± 0.32 10.56 ± 0.66 8.81 ± 0.78<br />
B. edulis stipes 0 9.08 ± 0.05 8.42 ± 0.09 8.49 ± 0.63 6.72 ± 0.61 8.63 ± 0.51 6.67 ± 0.08 0.069<br />
12 8.40 ± 0.45 8.50 ± 0.35 6.71 ± 0.44 8.66 ± 0.44 6.74 ± 0.66<br />
Ash g ⁄ 100 g f.m. A. bisporus 0 0.72 ± 0.06 1.19 ± 0.08 1.18 ± 0.04 1.05 ± 0.05 1.14 ± 0.09 1.08 ± 0.07 0.061<br />
12 1.17 ± 0.04 1.13 ± 0.08 1.08 ± 0.09 1.12 ± 0.11 1.07 ± 0.08<br />
B. edulis caps 0 0.59 ± 0.03 1.06 ± 0.07 1.04 ± 0.04 0.99 ± 0.04 1.04 ± 0.08 0.97 ± 0.09 0.035<br />
12 1.04 ± 0.06 1.06 ± 0.07 0.98 ± 0.04 1.02 ± 0.07 0.98 ± 0.07<br />
B. edulis stipes 0 0.39 ± 0.01 0.88 ± 0.04 0.85 ± 0.05 0.84 ± 0.06 0.88 ± 0.08 0.81 ± 0.07 0.032<br />
12 0.86 ± 0.04 0.87 ± 0.08 0.83 ± 0.03 0.86 ± 0.05 0.82 ± 0.04<br />
pH A. bisporus 0 6.40 ± 0.02 6.51 ± 0.02 5.90 ± 0.02 5.81 ± 0.02 6.10 ± 0.01 5.39 ± 0.02 0.141<br />
12 6.47 ± 0.03 5.84 ± 0.02 5.78 ± 0.02 6.01 ± 0.03 5.31 ± 0.03<br />
B. edulis caps 0 6.38 ± 0.04 6.57 ± 0.03 5.59 ± 0.09 5.22 ± 0.03 5.09 ± 0.07 4.36 ± 0.05 0.120<br />
12 6.49 ± 0.07 5.51 ± 0.083 5.13 ± 0.09 5.04 ± 0.04 4.28 ± 0.06<br />
B. edulis stipes 0 6.35 ± 0.04 6.54 ± 0.08 5.58 ± 0.10 5.20 ± 0.07 5.03 ± 0.05 4.32 ± 0.09 0.152<br />
12 6.45 ± 0.07 5.49 ± 0.08 5.13 ± 0.09 4.99 ± 0.11 4.23 ± 0.07<br />
f.m., fresh matter; S, fresh mushrooms; BW, blanching in water; BCA, blanching in citric acid <strong>and</strong> L-ascorbic acid water solution; SBCA, soaking<br />
<strong>and</strong> then blanching in citric acid <strong>and</strong> L-ascorbic acid water solution; BLA, blanching in lactic acid <strong>and</strong> L-ascorbic acid water solution; SBLA, soaking<br />
<strong>and</strong> then blanching in lactic acid <strong>and</strong> L-ascorbic acid water solution; ± st<strong>and</strong>ard deviation.<br />
LSD,<br />
a = 0.01<br />
Ó 2010 The Authors. Journal compilation Ó 2010 Institute of Food Science <strong>and</strong> Technology International Journal of Food Science <strong>and</strong> Technology 2010
1662<br />
Texture of fresh <strong>and</strong> preserved mushrooms G. Jaworska et al.<br />
Boletus edulis. No significant change was observed in<br />
dry matter, ash <strong>and</strong> pH level during the 12-month<br />
storage period.<br />
Texture analysis<br />
The canned, sterilised products obtained form Agaricus<br />
bisporus showed a very good <strong>and</strong> balanced consistency,<br />
however, slightly inferior in comparison with the products<br />
of Boletus edulis. During 1-year storage of the<br />
products, a visible worsening of mushrooms’ consistency<br />
was observed by 0.8–0.9 points for Agaricus<br />
bisporus <strong>and</strong> by 0.5 points in the case of Boletus edulis.<br />
Pre-treatment applied prior to sterilisation did not affect<br />
the mushrooms’ consistency evaluated on a five-point<br />
scale (Table S1).<br />
In the TPA, it was found that fresh A. bisporus <strong>and</strong><br />
B. edulis mushrooms were moderately hard <strong>and</strong> very<br />
brittle, crispy <strong>and</strong> firm, but were not watery or slimy<br />
(Table S2).<br />
Compared with fresh mushrooms, the technological<br />
process of canning A. bisporus resulted in a significant<br />
increase in hardness (1.0–1.4 points) <strong>and</strong> crispiness (0.5<br />
points) <strong>and</strong> firmness, with the exception of mushrooms<br />
blanched in water. In the case of B. edulis, on the other<br />
h<strong>and</strong>, a significant decrease in brittleness (2.3–3.0 points)<br />
<strong>and</strong> crispiness (1.0–2.0 points) was observed, regardless of<br />
the pre-treatment applied; in canned products obtained<br />
after soaking <strong>and</strong> blanching (SBCA <strong>and</strong> SBLA), there was<br />
also a decrease in hardness (0.7 points) <strong>and</strong> firmness (1.5<br />
points). Moreover, canned B. edulis became slightly<br />
watery <strong>and</strong> slimy (Table S2).<br />
In some samples, the storage of canned mushrooms of<br />
both species resulted in significant reductions in brittleness<br />
<strong>and</strong> crispiness of 0.1–1.1 points <strong>and</strong> 0.2–1.3 points,<br />
respectively, <strong>and</strong> additionally in A. bisporus, reductions<br />
in hardness <strong>and</strong> firmness of 0.4–1.4 points <strong>and</strong> 0.6–1.2<br />
points, respectively. In the case of canned B. edulis, an<br />
increase in hardness of 0.1–1.2 points was observed,<br />
significant in three products: BCA, BLA <strong>and</strong> SBLA, <strong>and</strong><br />
an increase in firmness of 0.2–0.4 points with the<br />
exception of mushrooms blanched in water.<br />
The type of pre-treatment applied affected textural<br />
parameters evaluated through profile analysis, but most<br />
of the significant differences were found at the end of the<br />
storage period. Canned B. edulis products previously<br />
soaked <strong>and</strong> blanched (SBCA <strong>and</strong> SBLA) compared with<br />
blanched-only products (BCA <strong>and</strong> BLA) were less hard<br />
(0.6–1.2 points), crispy (0.8–0.9 points) <strong>and</strong> firm (0.8<br />
points), but more watery (0.7–0.9 points). Canned<br />
A. bisporus showed decreased hardness (0.9–1.0 points)<br />
<strong>and</strong> brittleness (0.5–0.7 points).<br />
The TPA analysis showed that fresh A. bisporus<br />
mushrooms were 50–78% harder, 17–73% gummier<br />
<strong>and</strong> 6–41% chewier than B. edulis caps <strong>and</strong> stipes. They<br />
were also 10–19% less springy <strong>and</strong> 34% less cohesive.<br />
There were also significant differences between the parts<br />
of B. edulis: the caps were 16% less hard <strong>and</strong> 11% less<br />
springy than the stipes, but 73% more cohesive, 49%<br />
gummier <strong>and</strong> 33% chewier. Ko et al. (2007) claim that<br />
Flammulina velutipes caps show better hardness <strong>and</strong><br />
lower springiness <strong>and</strong> cohesiveness, when compared<br />
with stipes.<br />
It should also be noted that there were relatively large<br />
differences in the levels of individual textural parameters<br />
within the A. bisporus samples <strong>and</strong> also within the cap<br />
<strong>and</strong> stipe groups of B. edulis. In the case of A. bisporus,<br />
the st<strong>and</strong>ard deviation in the values for these parameters<br />
amounted to 12–22%, while in the case of B. edulis, it<br />
was 6–18% for caps <strong>and</strong> 8–23% for stipes (Table 2). The<br />
high level of differences in st<strong>and</strong>ard deviation resulted<br />
primarily from the heterogeneous structure of individual<br />
mushrooms, which for the purposes of analysis were<br />
classified according to cap size rather than structure.<br />
The production process did not bring any significant<br />
changes in springiness, chewiness, or gumminess in the<br />
case of canned A. bisporus, nor in springiness in the<br />
case of canned B. edulis. Small changes in cohesiveness<br />
may have resulted from the cellular moisture <strong>and</strong><br />
solutes movement into intercellular spaces after the<br />
collapse of cell membrane. Loch & Breene (1982)<br />
suggested that the moisture <strong>and</strong> solutes, which retained<br />
in such intercellular spaces, established hydrostatic<br />
pressure maintaining the springiness of mushrooms.<br />
Canning caused a significant increase in tissue cohesion,<br />
with canned A. bisporus almost three times as cohesive<br />
as fresh mushrooms, canned B. edulis caps 2.5 times<br />
<strong>and</strong> canned B. edulis stipes four times as cohesive.<br />
Canning resulted in a levelling of cohesiveness between<br />
B. edulis caps <strong>and</strong> stipes. An increase in cohesiveness of<br />
Flammulina velutipe pilei as a consequence of high<br />
temperature treatment has also been noted (Ko et al.,<br />
2007).<br />
Canning also caused significant decrease in hardness:<br />
64–69% in A. bisporus; 82–84% in B. edulis caps <strong>and</strong><br />
90–92% in B. edulis stipes. Loss of hardness probably<br />
resulted as an effect of protein denaturation <strong>and</strong><br />
permeability changes, causing loss of cellular water<br />
<strong>and</strong> solutes because of high temperature treatment<br />
(Loch & Breene, 1982). In addition, in B. edulis caps<br />
<strong>and</strong> stipes, it caused an approximately 2.5-fold decrease<br />
in chewiness <strong>and</strong> gumminess. Ko et al. (2007) observed a<br />
decrease in chewiness <strong>and</strong> gumminess of caps <strong>and</strong> stipes<br />
of Flammulina velutipes mushrooms when treated with a<br />
temperature above 90 °C for 1–10 min.<br />
Prior to storage, canned A. bisporus mushrooms<br />
showed similar springiness to B. edulis caps <strong>and</strong> stipes<br />
but were approximately 1 ⁄ 3 less cohesive, 3–4 times as<br />
chewy, 3–5 times as gummy <strong>and</strong> 3.5–6.0 times as hard.<br />
Pre-treatment <strong>and</strong> sterilisation altered the differences in<br />
individual textural characteristics of B. edulis caps <strong>and</strong><br />
stipes. There was less of a difference in springiness <strong>and</strong><br />
International Journal of Food Science <strong>and</strong> Technology 2010 Ó 2010 The Authors. Journal compilation Ó 2010 Institute of Food Science <strong>and</strong> Technology
Table 2 The results of the TPA measurement of fresh <strong>and</strong> canned mushrooms<br />
Texture<br />
parameter Mushroom species<br />
Time of<br />
storage S<br />
cohesiveness between the caps <strong>and</strong> stipes of canned<br />
B. edulis. Similarly to fresh mushrooms, canned caps<br />
were approximately 1 ⁄ 3 chewier than canned stipes.<br />
Canning increased the differences between the parts of<br />
B. edulis in gumminess <strong>and</strong> hardness, which were 2 ⁄ 3 <strong>and</strong><br />
1.5 times greater, respectively in caps than in stipes.<br />
Ko et al. (2007) revealed that in Flammulina velutipes<br />
mushrooms, treated with a temperature exceeding<br />
90 °C within 1–10 min, the reduction in hardness <strong>and</strong><br />
cohesiveness is observed accompanied by an increase in<br />
springiness of both caps <strong>and</strong> stipes. With the exception of<br />
springiness, the changes reported were higher in stipes<br />
than in caps. The greater effect of a high temperature<br />
could probably be caused by the fact that the internal<br />
thermal conduction in the caps was less effective <strong>and</strong> less<br />
destructive to caps tissue because of the thicker fruiting<br />
bodies <strong>and</strong> greater caps’ volume in comparison with the<br />
stipes.<br />
In the TPA analysis, 12-month storage of canned<br />
mushrooms had no significant effect on individual<br />
textural parameters. It should be noted that the storage<br />
Kind of pre-treatment<br />
BW BCA SBCA BLA SBLA<br />
LSD,<br />
a = 0.01<br />
Springiness Agaricus bisporus 0 0.446 ± 0.064 0.474 ± 0.062 0.468 ± 0.058 0.446 ± 0.093 0.467 ± 0.155 0.442 ± 0.060 NS<br />
12 0.493 ± 0.062 0.516 ± 0.065 0.484 ± 0.094 0.536 ± 0.070 0.486 ± 0.060<br />
Boletus edulis caps 0 0.494 ± 0.040 0.518 ± 0.039 0.544 ± 0.063 0.522 ± 0.076 0.530 ± 0.080 0.500 ± 0.083 NS<br />
12 0.503 ± 0.056 0.534 ± 0.049 0.518 ± 0.057 0.512 ± 0.081 0.482 ± 0.085<br />
B. edulis stipes 0 0.552 ± 0.048 0.550 ± 0.091 0.552 ± 0.059 0.621 ± 0.037 0.584 ± 0.095 0.630 ± 0.051 NS<br />
12 0.539 ± 0.085 0.482 ± 0.079 0.538 ± 0.060 0.518 ± 0.066 0.577 ± 0.064<br />
Cohesiveness A. bisporus 0 0.106 ± 0.020 0.294 ± 0.062 0.290 ± 0.056 0.291 ± 0.060 0.309 ± 0.047 0.308 ± 0.024 0.1080<br />
12 0.289 ± 0.059 0.267 ± 0.057 0.246 ± 0.051 0.264 ± 0.034 0.249 ± 0.036<br />
B. edulis caps 0 0.161 ± 0.011 0.412 ± 0.056 0.419 ± 0.031 0.377 ± 0.099 0.467 ± 0.017 0.409 ± 0.058 0.1132<br />
12 0.392 ± 0.073 0.386 ± 0.027 0.359 ± 0.044 0.360 ± 0.134 0.355 ± 0.070<br />
B. edulis stipes 0 0.093 ± 0.016 0.409 ± 0.064 0.374 ± 0.064 0.346 ± 0.054 0.494 ± 0.066 0.433 ± 0.071 0.1125<br />
12 0.401 ± 0.067 0.334 ± 0.048 0.341 ± 0.044 0.351 ± 0.037 0.415 ± 0.071<br />
Chewiness [N] A. bisporus 0 2.62 ± 0.57 2.83 ± 0.39 2.82 ± 0.51 2.21 ± 0.46 2.73 ± 0.48 2.60 ± 0.41 NS<br />
12 2.73 ± 0.51 2.65 ± 0.53 2.23 ± 0.47 2.93 ± 0.55 2.37 ± 0.30<br />
B. edulis caps 0 2.47 ± 0.40 1.09 ± 0.08 1.07 ± 0.18 1.10 ± 0.18 1.16 ± 0.18 1.18 ± 0.15 0.659<br />
12 1.12 ± 0.20 1.24 ± 0.15 1.22 ± 0.19 1.21 ± 0.14 1.13 ± 0.15<br />
B. edulis stipes 0 1.86 ± 0.26 0.71 ± 0.04 0.72 ± 0.11 0.80 ± 0.13 0.80 ± 0.20 0.89 ± 0.14 0.372<br />
12 0.59 ± 0.09 0.57 ± 0.11 0.63 ± 0.11 0.54 ± 0.10 0.71 ± 0.08<br />
Gumminess A. bisporus 0 5.88 ± 1.06 5.98 ± 0.87 6.33 ± 1.09 5.04 ± 0.60 5.99 ± 1.15 5.33 ± 1.05 NS<br />
12 5.51 ± 1.03 5.34 ± 0.71 4.86 ± 1.06 5.45 ± 1.13 4.90 ± 0.69<br />
B. edulis caps 0 5.04 ± 0.90 2.18 ± 0.36 1.94 ± 0.29 2.08 ± 0.36 2.38 ± 0.41 2.30 ± 0.33 1.021<br />
12 2.31 ± 0.34 2.29 ± 0.32 2.29 ± 0.31 2.41 ± 0.41 2.34 ± 0.20<br />
B. edulis stipes 0 3.39 ± 0.58 1.30 ± 0.17 1.31 ± 0.18 1.28 ± 0.20 1.44 ± 0.21 1.42 ± 0.25 0.629<br />
12 1.28 ± 0.20 1.14 ± 0.17 1.43 ± 0.24 1.05 ± 0.18 1.57 ± 0.11<br />
Hardness [N] A. bisporus 0 55.68 ± 6.47 18.72 ± 2.33 18.34 ± 2.28 17.48 ± 2.78 20.15 ± 4.07 18.79 ± 3.26 7.305<br />
12 19.18 ± 3.30 18.52 ± 3.95 20.51 ± 3.78 20.91 ± 4.28 19.89 ± 3.15<br />
B. edulis caps 0 31.34 ± 5.58 5.30 ± 0.71 5.01 ± 0.71 5.59 ± 1.00 5.16 ± 0.83 5.72 ± 1.04 3.198<br />
12 6.00 ± 0.70 5.92 ± 0.89 6.31 ± 0.74 6.31 ± 1.08 6.58 ± 1.00<br />
B. edulis stipes 0 37.10 ± 6.43 2.96 ± 0.51 3.70 ± 0.66 3.82 ± 0.55 2.94 ± 0.47 3.33 ± 0.44 3.426<br />
12 3.18 ± 0.52 3.89 ± 0.62 4.24 ± 0.75 3.35 ± 0.61 3.95 ± 0.48<br />
S, fresh mushrooms; BW, BCA, SBCA, BLA, SBLA – see Table 1; NS, not significant; ± st<strong>and</strong>ard deviation.<br />
Texture of fresh <strong>and</strong> preserved mushrooms G. Jaworska et al. 1663<br />
period increased the hardness of mushrooms, particularly<br />
in canned B. edulis, whose caps <strong>and</strong> stipes were<br />
respectively, 13–22% <strong>and</strong> 5–19% harder after 12-month<br />
storage compared with caps <strong>and</strong> stipes directly after<br />
canning. A 17–33% decrease in the chewiness of canned<br />
B. edulis stipes was also observed after storage.<br />
The type of pre-treatment applied did not have a<br />
significant effect on texture in the TPA analysis of<br />
mushrooms. Kotwaliwale et al. (2007) noted that dried<br />
Pleurotus sp. mushrooms blanched in water prior to<br />
drying were significantly harder, but less cohesive <strong>and</strong><br />
springy than those soaked in a potassium metabisulfite<br />
solution for 15 min.<br />
Cutting through strips of fresh A. bisporus in the<br />
Kramer shear cell required 19% more force <strong>and</strong> 26%<br />
more work than cutting through B. edulis (Table 3).<br />
Czapski (1994) stated that the force required to cut<br />
through 50-g fresh A. bisporus was 15–20 N g )1 , 2.5<br />
times lower than that in this experiment.<br />
The canning process had a significant effect on the<br />
values of both the above textural parameters measured<br />
Ó 2010 The Authors. Journal compilation Ó 2010 Institute of Food Science <strong>and</strong> Technology International Journal of Food Science <strong>and</strong> Technology 2010
1664<br />
Texture of fresh <strong>and</strong> preserved mushrooms G. Jaworska et al.<br />
Table 3 The results of the Kramer shear cell measurement of canned mushrooms<br />
Texture<br />
parameter Mushroom species<br />
in the Kramer shear cell in the case of strips of<br />
B. edulis <strong>and</strong> only of the work required in the case of<br />
strips of A. bisporus. Compared with the fresh mushrooms,<br />
29–46% less force was required to cut through<br />
the canned B. edulis. With respect to shear work,<br />
44–48% less work was required to cut through the<br />
canned A. bisporus, while for the canned B. edulis, it<br />
was 65–88%.<br />
Twelve-month storage did not result in significant<br />
changes in the textural parameters measured in the<br />
Kramer shear cell. Zivanovic & Buescher (2004) noted<br />
that 3-month storage of canned A. bisporus at room<br />
temperature had no effect on firmness determined as<br />
force for puncturing; however, it caused a significant<br />
increase in toughness determined as shear-press force,<br />
from 91 to 103 kg ⁄ 100 g. According to the above<br />
authors, firmness <strong>and</strong> toughness are affected by the<br />
concentration of CaCl 2 in the canning liquid because an<br />
increase in the concentration of this compound from 0<br />
to 25 mm causes a significant increase in the level of<br />
these two parameters.<br />
The type of pre-treatment applied prior to canning<br />
resulted in significant differences in the values of textural<br />
parameters only in the case of B. edulis. Canned<br />
mushrooms pre-treated with lactic acid <strong>and</strong> l-ascorbic<br />
acid (products BLA <strong>and</strong> SBLA) required an average of<br />
29% more force <strong>and</strong> 24% more work than those<br />
blanched in water (BW) or those pre-treated with citric<br />
acid <strong>and</strong> l-ascorbic acid (BCA <strong>and</strong> SBCA).<br />
Correlation ratio<br />
Time of<br />
storage S<br />
According to the TPA analysis, changes in the hardness<br />
of B. edulis caps <strong>and</strong> stipes, resulting from the canning<br />
process <strong>and</strong> subsequent storage, were strongly <strong>and</strong><br />
positively correlated with each other (r = 1.00, R 2 =<br />
1.00). The hardness of A. bisporus <strong>and</strong> B. edulis determined<br />
by TPA analysis was strongly enough correlated<br />
with the force required to cut through the material in the<br />
Kramer shear cell; the relationship was negative in the<br />
Kind of pre-treatment<br />
BW BCA SBCA BLA SBLA<br />
case of A. bisporus (r = )0.85, R 2 = 0.73) <strong>and</strong> positive<br />
in the case of B. edulis caps <strong>and</strong> stipes (r = 0.79,<br />
R 2 = 0.63 <strong>and</strong> r = 0.78, R 2 = 0.61, respectively).<br />
Hardness determined by the TPA measurement or the<br />
value of force defined using the Kramer shear cell did<br />
not correlate with the hardness assessed by a profile<br />
analysis.<br />
For the remaining texture parameters (springiness,<br />
cohesiveness, chewiness <strong>and</strong> gumminess) determined by<br />
the TPA measurement <strong>and</strong> the texture parameters<br />
defined in the profile analysis, only weak correlation<br />
was observed with the linear correlation coefficients not<br />
exceeding )0.77 <strong>and</strong> R 2 < 0.60.<br />
Conclusions<br />
LSD,<br />
a = 0.01<br />
Force [N] Agaricus bisporus 0 140.0 ± 13.3 162.4 ± 15.9 172.9 ± 15.6 172.3 ± 26.0 175.7 ± 17.8 169.7 ± 21.5 NS<br />
12 160.3 ± 17.5 171.4 ± 19.7 175.8 ± 23.8 177.2 ± 20.1 167.6 ± 20.7<br />
Boletus edulis 0 113.3 ± 5.5 66.5 ± 11.9 65.7 ± 14.6 61.1 ± 10.4 85.3 ± 16.0 80.6 ± 14.8 18.94<br />
12 64.7 ± 10.6 61.9 ± 10.1 52.1 ± 13.0 81.8 ± 13.4 71.1 ± 11.5<br />
Work [mJ] Agaricus bisporus 0 2689 ± 215 1409 ± 124 1423 ± 237 1510 ± 240 1488 ± 222 1424 ± 156 307.1<br />
12 1371 ± 200 1414 ± 115 1462 ± 219 1480 ± 228 1409 ± 186<br />
Boletus edulis 0 1978 ± 23 549 ± 126 583 ± 125 442 ± 67 686 ± 110 614 ± 103 140.1<br />
12 522 ± 92 523 ± 78 395 ± 65 600 ± 70 579 ± 91<br />
S, BW, BCA, SBCA, BLA, SBLA, – see Table 1; NS, not significant; ± st<strong>and</strong>ard deviation.<br />
The technological process of canning had a significant<br />
effect on the content of dry matter <strong>and</strong> ash, unlike the<br />
12-month period of storage, during which no changes<br />
in these features of the chemical composition were<br />
observed.<br />
The canning process led to changes in the textural<br />
parameters depending on the species of mushroom. The<br />
hardness, chewiness <strong>and</strong> gumminess of B. edulis evaluated<br />
through TPA analysis were reduced as a result of<br />
canning, as was the degree of force <strong>and</strong> work required<br />
for cutting through mushrooms measured using the<br />
Kramer shear cell <strong>and</strong> the evaluations of brittleness <strong>and</strong><br />
crispiness <strong>and</strong>, in some cases, hardness <strong>and</strong> firmness<br />
evaluated using sensory profiling. An increase in cohesiveness<br />
was also observed (TPA). In the case of<br />
A. bisporus, there were decreases in hardness determined<br />
instrumentally (TPA) <strong>and</strong> in work, <strong>and</strong> an increase in<br />
cohesiveness (TPA) as well as in hardness, crispiness <strong>and</strong><br />
firmness determined through profile analysis.<br />
Twelve-month storage of the canned mushrooms of<br />
both species significantly affected the texture of mushrooms<br />
assessed by sensory evaluation but had no effect<br />
on the texture parameters evaluated using the instrumental<br />
methods. After 1-year storage, the texture<br />
International Journal of Food Science <strong>and</strong> Technology 2010 Ó 2010 The Authors. Journal compilation Ó 2010 Institute of Food Science <strong>and</strong> Technology
evaluated by the use of five-point scale method was<br />
significantly lower, <strong>and</strong> changes were noted in hardness,<br />
brittleness <strong>and</strong> crispiness evaluated using sensory profiling.<br />
The type of pre-treatment applied affected only the<br />
degree of force <strong>and</strong> work required to cut through canned<br />
B. edulis mushrooms in the Kramer shear cell as well as<br />
certain parameters in both species evaluated through<br />
profile analysis.<br />
Texture parameters obtained by instrumental methods<br />
were strongly correlated with each other <strong>and</strong> did not<br />
correlate with those obtained from sensory profiling.<br />
Acknowledgments<br />
The study was financed by the Ministry of Education<br />
<strong>and</strong> Science under a research Project No. 2 PO6T 041 29.<br />
References<br />
AOAC (1995). Official Methods of Analysis, 16th edn. Arlington, USA:<br />
Association of Official Analytical Chemistry.<br />
Chang, S.-T. (2006). The world mushroom industry: trends <strong>and</strong><br />
technological development. International Journal of Medicinal<br />
Mushrooms, 8, 297–314.<br />
Czapski, J. (1994). Wpyw niektórych operacji technologicznych na<br />
wydajnos´ć i jakos´c´ pieczarek blanszowanych i skadowanych w<br />
zalewie [The effect of some technological treatments on the yield <strong>and</strong><br />
quality of blanched mushroom stored in brine]. Vegetable Crops<br />
Research Bulletin, 42, 101–119 [in Polish].<br />
ISO 13299 (2003). Sensory Analysis. Methodology. General Guidance<br />
for Establishing a Sensory Profile. Geneva, Switzerl<strong>and</strong>: International<br />
Organization for St<strong>and</strong>ardization.<br />
Jaworska, G., Ge˛bczyński, P. & Goyszny, A. (2003). Wykorzystanie<br />
pieczarek do produkcji mro_zonych i sterylizowanych farszów [The<br />
use of mushrooms (Agaricus bisporus) in the production of frozen<br />
<strong>and</strong> canned stuffings]. _Zywnos´c´. Nauka. Technologia. Jakos´c´. [Food.<br />
Science. Technology. Quality], Suplement, 36, 63–71 [in Polish].<br />
Ko, W.C., Liu, W.C., Tsang, Y.T. & Hsieh, C.H. (2007). Kinetics of<br />
winter mushrooms (Flammulina velutipes) microstructure <strong>and</strong> quality<br />
changes during thermal processing. Journal of Food Engineering,<br />
81, 587–598.<br />
Kotwaliwale, N., Bakane, P. & Verma, A. (2007). Changes in textural<br />
<strong>and</strong> optical properties of oyster mushroom during hot air drying.<br />
Journal of Food Engineering, 78, 1207–1211.<br />
Lin, Z., Chen, H. & Lin, F. (2001). Influence of treatments <strong>and</strong><br />
blanching treatments on the yield <strong>and</strong> color of canned mushrooms.<br />
Journal of Food Processing <strong>and</strong> Preservation, 25, 381–388.<br />
Texture of fresh <strong>and</strong> preserved mushrooms G. Jaworska et al. 1665<br />
Loch, J. & Breene, W.M. (1982). Between-species differences in<br />
fracturability loss: microscopic <strong>and</strong> chemical comparison of potato<br />
<strong>and</strong> Chinese water chestnut. Journal of Texture Studies, 13, 325–327.<br />
Mauseth, J.D. (2003). Botany: An Introduction to Plant, 3rd edn.<br />
Austin, TX: University of Texas.<br />
Parrish, G.K., Beelman, R.B., McAdle, F.J. & Kuhn, G.D. (1974).<br />
Influence of post-harvest storage <strong>and</strong> canning on the solids <strong>and</strong><br />
mannitol content of the cultivated mushroom <strong>and</strong> their relationship<br />
to canned product yield. Journal of Food Science, 39, 1029–<br />
1031.<br />
PN-ISO 11036 (1999). Analiza sensoryczna. Profilowanie tekstury<br />
[Sensory Analysis. Methodology. Texture Profile]. Warsaw, Pol<strong>and</strong>:<br />
Polish Committee for St<strong>and</strong>ardization [in Polish].<br />
PN-ISO 3972 (1998). Analiza sensoryczna. Metodologia. Metoda<br />
sprawdzania wra _zliwos´ci smakowej [Sensory Analysis. Methodology.<br />
Method of Investigating Sensitivity of Taste]. Warsaw, Pol<strong>and</strong>:<br />
Polish Committee for St<strong>and</strong>ardization [in Polish].<br />
PN-ISO 6658 (1998). Analiza sensoryczna. Metodologia. Wytyczne<br />
ogo´lne. [Sensory Analysis. Methodology. General Guidelines]. Warsaw,<br />
Pol<strong>and</strong>: Polish Committee for St<strong>and</strong>ardization [in Polish].<br />
PN-ISO 8586-2 (1996). Analiza sensoryczna. Ogo´lne wytyczne wyboru,<br />
szkolenia i monitorowania oceniaja˛cych. Eksperci [Sensory Analysis.<br />
General Guidance for the Selection, Training <strong>and</strong> Monitoring of<br />
Assessors. Experts]. Warsaw, Pol<strong>and</strong>: Polish Committee for<br />
St<strong>and</strong>ardization [in Polish].<br />
Steinbuch, E. (1986). Some developments of mushroom processing.<br />
Proceedings of the International Symposium on Scientific <strong>and</strong><br />
Technical Aspects of Cultivating Edible Fungi. Pp. 311–318. The<br />
Penna State University Pennsylvania, USA: Elsevier.<br />
Vivar-Quintana, A.M., González-San José, M.L. & Collado-Fernández,<br />
M. (1999). Influence of canning process on colour, weight <strong>and</strong><br />
grade of mushrooms. Food Chemistry, 66, 87–92.<br />
Zivanovic, S. & Buescher, R. (2004). Changes in mushroom texture<br />
<strong>and</strong> cell wall composition affected by thermal processing. Journal of<br />
Food Science, 69, SNQ44–SNQ49.<br />
Supporting Information<br />
Additional supporting Information may be found in the<br />
online version of this article:<br />
Table S1. Results of the five-point texture analysis of<br />
canned mushrooms<br />
Table S2. Results of the texture profile analysis of<br />
canned mushrooms.<br />
Please note: Wiley-Blackwell are not responsible for<br />
the content or functionality of any supporting information<br />
supplied by the authors. Any queries (other than<br />
missing material) should be directed to the corresponding<br />
author for the article.<br />
Ó 2010 The Authors. Journal compilation Ó 2010 Institute of Food Science <strong>and</strong> Technology International Journal of Food Science <strong>and</strong> Technology 2010
1666<br />
Original article<br />
Chemical stability of yellow pigment extracted from the flower bud<br />
of Sophora japonica L. (Huaimi)<br />
Wanping Chen, 1 Ping Li 1 & Xiaohong Wang 1,2 *<br />
1 College of Food Science <strong>and</strong> Technology, Huazhong Agricultural University, Wuhan 430070, China<br />
2 Key Laboratory of Food Safety Evaluation of the Ministry of Agriculture, Wuhan 430070, China<br />
(Received 16 February 2010; Accepted in revised form 19 May 2010)<br />
Summary The dry flower bud of Sophora japonica L., generally called Huaimi in China, has been used as traditional<br />
Chinese medicinal materials <strong>and</strong> folk edible yellow pigment material for a long time. In this paper, the yellow<br />
pigment was extracted from Huaimi, <strong>and</strong> its chemical stability related with pH value, temperature <strong>and</strong><br />
metallic ions was studied systemically. When pH values changed from 2.0 to 9.0, the yellow pigment revealed<br />
structural transformation <strong>and</strong> colour variations. According to its mathematic model of thermal stability, the<br />
yellow pigment had good thermal stability, with a half-life of 918.9 h at room temperature. Effect of metallic<br />
ions on the yellow pigment displayed a co-pigmentation influence. HPLC analysis indicated that the content<br />
of rutin in it was about 42.56%. These results may be helpful for the further application investigations into<br />
its commercial prospects in food pigment industry.<br />
Keywords Chemical stability, Huaimi, kinetics, mathematical model, Sophora japonica L., yellow pigment.<br />
Introduction<br />
Pigments, as food additives to improve food colour <strong>and</strong><br />
stimulate people’s appetite, are widely used in food<br />
industry (Gouveia et al., 2007). Pigments are classified<br />
as natural pigments <strong>and</strong> synthetic pigments according to<br />
their resources. Synthetic pigments are widely used in<br />
food industry because of their advantages. For example,<br />
synthetic pigments have brighter colour, lower cost <strong>and</strong><br />
stronger stability compared with natural pigments.<br />
However, present studies have shown that some of<br />
them may have latent toxic effects on humans, such as<br />
carcinogenicity, mutagenicity inflammation (Gouveia<br />
et al., 2007; Gris et al., 2007; Castaneda-ov<strong>and</strong>o et al.,<br />
2009). By contraries, natural pigments are correspondingly<br />
safe, some of them even reveal nutritional <strong>and</strong><br />
pharmacological effects, such as anti-oxidation, anticarcinogenicity,<br />
anti-mutagenicity, anti-inflammation<br />
(Galvano et al., 2004). Nowadays, natural pigments<br />
are being applied more <strong>and</strong> more in modern food<br />
industry because of the increase in consumer’s awareness<br />
of health maintenance (Gouveia et al., 2007; Gris<br />
et al., 2007).<br />
Recently, seeking for available resources of natural<br />
pigments is an extensive <strong>and</strong> active research field (El<br />
*Correspondent: Fax: 86 27 87282927;<br />
e-mail: wxh@mail.hzau.edu.cn<br />
International Journal of Food Science <strong>and</strong> Technology 2010, 45, 1666–1672<br />
gharras et al., 2008). Some natural pigments, such as<br />
carotenoids, anthocyanins <strong>and</strong> betalains, attract more<br />
consumer’s attention for their pharmacological <strong>and</strong><br />
bioactive functions (Cai et al., 2003; Stintzing & Carle,<br />
2004). However, there are some disadvantages in the<br />
application <strong>and</strong> storage of natural pigments. The most<br />
demerits of natural pigments consist in their instability,<br />
which narrow their appliance in food industry (Castaneda-ov<strong>and</strong>o<br />
et al., 2009). There are a few factors related<br />
with their stabilities. For instance, structure <strong>and</strong> concentration<br />
of natural pigments themselves are basic<br />
factors. pH value <strong>and</strong> temperature of environment,<br />
along with presence of co-compounds such as phenols<br />
<strong>and</strong> metallic ions, are also closely associated with their<br />
stabilities (Hurtado et al., 2009). Up to now, the list of<br />
natural pigments applying in foodstuff is mainly capsanthin,<br />
yellow corn, sorghum red, turmeric pigment,<br />
gardenia yellow pigment, b-carotene, red radish, Monascus<br />
pigments, <strong>and</strong> so on (Dufosse & Pintea, 2005).<br />
The dry flower bud of Sophora japonica L., generally<br />
called Huaimi in China, has been used as traditional<br />
Chinese medicinal materials <strong>and</strong> folk edible yellow<br />
pigment material by Chinese people for a long time<br />
(Wang et al., 2006; Qi et al., 2007; Lo et al., 2009). The<br />
latest pharmacological studies <strong>and</strong> clinical practices on<br />
Huaimi have found that it possesses anti-tumour, antifertility<br />
<strong>and</strong> anti-cancer activities, which can be attributed<br />
to its chemical components, such as flavonoids<br />
doi:10.1111/j.1365-2621.2010.02322.x<br />
Ó 2010 The Authors. Journal compilation Ó 2010 Institute of Food Science <strong>and</strong> Technology
components, the principal active ingredients of Huaimi<br />
(Kite et al., 2007; Qi et al., 2007; Xu et al., 2007; Lo<br />
et al., 2009).<br />
On record in Bencao Gangmu, also known as<br />
Compendium of Materia Medica, a famous Chinese<br />
materia medica work written by Li Shizhen in Ming<br />
Dynasty, local residents in southern China have used<br />
Huaimi as colouring agent in traditional food for almost<br />
400 years. Long-term application practices have proven<br />
that yellow pigment of Huaimi is safe <strong>and</strong> stable.<br />
However, studies of yellow pigment from Huaimi on its<br />
composition <strong>and</strong> chemical characteristics are less<br />
reported (Paniwnyk et al., 2001; Xu et al., 2007; Lo<br />
et al., 2009). Applications of Huaimi as yellow pigment<br />
material are mainly relied on people’s practical experiences.<br />
UV–VIS spectrophotometry is a feasible method for<br />
analysing plant extracts. In the visible wavelength range,<br />
the content of pigments is highly correlated with the<br />
absorption at the specific wavelengths (Pflanz & Zude,<br />
2008). In the present studies, yellow pigment extracts of<br />
Huaimi were prepared, <strong>and</strong> then spectrophotometric<br />
methods were applied to analyse its chemical stabilities<br />
related with pH value, temperature <strong>and</strong> metallic ions.<br />
The purpose was to explore the potential usage of this<br />
species as a source of yellow pigment <strong>and</strong> underst<strong>and</strong><br />
the conditions affecting its stabilities.<br />
Materials <strong>and</strong> methods<br />
Materials<br />
Huaimi, the dry flower bud of S. japonica L., was<br />
gathered from Jiangxi Province in southern China <strong>and</strong><br />
stored at 4 °C for analysis. Rutin was purchased from<br />
Shanghai Chemical Corporation, Shanghai, China.<br />
HPLC-grade methanol <strong>and</strong> phosphoric acid were purchased<br />
from Sinopharm Chemical Reagent Co., Ltd,<br />
Shanghai, China.<br />
Preparation of Huaimi yellow pigment extracts (HYPE)<br />
To extract pigments, Huaimi powder of fifty meshes<br />
sieve was immersed into a binary solvent (ethanol–<br />
water, 3:2, v ⁄ v) with a twenty-fold powder weight for<br />
2 h at 85 °C. Extracted fluid was filtrated through a<br />
Whatman No.1 filter paper, <strong>and</strong> then the filtrate was<br />
precipitated by centrifugation at 10000 · g for 10 min.<br />
The supernatant was transferred into an evaporating<br />
flask <strong>and</strong> evaporated under vacuum at 40 °C in a rotary<br />
evaporator (Shanghai Ailang Instruments Co., Ltd.,<br />
Shanghai, China). The condensate was taken out for<br />
freeze drying (Beijing DETIANYOU Technology<br />
Development Co., Ltd., Beijing, China) at
1668<br />
Chemical stability of Huami yellow pigment W. Chen et al.<br />
evaporation loss on absorbance. The thermal stability of<br />
HYPE solution was evaluated by calculating S, which<br />
was the apparent value weighing the thermal stability of<br />
HYPE solutions, by following eqn 1.<br />
S ¼ A<br />
A0<br />
ð1Þ<br />
Where A was the absorbance of HYPE solution at<br />
detecting wavelength after heat treatment, given as<br />
average value; A0 was the absorbance of HYPE solution<br />
at detecting wavelength without heat treatment at room<br />
temperature.<br />
Linear regression analysis was used to obtain the<br />
degradation rate constant (k) for all samples. The<br />
dependence of reaction rate constants on temperature<br />
was modelled using the exponential equation.<br />
k ¼ k0 expðaTÞ ð2Þ<br />
Where k 0, a is the coefficient of exponential equation; T<br />
is the treatment temperature, °C.<br />
Metallic ions effect on stability of HYPE<br />
Metallic salts, including aluminium nitrate, potassium<br />
chloride, magnesium sulphate, manganese sulphate,<br />
copper sulphate, ferric trichloride, calcium chloride<br />
<strong>and</strong> sodium chloride, were added to HYPE solutions,<br />
respectively. Concentration of these metallic ions solutions<br />
ranged from 1.0 · 10 )5 to 1.0 · 10 )2 m. HYPE<br />
solutions were placed in dark area at room temperature<br />
for 24 h. Then, the UV–VIS spectra of HYPE solutions<br />
were scanned to analyse the effect of metallic ions on the<br />
absorbance <strong>and</strong> colour variations.<br />
Results <strong>and</strong> discussion<br />
UV–VIS spectrum of HYPE<br />
UV–VIS spectrum of HYPE exhibited two major<br />
absorption b<strong>and</strong>s in the UV region (Fig. 1), the same<br />
as that of most flavonoids components (Botelho et al.,<br />
2007). One absorption peak was at about 265 nm, called<br />
Peak I. The other absorption peak was about at 360 nm,<br />
called Peak II. The maximum absorbent wavelength at<br />
360 nm could be chosen for HYPE stability studies.<br />
UV–VIS spectrophotometry was based on Lambert–<br />
Beer Law. In the visible wavelength range, the content<br />
of pigments is highly correlated with the absorption at<br />
the specific wavelengths (Pflanz & Zude, 2008). Linear<br />
regression equation of HYPE solution between A360 nm<br />
<strong>and</strong> c (mg mL )1 ) was A360 nm = 15.416 c + 0.008, <strong>and</strong><br />
correlation coefficient R 2 was 0.9997. It indicated that<br />
the relationship between solution absorbance (A360 nm)<br />
<strong>and</strong> concentration (c, mgmL )1 ) was linear from 0.01 to<br />
Figure 1 Room temperature absorbance UV–VIS spectra of HYPE<br />
solutions at different concentrations (mg mL )1 ).<br />
0.1 mg mL )1 . Thus, HYPE solution at concentration of<br />
0.05 mg mL )1 was chosen for further stability studies.<br />
Rutin content of HYPE<br />
According to the previous reports (Paniwnyk et al.,<br />
2001; Qi et al., 2007; Xu et al., 2007), Huaimi had a high<br />
content of rutin <strong>and</strong> was used as plant material for rutin<br />
source. To measure rutin content, HPLC analysis was<br />
applied for quantitative determination. The analysis of<br />
rutin st<strong>and</strong>ard showed that its retention time was<br />
4.9 min. The relationship between peak area (y, lmÆs)<br />
<strong>and</strong> rutin content (x, lg) was linear from 0.4 to 1.5 lg,<br />
with regression equation y =2· 10 6 x ) 27733 <strong>and</strong><br />
correlation coefficient R 2 = 0.9991 (n = 5). According<br />
to this equation, the content of rutin in HYPE was<br />
measured to be 42.56%. The result indicated that rutin<br />
was major component in HYPE.<br />
Rutin, sometimes known as Vitamin P, is a kind of<br />
flavonoid glycoside compound. It has many bioactive<br />
functions, such as antiplatelet, antiviral <strong>and</strong> antihypertensive,<br />
especially with high radical scavenging activity<br />
<strong>and</strong> antioxidant capacity (Guo et al., 2007; Yang et al.,<br />
2008). Now, it has been widely used in medical fields<br />
(De oliveira et al., 2006; Yang et al., 2008).<br />
On the other h<strong>and</strong>, consumer’s awareness of health<br />
maintenance increases progressively. Latest processed<br />
foods, containing natural bioactive ingredients, gain<br />
more <strong>and</strong> more favour than those without such ingredients<br />
(Gouveia et al., 2007). So there has reason to<br />
believe that HYPE will have extensive applied prospects<br />
in food pigment industry.<br />
Influence of pH on stability of HYPE<br />
Effect of pH on HYPE stability was studied at different<br />
pH values, ranged from 2.0 to 9.0 (Fig. 2). When pH<br />
International Journal of Food Science <strong>and</strong> Technology 2010 Ó 2010 The Authors. Journal compilation Ó 2010 Institute of Food Science <strong>and</strong> Technology
Figure 2 Effect of pH value on UV–VIS absorbance spectra of HYPE<br />
at concentration of 0.05 mg mL )1 .<br />
values ranged from 6.0 to 2.0, the intensity of absorbance<br />
at both Peak I <strong>and</strong> Peak II increased slowly.<br />
During this process, Peak I occurred hypsochromic shift<br />
from 265 to 254 nm, while Peak II was unchanged. The<br />
colour of HYPE solution remained yellow at pH from<br />
2.0 to 6.0.<br />
When pH values ranged from 7.0 to 9.0, the<br />
intensity of absorbance at both Peak I <strong>and</strong> Peak II<br />
increased greatly, <strong>and</strong> Peak II was bathochromic shift<br />
from 360 to 404 nm. Meanwhile, the colour of HYPE<br />
solution became brighter yellow when pH value was<br />
over 7.0.<br />
This phenomenon may be attributed to the structural<br />
transformation of HYPE. Flavonoids compounds were<br />
main components of HYPE obtained from HPLC <strong>and</strong><br />
UV–VIS spectrophotometry analysis. To explain this<br />
phenomenon, rutin could be taken as a representative<br />
component for illustration.<br />
It was known that rutin changed into chalcone in<br />
alkaline condition, <strong>and</strong> chalcone contributed to yellow<br />
colour <strong>and</strong> bathochromic shift (Fig. 3). With the<br />
Figure 3 Structural transformation of rutin<br />
at different environmental conditions.<br />
(a) Rutin, (b) chalcone, (c) metal<br />
complexation, where R was rutinoside,<br />
M n+ was polyvalent metal ion.<br />
increasing of pH value, rutin mostly changed into<br />
chalcone, <strong>and</strong> the content of chalcone increased, so<br />
yellow colour of HYPE solution became brighter<br />
(Castaneda-ov<strong>and</strong>o et al., 2009).<br />
Thermal stability of HYPE<br />
Relationship between thermal stability <strong>and</strong> temperature<br />
showed that the thermal degradation of HYPE at<br />
concentration of 0.05 mg mL )1 was in lined with firstorder<br />
reaction kinetics (Lopez-malo & Palou, 2008)<br />
(Fig. 4). Mathematical models <strong>and</strong> correlation coefficients<br />
R 2 were S =e )0.0033t (n =7,R 2 = 0.9975) for<br />
50 °C, S =e )0.0062t (n =7, R 2 = 0.9933) for 60 °C,<br />
S =e )0.011t<br />
(n =7, R 2 = 0.9879) for 70 °C, S =<br />
e )0.0183t (n =7,R 2 = 0.9849) for 80 °C, S =e )0.0273t<br />
(n =7,R 2 = 0.9708) for 90 °C (t: time stood for heat<br />
treatment, hours), respectively.<br />
The value of degradation rate k was an exponential<br />
increase with the temperature, which can be fitted<br />
into the exponential equation (eqn 2). The formula<br />
<strong>and</strong> correlation coefficient was k = 0.0002e 0.0531T<br />
(n =5, R 2 = 0.9929). The tendency of the formula<br />
shows that the rate of this reaction was not strongly<br />
temperature dependent within treatment temperature. It<br />
indicated that HYPE had good thermal stability within<br />
treatment temperature.<br />
As a result, mathematical model between S, time<br />
(t, hours), temperature (T, °C) was deduced as S ¼<br />
e ð0:0002e0:0531T Þt . According to this mathematical model,<br />
thermal evolution of HYPE was simulated (Fig. 5). The<br />
half-life of HYPE solution was calculated by following<br />
formula.<br />
t ¼ 3465:74<br />
e0:0531T Here, t represented half-life of HYPE solution at<br />
concentration of 0.05 mg mL )1 , hours; T was the temperature<br />
of HYPE solution, used for heat treatment, °C.<br />
Half-life of HYPE solution was forecast to be 918.9 h<br />
at room temperature.<br />
(a) (b)<br />
Chemical stability of Huami yellow pigment W. Chen et al. 1669<br />
Ó 2010 The Authors. Journal compilation Ó 2010 Institute of Food Science <strong>and</strong> Technology International Journal of Food Science <strong>and</strong> Technology 2010<br />
(c)
1670<br />
Chemical stability of Huami yellow pigment W. Chen et al.<br />
Figure 4 Thermal stability of Huaimi yellow pigment extract solutions<br />
at concentration of 0.05 mg mL )1 (S = A ⁄ A0, absorbance retention;<br />
LnS, natural logarithm of S).<br />
Influence of metallic ions on stability of HYPE<br />
The influence of metallic ions on stability of HYPE<br />
varied with the types of metallic ions. Metallic ions,<br />
including Na + , K + , Ca 2+ , Mg 2+ <strong>and</strong> Mn 2+ , all at<br />
concentration of 1.0 · 10 )2 m, almost had no effects on<br />
UV–VIS spectra <strong>and</strong> colour variations of HYPE solutions<br />
(Fig. 6).<br />
However, metallic ions, such as Al 3+ , Cu 2+ <strong>and</strong><br />
Fe 3+ , at different concentrations had obvious effects on<br />
the UV–VIS spectra <strong>and</strong> colour variations of HYPE<br />
solutions. Al 3+ <strong>and</strong> Cu 2+ had similar effect on stability<br />
of HYPE (Figs 7 <strong>and</strong> 8). When the concentration of<br />
Al 3+ <strong>and</strong> Cu 2+ increased from 10 )5 to 10 )2 m, Peak II<br />
in UV–VIS spectra of HYPE solutions (at concentration<br />
of 0.05 mg mL )1 ) occurred bathochromic shift from 360<br />
to 406 nm <strong>and</strong> 409 nm, respectively, <strong>and</strong> the colour of<br />
HYPE solution became brighter. UV–VIS spectrum<br />
of HYPE no longer changed when ion concentration of<br />
Al 3+ <strong>and</strong> Cu 2+ reached to 10 )5 m.<br />
Effect of Fe 3+ on HYPE solution was not similar to<br />
that of Al 3+ <strong>and</strong> Cu 2+ (Fig. 9). With the increase in the<br />
concentration of Fe 3+ , absorbance at 360 nm of HYPE<br />
increased correspondingly. When concentration of Fe 3+<br />
reached to 10 )3 m, absorption curve of HYPE was not<br />
smooth again, <strong>and</strong> the maximum absorption wavelength<br />
occurred hypsochromic shift. The colour of HYPE<br />
solution became to brown obviously.<br />
Effects of metallic ions on stability of HYPE could be<br />
contributed to co-pigmentation effect. Co-pigmentation<br />
effect is a common phenomenon between pigments <strong>and</strong><br />
other colourless organic compounds, or metallic ions.<br />
This interaction formed new molecular complex by<br />
chemical bond transforming <strong>and</strong> then enhanced the<br />
colour of pigment (Gris et al., 2007; Castaneda-ov<strong>and</strong>o<br />
et al., 2009). In food science, this phenomenon is<br />
considered as a very important interaction because the<br />
colour of a product is one of the main crucial quality<br />
factors for product’s acceptance (Eiro & Heinonen,<br />
2002). Some chemical groups, such as O-dihydroxy,<br />
which had metal chelating affinity, could form metal<br />
complex. Co-pigmentation between HYPE <strong>and</strong> metallic<br />
ions could be ascribed to this interaction (Fig. 3). At this<br />
condition, there was a change of the spectral characteristics<br />
of pigment molecules because of formation of the<br />
Figure 5 Simulation of thermal evolution of<br />
Huaimi yellow pigment extract (HYPE)<br />
solutions at concentration of 0.05 mg mL )1<br />
(S: absorbance retention, weighing the<br />
thermal stability of HYPE solutions).<br />
International Journal of Food Science <strong>and</strong> Technology 2010 Ó 2010 The Authors. Journal compilation Ó 2010 Institute of Food Science <strong>and</strong> Technology
Figure 6 UV–VIS absorbance spectra of Huaimi yellow pigment<br />
extract solutions (0.05 mg mL )1 ) with all metallic ion (Na + ,K + ,<br />
Ca 2+ ,Mg 2+ <strong>and</strong> Mn 2+ included) concentration at 10 )2 m.<br />
Figure 7 UV–VIS absorbance spectra of Huaimi yellow pigment<br />
extract solutions (0.05 mg mL )1 ) with Al 3+ ion at different<br />
concentrations. Figure 9 UV–VIS absorbance spectra of Huaimi yellow pigment<br />
extract solutions (0.05 mg mL )1 ) with Fe 3+ ion at different concen-<br />
p–p* complex. The change influenced absorption intensity<br />
(hyperchromic effect) <strong>and</strong> wavelength (bathochromic<br />
shift) of HYPE. At the same time, the yellow colour<br />
of HYPE became brighter (Gris et al., 2007).<br />
Co-pigmentation caused by metals is sometimes<br />
beneficial for the maintenance <strong>and</strong> increment of colour<br />
of pigments in food pigment industry, particularly when<br />
these metals are not harmful to people’s health, <strong>and</strong><br />
some of them are even essential minerals in human diet.<br />
Conclusions<br />
In this paper, chemical stability of HYPE from a kind of<br />
traditional Chinese herb <strong>and</strong> folk pigment material was<br />
studied systematically for the first time. HYPE displays<br />
perfect chemical stability. Results are consistent with its<br />
trations.<br />
Chemical stability of Huami yellow pigment W. Chen et al. 1671<br />
Figure 8 UV–VIS absorbance spectra of Huaimi yellow pigment<br />
extract solutions (0.05 mg mL )1 ) with Cu 2+ ion at different<br />
concentrations.<br />
widespread usage in Chinese folk. The reason for<br />
widespread usage of Huaimi as a stable yellow pigment<br />
material in China could be explained in theory. In<br />
southern China, local residents usually added Huaimi<br />
into some traditional food to achieve brighter yellow.<br />
Some even added plant ash to obtain the same effect. This<br />
is a co-pigmentation phenomenon because plant ash<br />
contains potash, a kind of alkaline agent. The main<br />
components of HYPE belong to a large group of<br />
flavonoids compounds, especially the content of rutin<br />
in it is nearly 42.56%, which was in agreement with<br />
previous reports (Paniwnyk et al., 2001; Qi et al., 2007).<br />
Its chemical stability primarily depends on these compounds.<br />
On the other h<strong>and</strong>, flavonoids compounds are<br />
Ó 2010 The Authors. Journal compilation Ó 2010 Institute of Food Science <strong>and</strong> Technology International Journal of Food Science <strong>and</strong> Technology 2010
1672<br />
Chemical stability of Huami yellow pigment W. Chen et al.<br />
currently used as antioxidants in food industry, <strong>and</strong> it will<br />
undoubtedly promote the application of HYPE in future.<br />
Acknowledgments<br />
We thank Professor Chen Fusheng from Huazhong<br />
Agricultural University for his constructive advice on<br />
experimental design of this study <strong>and</strong> Dr Zhou Youxiang<br />
from Hubei Academies of Agricultural Sciences in<br />
China for his aid to HPLC analysis. This work was<br />
supported by Undergraduate Technology Innovation<br />
Fund of Huazhong Agricultural University (No<br />
A07071).<br />
References<br />
Botelho, F.V., Alvarez-leite, J.I., Lemos, V.S. et al. (2007). Physicochemical<br />
study of floranol, its copper(II) <strong>and</strong> iron(III) complexes,<br />
<strong>and</strong> their inhibitory effect on LDL oxidation. Journal of Inorganic<br />
Biochemistry, 101, 935–943.<br />
Cai, Y.Z., Sun, M. & Corke, H. (2003). Antioxidant activity of<br />
betalains from plants of the Amaranthaceae. Journal of Agricultural<br />
<strong>and</strong> Food Chemistry, 51, 2288–2294.<br />
Castaneda-ov<strong>and</strong>o, A., Pacheco-hern<strong>and</strong>ez, M.D., Paez-hern<strong>and</strong>ez,<br />
M.E., Rodriguez, J.A. & Galan-vidal, C.A. (2009). Chemical studies<br />
of anthocyanins: a review. Food Chemistry, 113, 859–871.<br />
De oliveira, I.R.W.Z., Fern<strong>and</strong>es, S.C. & Vieira, I.C. (2006). Development<br />
of a biosensor based on gilo peroxidase immobilized on<br />
chitosan chemically crosslinked with epichlorohydrin for determination<br />
of rutin. Journal of Pharmaceutical <strong>and</strong> Biomedical Analysis,<br />
41, 366–372.<br />
Dufosse, L. & Pintea, A. (2005). Pigments in food, more than colours.<br />
Trends in Food Science & Technology, 16, 368–369.<br />
Eiro, M.J. & Heinonen, M. (2002). Anthocyanin color behavior <strong>and</strong><br />
stability during storage: effect of intermolecular copigmentation.<br />
Journal of Agricultural <strong>and</strong> Food Chemistry, 50, 7461–7466.<br />
El gharras, H., Hasib, A., Jaouad, A., El-bouadili, A. & Schoefs, B.<br />
(2008). Stability of vacuolar betaxanthin pigments in juices from<br />
Moroccan yellow Opuntia ficus indica fruits. International Journal of<br />
Food Science <strong>and</strong> Technology, 43, 351–356.<br />
Galvano, F., La fauci, L., Lazzarino, G. et al. (2004). Cyanidins:<br />
metabolism <strong>and</strong> biological properties. Journal of Nutritional Biochemistry,<br />
15, 2–11.<br />
Gouveia, L., Nobre, B.P., Marcelo, F.M. et al. (2007). Functional<br />
food oil coloured by pigments extracted from microalgae with<br />
supercritical CO2. Food Chemistry, 101, 717–723.<br />
Gris, E.F., Ferreira, E.A., Falcao, L.D. & Bordignon-luiz, M.T.<br />
(2007). Caffeic acid copigmentation of anthocyanins from Cabernet<br />
Sauvignon grape extracts in model systems. Food Chemistry, 100,<br />
1289–1296.<br />
Guo, R., Wei, P. & Liu, W.Y. (2007). Combined antioxidant effects of<br />
rutin <strong>and</strong> vitamin C in Triton X-100 micelles. Journal of Pharmaceutical<br />
<strong>and</strong> Biomedical Analysis, 43, 1580–1586.<br />
Hurtado, N.H., Morales, A.L., Gonzalez-miret, M.L., Escudero-gilete,<br />
M.L. & Heredia, F.J. (2009). Colour, pH stability <strong>and</strong> antioxidant<br />
activity of anthocyanin rutinosides isolated from tamarillo fruit<br />
(Solanum betaceum Cav.). Food Chemistry, 117, 88–93.<br />
Kite, G.C., Stoneham, C.A. & Veitch, N.C. (2007). Flavonol<br />
tetraglycosides <strong>and</strong> other constituents from leaves of Styphnolobium<br />
japonicum (Leguminosae) <strong>and</strong> related taxa. Phytochemistry, 68,<br />
1407–1416.<br />
Lo, Y.H., Lin, R.D., Lin, Y.P., Liu, Y.L. & Lee, M.H. (2009). Active<br />
constituents from Sophora japonica exhibiting cellular tyrosinase<br />
inhibition in human epidermal melanocytes. Journal of Ethnopharmacology,<br />
124, 625–629.<br />
Lopez-malo, A. & Palou, E. (2008). Storage stability of pineapple slices<br />
preserved by combined methods. International Journal of Food<br />
Science <strong>and</strong> Technology, 43, 289–295.<br />
Lu, Y.H., Liu, Z.Y., Wang, Z.T. & Wei, D.Z. (2006). Quality<br />
evaluation of Platycladus orientalis (L.) Franco through simultaneous<br />
determination of four bioactive flavonoids by high-performance<br />
liquid chromatography. Journal of Pharmaceutical <strong>and</strong><br />
Biomedical Analysis, 41, 1186–1190.<br />
Paniwnyk, L., Beaufoy, E., Lorimer, J.P. & Mason, T.J. (2001). The<br />
extraction of rutin from flower buds of Sophora japonica. Ultasonics<br />
Sonochemistry, 8, 299–301.<br />
Pflanz, M. & Zude, M. (2008). Spectrophotometric analyses of<br />
chlorophyll <strong>and</strong> single carotenoids during fruit development of<br />
tomato (Solanum lycopersicum L.) by means of iterative multiple<br />
linear regression analysis. Applied Optics, 47, 5961–5970.<br />
Qi, Y.Y., Sun, A.L., Liu, R.M., Meng, Z.L. & Xie, H.Y. (2007).<br />
Isolation <strong>and</strong> purification of flavonoid <strong>and</strong> isoflavonoid compounds<br />
from the pericarp of Sophora japonica L. by adsorption chromatography<br />
on 12% cross-linked agarose gel media. Journal of<br />
Chromatography A, 1140, 219–224.<br />
Stintzing, F.C. & Carle, R. (2004). Functional properties of anthocyanins<br />
<strong>and</strong> betalains in plants, food, <strong>and</strong> in human nutrition. Trends<br />
in Food Science & Technology, 15, 19–38.<br />
Wang, Z.L., Sun, J.Y., Wang, D.N., Xie, Y.H., Wang, S.W. & Zhao,<br />
W.M. (2006). Pharmacological studies of the large-scaled purified<br />
genistein from Huaijiao (Sophora japonica-Leguminosae) on antiosteoporosis.<br />
Phytomedicine, 13, 718–723.<br />
Xu, J.J., Zhang, H.Y. & Chen, G. (2007). Carbon nanotube ⁄ polystyrene<br />
composite electrode for microchip electrophoretic determination<br />
of rutin <strong>and</strong> quercetin in Flos Sophorae Immaturus. Talanta,<br />
73, 932–937.<br />
Yang, J.X., Guo, J. & Yuan, J.F. (2008). In vitro antioxidant<br />
properties of rutin. Lwt-Food Science <strong>and</strong> Technology, 41, 1060–<br />
1066.<br />
Zude, M., Spinelli, L. & Torricelli, A. (2008). Approach for nondestructive<br />
pigment analysis in model liquids <strong>and</strong> carrots by means<br />
of time-of-flight <strong>and</strong> multi-wavelength remittance readings. Analytica<br />
Chimica Acta, 623, 204–212.<br />
International Journal of Food Science <strong>and</strong> Technology 2010 Ó 2010 The Authors. Journal compilation Ó 2010 Institute of Food Science <strong>and</strong> Technology
International Journal of Food Science <strong>and</strong> Technology 2010, 45, 1673–1681 1673<br />
Original article<br />
ATR-FTIR spectroscopy <strong>and</strong> chemometric analysis applied to<br />
discrimination of l<strong>and</strong>race maize flours produced in southern Brazil<br />
Shirley Kuhnen, 1 Juliana Bernardi Ogliari, 2 Paulo Fern<strong>and</strong>o Dias, 3 Elisangela Fabiana Boffo, 4 Isabel Correia, 5<br />
Antônio Gilberto Ferreira, 4 Ivonne Delgadillo 5 & Marcelo Maraschin 3 *<br />
1 Laboratory of Biochemistry, Department of Chemistry – Federal University of Mato Grosso, 78060-900, Cuiabá-MT, Brazil<br />
2 Laboratory of Researches in Agrobiodiversity, Department of Plant Science – Federal University of Santa Catarina, PO Box 476, 88049-900,<br />
Floriano´polis-SC, Brazil<br />
3 Department of Zootechny <strong>and</strong> Rural Development Federal University of Santa Catarina, PO Box 476, 88049-900, Florianœpolis-SC, Brazil<br />
4 Laboratory of Nuclear Magnetic Resonance, Department of Chemistry, Federal University of Sa˜ o Carlos, PO Box 676, 13565-905, São Carlos-<br />
SP, Brazil<br />
5 Department of Chemistry, University of Aveiro, 3810-193 Aveiro, Portugal<br />
(Received 21 October 2009; Accepted in revised form 20 May 2010)<br />
Summary This work aims at discriminating flours of 26 maize l<strong>and</strong>races from southern Brazil, by using the Attenuated<br />
Total Reflection Fourier Transform Infrared (ATR-FTIR) spectroscopy <strong>and</strong> chemometrics (principal<br />
components analysis – PCA). PCA applied to the FTIR spectra in the 3-600 (whole spectrum) <strong>and</strong> 1650–<br />
1500 cm )1 (fingerprint region of proteins) spectral windows clearly discriminated the Amarelão l<strong>and</strong>race.<br />
Quantitative <strong>and</strong> semi-qualitative analysis of proteins showed a wide range among the fractions, mainly of<br />
prolamine (13.47–28.43 g Kg )1 ) <strong>and</strong> glutelin (5.57–30.98 g Kg )1 ) contents. Pixurum 6, Pixurum 5, <strong>and</strong><br />
MPA1 l<strong>and</strong>races are of superior nutritional value for their albumin, globulin, <strong>and</strong> glutelin contents. PCA of<br />
the spectral dataset in the fingerprint region to carbohydrates (1200–950 <strong>and</strong> 1065–950 cm )1 ) also including<br />
commercial st<strong>and</strong>ards of amylose <strong>and</strong> amylopectin was able in separating the Moroti genotype, which<br />
grouped with the amylopectin st<strong>and</strong>ard. Thus, ATR-FTIR <strong>and</strong> PCA showed to be useful tools for the quick<br />
screening <strong>and</strong> discrimination of maize with distinct chemical composition.<br />
Keywords Amylopectin, amylose, ATR-FTIR spectroscopy, maize l<strong>and</strong>races, protein.<br />
Introduction<br />
Maize is one of the most important crop plants in the<br />
world. Most of this cereal produced worldwide is used as<br />
animal feed, although an important amount is also used<br />
in human diet, seeds, <strong>and</strong> for industrial purposes,<br />
providing raw material for the production of various<br />
kinds of food, pharmaceuticals, <strong>and</strong> cosmetics. The<br />
diversity of applications of that cereal depends on the<br />
differences in relative chemical composition, e.g. protein,<br />
oil, <strong>and</strong> starch contents in maize grains, traits that<br />
show prominent genetic components (White, 2001; Baye<br />
et al., 2006).<br />
Maize was domesticated in the highl<strong>and</strong>s of Mexico<br />
about 10 000 years ago <strong>and</strong> subsequently spread to<br />
North <strong>and</strong> South America (Freitas et al., 2003). Over<br />
the last centuries, farmers have created thous<strong>and</strong>s of<br />
*Correspondent: Tel: +55 48 3721 5328; Fax: +55 48 3721 5335;<br />
e-mail: m2@cca.ufsc.br<br />
doi:10.1111/j.1365-2621.2010.02313.x<br />
Ó 2010 The Authors. Journal compilation Ó 2010 Institute of Food Science <strong>and</strong> Technology<br />
maize varieties suitable for cultivation in numerous<br />
environments. Accordingly, it seems consensual that the<br />
maize l<strong>and</strong>races’ phenotypes, e.g., morphological <strong>and</strong><br />
agronomic traits <strong>and</strong> special chemical characteristics of<br />
grains are resultant of the domestication process.<br />
However, nowadays very few of the world’s maize<br />
germplasm consist of local varieties (l<strong>and</strong>races), showing<br />
the genetic vulnerability of that species.<br />
In some regions of the world, small farmers still<br />
cultivate maize varieties named locally creoles or l<strong>and</strong>races,<br />
also generating new varieties. This way, they are<br />
contributing to maintain the maize’s genetic diversity,<br />
preserving genetical ⁄ phenotypical traits that could be<br />
useful in yet unforeseen circumstances (Zeven, 1998).<br />
Therefore, it is important to provide efforts to assess the<br />
l<strong>and</strong>race germplasm aiming at identifying traits such as<br />
agronomic yield, disease <strong>and</strong> insect resistance, <strong>and</strong><br />
value-added characteristics that could be incorporated<br />
into breeding programs, for instance. In the western<br />
region of the Santa Catarina State, southern Brazil
1674<br />
ATR-FTIR analysis of l<strong>and</strong>race maize flours S. Kuhnen et al.<br />
(Anchieta, Guaraciaba, <strong>and</strong> Novo Horizonte counties,<br />
e.g.), maize varieties with special agronomic <strong>and</strong> nutritional<br />
traits have been developed <strong>and</strong> cultivated by small<br />
farmers over the last decades. In those counties,<br />
Approximately 41% of the small rural establishments<br />
cultivate l<strong>and</strong>race genotypes, with a prominent use as<br />
human food (Canci et al., 2004).<br />
FTIR is a physicochemical method that measures the<br />
vibrations of bonds within functional groups <strong>and</strong><br />
generates a spectrum that can be regarded as a metabolic<br />
fingerprint. It is a flexible method that can quickly<br />
provide qualitative <strong>and</strong> quantitative information with<br />
minimal or no sample preparation of complex biological<br />
matrices (Ferreira et al., 2001). Infrared (IR) was used<br />
in the past years to study amylose, amylopectin, <strong>and</strong><br />
starch, providing information on e.g., chain folding <strong>and</strong><br />
the ratio of ordered to amorphous fractions (van Soest<br />
et al., 1995; Sevenou et al., 2002), maize seed composition<br />
(Baye et al., 2006), <strong>and</strong> carotenoid content in maize<br />
genotypes (Berardo et al., 2004).<br />
A FTIR spectrum is complex, containing many<br />
variables per sample <strong>and</strong> making visual analysis very<br />
difficult. Hence, to extract useful information from the<br />
whole spectra, multivariate data analysis is needed,<br />
particularly through the determination of the principal<br />
components (PCA) (Fukusaki & Kobayashi, 2005).<br />
Such a multivariate analysis technique could allow the<br />
characterisation of the sample relationships (scores<br />
plans or axis) <strong>and</strong> the recovery of their subspectral<br />
profiles (loadings). This approach has been applied to<br />
classify maize starches (modified or not) <strong>and</strong> for<br />
quantification of sugars in mango juices as a function<br />
of ripening (Dupuy et al., 1997; Duarte et al., 2002) as<br />
well as for discriminating olive pulp-cell wall polysaccharide<br />
extracts of pectic or hemicellulosic origin<br />
(Coimbra et al., 1999).<br />
The goal of this study was to apply ATR-FTIR<br />
spectroscopy <strong>and</strong> chemometric analysis to discriminate<br />
flour samples produced from whole maize grains of<br />
twenty-six l<strong>and</strong>races developed <strong>and</strong> cultivated in southern<br />
Brazil. To perform that, we first identified the main<br />
wavenumbers of FTIR spectra that characterise those<br />
raw materials, followed by a more detailed analysis to<br />
distinguish them, focusing on the fingerprint region of<br />
specific classes of compounds. Taking into consideration<br />
the wide genetic variability of the maize l<strong>and</strong>races in<br />
study, it was hypothesised that a meaningful variation in<br />
chemical traits in flour samples derived from their<br />
(multi)coloured grains is thought to be found.<br />
Materials <strong>and</strong> methods<br />
Maize varieties<br />
Samples of grains of maize l<strong>and</strong>races (n = 26, 2004)<br />
cultured under agro-ecological management by small<br />
farmers in the far-west region of Santa Catarina State<br />
(Anchieta county – 26°31¢11¢’S, 53°20¢26¢’W), southern<br />
Brazil, were donated by a local small farmer association<br />
(SINTRAF) to the Agro-Biodiversity Study Nucleus<br />
(Federal University of Santa Catarina). Table S1 shows<br />
the main agronomic traits of the genotypes in study<br />
(Canci et al., 2004).<br />
This study was carried out in accordance with the<br />
current Brazilian legislation on biodiversity usage<br />
(Genetic Heritage Management Council – Provisional<br />
Act 2.186-16, August 23, 2001) <strong>and</strong> is part of an<br />
agreement involving small farmer communities of Santa<br />
Catarina State <strong>and</strong> the Federal University of Santa<br />
Catarina.<br />
Sample preparation<br />
Maize grain samples (50 g, dry weight, 13% humidity)<br />
were milled using Cyclone Sample Mill, Udy Corporation,<br />
Fort Collins, CO, USA (3010 ⁄ 019 model) with a<br />
1-mm sieve <strong>and</strong> stored in polypropylene bottles<br />
at )20 °C. Prior to collecting the spectra, the maize<br />
flours (5 g) <strong>and</strong> commercial st<strong>and</strong>ards of amylose (Sigma<br />
Chemical Co, St. Louis, MO, USA) <strong>and</strong> amylopectin<br />
(Fluka Chemical Co., St. Louis, MO, USA) were<br />
lyophilised <strong>and</strong> kept over phosphorous pentoxide until<br />
further spectroscopic analysis.<br />
ATR-FTIR spectroscopy <strong>and</strong> chemometrics<br />
The theory of ATR was previously discussed by<br />
Harrick (1967). In ATR mode, an IR beam traverses<br />
a prism so that it is internally reflected from the back<br />
of the prism, which is in contact with the sample. The<br />
conditions for total internal reflection occur only when<br />
sin hi ⁄ n2 ⁄ n1, withhithe angle of incidence on the back<br />
of the prism, n1 the index of refraction of the prism<br />
material (diamond in this case), <strong>and</strong> n2 the index of<br />
refraction of the sample. In this situation, an evanescent<br />
wave penetrates the sample <strong>and</strong> is able to interact<br />
with the sample, just beyond the interface prismsample,<br />
leading to absorption of radiation from the<br />
beam. The intensity of the absorption depends first, on<br />
the good contact between the sample <strong>and</strong> the prism<br />
<strong>and</strong> secondly, on the depth of penetration of the<br />
evanescent wave.<br />
According to Harrick (1967), the penetration depth<br />
is directly related to the wavelength so that the larger<br />
the wavelength, the greater the penetration of the<br />
wave. For example, polysaccharides like starch absorb<br />
in the region 1200–800 cm )1 (k = approximately 8 <strong>and</strong><br />
12 lm), in an average penetration depth of approximately<br />
2 lm. Thus, attenuated total reflectance (ATR)<br />
is often considered as a surface-sensitive method<br />
because of its inherent low depth of penetration<br />
(Sevenou et al., 2002).<br />
International Journal of Food Science <strong>and</strong> Technology 2010 Ó 2010 The Authors. Journal compilation Ó 2010 Institute of Food Science <strong>and</strong> Technology
FTIR spectra of maize flours <strong>and</strong> of st<strong>and</strong>ards of<br />
amylose <strong>and</strong> amylopectin were acquired in a Bruker<br />
IFS-55 spectrometer with a DTGS detector equipped<br />
with a golden gate single reflection diamond ATR<br />
accessory (45° incidence-angle). A background spectrum<br />
of the clean crystal was acquired, <strong>and</strong> samples (100 mg)<br />
were spread <strong>and</strong> measured directly after pressing them<br />
on the crystal. The spectra were recorded at the<br />
absorbance mode from 3000 to 600 cm )1 at the resolution<br />
of 4 cm )1 . Five replicate spectra (128 co-added<br />
scans before Fourier transform) were collected for each<br />
sample, in a total of 130 spectra.<br />
Spectra were normalised, baseline-corrected in the<br />
region of interest by drawing a straight line before<br />
resolution enhancement (k factor of 1.7) was applied<br />
using Fourier self deconvolution (Opus v. 5.0, Bruker<br />
Biospin – van Soest et al., 1995; Rubens et al., 1999).<br />
The assumed line shape was Lorentzian with a half<br />
width of 19 cm )1 . IR absorbance values at 1045, 1018,<br />
<strong>and</strong> 999 cm )1 were extracted from the spectra after<br />
baseline correction <strong>and</strong> deconvolution. Intensity measurements<br />
were performed on the deconvulated spectra<br />
by recording the height of the absorbance b<strong>and</strong>s from<br />
the baseline.<br />
Chemometric analysis<br />
For purpose of chemometric analysis, normalised,<br />
baseline-corrected (3000–600 cm )1 , 1650–1550 cm )1 –<br />
proteins, 1200–950 cm )1 – carbohydrates, <strong>and</strong> 1065–<br />
950 cm )1 – amylose <strong>and</strong> amylopectin) <strong>and</strong> deconvoluted<br />
spectra were transferred via a JCAMP.DX format<br />
(OPUS v. 5.0, Bruker Biospin GmbH, Rheinstetten,<br />
Baden-Wu¨rttemberg, Germany) into the data analysis<br />
software for PCA (The Unscramble v. 9.1, CAMO<br />
Software Inc., Woodbridge, NJ, USA). Previously to<br />
PCA analysis each spectrum within the 3000–600 cm )1 ,<br />
1650–1550 cm )1 (proteins), 1200–950 cm –1 (carbohydrates),<br />
<strong>and</strong> 1065–950 cm )1 (amylose <strong>and</strong> amylopectin)<br />
regions was st<strong>and</strong>ard normal deviates corrected<br />
(Cˇ opı´kova´ et al., 2006).<br />
Protein analysis – chemical extraction<br />
The extraction of proteins from flours was performed<br />
using a sequential scheme based on the Osborne &<br />
Mendel (1914) method, modified by L<strong>and</strong>ry &<br />
Moureaux (1970). Samples (100 mg) were suspended in<br />
1 mL of extractant solution; the incubation time (min),<br />
the number of extractions performed, <strong>and</strong> the identification<br />
of protein fractions obtained are reported on<br />
Table 1. All the experiments were carried out in triplicate.<br />
The protein content of each fraction was determined<br />
according to Bradford (1976) using a st<strong>and</strong>ard<br />
curve of bovine serum albumin (BSA, globulins: 0.7–<br />
0.01 mg mL )1 – r 2 0.96, albumins: 0.1–0.01 mg mL )1 –<br />
ATR-FTIR analysis of l<strong>and</strong>race maize flours S. Kuhnen et al. 1675<br />
Table 1 Protein fraction, extractant, <strong>and</strong> incubation conditions used<br />
for the fractionated extraction of proteins of maize flours<br />
Protein fraction Extractant Incubation conditions<br />
Albumin Distilled water 4 °C, 2 times, 15 min<br />
Globulin 0.5 M NaCl 4 °C, 2 times, 30 min<br />
Zein I 55% (w ⁄ w) 2-PrOH<br />
+ 0.6% 2-ME<br />
Zein II 0.5 M NaCl + 0.6%<br />
2-ME (pH 10)<br />
Glutelin 0.5% SDS (w ⁄ v, pH 10)<br />
+ 0.6 2-ME<br />
r 2 0.99; prolamines: 1–0.01 mg mL )1 – r 2 0.94; glutelins:<br />
1–0.1 mg mL )1 – r 2 0.97).<br />
Results <strong>and</strong> discussion<br />
RT, 2 times, 30 min<br />
<strong>and</strong> 1 time, 15 min<br />
RT, 2 times, 30 min<br />
RT, 2 times, 30 min<br />
<strong>and</strong> 1 time, 15 min<br />
The samples were centrifuged at 12000 g for 5 min <strong>and</strong> the precipitated<br />
obtained used as biomass for the following extraction.<br />
2-ME: 2-mercaptoethanol; SDS, sodium dodecylsulfate; RT, room<br />
temperature.<br />
Figure S1 shows the FTIR spectra of flours for 26<br />
varieties with the majoritarian absorption peaks<br />
detected at 3000–600 cm )1 spectral window. The FTIR<br />
spectra of maize flours look very similar <strong>and</strong> this fact<br />
turns any discrimination analysis based on the chemical<br />
traits of the genotypes a hard task. Visual inspection of<br />
the FTIR spectra promptly indicated the presence of<br />
starch (1200–800 cm )1 ), lipids (2924, 2854, <strong>and</strong><br />
1740 cm )1 ), <strong>and</strong> proteins (1650–1500 cm )1 ) in all the<br />
samples, while minor differences, quantitative or structural,<br />
were difficult to detect. Accordingly, to extract<br />
maximum information of the FTIR spectra, principal<br />
component analysis (PCA) was applied to the spectroscopic<br />
dataset.<br />
Figure S2 shows a PCA scores scatter plot for flour<br />
samples using the whole FTIR spectral window<br />
dataset (3000–600 cm )1 ). The classification of flours<br />
in scores scatter plot (PC1 vs. PC2) that contains 78%<br />
of the dataset variability revealed differences in chemical<br />
composition, mainly for the Amarela˜ o 3 genotype,<br />
which was separated in PC1()) axis. Figure 1 shows<br />
the loadings plot of PC1, revealing the most important<br />
wavenumbers which explain the distinction of the<br />
samples previously found (scores scatter plot). The<br />
loadings indicated that the carbohydrates (1022, 1076,<br />
<strong>and</strong> 1149 cm )1 ), proteins (1647, 1535, <strong>and</strong> 1519 cm )1 ),<br />
<strong>and</strong> lipids (2920, 2850, <strong>and</strong> 1743 cm )1 ) can be associated<br />
to the discrimination of the maize flours<br />
observed. Both genetic <strong>and</strong> environmental effects<br />
create significant variation in the amount <strong>and</strong> quality<br />
of each of these constituents (Baye et al., 2006), but<br />
the variations on the metabolic profile of the l<strong>and</strong>race<br />
maize grains herein found reflect mainly genotypic<br />
Ó 2010 The Authors. Journal compilation Ó 2010 Institute of Food Science <strong>and</strong> Technology International Journal of Food Science <strong>and</strong> Technology 2010
1676<br />
ATR-FTIR analysis of l<strong>and</strong>race maize flours S. Kuhnen et al.<br />
differences, becausethe plants were cultivated using<br />
similar agronomic traits in the same geographic area,<br />
climate, <strong>and</strong> type of soil. In a previous study,<br />
differences on the chemical composition were detected<br />
in flours of the same maize l<strong>and</strong>races regarding the<br />
contents of proteins (8–10.3%), lipids (4.8–5.4%),<br />
starch (63–73%), <strong>and</strong> linoleic acid (43.2–50.8%)<br />
(Steinmacher et al., 2005). Besides, Kuhnen (2007)<br />
reports a clear discrimination among flour samples of<br />
whole ⁄ degermed-grains for the twenty-six maize l<strong>and</strong>races<br />
herein studied by using PCA analysis (PC1 81%<br />
vs. PC12%) of the whole FTIR dataset (3000–<br />
600 cm )1 ), with a prominent effect of the lipid<br />
components (2924, 2850, <strong>and</strong> 1743 cm )1 ) for the<br />
segregation observed.<br />
Although the whole spectra provide a good starting<br />
point for an exploratory data analysis as in a metabolic<br />
fingerprint approach, it is often necessary to analyse<br />
specific regions of the spectra to underst<strong>and</strong> the<br />
discrimination obtained by PCA. Different classes of<br />
compounds produce a complex <strong>and</strong> unique pattern in<br />
the lower region of the spectra (
Principal component analysis – Fingerprint region of<br />
carbohydrates<br />
All the spectra show absorption b<strong>and</strong>s in the 1300–<br />
800-cm )1 region which are sensitive <strong>and</strong> related to the<br />
structure of starchy polysaccharides, i.e., amylose <strong>and</strong><br />
amylopectin (van Soest et al., 1995; Rubens et al.,<br />
1999). The b<strong>and</strong>s in this region of the IR spectrum<br />
result mainly from C-O <strong>and</strong> C-C vibrational modes that<br />
are highly coupled. This coupling makes the assignment<br />
of individual b<strong>and</strong>s difficult as well as a discriminative<br />
analysis by direct inspection of the spectra. As the<br />
absorptions in this region arise largely from C–O<br />
stretchings of the ring, linkages (C–O–C) <strong>and</strong> COH<br />
groups, the positions of these b<strong>and</strong>s are similar in all<br />
carbohydrates as the associated vibrational modes are<br />
unlikely to be radically affected by polymer formation<br />
(Belton et al., 1986).<br />
The PCA analysis of the spectral data for the carbohydrate<br />
fingerprint region, i.e., 1200–850 cm )1 , was<br />
performed including the FTIR dataset of amylose <strong>and</strong><br />
amylopectin st<strong>and</strong>ards. The chemical structure <strong>and</strong> the<br />
purity of the st<strong>and</strong>ards of amylose <strong>and</strong> amylopectin were<br />
confirmed by 13 C NMR spectroscopy. The 13 C NMR<br />
spectrum of amylose typically revealed resonances at<br />
100.6 (C1), 78.8 (C4), 73.2 (C3), 72.0 (C2), 71.6 (C5), <strong>and</strong><br />
ATR-FTIR analysis of l<strong>and</strong>race maize flours S. Kuhnen et al. 1677<br />
Figure 2 Principal component analysis scores scatter plot of the FTIR dataset in the spectral window of 1650–1500 cm )1 wavenumber (fingerprint<br />
region of proteins) of l<strong>and</strong>race maize flours cultivated in the southern Brazil. PC1 · PC2 axes cross each other at the origin.<br />
60.5 ppm (C6) assigned to carbons of a-d-glucose<br />
residues. The same characteristic resonances of a-dglucose<br />
residue were detected in the 13 C NMR spectrum<br />
of amylopectin, as well as at 100.9 (C1 <strong>and</strong> C6 of<br />
branching point), 79.5 (C4 of non-reducing end group<br />
residue), <strong>and</strong> 61.0 ppm (C1 <strong>and</strong> C6 of branching point)<br />
(Qit et al., 2003). The PC1 (76%) vs. PC2 (14%) scores<br />
scatter plot (data not showed) allowed a clear segregation<br />
of the commercial st<strong>and</strong>ards of starchy polysaccharides,<br />
but a poor discrimination for the maize flours samples,<br />
except for the Moroti variety located near to the<br />
amylopectin st<strong>and</strong>ard, suggesting the predominance of<br />
that polysaccharide in relation to amylose in its starchy<br />
fraction. Besides, no variety grouped with the amylose<br />
st<strong>and</strong>ard. Our findings suggest that regarding the starch<br />
composition the maize genotypes cultivated in Anchieta<br />
county seem not to be high-amylose type (60–70%<br />
amylose). The average amylose content in normal maize<br />
is about 25%, but this value can vary (20–36%) among<br />
varieties (more details in White, 2001). Studies aiming at<br />
to determine the amylose <strong>and</strong> amylopectin contents of<br />
those maize genotypes are being performed <strong>and</strong> will be<br />
published elsewhere. The variable loadings correlated<br />
with PC1 were the b<strong>and</strong>s at 1018 <strong>and</strong> 999 cm )1 , being<br />
these wavenumbers related to the distinction of amylose<br />
<strong>and</strong> amylopectin, respectively, in maize flour samples.<br />
Ó 2010 The Authors. Journal compilation Ó 2010 Institute of Food Science <strong>and</strong> Technology International Journal of Food Science <strong>and</strong> Technology 2010
1678<br />
ATR-FTIR analysis of l<strong>and</strong>race maize flours S. Kuhnen et al.<br />
2.0<br />
1.5<br />
1.0<br />
0.5<br />
0.0<br />
1100<br />
Amylose<br />
1018 cm –1<br />
1050<br />
Branco<br />
Previous studies have shown that some IR b<strong>and</strong>s are<br />
highly sensitive to polymer conformation (Wilson &<br />
Belton, 1988). The b<strong>and</strong>s at 1047 <strong>and</strong> 1022 cm )1 are<br />
sensitive to the amount of ordered or crystalline <strong>and</strong><br />
amorphous starch, respectively (van Soest et al., 1995;<br />
Sevenou et al., 2002; Bernazzani et al., 2008). On the<br />
present work, the amylose spectrum shows the most<br />
intense b<strong>and</strong> wavenumber at 1018 cm )1 <strong>and</strong> not at<br />
1022 cm )1 . However, according to van Soest et al.<br />
(1995), the position of this b<strong>and</strong> (1022 cm )1 ) can shift<br />
towards 1015 cm )1 according to the water amouts. This<br />
observation can explain the absence of b<strong>and</strong> at<br />
1018 cm )1 in the amylopectin st<strong>and</strong>ard because the<br />
short chains of this polymer are responsible for the<br />
crystallinity of the native starch granule.<br />
The differences between the IR spectra of amylose <strong>and</strong><br />
amylopectin st<strong>and</strong>ards with respect to the b<strong>and</strong>s at 1018<br />
<strong>and</strong> 999 cm )1 , respectively, are clearly observed upon<br />
visual inspection as shown in Fig. 3. These two b<strong>and</strong>s<br />
were detected in all flour samples but with different<br />
intensities. Moroti variety spectrum showed the b<strong>and</strong> at<br />
999 cm )1 with maximum intensity, similarly to the<br />
observed in the amylopectin spectrum, reinforcing the<br />
results found in PCA analysis (1200–850 cm )1 region).<br />
The b<strong>and</strong> at 1018 cm )1 was lesser intense than the<br />
b<strong>and</strong> at 999 cm )1 for all the flour samples but for<br />
the Branco, Pixurum 6, Pixurum 5, <strong>and</strong> Pixurum 4<br />
varieties, where the two b<strong>and</strong>s showed similar intensities<br />
(Fig. 3).<br />
In the past, IR was used to study amylose, amylopectin,<br />
<strong>and</strong> starch providing insights on the ratio of<br />
ordered to amorphous fractions (van Soest et al., 1995).<br />
Thus, as a complementary approach to better characterise<br />
the polysaccharide fraction of the maize flours in<br />
study, the variation among starchy constituents was<br />
interpreted in terms of the level of ordered structure<br />
present on the edge of the flour grains. For that purpose,<br />
Pix6<br />
Amylopectin<br />
999 cm –1<br />
Moroti<br />
1000<br />
Wavenumber (cm –1 )<br />
950<br />
900<br />
Figure 3 Partial FTIR spectra (1120–880<br />
cm )1 ) of maize flours Moroti, Branco, <strong>and</strong><br />
Pixurum 6 (Pix6) varieties, commercial amylose<br />
(Sigma), <strong>and</strong> commercial amylopectin<br />
(Fluka, Sigma).<br />
the estimation of the starch crystallinity in the maize<br />
flour samples was calculated by the IR ratio 1018 ⁄<br />
999 cm )1 <strong>and</strong> 1045 ⁄ 1018 cm )1 as previously suggested<br />
Table 2 Infrared (IR) ratio of the absorbances 1018 ⁄ 999 cm )1<br />
for the flours of different maize l<strong>and</strong>races<br />
Samples<br />
IR ratio<br />
1018 ⁄ 999<br />
(cm )1 )<br />
Amylopectin 0.93<br />
Moroti 0.94<br />
Palha Roxa 2 0.97<br />
Amarelão 3 0.97<br />
Roxo 29 0.97<br />
Rosado 0.97<br />
MPA 2 0.97<br />
MPA 13 0.98<br />
Composto São Luiz 0.98<br />
Pires 0.98<br />
Rajado 8 Carreiras. 0.98<br />
Mato Grosso Palha Roxa 0.98<br />
Cateto Vermelho 0.98<br />
Cateto 0.98<br />
Roxo 41 0.98<br />
Mato Grosso 0.98<br />
Língua Papagaio 0.98<br />
MPA 1 0.98<br />
Pixurum 1 0.98<br />
Cunha 0.98<br />
Pixurum 7 0.98<br />
Pixurum 6 0.99<br />
Asteca 0.99<br />
Pixurum 4 0.99<br />
Pixurum 5 0.99<br />
Palha Roxa 18 0.99<br />
Branco 0.99<br />
Amylose 1.08<br />
International Journal of Food Science <strong>and</strong> Technology 2010 Ó 2010 The Authors. Journal compilation Ó 2010 Institute of Food Science <strong>and</strong> Technology
(Rubens et al., 1999; Sevenou et al., 2002). Intensity<br />
measurements were performed on the deconvoluted<br />
spectra by recording the heights of the absorbance<br />
b<strong>and</strong>s from the baseline. As shown on Table 2 from<br />
the IR ratio R(1018 ⁄ 999 cm )1 ), the amylose <strong>and</strong><br />
amylopectin st<strong>and</strong>ard samples were clearly distinguished<br />
together with some maize flour samples. The<br />
values of the absorbance ratios for Moroti variety<br />
(0.94) <strong>and</strong> amylopectin (0.93) were similar, whereas<br />
for Asteca, Pixurum 4, Pixurum 5, Pixurum 6, Palha<br />
Roxa 18, <strong>and</strong> mainly Branco genotypes (0.99)<br />
were related to amylose (1.08). On average, IR ratios<br />
of the absorbances 1018 ⁄ 999 cm )1 (0.98) <strong>and</strong> 1045 ⁄<br />
1018 cm )1 (0.73 – data not shown) found for the maize<br />
flours in study were identical to previously observed by<br />
Sevenou et al. (2002) for maize starch, i.e., 0.98 <strong>and</strong><br />
0.75, respectively.<br />
The ATR mode is a technique in which the IR beam<br />
penetrates into the first few micrometres (approximately<br />
2lm) of the sample (Sevenou et al., 2002). This penetration<br />
depth is smaller than the average size of the<br />
maize flour granules used, implying that the IR spectra<br />
acquired are representative of the external part of the<br />
flour granules. Thus, taking into consideration that<br />
ATR-FTIR is a surface analytical method that acquires<br />
information on the outer region of a sample <strong>and</strong> that<br />
ATR-FTIR analysis of l<strong>and</strong>race maize flours S. Kuhnen et al. 1679<br />
Figure 4 Principal component analysis scores scatter plot of the FTIR dataset in the 1065–950 cm )1 spectral window (fingerprint region of<br />
carbohydrates) of l<strong>and</strong>race maize flours <strong>and</strong> commercial st<strong>and</strong>ards of amylose <strong>and</strong> amylopectin. PC1 · PC2 axes cross each other at the origin.<br />
the study was not performed with isolated starch from<br />
the maize l<strong>and</strong>races, we assume that the differences<br />
in the IR spectra among the flour samples are not<br />
related to the organisation of the starch’s growth rings.<br />
Besides, the differences found by ATR-FTIR between<br />
the starchy components of the maize l<strong>and</strong>races flour was<br />
not related to long-range order <strong>and</strong> only related to<br />
variations in the ratio of the amounts of ordered<br />
to unordered fraction within the starchy polysaccharides<br />
in the flour granules.<br />
Finally, the principal components were calculated<br />
using FTIR data from the 1065–950 cm )1 spectral<br />
window, a lower region of the spectrum which contains<br />
only the characteristic b<strong>and</strong>s of amylopectin <strong>and</strong> amylose<br />
as shown herein. Again, a clear distinction among<br />
the flour samples <strong>and</strong> amylose st<strong>and</strong>ard emerged<br />
(Fig. 4), indicating that none of the studied samples is<br />
high-amylose type by ATR-FTIR ⁄ PCA. On the other<br />
h<strong>and</strong>, PC1 (82%) vs. PC2 (11%) showed similarity<br />
between amylopectin st<strong>and</strong>ard <strong>and</strong> the Moroti <strong>and</strong><br />
Roxo 41 varieties, suggesting the predominance of<br />
amylopectin in the constitution of their starches. In<br />
fact, a previous study showed that grains of Moroti<br />
l<strong>and</strong>race are classified into the category of farinaceous<br />
(Canci et al., 2004), while Roxo 41 was still not<br />
evaluated. The PC2 loadings of the FTIR spectral data<br />
Ó 2010 The Authors. Journal compilation Ó 2010 Institute of Food Science <strong>and</strong> Technology International Journal of Food Science <strong>and</strong> Technology 2010
1680<br />
ATR-FTIR analysis of l<strong>and</strong>race maize flours S. Kuhnen et al.<br />
matrix (data not shown) confirmed the signals at 1018<br />
<strong>and</strong> 999 cm )1 as diagnostic wavenumbers for the characterisation<br />
of amylose <strong>and</strong> amylopectin, respectively, in<br />
the studied samples. Our findings indicate that the 1065–<br />
950 cm )1 region showed itself to be more suitable to<br />
segregate starchy polysaccharides because more samples<br />
have been discriminated in this analysis when compared<br />
to 1200–850 cm )1 spectral window.<br />
In conclusion, the findings on this work reveal that the<br />
chemical diversity is present in the flour samples of<br />
maize l<strong>and</strong>races cultivated in southern region of Brazil.<br />
By using ATR ⁄ FT-IR ⁄ PCA <strong>and</strong> chemical analysis of<br />
proteins, it was detected that Amarela˜ o 3 l<strong>and</strong>race is the<br />
most diverse among genotypes. Besides, the protein<br />
analysis of the flours revealed to be of higher nutritional<br />
value the Pixurum 6, Pixurum 5, <strong>and</strong> MPA 1 l<strong>and</strong>races<br />
for containing superior amounts of globulin <strong>and</strong><br />
albumin fractions with higher contents of lysine <strong>and</strong><br />
tryptophan.<br />
The PCA analysis of the IR dataset of the fingerprint<br />
region of carbohydrates suggested that the flours of<br />
maize l<strong>and</strong>races cannot be diagnosed as high-amylose or<br />
waxy types, except for the Moroti <strong>and</strong> Roxo 41 varieties<br />
that seem to contain starch granules with superior<br />
amylopectin amount in respect to their amylose content.<br />
This finding was further confirmed regarding to the<br />
similarity of values found for the IR absorbance<br />
ratio 1018 ⁄ 999 cm )1 of the Moroti variety (0.94) <strong>and</strong><br />
amylopectin (0.93).<br />
Conclusion<br />
ATR-FTIR <strong>and</strong> PCA showed to be useful tools for the<br />
study of the local maize diversity in southern Brasil,<br />
allowing a fast screening of l<strong>and</strong>race maize flours with<br />
distinct chemical composition, i.e., amylose ⁄ amylopectin<br />
ratio <strong>and</strong> protein composition. The described<br />
method is simple, fast, <strong>and</strong> low cost, being also a<br />
powerful tool to be used in quantitative assays after its<br />
validation. Further, the identification of interesting<br />
chemical traits in flours of maize l<strong>and</strong>races as herein<br />
shown has been claimed as a strategy to address better<br />
usages to those raw materials as, for instance, components<br />
of special foods with superior nutritional ⁄ dietary<br />
quality, allowing to add value to them.<br />
Acknowledgment<br />
The authors are grateful to the small farmer association<br />
(SINTRAF) for providing the l<strong>and</strong>race maize seeds.<br />
References<br />
Baye, T.M., Pearson, T.C. & Settles, A.M. (2006). Development of a<br />
calibration to predict maize seed composition using single kernel<br />
near infrared spectroscopy. Journal of Cereal Science, 43, 236–243.<br />
Beekes, M., Lasch, P. & Naumann, D. (2007). Analytical applications<br />
of Fourier transform-infrared (FTIR) spectroscopy in microbiology<br />
<strong>and</strong> prion research. Veterinary Microbiology, 123, 305–319.<br />
Belton, P., Wilson, R.H. & Chenery, D.H. (1986). Interaction of group<br />
1 cations with iota <strong>and</strong> kappa carrageenans studied by Fourier<br />
transform infrared spectroscopy. International Journal of Biological<br />
Macromolecules, 8, 247–251.<br />
Berardo, N., Brenna, O.V., Amato, A., Valoti, P., Pisacane, V. &<br />
Motto, M. (2004). Carotenoids concentration among maize genotypes<br />
measured by near infrared reflectance spectroscopy (NIRS).<br />
Innovative Food Science <strong>and</strong> Emerging Technologies, 5, 393–398.<br />
Bernazzani, P., Peyyavula, V.K., Agarwal, S. & Tatikonda, R.K.<br />
(2008). Evaluation of the phase composition of amylose by FTIR<br />
<strong>and</strong> isothermal immersion heats. Polymer, 49, 4150–4158.<br />
Bradford, M.M. (1976). A rapid <strong>and</strong> sensitive method for the<br />
quantitation of microgram quantities of protein utilizing the<br />
principle of protein-dye binding. Analytical Biochemistry, 72, 248–<br />
254.<br />
Canci, A., Vogt, G.A. & Canci, I. (2004). A Diversidade das Espe´cies<br />
Crioulas em Anchieta-SC: Diagno´stico, Resultado de Pesquisa e<br />
Outros Apontamentos para a Conservaça˜o da Agrodiversidade. Sa˜ o<br />
Miguel do Oeste, Brasil: McLee.<br />
Coimbra, M.A., Barros, A.S., Rutledge, D.N. & Delgadillo, I. (1999).<br />
FTIR spectroscopy as a tool for the analysis of olive pulp-cell wall<br />
polysaccharide extracts. Carbohydrate Research, 317, 145–154.<br />
Cˇ opíková, J., Barros, A.S., Sˇ midová, I. et al. (2006). Influence of<br />
hydration of food additive polysaccharides on FT-IR spectra<br />
distinction. Carbohydrate Polymers, 63, 355–359.<br />
Duarte, I.F., Barros, A., Delgadillo, I., Almeida, C. & Gil, A.M.<br />
(2002). Application of FTIR spectroscopy for the quantification of<br />
sugars in mango juice as a function of ripening. Journal of<br />
Agricultural <strong>and</strong> Food Chemistry, 50, 3104–3111.<br />
Dupuy, N., Wojciechowski, C., Ta, C.D., Huvenne, J.P. & Legr<strong>and</strong>, P.<br />
(1997). Mid-infrared spectroscopy <strong>and</strong> chemometrics in corn starch<br />
classification. Journal of Molecular Structure, 410–411, 551–554.<br />
Ferreira, D., Barros, A., Coimbra, M.A. & Delgadillo, I. (2001). Use<br />
of FTIR spectroscopy to follow the effect of processing in cell wall<br />
polysaccharide extracts of a sun-dried pear. Carbohydrate Polymers,<br />
45, 175–182.<br />
Freitas, F.O., Bendel, G., Allaby, R.G. & Brown, T.A. (2003). DNA<br />
from primitive maize l<strong>and</strong>races <strong>and</strong> archaeological remains: implications<br />
for the domestication of maize <strong>and</strong> its expansion into South<br />
America. Journal of Archaeological Science, 30, 901–908.<br />
Fukusaki, E. & Kobayashi, A. (2005). Plant metabolomics: potential<br />
for practical operation. Journal of Bioscience <strong>and</strong> Bioengineering,<br />
100, 347–354.<br />
Harrick, N.J. (1967). Internal Reflection Spectroscopy. New York,<br />
USA: John Wiley & Sons Inc.<br />
Kuhnen, S. (2007). Metaboloˆmica e Bioprospecça˜o de Variedades<br />
Crioulas e Locais de Milho (Zea mays). Ph.D. Thesis, Florianópolis,<br />
Brasil: Universidade Federal de Santa Catarina.<br />
L<strong>and</strong>ry, J. & Moureaux, T. (1970). Heterogeneite des glutelines du<br />
grain de mais: extraction selective et composition em acides amines<br />
dês trois fraction isolees. Bulletin de la Societe´ Chimique Biologique,<br />
52, 1021–1037.<br />
Osborne, T.B. & Mendel, L.B. (1914). Nutritive properties of proteins<br />
of the maize kernel. The Journal of Biological Chemistry, 18, 1–6.<br />
Qit, X., Tester, R.F., Snape, C.E. & Ansell, R. (2003). Molecular basis<br />
of the gelatinisation <strong>and</strong> swelling characteristics of waxy rice<br />
starches grown in the same location during the same season. Journal<br />
of Cereal Science, 37, 363–376.<br />
Rubens, P., Snauwaert, J., Heremans, K. & Stute, R. (1999). In situ<br />
observation of pressure-induced gelation of starches studied with<br />
FTIR in the diamond anvil cell. Carbohydrate Polymers, 39, 231–<br />
235.<br />
Sevenou, O., Hill, S.E., Farhat, I.A. & Mitchell, J.R. (2002).<br />
Organisation of the external region of the starch granule as<br />
International Journal of Food Science <strong>and</strong> Technology 2010 Ó 2010 The Authors. Journal compilation Ó 2010 Institute of Food Science <strong>and</strong> Technology
determined by infrared spectroscopy. International Journal of<br />
Biological Macromolecules, 31, 79–85.<br />
van Soest, J.J.G., Tournois, H., Wit de, D. & Vliegenthart, J.F.G.<br />
(1995). Short-range structure in (partially) crystalline potato starch<br />
determined with attenuated total reflectance Fourier-transform IR<br />
spectroscopy. Carbohydrate Research, 279, 201–214.<br />
Steinmacher, N.C., Rayasduarte, P., Alves, A.C. & Francisco, A.<br />
(2005). Rheological properties of Brazilian maize l<strong>and</strong>race flours.<br />
Proceedings of the AACC Annual Meeting. Pp. 1–13. Orl<strong>and</strong>o, USA:<br />
AACC Press.<br />
Vasal, S.K. (2001). High quality protein corn, In: Specialty Corns<br />
(edited by A.R. Hallauer), Chapter 4. Pp. 85–129. Boca Raton, FL,<br />
USA: CRC Press LLC.<br />
White, P.J. (2001). Properties of corn starch, In: Specialty Corns<br />
(edited by A.R. Hallauer), Chapter 2. Pp. 29–54. Boca Raton, FL,<br />
USA: CRC Press LLC.<br />
Wilson, R.H. & Belton, P.S. (1988). A Fourier-transform infrared<br />
study of wheat starch gels. Carbohydrate Research, 180, 339–344.<br />
Zeven, A.C. (1998). L<strong>and</strong>races: a review of definitions <strong>and</strong> classifications.<br />
Euphytica, 104, 127–139.<br />
Supporting Information<br />
Additional supporting Information may be found in the<br />
online version of this article:<br />
Figure S1. ATR-FTIR spectra (3000–600 cm )1 ) of<br />
flours produced from whole grains of maize creole<br />
varieties cultivated in southern Brazil. The b<strong>and</strong>s in<br />
ATR-FTIR analysis of l<strong>and</strong>race maize flours S. Kuhnen et al. 1681<br />
between 1200 <strong>and</strong> 800 cm )1 , 1650 <strong>and</strong> 1500 cm )1 , 2924,<br />
2854, <strong>and</strong> 1740 cm )1 indicate the presence of carbohydrates,<br />
proteins, <strong>and</strong> lipids, respectively.<br />
Figure S2. Principal component analysis scores<br />
scatter plot of the FTIR spectra of maize flours in<br />
the 3000–600 cm )1 wavenumber region. The Amarela˜ o<br />
3 variety (Am3) is clearly shown to be discriminated by<br />
PC1 ()) axis. PC1 · PC2 axes cross each other at the<br />
origin.<br />
Figure S3. Percentages of the protein fractions globulin<br />
<strong>and</strong> albumin (soluble in water <strong>and</strong> saline solution),<br />
prolamines, <strong>and</strong> glutelins extracted from flours samples<br />
of Zea mays l<strong>and</strong>races originated from southern Brazil.<br />
Numbers in top of bars are referred to the total protein<br />
content (g Kg )1 ).<br />
Table S1. Grain colour <strong>and</strong> type, cultivation cycle,<br />
plant height, number of cobs per plant, <strong>and</strong> productivity<br />
of the studied maize varieties cultivated in southern<br />
Brazil.<br />
Please note: Wiley-Blackwell are not responsible for<br />
the content or functionality of any supporting information<br />
supplied by the authors. Any queries (other than<br />
missing material) should be directed to the corresponding<br />
author for the article.<br />
Ó 2010 The Authors. Journal compilation Ó 2010 Institute of Food Science <strong>and</strong> Technology International Journal of Food Science <strong>and</strong> Technology 2010
1682<br />
Original article<br />
Effect of processing on the amino acid content of New Zeal<strong>and</strong><br />
spinach (Tetragonia tetragonioides Pall. Kuntze)<br />
Jacek Słupski, Jacek Achrem-Achremowicz, Zofia Lisiewska* & Anna Korus<br />
Department of Raw Materials <strong>and</strong> Processing of Fruit <strong>and</strong> Vegetables, Faculty of Food Technology, Agricultural University of Kraków, Balicka<br />
122, 30-149 Kraków, Pol<strong>and</strong><br />
(Received 8 December 2009; Accepted in revised form 20 May 2010)<br />
Summary The aim of this work was to evaluate the effect of processing on the amino acid content <strong>and</strong> protein quality of<br />
New Zeal<strong>and</strong> spinach (Tetragonia tetragonioides Pall. Kuntze). In this research, fresh <strong>and</strong> cooked New<br />
Zeal<strong>and</strong> spinach as well as two frozen products prepared for consumption, one obtained using the traditional<br />
method (blanching–freezing–storage–cooking) <strong>and</strong> the other a convenience food product obtained using a<br />
modified process (cooking–freezing–storage–defrosting <strong>and</strong> heating in a microwave oven), were analysed.<br />
Glutamic acid was the dominant amino acid in fresh New Zeal<strong>and</strong> spinach, <strong>and</strong> the limiting amino acids<br />
were cystine <strong>and</strong> methionine. Technological <strong>and</strong> culinary processing caused a significant increase in amino<br />
acid content in 100 g of edible portion, with the exception of methionine <strong>and</strong> cystine in frozen products<br />
prepared for eating. Changes in amino acid content expressed in g ⁄ 16 g of N (which corresponded to 100 g<br />
tissue protein) were not significant, with the exception of the lower glutamic acid content in the frozen<br />
product obtained using traditional processing method.<br />
Keywords Amino acids, New Zeal<strong>and</strong> spinach (Tetragonia tetragonioides Pall. Kuntze), technological <strong>and</strong> culinary processing.<br />
Introduction<br />
In contrast to spinach (Spinacia oleracea L.), New<br />
Zeal<strong>and</strong> spinach (Tetragonia tetragonioides Pall. Kuntze,<br />
Aizoaceae) is a warm climate plant (Kawashima &<br />
Valente Soares, 2003). However, field experiments carried<br />
out in Southern Pol<strong>and</strong> (Krako´w region) proved<br />
that this valuable vegetable could successfully be cultivated<br />
in the temperate climate zone (Jaworska &<br />
Kmiecik, 1999, 2000; Kmiecik & Jaworska, 1999).<br />
According to Ge˛bczyn´ski (2008), New Zeal<strong>and</strong> spinach<br />
is suitable for processing both as a traditional frozen<br />
product <strong>and</strong> as a convenience food, the use of which<br />
becomes more <strong>and</strong> more popular because of the reduced<br />
preparation time. Moreover, products prepared from<br />
this vegetable, including frozen product prepared using<br />
the modified technology (convenience food), are characterised<br />
by high antioxidant content <strong>and</strong> sensory value<br />
(Ge˛bczyn´ski, 2008). It is recommended to use vegetables<br />
because they are valuable sources of vitamins, mineral<br />
salts <strong>and</strong> organic acids. In addition, they are rich in<br />
antioxidants. Although most research on protein content<br />
has focused on vegetables rich in proteins, such as<br />
*Correspondent: Fax: 48 12 6624757;<br />
e-mail: rrlisiew@cyf-kr.edu.pl<br />
International Journal of Food Science <strong>and</strong> Technology 2010, 45, 1682–1688<br />
legumes, other vegetables containing low protein could<br />
also serve as an additional source of amino acids in<br />
meat-free diets. Jaworska indicated that protein content<br />
in New Zeal<strong>and</strong> spinach was 27.5–30.6 g in 100 g of dry<br />
matter, depending on the season, planting <strong>and</strong> harvesting<br />
times <strong>and</strong> the part used (Jaworska & Kmiecik, 1999).<br />
Amino acids are vulnerable to the effects of culinary or<br />
technological processing.<br />
There are few reports available on the effects of<br />
culinary <strong>and</strong> processing technology on amino acid<br />
content in foods, <strong>and</strong> as far as the authors know, there<br />
are no data concerning this question for New Zeal<strong>and</strong><br />
spinach.<br />
Amino acids play an important role for human<br />
nutrition not only as precursors for the synthesis of<br />
proteins <strong>and</strong> other nitrogen containing compounds, but<br />
also as key molecules that regulate some of major<br />
metabolic pathways (Meijer, 2003).The aim of this work<br />
was the assessment of changes in amino acid content in<br />
New Zeal<strong>and</strong> spinach products caused by cooking,<br />
12 months’ frozen storage <strong>and</strong> preparing them for<br />
eating. Included for analysis were fresh <strong>and</strong> cooked<br />
spinach <strong>and</strong> two frozen products prepared for<br />
consumption using two different processes. The first<br />
product was obtained using the traditional method of<br />
blanching, freezing <strong>and</strong>, after 12 months’ frozen storage,<br />
doi:10.1111/j.1365-2621.2010.02315.x<br />
Ó 2010 The Authors. Journal compilation Ó 2010 Institute of Food Science <strong>and</strong> Technology
cooking in brine to the required completion; the other<br />
by a modified method in which the spinach was cooked<br />
in brine until done, then frozen, kept in frozen storage<br />
for 12 months <strong>and</strong> finally defrosted <strong>and</strong> heated in a<br />
microwave oven prior to analysis.<br />
Material <strong>and</strong> methods<br />
The investigated material consisted of fresh leafy shoots<br />
of New Zeal<strong>and</strong> spinach (Tetragonia tetragonioides Pall.<br />
Kuntze) 15–17 cm in length as the raw material, cooked<br />
until done, <strong>and</strong> frozen products prepared for consumption<br />
after 12 months of frozen storage at )20 °C. New<br />
Zeal<strong>and</strong> spinach was grown in the experimental field of<br />
the Department on the western outskirts of Krako´w<br />
(50°08¢N, 19°86¢E). The soil was in good horticultural<br />
condition with neutral pH <strong>and</strong> high content of potassium,<br />
phosphorus <strong>and</strong> calcium. The application of<br />
mineral fertilisers was determined by the fertility of soil<br />
<strong>and</strong> the nutritional requirements of the investigated<br />
species. The fertilisation was N, 90 kg ha )1 ;P2O5,80 kg ha )1 ;K2O, 100 kg ha )1 . Cultivation included mechanical<br />
weed control, sprinkler watering <strong>and</strong> protection<br />
against diseases <strong>and</strong> pests. The spinach was harvested in<br />
mid-July. A mean sample representing the whole batch<br />
was taken for analysis. The leaves of New Zeal<strong>and</strong><br />
spinach were cut into sections 7–8 cm in length <strong>and</strong> then<br />
processed using two different methods.<br />
Production of frozen products<br />
Two variants were used in preparing the raw material for<br />
freezing. In variant I, New Zeal<strong>and</strong> spinach was<br />
blanched in stainless steel vessel containing water (1:5,<br />
solid to liquid ratio) at 95–98 °C for 2 min 15 s. These<br />
conditions permitted a decrease in the activity of catalase<br />
<strong>and</strong> peroxidase to the levels below 5% of the initial<br />
values. After blanching, the material was immediately<br />
cooled in cold water <strong>and</strong> drained on sieves for 30 min.<br />
In variant II, New Zeal<strong>and</strong> spinach was cooked in a<br />
stainless steel vessel in 2% brine (1:5, solid to liquid<br />
ratio) until done (4 min). After cooking, the cut leaves<br />
were drained, placed in sieves <strong>and</strong> cooled in a stream of<br />
cold air.<br />
In both variants, the blanched or cooked spinach was<br />
packed in 500 g portions in polyethylene bags <strong>and</strong><br />
frozen at )40 °C in blast chamber (Feutron 3626-51;<br />
Feutron Klimasimulation GmbH, Langenwetzendorf,<br />
Germany) for 90 min. The obtained products were<br />
stored at )20 °C for 12 months.<br />
Preparation of frozen product for evaluation<br />
Frozen product blanched before freezing (variant I) was<br />
cooked in 2% brine; the proportion of brine to plant<br />
material was 1:1 (w ⁄ w). The time of cooking, measured<br />
Amino acids in New Zeal<strong>and</strong> spinach J. Słupski et al. 1683<br />
from the moment when the brine was boiling again, was<br />
2 min. After cooking, the spinach was immediately<br />
drained <strong>and</strong> cooled to 20 °C for analyses of chemical<br />
composition.<br />
Frozen product cooked before freezing (variant II)<br />
was prepared by placing 500 g of plant material in a<br />
heat-resisting vessel covered with a lid, defrosted <strong>and</strong><br />
heated in Panasonic Ò microwave kitchen (type NN-<br />
F621; Matsushita Electric, Cardiff, UK). The time of<br />
defrosting <strong>and</strong> heating to 75 °C was 7 min 45 s accordingly<br />
to Codex Alimentarius (1993).<br />
Analytical procedures<br />
The moisture content <strong>and</strong> total N were determined<br />
according to procedures described by the Association of<br />
Official Agricultural Chemists (AOAC 1984). The content<br />
of amino acids was determined using an AAA-400<br />
automatic amino acid analyser (INGOS, Prague, Czech<br />
Republic). The freeze-dried material was hydrolysed in<br />
6 m HCl for 24 h at 110 °C. After cooling, filtering <strong>and</strong><br />
washing, the hydrolyte was evaporated in a vacuum<br />
evaporator (below 50 °C for sulphur-containing amino<br />
acids <strong>and</strong> below 60 °C for the other amino acids), <strong>and</strong><br />
the dry residue was dissolved in a buffer of pH 2.2. The<br />
prepared sample was analysed using the ninhydrin<br />
method. The ninhydrin solution was buffered at pH<br />
5.5. A column 370 mm in length was filled with Ostion<br />
ANB INGOS Ltd., Ionex (The Czech Republic). The<br />
temperature of the column was 55–74 °C <strong>and</strong> that of the<br />
reactor was 120 °C. The determination of the sulphurcontaining<br />
amino acids, methionine <strong>and</strong> cystine, was<br />
carried out by means of oxygenating hydrolysis, using a<br />
mixture of formic acid <strong>and</strong> hydrogen peroxide (9:1) at<br />
110 °C for 24 h. After cooling, the sample was hydrolysed<br />
with acid. Buffers of pH 2.6 <strong>and</strong> 3.0 were used; the<br />
temperature of the column was 60 °C <strong>and</strong> that of the<br />
reactor was 120 °C. The calculations were made according<br />
to the external st<strong>and</strong>ard.<br />
Expression of results<br />
The level of amino acids was given in 100 g of edible<br />
parts of the products. The composition of amino acids<br />
was also expressed as grams per 16 g of N to estimate<br />
the quality of the protein in New Zeal<strong>and</strong> spinach by<br />
comparing it with the FAO ⁄ WHO pattern (1991). On<br />
the basis of the amino acid composition, the chemical<br />
score (CS) index was calculated using the Mitchell &<br />
Block (1946) <strong>and</strong> the integrated essential amino acid<br />
index using Oser (1951).<br />
Statistical analysis<br />
Statistical calculations were performed using singlefactor<br />
analysis of variance (anova) <strong>and</strong> Duncan’s test<br />
Ó 2010 The Authors. Journal compilation Ó 2010 Institute of Food Science <strong>and</strong> Technology International Journal of Food Science <strong>and</strong> Technology 2010
1684<br />
Amino acids in New Zeal<strong>and</strong> spinach J. Słupski et al.<br />
with probability level P = 0.05 with the use of Statistica<br />
Ò 6.1; Stat Soft Inc., Tulsa, OK, USA software. Each<br />
experiment was carried out in three replications, each<br />
determination in duplicate.<br />
Results <strong>and</strong> discussion<br />
The chemical composition of vegetables changes during<br />
culinary or technological treatment, <strong>and</strong> the most susceptible<br />
are vegetables with a large surface area or loose<br />
tissue structure (Lisiewska et al., 2004; Kmiecik et al.,<br />
2007). In our former research, we found that cooking <strong>and</strong><br />
operations connected with the preparation of frozen<br />
products <strong>and</strong> their subsequent preparing for consumption<br />
brought about considerable changes of many constituents<br />
in New Zeal<strong>and</strong> spinach (Lisiewska et al.,<br />
2009a). In the current work, changes in amino acids<br />
content in processed New Zeal<strong>and</strong> spinach were studied.<br />
Despite the fact that the processing was carried out in<br />
water, a considerable increase in dry matter content of<br />
Amino acid Raw material<br />
Product prepared for consumption<br />
Cooked<br />
directly from<br />
raw material<br />
processed New Zeal<strong>and</strong> spinach was observed after both<br />
blanching <strong>and</strong> cooking (Table 1). The dry matter after<br />
cooking was 47% higher than in the raw material, while<br />
in the products prepared for consumption from frozen<br />
spinach that was blanched before freezing (processing<br />
variant I) it was 36% higher <strong>and</strong> as much as 67% higher<br />
from the frozen-cooked spinach (variant II). Usually<br />
blanching or cooking in water causes leaching of some<br />
soluble constituents but at the same time high temperature<br />
of these processing methods brings about tissue<br />
shrinkage <strong>and</strong> this in turn expels water from vegetable.<br />
The overall effect of these can be an increase in dry<br />
matter content or in some constituents’ concentrations<br />
(Oboh, 2005; Ge˛bczyn´ski & Lisiewska, 2006).<br />
Statistically significant changes were observed in<br />
amino acid content in 100 g of processed New Zeal<strong>and</strong><br />
spinach products prepared for consumption (Table 1).<br />
Products prepared for consumption contained more<br />
amino acids than the raw vegetable, except methionine<br />
(in this case, the increase was nonsignificant). The<br />
Prepared from frozen <strong>and</strong><br />
stored material<br />
Blanched<br />
before<br />
freezing<br />
(variant I)<br />
Cooked<br />
before<br />
freezing<br />
(variant II)<br />
Isoleucine 71 a ± 13 104 b ± 20 103 b ± 16 116 b ±20<br />
Leucine 135 a ± 16 192 b ± 24 189 b ± 22 219 b ±22<br />
Lysine 98 a ± 14 152 b ± 21 146 b ± 19 158 b ±24<br />
Cystine 11 a ±4 23 b ±8 21 ab ±7 22 ab ±8<br />
Methionine 16 a ±6 27 a ±10 29 a ±10 26 a ±9<br />
Total sulphur amino acids 27 a ±10 50 a ±17 50 a ±16 48 a ±16<br />
Tyrosine 40 a ±11 65 b ±18 65 b ±15 74 b ±15<br />
Phenylalanine 83 a ± 13 118 b ± 18 115 b ± 17 132 b ±16<br />
Total aromatic amino acids 123 a ± 23 184 b ± 33 180 b ± 32 206 b ±30<br />
Threonine 75 a ± 11 117 b ± 19 104 b ± 16 116 b ±19<br />
Valine 91 a ± 13 137 b ± 20 134 b ± 19 155 b ±17<br />
Histidine 56 a ±12 81 ab ±19 74 ab ±17 91 b ±16<br />
Total essential amino acids 676 a ± 99 1016 b ± 147 980 b ± 147 1109 b ± 146<br />
Arginine 108 a ± 13 150 b ± 22 147 b ± 21 171 b ±21<br />
Aspartic acid 165 a ± 14 218 b ± 19 225 b ± 20 255 c ±22<br />
Glutamic acid 208 a ± 18 275 b ± 26 253 b ± 22 335 c ±29<br />
Serine 76 a ±12 91 ab ±16 96 ab ± 18 113 b ±19<br />
Proline 94 a ± 15 138 b ± 19 137 b ± 17 136 b ±19<br />
Glycine 84 a ± 12 121 b ± 18 118 b ± 17 138 b ±19<br />
Alanine 90 a ± 14 130 b ± 22 126 b ± 17 146 b ±20<br />
Total nonessential amino acids 825 a ± 98 1123 b ± 142 1102 b ± 123 1294 b ± 135<br />
Total amino acids 1501 a ± 192 2139 b ± 286 2082 b ± 269 2403 b ± 281<br />
Dry matter g ⁄ 100 g of edible portion 6.19 9.12 8.44 10.31<br />
Means of double measurements of three different experiments. Means in the same raw with<br />
different superscript letters are significally different at P < 0.05. Means in the same raw without<br />
superscript letters are not significally different at P < 0.05.<br />
Table 1 Amino acid composition of raw<br />
<strong>and</strong> processed New Zeal<strong>and</strong> spinach,<br />
mg ⁄ 100 g of edible portion<br />
International Journal of Food Science <strong>and</strong> Technology 2010 Ó 2010 The Authors. Journal compilation Ó 2010 Institute of Food Science <strong>and</strong> Technology
percentage increase in amino acids ranged from 20% to<br />
100% for the cooked fresh spinach <strong>and</strong> 22% to 91%<br />
(variant I) <strong>and</strong> 49% to 100% (variant II) in cooked<br />
products, respectively.<br />
The percentage changes in amino acids were different<br />
when the results were compared in dry matter, what was<br />
possible to calculate from the Table 1. The content of a<br />
particular amino acid in dry matter ranged from )18%<br />
to +45% in cooked spinach, from )11% to +40% in<br />
cooked spinach prepared from the frozen product<br />
(variant I), <strong>and</strong> from )13% to +20% in New Zeal<strong>and</strong><br />
spinach prepared for consumption from the frozen<br />
product obtained using the modified technology (variant<br />
II). The greatest decrease was observed in serine content<br />
<strong>and</strong> the highest increase in cystine content.<br />
The nitrogen content in dry matter of raw material<br />
<strong>and</strong> processed New Zeal<strong>and</strong> spinach did not change<br />
significantly (Table 2). Neither statistically significant<br />
differences in amino acid content expressed as 16 g of N<br />
Table 2 Amino acid composition of raw <strong>and</strong><br />
processed New Zeal<strong>and</strong> spinach, g ⁄ 16 g N<br />
Amino acid Raw material<br />
Amino acids in New Zeal<strong>and</strong> spinach J. Słupski et al. 1685<br />
were found between all the examined samples, that is,<br />
the raw material <strong>and</strong> products prepared for consumption<br />
(Table 2). The exception was glutamic acid, content<br />
of which was significantly lower in cooked spinach (but<br />
not in the blanched) than in the raw material; however,<br />
among samples prepared for consumption, the changes<br />
of glutamic acid were nonsignificant.<br />
In comparison with the raw material <strong>and</strong> depending<br />
on the amino acid, the cooked samples contained from<br />
)19% to +43% of amino acids, <strong>and</strong> in the case of<br />
frozen samples prepared for consumption, the levels<br />
were )13% to +32% (variant I) <strong>and</strong> )17% to +16%<br />
(variant II). As to the fresh–cooked spinach, amino acid<br />
levels in the frozen samples were )7% to +13%<br />
(variant I) <strong>and</strong> )19% to +5% (variant II). Relation<br />
of the two frozen samples showed that the product<br />
obtained using the modified technology (variant II)<br />
contained )25% to 12% of the amino acids found in the<br />
traditional product (variant I). Similar, nonsignificant<br />
Product prepared for consumption<br />
Cooked<br />
directly from<br />
raw material<br />
Prepared from frozen <strong>and</strong><br />
stored material<br />
Blanched<br />
before<br />
freezing<br />
(variant I)<br />
Cooked<br />
before<br />
freezing<br />
(variant II)<br />
Isoleucine 3.68 ± 0.66 3.60 ± 0.69 3.65 ± 0.57 3.48 ± 0.60<br />
Leucine 6.98 ± 0.85 6.67 ± 0.83 6.74 ± 0.80 6.58 ± 0.67<br />
Lysine 5.07 ± 0.75 5.26 ± 0.72 5.18 ± 0.68 4.75 ± 0.71<br />
Cystine 0.56 ± 0.22 0.80 ± 0.27 0.74 ± 0.24 0.65 ± 0.25<br />
Methionine 0.86 ± 0.30 0.93 ± 0.34 1.05 ± 0.35 0.79 ± 0.26<br />
Total sulphur amino acids 1.42 ± 0.52 1.73 ± 0.61 1.78 ± 0.59 1.44 ± 0.49<br />
Tyrosine 2.09 ± 0.55 2.27 ± 0.61 2.32 ± 0.54 2.21 ± 0.45<br />
Phenylalanine 4.29 ± 0.65 4.11 ± 0.62 4.09 ± 0.59 3.97 ± 0.47<br />
Total aromatic amino acids 6.39 ± 1.20 6.39 ± 1.16 6.42 ± 1.13 6.17 ± 0.91<br />
Threonine 3.88 ± 0.58 4.08 ± 0.66 3.70 ± 0.56 3.48 ± 0.56<br />
Valine 4.74 ± 0.69 4.75 ± 0.68 4.77 ± 0.67 4.67 ± 0.51<br />
Histidine 2.93 ± 0.64 2.81 ± 0.65 2.65 ± 0.62 2.72 ± 0.49<br />
Total essential amino acids 35.07 ± 5.14 35.28 ± 5.11 34.89 ± 5.22 33.29 ± 4.39<br />
Arginine 5.59 ± 0.69 5.20 ± 0.77 5.22 ± 0.74 5.14 ± 0.63<br />
Aspartic acid 8.55 ± 0.74 7.57 ± 0.68 7.99 ± 0.71 7.66 ± 0.67<br />
Glutamic acid 10.81 b ± 0.95 9.54 ab ± 0.89 9.00 a ± 0.77 10.05 ab ± 0.87<br />
Serine 3.93 ± 0.62 3.17 ± 0.56 3.41 ± 0.63 3.40 ± 0.56<br />
Proline 4.90 ± 0.76 4.79 ± 0.67 4.88 ± 0.62 4.09 ± 0.58<br />
Glycine 4.37 ± 0.64 4.20 ± 0.64 4.20 ± 0.60 4.14 ± 0.56<br />
Alanine 4.66 ± 0.73 4.53 ± 0.77 4.50 ± 0.60 4.38 ± 0.59<br />
Total nonessential<br />
amino acids<br />
42.81 ± 5.07 38.99 ± 4.95 39.20 ± 4.38 38.87 ± 4.07<br />
Total amino acids 77.88 ± 9.95 74.27 ± 9.94 74.09 ± 9.58 72.16 ± 8.44<br />
N g ⁄ 100 g<br />
dry matter<br />
4.98 5.05 5.33 5.17<br />
Means of double measurements of three different experiments. Means in the same raw with<br />
different superscript letters are significally different at P < 0.05. Means in the same raw without<br />
superscript letters are not significally different at P < 0.05.<br />
Ó 2010 The Authors. Journal compilation Ó 2010 Institute of Food Science <strong>and</strong> Technology International Journal of Food Science <strong>and</strong> Technology 2010
1686<br />
Amino acids in New Zeal<strong>and</strong> spinach J. Słupski et al.<br />
Table 3 Amino acid indexes of raw <strong>and</strong> processed New Zeal<strong>and</strong> spinach according to FAO ⁄ WHO (1991)<br />
Index Amino acid<br />
differences in amino acid content were reported in the<br />
protein of raw <strong>and</strong> cooked samples of cassava leaves<br />
(Diasolua-Ngudi et al., 2003).<br />
The limiting amino acids of the first order in New<br />
Zeal<strong>and</strong> spinach, both in fresh <strong>and</strong> in products prepared<br />
for consumption, were cystine with methionine <strong>and</strong> of<br />
the second order lysine (Table 3). Nevertheless, CS<br />
indexes for the sulphur amino acids methionine <strong>and</strong><br />
cystine were higher in products prepared for consumption<br />
than in the raw material (Table 3).<br />
Amino acids are usually susceptible to culinary or<br />
technological processing, especially when heating is<br />
involved. According to Klein & Mondy (1981), heat<br />
treatment might lead to compositional changes in<br />
nitrogenous compounds, depending on the mechanism<br />
of heat transfer <strong>and</strong> the particular tissue under treatment.<br />
During the preparation of food, amino acids of<br />
protein side chains can react with each other. These<br />
reactions could result in changes in the composition of<br />
amino acids (Sherr et al., 1989). Baxter (1995) used<br />
amino acid st<strong>and</strong>ards to study their behaviour in the<br />
heat process <strong>and</strong> observed their partial decomposition<br />
ranging from 8% to 14%. The Maillard reaction would<br />
also contribute to the changes of amino acids. The<br />
initial reaction in the process involving condensation<br />
between amino groups of amino acids <strong>and</strong> sugars is<br />
reversible; however, subsequent steps are not, <strong>and</strong> some<br />
amino acids are lost in this way (Baxter, 1995; C<strong>and</strong>ela<br />
et al., 1997). Eventually, decomposition of some protein<br />
fractions rich in amino acids can result in higher values<br />
for other amino acids when they are calculated on the<br />
basis of 16 g N (Mutia & Uchida, 1993; Espe & Lied,<br />
1999).<br />
Technological processing also plays a part in the<br />
changes of amino acids content. Cruz-Garcia et al.<br />
Raw<br />
material<br />
Product prepared for consumption<br />
Cooked<br />
directly<br />
from<br />
raw<br />
material<br />
Prepared from frozen <strong>and</strong><br />
stored material<br />
Blanched<br />
before<br />
freezing<br />
(variant I)<br />
Chemical score index Isoleucine 131 129 130 124<br />
Leucine 106 101 102 100<br />
Lysine 87 91 89 82<br />
Cystine with methionine 57 69 71 58<br />
Tyrosine with phenylalanine 101 101 102 98<br />
Threonine 114 120 109 102<br />
Valine 135 136 136 133<br />
Histidine 154 148 139 143<br />
Essential amino acid index 107 109 108 101<br />
Cooked<br />
before<br />
freezing<br />
(variant II)<br />
indicated that extending the cooking time <strong>and</strong> increasing<br />
the volume of water used for cooking resulted in<br />
greater amino acid loss by diffusion <strong>and</strong> degradation<br />
(de la Cruz-Garcia et al., 1999). Diasolua-Ngudi et al.<br />
(2003) reported that a greater volume of water led to<br />
increased loss of constituents because of diffusion.<br />
However, Chau et al. (1997) proved that doubling the<br />
cooking time did not decrease amino acid levels <strong>and</strong><br />
actually increased them in some vegetable species.<br />
C<strong>and</strong>ela et al. (1997) showed that after heat treatment<br />
in water, the amino acid content in 100 g of edible<br />
portion increased or decreased depending on the vegetable<br />
species. A similar view that heat treatment could<br />
either increase or decrease amino acid content was<br />
presented by Parihar et al. (1996) <strong>and</strong> Chau et al.<br />
(1997). It was also shown that with the same parameters<br />
of heat treatment, changes in amino acid content varied<br />
<strong>and</strong> depended on the variety (Kmiecik et al., 1994,<br />
1999), ripeness (Korus et al., 2003) <strong>and</strong> the usable part<br />
of the analysed vegetable (Murcia et al., 2001; Lisiewska<br />
et al., 2004).<br />
In contrast to other leafy vegetables such as kale <strong>and</strong><br />
spinach, the edible parts of New Zeal<strong>and</strong> spinach were<br />
not a rich source of amino acids (Table 1). Hundred<br />
grams of edible parts of New Zeal<strong>and</strong> spinach contained<br />
64% of the amino acids present in spinach<br />
(Z. Lisiewska, W. Kmiecik & P. Ge˛bczyn´ski, unpublished<br />
data) <strong>and</strong> only 41% of those in kale (Lisiewska<br />
et al., 2008). The dominant amino acid, as in spinach<br />
(Z. Lisiewska, W. Kmiecik & P. Ge˛bczyn´ski, unpublished<br />
data) <strong>and</strong> kale (Lisiewska et al., 2008), was<br />
glutamic acid, <strong>and</strong> the limiting amino acids were cystine<br />
with methionine (Table 3). In other leafy vegetables, the<br />
limiting amino acids were methionine with cystine<br />
(Wallace et al., 1998; Z. Lisiewska, W. Kmiecik &<br />
International Journal of Food Science <strong>and</strong> Technology 2010 Ó 2010 The Authors. Journal compilation Ó 2010 Institute of Food Science <strong>and</strong> Technology
P. Ge˛bczyn´ski, unpublished data) <strong>and</strong> also leucine<br />
(Lisiewska et al., 2009b) <strong>and</strong> lysine (Lisiewska et al.,<br />
2008). Essential amino acids accounted for 45% of total<br />
amino acids, which did not differ greatly from the<br />
proportion in other species of leafy vegetables: in<br />
spinach, it made up 49% (Z. Lisiewska, W. Kmiecik &<br />
P. Ge˛bczyn´ski, unpublished data) <strong>and</strong> in kale 44%<br />
(Lisiewska et al., 2008).<br />
Conclusion<br />
Culinary <strong>and</strong> technological processing caused a significant<br />
increase in total amino acid content in 100 g of<br />
edible portion, with the exception of methionine <strong>and</strong><br />
cystine in products prepared for consumption. Changes<br />
in amino acid content expressed as 16 g of N were<br />
nonsignificant, except for the lower content of glutamic<br />
acid in the traditional frozen product. Cystine with<br />
methionine were the limiting amino acids of the first<br />
order both in fresh vegetable <strong>and</strong> in products prepared<br />
for consumption, <strong>and</strong> lysine was the limiting amino acid<br />
of the second order.<br />
Despite the fact that the total amino acid content in<br />
New Zeal<strong>and</strong> spinach was not high <strong>and</strong> deficient in<br />
sulphur amino acids, its nutritional value was good.<br />
Interestingly, the CS indexes of sulphur amino acids,<br />
methionine <strong>and</strong> cystine, were higher in products<br />
prepared for consumption than in the raw material.<br />
Acknowledgment<br />
The authors would like to thank Prof. Robert D. Tanner<br />
(V<strong>and</strong>erbilt University) for grammatical corrections of<br />
the manuscript.<br />
References<br />
Association of Official Agricultural Chemists (AOAC). 1984. Official<br />
Methods of Analysis, 14th edn. Arlington, Virginia, USA: Association<br />
of Official Agricultural Chemists.<br />
Baxter, J. (1995). Free amino acid stability in reducing sugar systems.<br />
Journal of Food Science, 60, 405–408.<br />
C<strong>and</strong>ela, M., Astiasaran, I. & Bello, J. (1997). Cooking <strong>and</strong> warmholding:<br />
effect on general composition <strong>and</strong> amino acids of kidney<br />
beans (Phaseolus vulgaris), chickpeas (Cicer arietinum), <strong>and</strong> lentils<br />
(Lens culinaris). Journal of Agricultural <strong>and</strong> Food Chemistry, 45,<br />
4763–4767.<br />
Chau, C.F., Cheung, P.C.K. & Wong, Y.S. (1997). Effects of cooking<br />
on content of amino acids <strong>and</strong> antinutrients in three Chinese<br />
indigenous legume seeds. Journal of the Science of Food <strong>and</strong><br />
Agriculture, 75, 447–452.<br />
Codex Alimentarius, CAC ⁄ RCP 39. (1993). Code of Hygienic Practice<br />
for Precooked <strong>and</strong> Cooked Foods in Mass Catering 3:39, Pp. 18.<br />
de la Cruz-Garcia, C., Lopez-Hern<strong>and</strong>ez, J., Gonzalez-Castro, M.,<br />
Rodriguez-Bernaldodequiros, A. & Simal-Lozano, J. (1999). Effects<br />
of various culinary treatments on the amino acid content of green<br />
beans. Deutsche Lebensmittel-Rundschau, 95, 507–510.<br />
Diasolua-Ngudi, D., Kuo, Y.-H. & Lambein, F. (2003). Cassava<br />
cyanogens <strong>and</strong> free amino acids in raw <strong>and</strong> cooked leaves. Food <strong>and</strong><br />
Chemical Toxicology, 41, 1193–1197.<br />
Amino acids in New Zeal<strong>and</strong> spinach J. Słupski et al. 1687<br />
Espe, M. & Lied, E. (1999). Fish silage prepared from different cooked<br />
<strong>and</strong> uncooked raw materials: chemical changes during storage at<br />
different temperatures. Journal of the Science of Food <strong>and</strong> Agriculture,<br />
79, 327–332.<br />
FAO ⁄ WHO (1991). Protein quality evaluation in human diets. Food<br />
Nutr Pap 51, FAO: Rome, Italy.<br />
Ge˛bczyn´ski, P. (2008). Changes in the contents of selected antioxidants<br />
in frozen vegetables as dependent on preliminary processing,<br />
conditions of storage <strong>and</strong> method of preparing for consumption<br />
(monograph in Polish). Zeszyty Naukowe Akademii Rolniczej im.<br />
H. Kołła˛taja W Krakowie, No. 445, vol. 332.<br />
Ge˛bczyn´ski, P. & Lisiewska, Z. (2006). Comparison of the level of<br />
selected antioxidative compounds in frozen broccoli produced using<br />
traditional <strong>and</strong> modified methods. Innovative Food Science <strong>and</strong><br />
Emerging Technologies, 7, 239–245.<br />
Jaworska, G. & Kmiecik, W. (1999). Effect of the date of harvest on<br />
the selected traits of the chemical composition of spinach (Spinacia<br />
oleracea L.) <strong>and</strong> New Zeal<strong>and</strong> spinach (Tetragonia expansa Murr.).<br />
Acta Agraria et Silvestria Series Agraria, 37, 15–26.<br />
Jaworska, G. & Kmiecik, W. (2000). Comparison of the nutritive value<br />
of frozen spinach <strong>and</strong> New Zeal<strong>and</strong> spinach. Polish Journal of Food<br />
<strong>and</strong> Nutrition Sciences, 9, 79–84.<br />
Kawashima, L. & Valente Soares, L. (2003). Mineral profile of raw<br />
<strong>and</strong> cooked leafy vegetables consumed in Southern Brazil. Journal of<br />
Food Composition <strong>and</strong> Analysis, 16, 605–611.<br />
Klein, L.B. & Mondy, N.I. (1981). Comparison of microwave <strong>and</strong><br />
conventional baking of potatoes in relation to nitrogenous constituents<br />
<strong>and</strong> mineral composition. Journal of Food Science, 46, 1874–<br />
1877.<br />
Kmiecik, W. & Jaworska, G. (1999). Effect of growing methods of<br />
New Zeal<strong>and</strong> spinach on its yield <strong>and</strong> pattern of harvests. Folia<br />
Horticulturae, 11, 75–85.<br />
Kmiecik, W., Lisiewska, Z. & Jaworska, G. (1994). Amino acids<br />
content in fresh <strong>and</strong> preserved broad beans (Vicia faba major).<br />
Polish Journal of Food <strong>and</strong> Nutrition Sciences, 3 ⁄ 44, 35–43.<br />
Kmiecik, W., Lisiewska, Z. & Ge˛bczyn´ski, P. (1999). Content of amino<br />
acids in fresh <strong>and</strong> frozen <strong>and</strong> cooked broad bean seeds (Vicia faba<br />
var major) depending on cultivar <strong>and</strong> degree of maturity. Journal of<br />
The Science of Food <strong>and</strong> Agriculture, 79, 555–560.<br />
Kmiecik, W., Lisiewska, Z. & Korus, A. (2007). Retention of mineral<br />
constituents in frozen brassicas depending on the method of<br />
preliminary processing of the raw material <strong>and</strong> preparation of<br />
frozen products for consumption. European Food Research <strong>and</strong><br />
Technology, 224, 573–579.<br />
Korus, A., Lisiewska, Z. & Kmiecik, W. (2003). Content of amino<br />
acids in fresh <strong>and</strong> preserved physiologically immature grass pea<br />
(Lathyrus sativus L.) Seeds. European Food Research <strong>and</strong> Technology,<br />
217, 148–153.<br />
Lisiewska, Z., Supski, J., Kmiecik, W. & Gebczyński, P. (2004). Amino<br />
acid profiles <strong>and</strong> protein quality of fresh <strong>and</strong> frozen dill depending<br />
on usable part of raw material, pre-treatment before freezing, <strong>and</strong><br />
storage temperature of frozen products. Food Science <strong>and</strong> Technology,<br />
7, 3–11.<br />
Lisiewska, Z., Kmiecik, W. & Korus, A. (2008). The amino acid<br />
composition of kale (Brassica oleracea L. var. acephala), fresh <strong>and</strong><br />
after culinary <strong>and</strong> technological processing. Food Chemistry, 108,<br />
642–648.<br />
Lisiewska, Z., Gebczyn´ski, P., Bernas´, E. & Kmiecik, W. (2009a).<br />
Retention of mineral constituents in frozen leafy vegetables prepared<br />
for consumption. Journal of Food Composition <strong>and</strong> Analysis, 22,<br />
218–223.<br />
Lisiewska, Z., Supski, J., Skoczen´-Supska, R. & Kmiecik, W. (2009b).<br />
Content of amino acids <strong>and</strong> the quality of protein in Brussels<br />
sprouts, both raw <strong>and</strong> prepared for consumption. International<br />
Journal of Refrigeration, 32, 272–278.<br />
Meijer, A.J. (2003). Amino acids as regulators <strong>and</strong> components of<br />
nonproteinogenic pathways. The Journal of Nutrition, 133, 2057S–<br />
2062S.<br />
Ó 2010 The Authors. Journal compilation Ó 2010 Institute of Food Science <strong>and</strong> Technology International Journal of Food Science <strong>and</strong> Technology 2010
1688<br />
Amino acids in New Zeal<strong>and</strong> spinach J. Słupski et al.<br />
Mitchell, H.H. & Block, R.J. (1946). Some relationships between the<br />
amino acid contents of proteins <strong>and</strong> their nutritive values for the rat.<br />
The Journal of Biological Chemistry, 163, 599–620.<br />
Murcia, M.A., Lopez-Ayerra, B., Martinez-Tome, M. & Garcia-<br />
Carmona, F. (2001). Effect of industrial processing on amino acid<br />
content of broccoli. Journal of the Science of Food <strong>and</strong> Agriculture,<br />
81, 1299–1305.<br />
Mutia, R. & Uchida, S. (1993). Effect of heat treatment on nutritional<br />
value of winged bean (Psophocarpus tetragonolobus) as compared to<br />
soybean I. Chemical characteristics of treated winged bean. Asian-<br />
Australian Journal of Animal Sciences, 6, 19–26.<br />
Oboh, G. (2005). Effect of blanching on the antioxidant properties of<br />
some tropical green leafy vegetables. LWT-Food Science <strong>and</strong><br />
Technology, 38, 513–517.<br />
Oser, B. (1951). Method for integrating essential amino acid content in<br />
the nutritional evaluation of protein. Journal of the American<br />
Dietetic Association, 27, 396.<br />
Parihar, P., Mishra, A., Gupta, O. & Singh, A. (1996). Effect of<br />
cooking on limiting essential amino acid content of common pulses.<br />
Advances in Plant Sciences, 9, 165–170.<br />
Sherr, B., Lee, C.M. & Jelesciewicz, C. (1989). Absorption <strong>and</strong><br />
metabolism of lysine Maillard products in relation to utilization<br />
of L-lysine. Journal of Agricultural <strong>and</strong> Food Chemistry, 37, 119–<br />
122.<br />
Wallace, P., Marfo, E. & Plahar, W. (1998). Nutritional quality <strong>and</strong><br />
antinutritional composition of four non-conventional leafy vegetables.<br />
Food Chemistry, 61, 287–291.<br />
International Journal of Food Science <strong>and</strong> Technology 2010 Ó 2010 The Authors. Journal compilation Ó 2010 Institute of Food Science <strong>and</strong> Technology
International Journal of Food Science <strong>and</strong> Technology 2010, 45, 1689–1695 1689<br />
Original article<br />
Mango film coated for fresh-cut mango in modified atmosphere<br />
packaging<br />
Rungsinee Sothornvit* & Patratip Rodsamran<br />
Department of Food Engineering ⁄ PHTIC, Faculty of Engineering at Kamphaengsaen ⁄ Center of Excellent for Agricultural <strong>and</strong> Food Machinery,<br />
Kasetsart University, Kamphaengsaen Campus, Nakhonpathom 73140, Thail<strong>and</strong><br />
(Received 10 December 2009; Accepted in revised form 20 May 2010)<br />
Summary Mango puree is known to have good oxygen barrier properties. Therefore, mango film on its own might be<br />
useful to extend the shelf life of fresh-cut mango. In this study, fresh-cut mango was wrapped with mango<br />
film <strong>and</strong> packed in modified atmosphere packaging (MAP). Each package was stored at 30 °C or5°C <strong>and</strong><br />
sensory evaluation was performed to determine its quality <strong>and</strong> shelf life. The shelf life of uncoated <strong>and</strong> coated<br />
fresh-cut mango pieces was 6 days for each at 5 °C <strong>and</strong> was 3 <strong>and</strong> 4 days, respectively, at 30 °C. The sensory<br />
evaluation indicated that coated fresh-cut mango was slower to produce an off-flavour <strong>and</strong> maintained better<br />
visual quality than uncoated mango at 30 °C. Nonetheless, coated fresh-cut mango was softer than uncoated<br />
mango because of the hydrophilic nature of the mango film. No significant difference in the oxygen <strong>and</strong><br />
carbon dioxide concentrations was observed between coated <strong>and</strong> uncoated fresh-cut mango. Coating freshcut<br />
mango with mango film showed a similar effect to MAP in prolonging the shelf life of the fresh produce.<br />
The use of the coating will enhance fruit quality <strong>and</strong> lead to better acceptance by consumers.<br />
Keywords Edible film, firmness, fresh-cut mango, modified atmosphere, sensory evaluation.<br />
Introduction<br />
Mango (Mangifera indica L.) is a major tropical fruit<br />
in the domestic <strong>and</strong> export market of Thail<strong>and</strong>.<br />
Mango cv. Namdok Mai is the most popular variety,<br />
<strong>and</strong> its production ranks first among commercial<br />
mango varieties. Recently, consumers dem<strong>and</strong> healthy<br />
<strong>and</strong> fresh foods including minimal processing or freshcut<br />
fruit. Minimal processing is defined to include all<br />
operations such as washing, sorting, trimming, peeling,<br />
slicing, coring, etc. that would not extensively affect<br />
the fresh-like quality of the produce (Shewfelt, 1987).<br />
Therefore, minimal processing is prepared without<br />
applying any preservation treatment which may<br />
change the characteristics of the product. Minimal<br />
processing is often used for fruits that are difficult to<br />
peel, have a bulky, inedible peel or have objectionable<br />
seeds (Fardiaz et al., 2000). However, one of the most<br />
critical problems in minimally processed products is<br />
the undesirable physiological changes, such as colour,<br />
texture, aroma <strong>and</strong> overall appearance that reduce<br />
their shelf life (Bolin & Huxsoll, 1989; Wong et al.,<br />
1994). Especially, tropical fresh-cut fruits have shorter<br />
*Correspondent: Fax: 66 34351404;<br />
e-mail: fengrns@ku.ac.th<br />
doi:10.1111/j.1365-2621.2010.02316.x<br />
Ó 2010 The Authors. Journal compilation Ó 2010 Institute of Food Science <strong>and</strong> Technology<br />
shelf life than temperate fresh-cut fruits (Gonzalez-<br />
Aguilar et al., 2008). Thus, it is of interest to study<br />
alternative treatments to maintain tropical fresh-cut<br />
fruit quality <strong>and</strong> extend shelf life.<br />
Edible films are used primarily to extend the shelf life<br />
<strong>and</strong> quality of foods by preventing changes in aroma,<br />
taste, texture <strong>and</strong> appearance of foods (Arvanitoyannis,<br />
1999; Tharanathan, 2003). Edible films composed of<br />
polysaccharides <strong>and</strong> proteins have good gas barrier<br />
properties, but poor water barrier properties under<br />
certain relative humidity (RH) <strong>and</strong> temperature conditions<br />
(Guilbert, 1986; Kester & Fennema, 1986; Arvanitoyannis<br />
& Biliaderis, 1998; Petersson & Stading,<br />
2005). This behaviour of edible films presents an<br />
effective semi-permeable barrier to the respiratory gases<br />
(carbon dioxide <strong>and</strong> oxygen) <strong>and</strong> can create the<br />
modified atmosphere (MA) when applied to fruit <strong>and</strong><br />
vegetable (Baldwin, 1994). This MA slows down<br />
respiration, metabolism <strong>and</strong> retard ethylene production;<br />
therefore, edible films can improve the quality <strong>and</strong><br />
extend the shelf life of fruit <strong>and</strong> vegetable (Kader,<br />
1986). Moreover, fruit <strong>and</strong> vegetable purees such as<br />
peach, strawberry, apricot, apple, pear, carrot <strong>and</strong><br />
broccoli have a potential to use as alternative natural<br />
edible film materials (McHugh et al., 1996; McHugh &<br />
Olsen, 2004). They showed significant reduction in
1690<br />
Mango film coated for fresh-cut mango R. Sothornvit <strong>and</strong> P. Rodsamran<br />
moisture loss <strong>and</strong> browning in fresh-cut apples wrapped<br />
in apple puree-based films (McHugh & Senesi, 2000).<br />
However, the study related to the effect of film coating for<br />
fresh-cut mangoes is limited. One study found that when<br />
edible coatings such as carboxymethylcellulose incorporated<br />
with maltodextrin was applied on fresh-cut mangoes,<br />
they showed the highest scores on visual quality <strong>and</strong><br />
favour of mangoes (Plotto et al., 2004). The other study<br />
reported that two commercial film coatings (Gustec <strong>and</strong><br />
SemperFresh) reduced colour changes, firmness loss <strong>and</strong><br />
decay with prevention of undesirable attributes for<br />
Ataulfo fresh-cut mangoes (Gonzalez-Aguilar et al.,<br />
2008). From our previous study, we observed that mango<br />
film exhibited a potential to apply for whole <strong>and</strong> fresh-cut<br />
mangoes (Sothornvit & Rodsamran, 2008). Therefore,<br />
application of films formed by fruit puree on the same<br />
fresh-cut product might benefit both quality <strong>and</strong> shelf life,<br />
without affecting flavour.<br />
Modified atmosphere packaging (MAP) can prolong<br />
shelf life of fresh produce by decreasing oxygen (O2) <strong>and</strong><br />
increasing carbon dioxide (CO 2) concentrations. Each<br />
commodity has its own tolerance limit to the amount of<br />
CO2 <strong>and</strong> O2 concentration. Mostly, minimum O2<br />
concentration <strong>and</strong> maximum CO2 concentration range<br />
in between 0.5–5.0% <strong>and</strong> 2–15%, respectively (Kader,<br />
1992). The O2 <strong>and</strong> CO2 concentrations within MAP<br />
depend on the interaction between commodity respiration<br />
<strong>and</strong> the permeability properties of packaging<br />
material (Beaudry et al., 1992; Kader, 1997). In freshcut<br />
products, MAP is a way to alter metabolism (e.g.<br />
ripening, senescence, cut surface browning, etc.) favourably.<br />
Therefore, the objective of this study was to extend<br />
the application of mango film on fresh-cut mango in<br />
combination with MAP to maintain its quality <strong>and</strong> shelf<br />
life.<br />
Materials <strong>and</strong> methods<br />
Materials<br />
Ripe mangoes (M. indica L.), cv Namdok Mai, obtained<br />
from the local market in Nakhonprathom province<br />
(Thail<strong>and</strong>) were selected <strong>and</strong> cleaned to form mango<br />
puree <strong>and</strong> to prepare fresh-cut mangoes. Ripe mangoes<br />
were 90% mature with 19% total soluble solid<br />
(determined by a portable h<strong>and</strong>-held refractometer,<br />
Model N32, Bellevae, WA, USA) <strong>and</strong> 0.33 N firmness<br />
(determined by a Universal testing machine).<br />
Film formation<br />
To obtain mango puree (19% soluble solid content),<br />
ripe mangoes were washed, peeled, cut into pieces <strong>and</strong><br />
pulped to a mango puree by h<strong>and</strong> followed by sieving.<br />
Mango puree was degassed by applying vacuum to<br />
remove dissolved air. To maintain a constant mass of<br />
solids, 20 g of puree was poured <strong>and</strong> spread evenly by<br />
lifting a plate around in a 15 cm diameter high-density<br />
polyethylene plate. Films were dried in a hot air oven at<br />
a controlled temperature 50 ± 3 °C for 12 h until they<br />
could be released from the plates. The final solid content<br />
of the film was 3.8 g.<br />
Film thickness<br />
Film thickness was measured with a micrometre (No.<br />
7326; Mitutoyo Manufacturing Co., Ltd, Tokyo, Japan)<br />
to the nearest 0.0001 (0.00254 mm) around the filmtesting<br />
area at five r<strong>and</strong>om positions. An average of film<br />
thickness was obtained for each film replicate. Twenty<br />
replicates were used to determine film thickness.<br />
Fresh-cut mango wrapped with mango film<br />
Ripe mangoes were cleaned, peeled <strong>and</strong> cut into<br />
rectangular pieces (approximately 15 · 25 · 15 mm).<br />
Each piece of fresh-cut mango was wrapped with mango<br />
film. The average film thickness was 0.17 ± 0.02 mm.<br />
Both coated <strong>and</strong> uncoated fresh-cut mangoes were kept<br />
in cellophane bags (20 lm of film thickness <strong>and</strong><br />
108 cm 3 lm(m 2 day kPa) )1 of oxygen permeability at<br />
20 °C, 85% RH) with MAP <strong>and</strong> sealed with a heatsealing<br />
machine. The gas mixture was composed of<br />
9.52 ± 0.10% O 2, 0.23 ± 0.02% CO 2 <strong>and</strong> the rest was<br />
N2. Finally, samples were stored in the incubator at<br />
30±2°C (room temperature simulating commercial<br />
conditions in Thail<strong>and</strong>) <strong>and</strong> in a cold room at 5 ± 2 °C<br />
(cold temperature as a normal practice) <strong>and</strong> quality was<br />
evaluated everyday. Three replications were used for<br />
each treatment.<br />
Sensory evaluation<br />
The shelf life of fresh-cut mangoes was determined by<br />
sensory evaluation using a descriptive test (three-point<br />
scale). The panel was made of six semi-trained panellists,<br />
i.e. laboratory staff <strong>and</strong> students whom well acquainted<br />
with sensory evaluation of fresh mango but not specifically<br />
trained on mango testing. All panellists were<br />
familiar with mango attributes. Assessments were carried<br />
out under nature light at a room temperature<br />
28±3°C. Six semi-trained panellists were chosen to<br />
determine the following mango quality attributes:<br />
aroma ⁄ flavour, colour, internal appearance <strong>and</strong> overall<br />
visual quality at the given scores from 1 (=fresh-like), 2<br />
(=acceptable) <strong>and</strong> 3 (=completely deteriorated). At the<br />
beginning of each session, fresh mango was presented to<br />
the judges as a calibration for the ‘fresh-like mango’<br />
attribute before they rated all the attributes of the freshcut<br />
samples during storage. The sample was coded,<br />
presented in r<strong>and</strong>om order, <strong>and</strong> the judges scored each<br />
sample as it was received in each plastic bag. Fresh-cut<br />
International Journal of Food Science <strong>and</strong> Technology 2010 Ó 2010 The Authors. Journal compilation Ó 2010 Institute of Food Science <strong>and</strong> Technology
mangoes were kept in the cellophane bags, which were<br />
opaque; thus, browning (colour change) <strong>and</strong> internal<br />
appearance could not be observed instantly. The first<br />
detectable attribute was flavour, <strong>and</strong> the judges evaluated<br />
the general visual appearance without taste.<br />
Therefore, our protocol for determining the shelf life<br />
of fresh-cut mangoes was based on off-flavour attribute,<br />
followed by colour <strong>and</strong> visual appearance, respectively.<br />
Firmness measurement<br />
Firmness was determined by measuring the force<br />
required for a 2 mm diameter probe to penetrate the<br />
fresh-cut surface, held perpendicular to the probe at<br />
10 mm min )1 compression speed <strong>and</strong> 5 mm depth using<br />
Universal testing machine with 500-N load cell<br />
(LLOYD Instruments, Sussex, UK, model LR 5K).<br />
Five pieces per treatment were r<strong>and</strong>omly selected. Three<br />
replications were used to determine firmness.<br />
Ethanol concentration measurement<br />
Ethanol concentration in the package was determined by<br />
a gas chromatograph (GC; Hewlett Packard-Agilent,<br />
CA, USA, model 6890) with a capillary column, model<br />
HP-FFAP polyethylene glycol TPA, 25 m length,<br />
0.32 mm diameter, 0.50 lm film thickness <strong>and</strong><br />
28 cm s )1 velocity using helium as a carrier gas <strong>and</strong> flame<br />
ionization detector (FID). The injector, oven <strong>and</strong> detector<br />
temperatures were 210, 60 <strong>and</strong> 210 °C, respectively. A<br />
sample of 1 lL was injected into the GC using GC<br />
autosampler syringe, which is a tapered fixed needle with<br />
23–26 s needle gauge, 42 mm length <strong>and</strong> HP tip. A series<br />
of st<strong>and</strong>ard ethanol concentrations (10, 50 <strong>and</strong><br />
100 mg kg )1 ) were used to determine the ethanol concentration.<br />
The calibration curve was constructed from<br />
the linear regression of the st<strong>and</strong>ard ethanol concentrations<br />
<strong>and</strong> the peak area with the correlation of 0.999.<br />
The ChemStation version A05.0X software was used in<br />
the data analysis to calculate the ethanol concentration<br />
from the area of chromatograph. Five pieces per<br />
treatment were r<strong>and</strong>omly selected. Three replications<br />
were used to determine ethanol concentration.<br />
Oxygen <strong>and</strong> carbon dioxide concentration measurement<br />
Oxygen <strong>and</strong> carbon dioxide concentrations in the<br />
package were determined by an oxygen ⁄ carbon dioxide<br />
analyzer (Quantek Instruments, MA, USA, model<br />
902D). The needle was plunged into the package. The<br />
pump was electronically timed to draw in the amount of<br />
sample required for the analysis, <strong>and</strong> then turn itself off<br />
after the preset sampling time (5–10 s). Five pieces per<br />
treatment were r<strong>and</strong>omly selected. Three replications<br />
were used to determine oxygen <strong>and</strong> carbon dioxide<br />
concentrations inside the package.<br />
Mango film coated for fresh-cut mango R. Sothornvit <strong>and</strong> P. Rodsamran 1691<br />
Statistical analysis<br />
A completely r<strong>and</strong>omised experimental design was used<br />
to study coating method <strong>and</strong> storage temperature<br />
factors. spss for Windows software program, Release<br />
9.0.0 (SPSS Inc., 1999) was utilised to calculate analysis<br />
of variance (anova) using the general linear models<br />
procedure. Duncan’s multiple range test was used to<br />
determine significant differences between treatments at<br />
95% confidence interval.<br />
Results <strong>and</strong> discussion<br />
Sensory evaluation<br />
Quality attributes of fresh-cut mango changed with<br />
storage time (Fig. 1). All sensory attributes changed to<br />
unacceptable as storage time increased. Temperature<br />
had greatly significant effects on all sensory attributes<br />
(P £ 0.05).<br />
Off-flavour<br />
High storage temperature increased off-flavour of<br />
coated <strong>and</strong> uncoated mangoes at a faster rate than low<br />
temperature (Fig. 1). Coated <strong>and</strong> uncoated fresh-cut<br />
mangoes had no significant difference on off-flavour at<br />
low-temperature storage. However, coated fresh-cut<br />
mango in MAP was slower off-flavour than uncoated<br />
at room temperature storage. Off-flavour was from<br />
anaerobic respiration which produced <strong>and</strong> released<br />
alcohol <strong>and</strong> acetaldehyde. Low-temperature storage<br />
normally lowers respiration rate <strong>and</strong> reduces off-flavour.<br />
This was similar to the finding in gluten-based <strong>and</strong><br />
composite coating on strawberries (Tanada-Palmu &<br />
Grosso, 2005), commercial edible coating on fresh-cut<br />
mangoes (Gonzalez-Aguilar et al., 2008) <strong>and</strong> mango<br />
film coating on fresh-cut mango without MAP<br />
(Sothornvit & Rodsamran, 2008). This was consistent<br />
with a decrease in O2 <strong>and</strong> an increase in CO2 concentrations<br />
during storage including higher ethanol<br />
concentration at high storage temperature.<br />
Colour<br />
Low-temperature storage lowered browning reaction<br />
which normally occurred with fresh-cut mangoes<br />
(Fig. 1). Cutting allows polyphenoloxidase to come in<br />
contact with phenolic compounds <strong>and</strong> oxygen <strong>and</strong> lead<br />
to tissue browning (Schwimmer, 1978; Brecht, 1995;<br />
Reyes, 1996). Generally, the coating with MAP helped to<br />
prevent fresh-cut produce to exposure to atmospheric,<br />
O 2 <strong>and</strong> low-temperature storage also reduced enzymatic<br />
browning (Gorny et al., 1999). This effect was found in<br />
the reduction of browning in whey protein–coated freshcut<br />
persimmon <strong>and</strong> apple at low-temperature storage<br />
(Perez-Gago et al., 2003a,b). Low-temperature storage<br />
also reduced colour change <strong>and</strong> browning for fresh-cut<br />
Ó 2010 The Authors. Journal compilation Ó 2010 Institute of Food Science <strong>and</strong> Technology International Journal of Food Science <strong>and</strong> Technology 2010
1692<br />
Mango film coated for fresh-cut mango R. Sothornvit <strong>and</strong> P. Rodsamran<br />
(a) (b)<br />
(c)<br />
Figure 1 Sensory evaluation [off-flavour (a), colour (b), internal appearance (c) <strong>and</strong> visual quality (d)] of fresh-cut mango in modified atmosphere<br />
packaging. All sensory aspects were rated in a three-point scale descriptive test; 1 = fresh-like, 2 = acceptable <strong>and</strong> 3 = completely deteriorated.<br />
Error bar shows st<strong>and</strong>ard deviation. UR, uncoated fresh-cut mango at room temperature storage (30 °C); CR, coated fresh-cut mango at room<br />
temperature storage (30 °C); UC, uncoated fresh-cut mango at cold temperature storage (5 °C); CC, coated fresh-cut mango at cold temperature<br />
storage (5 °C).<br />
mango (Tovar et al., 2000) <strong>and</strong> mango puree (Alaka<br />
et al., 2003). However, using mango film had no significant<br />
effect on colour change in this study. Likewise, the<br />
commercial edible coating (SemperFresh) did not show<br />
any significant effect on browning index in fresh-cut<br />
mangoes (Gonzalez-Aguilar et al., 2008).<br />
Internal appearance<br />
Unacceptable internal appearance was defined as the<br />
internal appearance (translucency) similar to what<br />
happens in mangosteen flesh. Temperature significantly<br />
affected the translucency (P £ 0.05). Fresh-cut mango<br />
stored at room temperature was less transparent than<br />
samples stored at low temperature after 2 days because<br />
fresh-cut mango at low temperature is susceptible of<br />
chilling injury which translates into undesirable appearance.<br />
In contrast with other results, coated fresh-cut<br />
mango caused transparent flesh or undesirable appearance<br />
more than uncoated because of the solubility of<br />
mango film. This drawback is being solved by incorporating<br />
lipids to increase the water resistance of mango<br />
film.<br />
(d)<br />
Visual quality<br />
We expected that the excellent oxygen barrier of<br />
mango film would extend the shelf life of fresh-cut<br />
mango. However, it showed that MAP with or without<br />
mango film coating at cold storage extended the<br />
shelf life of fresh-cut mango to 6 days (Fig. 1). Therefore,<br />
coating did not show any difference in the shelf life.<br />
It might be because of the greater effect of MAP over<br />
coating on the quality of fresh-cut mangoes at lowtemperature<br />
storage. Coated fresh-cut mango with<br />
mango film was more pronounced in maintaining the<br />
quality <strong>and</strong> prolonging the shelf life at low-temperature<br />
storage without MAP from 2–3 days of normal marketable<br />
shelf life to 5–6 days when wrapped with mango<br />
film (Sothornvit & Rodsamran, 2008). Moreover, wrapping<br />
extended the shelf life of fresh-cut mango at room<br />
temperature for 2 days comparing to unwrapped mango<br />
without MAP application (Sothornvit & Rodsamran,<br />
2008). This was implied that coating fresh-cut mango<br />
with mango film or edible film shows the similar effect as<br />
MAP in prolonging the shelf life of the fresh produce. In<br />
brief, coating extended fresh-cut mango shelf life from<br />
International Journal of Food Science <strong>and</strong> Technology 2010 Ó 2010 The Authors. Journal compilation Ó 2010 Institute of Food Science <strong>and</strong> Technology
Figure 2 Firmness of fresh-cut mango in modified atmosphere<br />
packaging. Error bar shows st<strong>and</strong>ard deviation. UR, uncoated fresh-cut<br />
mango at room temperature storage (30 °C); CR, coated<br />
fresh-cut mango at room temperature storage (30 °C); UC,<br />
uncoated fresh-cut mango at cold temperature storage (5 °C); CC,<br />
coated fresh-cut mango at cold temperature storage (5 °C).<br />
2–3 days to 4 days at room temperature. Both coated<br />
<strong>and</strong> uncoated fresh-cut mango shelf life were 6 days at<br />
5 °C similar to the shelf life of low methoxypectinglycerol-coated<br />
fresh-cut mango (Fardiaz et al., 2000).<br />
However, shelf life fresh-cut mangoes can change with<br />
cultivars (Gonzalez-Aguilar et al., 2008).<br />
Firmness<br />
Generally, fresh-cut produce lose firmness during storage<br />
time, <strong>and</strong> this was also observed with fresh-cut<br />
mangoes (Fig. 2). Firmness loss in mango has been<br />
attributed to the action of pectolytic enzymes, namely<br />
polygalacturonase <strong>and</strong> pectinesterase on the solubilisation<br />
of pectic substrates (Lakshminarayana, 1980).<br />
Firmness loss was higher degree at low-temperature<br />
storage because of the chilling injury. This result was<br />
consistent with the occurrence of translucency in freshcut<br />
mango. Moreover, coated fresh-cut mango was<br />
softer than uncoated. We previously hypothesised that<br />
solubility of the hydrophilic mango film might cause<br />
diffusion of water to the fruit flesh, resulting in lower<br />
firmness (Sothornvit & Rodsamran, 2008). Furthermore,<br />
the effect of mango film without MAP on firmness<br />
of fresh-cut mango (Sothornvit & Rodsamran, 2008)<br />
was similar to the effect of MAP alone without coating<br />
in this study. This indicates that coating fresh-cut<br />
mango with mango film exhibited the similar effect on<br />
firmness as MAP regardless of temperature storage. The<br />
loss of mango firmness was also found in carboxymethyl<br />
cellulose coatings on fresh-cut mango (Plotto et al.,<br />
2004). Additionally, SemperFresh edible coating showed<br />
no significant protection of firmness loss in fresh-cut<br />
mangoes (Gonzalez-Aguilar et al., 2008). Nonetheless,<br />
Mango film coated for fresh-cut mango R. Sothornvit <strong>and</strong> P. Rodsamran 1693<br />
Figure 3 Ethanol concentration of fresh-cut mango in modified<br />
atmosphere packaging at the end of shelf life. Error bar shows<br />
st<strong>and</strong>ard deviation. UR, uncoated fresh-cut mango at room temperature<br />
storage (30 °C); CR: coated fresh-cut mango at room<br />
temperature storage (30 °C); UC, uncoated fresh-cut mango at<br />
cold temperature storage (5 °C); CC, coated fresh-cut mango at cold<br />
temperature storage (5 °C).<br />
coating fresh-cut mango with mango film might enhance<br />
the acceptance by consumers <strong>and</strong> reduce the loss of ripe<br />
mango during the harvest season.<br />
Ethanol, oxygen <strong>and</strong> carbon dioxide concentrations<br />
Ethanol content in the MAP of fresh-cut mango was<br />
similar for all conditions (3.32 ± 0.96 mg kg )1 ) at the<br />
starting day. Higher-temperature storage induced higher<br />
ethanol content in the package (Fig. 3), resulting in offflavour<br />
at the end of shelf life. There is no threshold level<br />
of ethanol content in fresh-cut mangoes by panellists<br />
(Gonzalez-Aguilar et al., 2008). Thus, the ethanol content<br />
of fresh-cut mango was measured at the end of shelf<br />
life according to the sensory evaluation by panellists in<br />
this study. Coating did not show any significant effect at<br />
5 °C. However, coating showed greater ethanol content<br />
than uncoated at 30 °C. This might be because of the<br />
good oxygen barrier of mango film (Sothornvit &<br />
Rodsamran, 2008) affecting the greater off-flavour as<br />
detected in sensory evaluation. In contrast, the commercial<br />
edible coatings prevented ethanol production in<br />
all three cultivars (Ataulfo, Keitt <strong>and</strong> Kent) at 5 °C<br />
storage (Gonzalez-Aguilar et al., 2008). The different<br />
result might be because of the behaviour of mango<br />
cultivars on the effect of different edible coatings.<br />
Nevertheless, the combination of MAP <strong>and</strong> coating is<br />
still advantageous at cold storage in maintaining the<br />
quality of fresh-cut mango. Moreover, there was a<br />
decrease in oxygen concentration <strong>and</strong> an increase in<br />
carbon dioxide concentration during the storage time in<br />
the MAP (Fig. 4). As known, low oxygen <strong>and</strong> high<br />
carbon dioxide concentrations slow down respiration<br />
<strong>and</strong> retard ethylene production <strong>and</strong> therefore ripening<br />
Ó 2010 The Authors. Journal compilation Ó 2010 Institute of Food Science <strong>and</strong> Technology International Journal of Food Science <strong>and</strong> Technology 2010
1694<br />
Mango film coated for fresh-cut mango R. Sothornvit <strong>and</strong> P. Rodsamran<br />
(Kader, 1986). During storage of mangoes, low levels of<br />
O 2 resulted in abnormal colour development <strong>and</strong><br />
increased ethanol production. Nonetheless, the O2 level<br />
of fresh-cut mangoes in MAP maintained in higher<br />
degree than those without MAP (Sothornvit & Rodsamran,<br />
2008). In this study, no significant difference of<br />
gas concentration was observed between coated <strong>and</strong><br />
uncoated fresh-cut mango samples in MAP.<br />
The correlation between the sensory attributes <strong>and</strong> the<br />
ethanol content was determined. It was found that each<br />
sensory attribute showed a significant correlation with<br />
the ethanol content. The correlations of internal appearance,<br />
off-flavour, visual quality <strong>and</strong> colour with the<br />
ethanol content were 0.675, 0.645, 0.573 <strong>and</strong> 0.543,<br />
respectively. It was confirmed that the unacceptability<br />
from the panellists was because of the ethanol content.<br />
Conclusion<br />
Low-temperature (5 °C) storage of fresh-cut mango<br />
prolonged the retention of desirable quality characteristics.<br />
Interestingly, coated fresh-cut mango extended<br />
shelf life <strong>and</strong> maintained sensory appearance at room<br />
temperature storage better than uncoated regardless of<br />
ethanol content detected. MAP at low-temperature<br />
storage for fresh-cut mango was also appropriate to<br />
keep good quality. Therefore, temperature is a key<br />
factor for fresh-cut mango quality. The timing of<br />
firmness loss <strong>and</strong> the extent of ethanol accumulation<br />
were consistent with the sensory determination at the<br />
end of shelf life. Mango film can function as food<br />
wrappers similar to a seaweed wrapper for sushi or as a<br />
part of packaging materials for a variety of foods such<br />
as confectionery products, nuts, fresh <strong>and</strong> processed<br />
fruits substitute the synthetic packaging materials. It is<br />
suitable for the protection of dried food or refrigerated<br />
food such as frozen carrots from the weight loss <strong>and</strong> the<br />
undesirable appearance such as white spots on carrot<br />
surfaces.<br />
Acknowledgments<br />
The author thanks the Kasetsart University Research<br />
Development Institute (KURDI) <strong>and</strong> the Postharvest<br />
Technology Innovation Center (Thail<strong>and</strong>) for the financial<br />
support throughout this research.<br />
References<br />
Figure 4 Gas concentration of fresh-cut<br />
mango in modified atmosphere packaging for<br />
all storage conditions. UR, uncoated freshcut<br />
mango at room temperature storage<br />
(30 °C); CR, coated fresh-cut mango at room<br />
temperature storage (30 °C); UC, uncoated<br />
fresh-cut mango at cold temperature storage<br />
(5 °C); CC, coated fresh-cut mango at cold<br />
temperature storage (5 °C).<br />
Alaka, O.O., Anina, J.O. & Falade, K.O. (2003). Effect of storage<br />
conditions on the chemical attributes of ‘‘Ogbomoso’’ mango juice.<br />
European Food Research <strong>and</strong> Technology, 218, 79–82.<br />
Arvanitoyannis, I. (1999). Totally <strong>and</strong> partially biodegradable polymer<br />
blends based on natural <strong>and</strong> synthetic macromolecules: preparation,<br />
physical properties <strong>and</strong> potential as food packaging material.<br />
Journal of Macromolecules Science, 39, 205–271.<br />
Arvanitoyannis, I. & Biliaderis, C.G. (1998). Physical properties of<br />
polyol-plasticized edible films made from sodium caseinate <strong>and</strong><br />
soluble starch blends. Food Chemistry, 62, 333–342.<br />
Baldwin, E.A. (1994). Edible coatings for fresh fruits <strong>and</strong> vegetables:<br />
past, present, <strong>and</strong> future. In: Edible Coatings <strong>and</strong> Films to Improve<br />
Food Quality (edited by J.M. Krochta, E.A. Baldwin & M.O.<br />
Nisperos-Carriedo). Pp. 25–64. Pennsylvania: Technomic Publishing<br />
Company.<br />
Beaudry, R.M., Cameron, A.C., Shirazi, A. & Dostal-Lange, D.L.<br />
(1992). Modified-atmosphere packaging of blueberry fruit: effect of<br />
temperature on package O2 <strong>and</strong> CO2. Journal of the American<br />
Society for Horticultural Science, 117, 436–441.<br />
Bolin, H.R. & Huxsoll, C.C. (1989). Storage stability of minimally<br />
processed fruit. Journal of Food Processing <strong>and</strong> Preservation, 13,<br />
281–292.<br />
Brecht, J.K. (1995). Physiology of lightly processed fruits <strong>and</strong><br />
vegetables. HortScience, 30, 18–22.<br />
Fardiaz, D., Setiasih, I.S., Purwadaria, H.K. & Apriyatono, A. (2000).<br />
Quantitative descriptive analysis <strong>and</strong> volatile component analysis of<br />
minimally processed ‘Arumanis’ mango coated with edible film. In:<br />
ACIAR Proceeding 100. Pp. 196–200. Indonesia: Institute Pertanian<br />
Bogor.<br />
Gonzalez-Aguilar, G.A., Celis, J., Sotelo-Mundo, R.R., de la Rosa,<br />
L.A., Rodrigo-Garcia, J. & Alvarez-Parrilla, E. (2008). Physiological<br />
<strong>and</strong> biochemical changes of different fresh-cut mango cultivars<br />
stored at 5 °C. International Journal of Food Science <strong>and</strong> Technology,<br />
43, 91–101.<br />
Gorny, J.R., Hess-Pierce, B. & Kader, A.A. (1999). Quality changes in<br />
fresh-cut <strong>and</strong> nectarine slices as affected by cultivar, storage<br />
International Journal of Food Science <strong>and</strong> Technology 2010 Ó 2010 The Authors. Journal compilation Ó 2010 Institute of Food Science <strong>and</strong> Technology
atmosphere <strong>and</strong> chemical treatment. Journal of Food Science, 64,<br />
429–432.<br />
Guilbert, S. (1986). Technology <strong>and</strong> application of edible protective<br />
films. In: Food Packaging <strong>and</strong> Preservation: Theory <strong>and</strong> Practice<br />
(edited by M. Matholouthi). Pp. 371–394. London: Elsevier Applied<br />
Science Publishing.<br />
Kader, A.A. (1986). Biochemical <strong>and</strong> physical basis of effects of<br />
controlled <strong>and</strong> modified atmospheres on fruits <strong>and</strong> vegetables. Food<br />
Technology, 40, 99–104.<br />
Kader, A.A. (1992). Modified atmospheres during transport <strong>and</strong><br />
storage. In: Postharvest Technology of Horticultural Crops (edited by<br />
A.A. Kader). Pp. 85–92. CA: Division of Agriculture <strong>and</strong> Natural<br />
Resources, University of California.<br />
Kader, A.A. (1997). A summary of CA requirements <strong>and</strong> recommendations<br />
for fruits other than apples <strong>and</strong> pears. In: Fruits Other than<br />
Apples <strong>and</strong> Pears. (edited by A. Kader). Pp. 1–36. Postharvest Hort.<br />
Series No. 17, CA: University of California, CA’97 Proc. 2.<br />
Kester, J.J. & Fennema, O.R. (1986). Edible films <strong>and</strong> coatings. Food<br />
Technology, 40, 47–59.<br />
Lakshminarayana, S. (1980). Mango. In: Tropical <strong>and</strong> Subtropical<br />
Fruits (edited by S. Nagy & P.E. Shaw). Pp. 184–257. Connecticut:<br />
AVI Publishing.<br />
McHugh, T.H. & Olsen, C.W. (2004). Tensile properties of fruit <strong>and</strong><br />
vegetable edible films. United States-Japan Cooperative Program in<br />
Natural Resources, 104–108.<br />
McHugh, T.H. & Senesi, E. (2000). Apple wraps: a novel method to<br />
improve the quality <strong>and</strong> extend the shelf-life of fresh-cut apples.<br />
Journal of Food Science, 65, 480–485.<br />
McHugh, T.H., Huxsoll, C.C. & Krochta, J.M. (1996). Permeability<br />
properties of fruit puree edible films. Journal of Food Science, 61, 88–<br />
91.<br />
Perez-Gago, M.B., Serra, M. & Del Rio, M.A. (2003a). Effect of whey<br />
protein-beeswax edible composite coatings on color change of freshcut<br />
persimmon cv. ‘‘Rojo Brillante’’. Journal of Food Science, 65,<br />
432–436.<br />
Perez-Gago, M.B., Serra, M., Del Rio, M.A., Alonso, M. & Mateos,<br />
M. (2003b). Effect of solid content <strong>and</strong> lipid content of whey<br />
Mango film coated for fresh-cut mango R. Sothornvit <strong>and</strong> P. Rodsamran 1695<br />
protein-beeswax edible composite coatings on color change of freshcut<br />
apple. Journal of Food Science, 68, 1–6.<br />
Petersson, M. & Stading, M. (2005). Water vapour permeability <strong>and</strong><br />
mechanical properties of mixed starch-monoglyceride films <strong>and</strong><br />
effect of film forming conditions. Food Hydrocolloids, 19, 123–132.<br />
Plotto, A., Goodner, K.L., Baldwin, E.A., Bai, J. & Rattanapanone,<br />
N. (2004). Effect of polysaccharide coatings on quality of fresh cut<br />
mangoes (Mangifera indica). Proceedings of the Florida State<br />
Horticultural Society, 117, 382–388.<br />
Reyes, V.G. (1996). Improved preservation systems for minimally<br />
processed vegetables. Food Australia, 48, 87–90.<br />
Schwimmer, S. (1978). Enzyme action <strong>and</strong> modifications of cellular<br />
integrity in fruits <strong>and</strong> vegetables: consequences for food quality<br />
during ripening, senescence <strong>and</strong> processing. In: Postharvest Biology<br />
<strong>and</strong> Biotechnology (edited by H.O. Hultin & M. Milner). Pp. 317–<br />
347. Connecticut: Food <strong>and</strong> Nutrition Press.<br />
Shewfelt, R.L. (1987). Quality of minimally processed fruits <strong>and</strong><br />
vegetables. Journal of Food Quality, 10, 143–156.<br />
Sothornvit, R. & Rodsamran, P. (2008). Effect of a mango film on<br />
quality of whole <strong>and</strong> minimally processed mangoes. Postharvest<br />
Biology <strong>and</strong> Technology, 47, 407–415.<br />
SPSS (1999). SPSS for Windows Release 9.0.0. Chicago, IL: SPSS Inc.<br />
Tanada-Palmu, P.S. & Grosso, C.R.F. (2005). Effect of edible<br />
wheat gluten-based films <strong>and</strong> coatings on refrigerated strawberry<br />
(Fragaria ananassa) quality. Postharvest Biology <strong>and</strong> Technology, 36,<br />
199–208.<br />
Tharanathan, R.N. (2003). Biodegradable films <strong>and</strong> composite coatings:<br />
past, present <strong>and</strong> future. Food Science <strong>and</strong> Technology, 14, 71–<br />
78.<br />
Tovar, B., Ibarra, L.I., Garcia, A.S. & Mata, M. (2000). Some<br />
compositional changes in Kent mango (Mangifera indica) slices<br />
during storage. Journal of Applied Horticulture, 2, 10–14.<br />
Wong, D.W.S., Camir<strong>and</strong>, W.M. & Pavlath, A.E. (1994). Development<br />
of edible coatings for minimally processed fruits <strong>and</strong> vegetables.<br />
In: Edible Coatings <strong>and</strong> Films to Improve Food Quality (edited<br />
by J.M. Krochta, E.A. Baldwin & M.O. Nisperos-Carriedo). Pp. 65–<br />
82. Pennsylvania: Technomic Publishing Company.<br />
Ó 2010 The Authors. Journal compilation Ó 2010 Institute of Food Science <strong>and</strong> Technology International Journal of Food Science <strong>and</strong> Technology 2010
1696<br />
Original article<br />
Influence of pH, NaCl <strong>and</strong> pre-incubation on utilisation of surimi<br />
wash water in generation of antioxidative material by using the<br />
Maillard reaction<br />
Chakree Thongraung* & Sureeporn Kangsanan<br />
Department of Food Technology, Faculty of Agro-Industry, Prince of Songkla University, HatYai, Songkhla, 90112, Thail<strong>and</strong><br />
(Received 24 December 2009; Accepted in revised form 20 May 2010)<br />
Summary Maillard reaction products (MRPs) were generated from reaction mixtures of surimi wash water (SWW)<br />
with glucose or fructose (5%w ⁄ v) heated at 95 °C for 2–12 h. The effects of pH, NaCl <strong>and</strong> pre-incubation of<br />
SWW on the Maillard reaction <strong>and</strong> antioxidant capacity of MRPs were investigated. The antioxidative<br />
capacity of MRPs was determined by measuring free DPPH° radical scavenging activity <strong>and</strong> reducing power.<br />
The highest colour intensity (OD 420) as well as antioxidative capacity was noted in the reaction mixture<br />
containing fructose at pH 9.0. The addition of NaCl (0.5–2.5%w ⁄ v) caused reduction in browning intensity<br />
but enhanced antioxidative capacity of the MRPs. Pre-incubation of SWW at 45 °C for 4 h decreased soluble<br />
protein but increased the Maillard reaction <strong>and</strong> antioxidative capacity of MRPs. A positive effect of salt or<br />
pre-incubation of SWW on the antioxidative capacity of MRPs was not associated with the soluble protein<br />
content in the reaction mixture.<br />
Keywords Maillard reaction, NaCl, pH, pre-incubation, surimi wash water.<br />
Introduction<br />
The annual production of surimi in Thail<strong>and</strong> is about<br />
140 000 tons <strong>and</strong> threadfin bream (Nemipterus sp., TB)<br />
accounts for approximately half of the raw material<br />
used for surimi (Piyadhammaviboon & Yongsawatdigul,<br />
2009). In commercial surimi processing, fish mince<br />
is washed in three times the volume of cold water,<br />
generating 15 L of wash water per kg kilogram of surimi<br />
produced (Durmaz & Alpaslan, 2007). Recovery of<br />
suspended fish muscle particles has been established in<br />
the industry. However, a significant portion of very fine<br />
fish muscle particles remains in the discarded wash water<br />
<strong>and</strong> is disposed along with soluble muscle proteins. The<br />
surimi wash water (SWW) contains about 0.5–2.3%<br />
total protein, which consist mainly of sarcoplasmic<br />
proteins. Consequently, several attempts were performed<br />
to recover these discarded materials <strong>and</strong> to<br />
transform them to higher value products (Huang &<br />
Morrissey, 1998; Mireles DeWitt & Morrissey, 2002).<br />
The Maillard reaction, or non-enzymatic browning,<br />
consists of a complex set of reactions, initially between<br />
carbonyl groups of reducing sugars <strong>and</strong> amino groups<br />
*Correspondent: Fax: +66 74 212889;<br />
e-mail: chakree.t@psu.ac.th<br />
International Journal of Food Science <strong>and</strong> Technology 2010, 45, 1696–1702<br />
from amino acids, peptides or proteins, into subsequent<br />
complex reaction products, collectively known as Maillard<br />
reaction products (MRPs). The reaction contributes<br />
to qualitative attributes such as the colour, aroma <strong>and</strong><br />
taste of thermally treated foods. These MRPs have been<br />
shown to retard lipid oxidation <strong>and</strong> play a role in<br />
extending the shelf-life of several food products (Augustin<br />
et al., 2006; Sun et al., 2007). Their potent inhibitory<br />
activity has been attributed to their free radical<br />
scavenging activity, reducing power <strong>and</strong> metal ion<br />
chelating activities. Thus, some food processing has<br />
been optimised to increase the antioxidative capacity of<br />
the food products via the development of the Maillard<br />
reaction (Durmaz & Alpaslan, 2007; Peralta et al.,<br />
2008). There are numerous factors that influence the<br />
reaction <strong>and</strong> the characteristics <strong>and</strong> properties of the<br />
product. These include types of reducing sugar <strong>and</strong><br />
amino acids ⁄ proteins, pH <strong>and</strong> temperature (Yaylayan<br />
et al., 1993; Villamiel et al., 2006; Lamberts et al., 2008).<br />
However, the Maillard reaction of SWW was not<br />
investigated in detail.<br />
The aim of the present study was thus to investigate<br />
how initial pH, NaCl <strong>and</strong> pre-incubation of SWW<br />
would affect the Maillard reaction of systems containing<br />
SWW. In addition, the effect of these parameters on<br />
antioxidative capacity of MRPs was investigated.<br />
doi:10.1111/j.1365-2621.2010.02318.x<br />
Ó 2010 The Authors. Journal compilation Ó 2010 Institute of Food Science <strong>and</strong> Technology
Materials <strong>and</strong> methods<br />
Materials<br />
SWW from the first washing step of the surimi processing<br />
was obtained from a local surimi plant. The raw<br />
material was threadfin bream (Nemipterus sp., TB). The<br />
wash water was collected after its suspended fish muscle<br />
particles were partially recovered. It was transported to<br />
the laboratory of the Faculty of Agro-Industry, Prince<br />
of Songkla University on ice within 2 h <strong>and</strong> was used<br />
for the experiment on the day of arrival. d-Glucose,<br />
d-fructose <strong>and</strong> 1,1-diphenyl-2-picryl-hydrazyl (DPPH)<br />
were purchased from Sigma ⁄ Aldrich (St Louis, MO,<br />
USA). All other reagents were of analytical grade.<br />
MRPs preparation<br />
Glucose or fructose (5%w ⁄ v) was dissolved in the<br />
SWW. The mixtures were adjusted to pH 5.0, 7.0 or 9.0<br />
with 1 n NaOH or 1 n HCl. All mixtures were heated in<br />
a water bath controlled at 95 °C for 12 h without pH<br />
control. The samples were removed at 1-h intervals <strong>and</strong><br />
placed in an ice bath to cool before centrifugation at<br />
5478 · g for 20 min (Hermel-Z323, Hermle Laboratory,<br />
Ltd., Germany). The resulting supernatants were stored<br />
at 4 °C until they were used for analysis within two<br />
days, otherwise they were stored at )20 °C until they<br />
were used within a month. In addition, sodium chloride<br />
(0.5, 1.0, 1.5, 2.0 or 2.5%w ⁄ v) was added to the SWW<br />
before the Maillard reaction with fructose (5%w ⁄ v) at<br />
pH 9.0 <strong>and</strong> 95 °C. The effect of the added salt on soluble<br />
protein content of sample was evaluated by the Lowry<br />
method (Lowry et al., 1951).<br />
In one experiment, the SWW was incubated at 45 °C<br />
for 12 h. This incubated SWW was removed at 1-h<br />
intervals <strong>and</strong> used for the Maillard reaction with<br />
fructose (5%w ⁄ v) at pH 9.0 as previously described.<br />
The soluble protein in the incubated SWW at a<br />
predetermined heating time was quantified by the Lowry<br />
method (Lowry et al., 1951).<br />
Measurement of browning<br />
The progressive Maillard reaction of the samples was<br />
followed by reading the absorbance at 294 <strong>and</strong> 420 nm<br />
on an UV-visible microplate reader (PowerWaveX,<br />
Biotek, Winooska, VT, USA) after appropriate dilution.<br />
DPPH radical scavenging activity<br />
The DPPH radical scavenging activity of the MRPs was<br />
estimated according to the modified method reported by<br />
Jing & Kitts (2002). A diluted solution of MRPs was<br />
mixed with DPPH in ethanol in the well of a 96-well<br />
microplate to contain 0.3 m DPPH. The absorbance of<br />
the resulting solution was measured at 517 nm using an<br />
UV)visible microplate reader (PowerWaveX, Biotek,<br />
Winooska, VT, USA). Deionised water was used as<br />
control. The capability to scavenge the DPPH radical of<br />
the sample was expressed as the effective concentration<br />
needed to reduce 50% of the initial amount of DPPH°<br />
or EC50.<br />
Ferric reducing power<br />
The reducing power of the samples was determined<br />
according to the method described by Sun et al. (2007).<br />
Diluted solution of MRPs was mixed with deionised<br />
water, sodium phosphate buffer (0.2 m, pH 6.6) <strong>and</strong><br />
potassium ferricyanide (1.0%). The solution obtained<br />
was incubated at 50 °C for 20 min. After trichloroacetic<br />
acid (10%) was added, the solution was centrifuged at<br />
7000 rpm for 5 min (Hermel-Z323, Hermle Laboratory,<br />
Ltd., Germany). The resulting supernatant was mixed<br />
with deionised water <strong>and</strong> ferric chloride (0.1%), <strong>and</strong> the<br />
absorbance was measured at 700 nm.<br />
Statistical analysis<br />
The data in the tables were expressed as mean± SD<br />
(n = 3). Analysis of variance was performed by anova<br />
procedures. Duncan’s new multiple-range test was used<br />
to determine the differences between means.<br />
Results<br />
Antioxidative activity of MRPs C. Thongraung <strong>and</strong> S. Kangsanan 1697<br />
Effect of pH, NaCl <strong>and</strong> pre-incubation of SWW on the<br />
Maillard reaction<br />
The total protein <strong>and</strong> soluble protein content of SWW<br />
used for the Maillard reaction were 0.46 <strong>and</strong><br />
0.17 mg mL )1 , respectively. Adjusting pH of this SWW<br />
from an initial value of 6.83 to 5.0 or 9.0 caused a<br />
reduction <strong>and</strong> an increase in soluble protein by 40% <strong>and</strong><br />
5%, respectively. The absorbance at 294 nm used to<br />
detect intermediate stages of the reaction (Fig. 1a)<br />
increased progressively upon extension of the incubation.<br />
The highest value was found in the sample<br />
containing fructose at pH 9.0. There was a tendency<br />
that the development of intermediate products of the<br />
Maillard reaction levelled off after heating for 8 h. The<br />
significant development of melanoidin, the final stage<br />
Maillard reaction products, as measured by absorbance<br />
at 420 nm (Fig. 1b), was noticed only in the system<br />
containing fructose at pH 9.0. The highest absorbance<br />
value was also recorded after 8 h of heating. While<br />
pigment formation was favoured in the system with<br />
fructose at pH 9.0, browning of the systems at other pH<br />
values <strong>and</strong> systems of glucose remained low.<br />
As shown in Fig. 2, the contribution of NaCl to<br />
the Maillard reaction was verified by using the<br />
Ó 2010 The Authors. Journal compilation Ó 2010 Institute of Food Science <strong>and</strong> Technology International Journal of Food Science <strong>and</strong> Technology 2010
1698<br />
Antioxidative activity of MRPs C. Thongraung <strong>and</strong> S. Kangsanan<br />
OD 294 nm<br />
OD 420 nm<br />
OD 420 nm<br />
16.00<br />
14.00<br />
12.00<br />
10.00<br />
8.00<br />
6.00<br />
4.00<br />
2.00<br />
Fructose pH 7.0 Fructose pH 5 Fructose pH 9<br />
Glucose pH 7.0 Glucose pH 5 Glucose pH 9<br />
0.00<br />
2 4 6 8 10 12<br />
1.00<br />
0.90<br />
0.80<br />
0.70<br />
0.60<br />
0.50<br />
0.40<br />
0.30<br />
0.20<br />
0.10<br />
(a)<br />
(b)<br />
Heating time (h)<br />
0.00<br />
2 4 6 8 10 12<br />
4.00<br />
3.50<br />
3.00<br />
2.50<br />
2.00<br />
1.50<br />
1.00<br />
0.50<br />
0.00<br />
Heating time (h)<br />
w/o Added NaCl 0.5% NaCl 1.0% NaCl<br />
1.5% NaCl 2.0% NaCl 2.5% NaCl<br />
2 4 6 8 10 12<br />
Heating time (h)<br />
SWW-fructose mixture at pH 9.0. The addition of<br />
between 0.5% <strong>and</strong> 1.5% NaCl to the SWW had no<br />
significant effect on the total soluble protein of the<br />
samples. Salt at 2.0%w ⁄ v produced a modest increase<br />
( 2%) in the soluble protein of the sample, whereas the<br />
addition of salt at 2.5% w ⁄ v increased the soluble<br />
protein in SWW by about 8%. The presence of salt in<br />
the reaction mixtures had no significant effect on the<br />
development of OD294 throughout the heating treatment<br />
(data not shown). However, the presence of salt led to<br />
reduction in browning of about 18–29%, depending on<br />
Figure 1 Absorbance at 294 nm (a) <strong>and</strong><br />
420 nm (b) in glucose or fructose-surimi<br />
wash water systems during heating at 95 °C<br />
at pH 5.0, 7.0 <strong>and</strong> 9.0.<br />
Figure 2 Effect of NaCl on absorbance at<br />
420 nm in fructose-surimi wash water<br />
during heating at 95 °C at pH 9.0.<br />
the concentration of added salt <strong>and</strong> the duration of<br />
heating (Fig. 2). There were no significant differences<br />
(P > 0.05) in effect among samples with different salt<br />
concentrations although the mixture with 0.5% w ⁄ v salt<br />
exhibited the lowest average OD420.<br />
Pre-incubation at 45 °C caused a sharp reduction in<br />
soluble protein in SWW during the first 2 h of the preincubation;<br />
thereafter, there were no significant changes<br />
in soluble protein. By the 12th h of pre-incubation, the<br />
soluble protein content of SWW was about 74% of<br />
initial concentration. The Maillard reaction of SWW<br />
International Journal of Food Science <strong>and</strong> Technology 2010 Ó 2010 The Authors. Journal compilation Ó 2010 Institute of Food Science <strong>and</strong> Technology
OD 420 nm<br />
1.00<br />
0.90<br />
0.80<br />
0.70<br />
0.60<br />
0.50<br />
0.40<br />
0.30<br />
0.20<br />
0.10<br />
0.00<br />
Heating time 6 h<br />
Heating time 8 h<br />
Heating time 10 h<br />
0 2 4 6 8 10 12<br />
Pre-incubation time (h)<br />
Figure 3 Effect of pre-incubation of surimi wash water at 45 °C on<br />
browning intensity of MRPs by heating at 95 °C <strong>and</strong> during a reaction<br />
time of 6, 8 or 10 h.<br />
with fructose at pH 9.0 <strong>and</strong> 95 °C was enhanced by<br />
using the pre-incubated SWW with respect to that of the<br />
system using non-incubated wash water (Fig. 3).<br />
Effect of pH, NaCl <strong>and</strong> pre-incubation of SWW on<br />
antioxidative capacity of MRPs<br />
The effects of the initial pH values of the reaction<br />
mixtures on the antioxidative capacities of MRPs are<br />
shown in Fig. 4. A drastic reduction in EC50 of DPPH<br />
radical scavenging activity occurred during the first 4 h<br />
of heating, after which it slightly decreased with heating<br />
time up to 12 h (Fig. 4a). The reduction in EC50 indicated increasing in effectiveness of the MRPs to<br />
scavenge the DPPH radicals. The development patterns<br />
of DPPH radical scavenging activity of the systems<br />
containing fructose <strong>and</strong> glucose were similar, but the<br />
activity of the former system was about 2–4 times<br />
higher. The development of the reducing power of<br />
MRPs (Fig. 4b) showed similar trends with those of<br />
intensity of brownness (Fig. 1) <strong>and</strong> free radical scavenging<br />
activity (Fig. 4a). The systems containing fructose<br />
exhibited greater reducing power than the glucose<br />
systems throughout the incubation period. The results<br />
revealed that strong antioxidative activities of MRPs<br />
could be prepared by using fructose at pH 9.0.<br />
The DPPH scavenging activity <strong>and</strong> reducing power of<br />
MRPs prepared from the SWWs with added salt <strong>and</strong><br />
5% w ⁄ v fructose at pH 9.0 are shown in Fig. 5. The<br />
addition of salt at 0.5 <strong>and</strong> 2.0% w ⁄ v lowered the radical<br />
scavenging activity of MPRs. However, after 4 h of<br />
heating, their activity was not significantly different<br />
from that of the control. Whereas salt at concentrations<br />
of 1.0%, 1.5% <strong>and</strong> 2.5%w ⁄ v promoted the development<br />
of stronger radical scavenging activity than those of the<br />
control <strong>and</strong> the other samples. In contrast, the reducing<br />
power of the system with added salt increased significantly<br />
(P < 0.05) upon extending the heating (Fig. 5b).<br />
(a)<br />
100<br />
DPPH Scavenging activity (EC50%)<br />
90<br />
80<br />
70<br />
60<br />
50<br />
40<br />
30<br />
20<br />
10<br />
0<br />
(b)<br />
4.0<br />
OD 700 nm<br />
Antioxidative activity of MRPs C. Thongraung <strong>and</strong> S. Kangsanan 1699<br />
3.5<br />
3.0<br />
2.5<br />
2.0<br />
1.5<br />
1.0<br />
0.5<br />
Fructose pH 5 Glucose pH 5<br />
Fructose pH 7 Glucose pH 7<br />
Fructose pH 9 Glucose pH 9<br />
2 4 6 8 10 12<br />
Heating time (h)<br />
0.0<br />
2 4 6 8 10 12<br />
Heating time (h)<br />
Figure 4 DPPH scavenging activity (a) <strong>and</strong> reducing power (b) of<br />
MRPs prepared by heating the mixtures of glucose or fructose-surimi<br />
wash water at pH 5.0, 7.0 or 9.0 <strong>and</strong> at 95 °C.<br />
Salt at 2.0% <strong>and</strong> 2.5%w ⁄ v increased noticeably the<br />
reducing power of MRPs relative to that of the control<br />
<strong>and</strong> other samples.<br />
Figure 6a depicts the EC50 of DPPH scavenging<br />
activity of the MRPs prepared by heating the preincubated<br />
SWW with fructose at pH 9.0 <strong>and</strong> 95 °C for 6,<br />
8 or 10 h. The pre-incubation showed either strengthened<br />
or deteriorated effects on the scavenging activity of<br />
MRPs. The strongest free radical scavenging activity of<br />
MRPs was obtained by using the 3rd-h-incubated SWW<br />
<strong>and</strong> heating for 10 h. The pre-incubation exhibited<br />
similar effect on the development of reducing power<br />
(Fig. 6b). The greatest enhancing effect (about a 10%<br />
increase) was also found in MRPs obtained by using the<br />
3rd-h-incubated SWW <strong>and</strong> a reaction time of 10 h.<br />
Discussion<br />
The results of this study revealed that SWW could be<br />
used as a starting material for the Maillard reaction. A<br />
positive correlation between antioxidative capacity <strong>and</strong><br />
the browning intensity of the Maillard systems is well<br />
documented (Fuster et al., 2000; Yanagimoto et al.,<br />
Ó 2010 The Authors. Journal compilation Ó 2010 Institute of Food Science <strong>and</strong> Technology International Journal of Food Science <strong>and</strong> Technology 2010
1700<br />
Antioxidative activity of MRPs C. Thongraung <strong>and</strong> S. Kangsanan<br />
DPPH Radical scavenging activity<br />
(EC50%) OD 700 nm<br />
7<br />
6<br />
5<br />
4<br />
3<br />
2<br />
1<br />
w/o Added NaCl 0.5% NaCl<br />
1.0% NaCl 1.5% NaCl<br />
2.0% NaCl 2.5% NaCl<br />
0<br />
2 4 6 8 10 12<br />
Heating time (h)<br />
8<br />
7<br />
6<br />
5<br />
4<br />
3<br />
(a)<br />
(b)<br />
2<br />
2 4 6 8 10 12<br />
Heating time (h)<br />
Figure 5 Effect of NaCl on DPPH radical scavenging activity (a) <strong>and</strong><br />
reducing power (b) of MRPs prepared by heating the fructose-surimi<br />
wash water at pH 9.0 <strong>and</strong> 95 °C.<br />
2002; Hidalgo et al., 2003). Although there have been<br />
some reports on loss of colour intensity <strong>and</strong> antioxidative<br />
capacity of MRPs because of the extension of the<br />
heating time (Ehling & Shibamoto, 2005). The proposed<br />
mechanisms are the precipitation of high molecular<br />
weight melanoidins caused by the lengthening of the<br />
heating time <strong>and</strong> the transformation of small polymers<br />
with antioxidative activity into higher polymers with<br />
less ⁄ no antioxidative activity (Gue´rard & Sumaya-<br />
Martinez, 2003; Hidalgo et al., 2003). It is, however,<br />
unclear if these mechanisms account for the stationary<br />
development of the browning intensity (Fig. 1) <strong>and</strong><br />
antioxidative activity of MRPs (Fig. 4) after heating for<br />
8 h in this study. It is worth mentioning that significant<br />
amounts of pellets were decanted from all reaction<br />
mixtures.<br />
That pH affects the rate <strong>and</strong> extent of the Maillard<br />
reaction <strong>and</strong> that alkaline condition favours the reaction<br />
progress are well established (Ashoor & Zent, 1984;<br />
Br<strong>and</strong>s et al., 2000; Davidek et al., 2002). The general<br />
mechanism proposed relay on an increase in availability<br />
of acyclic form, a high reactivity form, of reducing sugar<br />
under alkaline pH. The explanation also underlines a<br />
strong reactivity of fructose with respect to that of<br />
DPPH Radical scavenging activity<br />
(EC50 ,%)<br />
OD 700 nm<br />
8<br />
7<br />
6<br />
5<br />
4<br />
3<br />
2<br />
1<br />
0<br />
5.00<br />
4.50<br />
4.00<br />
3.50<br />
3.00<br />
2.50<br />
2.00<br />
(a)<br />
(b)<br />
Heating time 6 h Heating time 8 h Heating time 10 h<br />
1 2 3 4 5 6 7<br />
Pre-incubation time (h)<br />
1 2 3 4 5 6 7<br />
Pre-incubation time (h)<br />
Figure 6 Effect of pre-incubation of surimi wash water at 45 °C on<br />
DPPH radical scavenging activity (a) <strong>and</strong> reducing power (b) of MRPs<br />
prepared by heating the fructose-surimi wash water at pH 9.0 <strong>and</strong><br />
95 °C during a reaction time of 6, 8 or 10 h.<br />
glucose of this study. Moreover, alkaline pH was also<br />
favour the degradation of Amadori compound in both<br />
buffered <strong>and</strong> non-buffered aqueous systems with an<br />
enhancing effect on the concomitant development of<br />
browning (Davidek et al., 2002). Furthermore, the<br />
difference in brown colour intensity observed in the<br />
systems of fructose <strong>and</strong> glucose of this study could be<br />
partly explained by the contribution of some caramelisation<br />
reaction products to the absorbance values.<br />
Aj<strong>and</strong>ouz et al. (2001) found that the caramelisation<br />
rate of these sugars during heating at 100 °C was<br />
increased by the increasing of medium pH particularly<br />
in the pH range 8.0–12.0, <strong>and</strong> fructose showed a greater<br />
reactivity with respect to that of glucose. Significant<br />
difference in browning development at pH 9.0 among<br />
the systems having identical soluble protein but with<br />
different sugar thus highlighted the difference in reactivity<br />
of each reducing sugar on the Maillard browning.<br />
Our observation on the effect of salt on browning was<br />
in line with findings by Kwak & Lim (2004) <strong>and</strong> Rizzi<br />
(2008). In the amino acid model systems, the effect of salt<br />
on inhibiting the browning of MRPs was increased with<br />
the increasing of its concentration, <strong>and</strong> at a concentration<br />
of 1%w ⁄ v its effect was dependent on the type of<br />
amino acid. A reduction in the colour intensity of the<br />
samples in the presence of salt is indicative of the<br />
International Journal of Food Science <strong>and</strong> Technology 2010 Ó 2010 The Authors. Journal compilation Ó 2010 Institute of Food Science <strong>and</strong> Technology
decreasing in the polymerisation extent of the preformed<br />
intermediate MRPs. In contrast, the addition of salt<br />
enhanced the antioxidative capacity of the MRPs suggesting<br />
that some mechanistic differences most likely<br />
exist among the systems with <strong>and</strong> without NaCl. It is<br />
likely that salt favours the reaction route that produces<br />
products having strong antioxidative capacity. However,<br />
more research is necessary to validate this hypothesis.<br />
Although an extensive development of browning<br />
colour was noticed by using pre-incubated SWW<br />
(Fig. 3), this positive effect could not be explained by<br />
the availability of soluble protein (Fig. S1). Since SWW<br />
contains 0.25% w ⁄ v lipid, the oxidation of lipid could be<br />
stimulated as development of a strong fishy odour was<br />
noticed during prolonged pre-incubation. These would<br />
cause an accumulation of preformed carbonyl compounds.<br />
Apart from the carbonyl group of reducing<br />
sugar, Amadori compounds can react with other<br />
carbonyls especially the oxidised lipid, <strong>and</strong> the same<br />
products are frequently produced by identical or very<br />
similar reaction pathways (Zamora & Hidalgo, 2005).<br />
Even if the observation implies the existence of oxidised<br />
lipids, further study is necessary to obtain confirmation<br />
of an explicit contribution of lipid oxidation to the<br />
Maillard reaction.<br />
Maillard reaction yield products based on specific time<br />
temperature <strong>and</strong> pressure of the heating process. These<br />
are commonly used in the industry <strong>and</strong> its process may<br />
be engineered by controlling heating condition. In this<br />
work, prolonged heating at 1 atm may be replaced with<br />
shorter heating time at higher static pressure. Therefore,<br />
heating time can be greatly reduced <strong>and</strong> the more<br />
process economical. Practical use may include developing<br />
antioxidative supplements that are meat base <strong>and</strong><br />
can be used together with a meal e.g. soup, main course.<br />
Acknowledgments<br />
This study was supported in part by the Prince of<br />
Songkla University <strong>and</strong> the Agricultural Research<br />
Development Center (ARDA). Authors are also grateful<br />
to the ARDA for manuscript preparation.<br />
References<br />
Aj<strong>and</strong>ouz, E.H., Tchiakpe, L.S., Dalle Ore, F., Benajiba, A. &<br />
Puigserver, A. (2001). Effects of pH on caramelization <strong>and</strong> maillard<br />
reaction kinetics in fructose-lysine model systems. Journal of Food<br />
Science, 66, 926–931.<br />
Ashoor, S.H. & Zent, J.B. (1984). Maillard browning of common<br />
amino acids <strong>and</strong> sugars. Journal of Food Science, 49, 1206–1207.<br />
Augustin, M.A., Sanguansri, L. & Bode, O. (2006). Maillard reaction<br />
products as encapsulants for fish oil powders. Journal of Food<br />
Science, 71, E25–E32.<br />
Br<strong>and</strong>s, C.M.J., Alink, G.M., Van Boekel, M.A.J.S. & Jongen,<br />
W.M.F. (2000). Mutagenicity of heated sugar-casein systems; effect<br />
of the Maillard reaction. Journal of Agricultural <strong>and</strong> Food Chemistry,<br />
48, 2271–2275.<br />
Antioxidative activity of MRPs C. Thongraung <strong>and</strong> S. Kangsanan 1701<br />
Davidek, T., Clety, N., Aubin, S. & Blank, I. (2002). Degradation of<br />
the amadori compound N-(1-Deoxy-d-fructos-1-yl)glycine in aqueous<br />
model systems. Journal of Agricultural <strong>and</strong> Food Chemistry, 50,<br />
5472–5479.<br />
Durmaz, G. & Alpaslan, M. (2007). Antioxidant properties of roasted<br />
apricot (Prunus armeniaca L.) kernel. Food Chemistry, 100, 1177–<br />
1181.<br />
Ehling, S. & Shibamoto, T. (2005). Correlation of acrylamide<br />
generation in thermally processed model systems of asparagine<br />
<strong>and</strong> glucose with color formation, amounts of pyrazines formed, <strong>and</strong><br />
antioxidative properties of extracts. Journal of Agricultural <strong>and</strong> Food<br />
Chemistry, 53, 4813–4819.<br />
Fuster, M.D., Mitchell, A.E., Ochi, H. & Shibamoto, T. (2000).<br />
Antioxidative activities of heterocyclic compounds formed in<br />
brewed coffee. Journal of Agricultural <strong>and</strong> Food Chemistry, 48,<br />
5600–5603.<br />
Guérard, F. & Sumaya-Martinez, M.-T. (2003). Antioxidant effects of<br />
protein hydrolysates in the reaction with glucose. Journal of the<br />
American Oil Chemists’ Society, 80, 467–470.<br />
Hidalgo, F.J., Nogales, F. & Zamora, R. (2003). Effect of the pyrrole<br />
polymerization mechanism on the antioxidative activity of nonenzymatic<br />
browning reactions. Journal of Agricultural <strong>and</strong> Food<br />
Chemistry, 51, 5703–5708.<br />
Huang, L. & Morrissey, M.T. (1998). Fouling of membranes during<br />
microfiltration of surimi wash water: roles of pore blocking <strong>and</strong><br />
surface cake formation. Journal of Membrane Science, 144, 113–<br />
123.<br />
Jing, H. & Kitts, D.D. (2002). Chemical <strong>and</strong> biochemical properties of<br />
casein-sugar Maillard reaction products. Food <strong>and</strong> Chemical Toxicology,<br />
40, 1007–1015.<br />
Kwak, E.J. & Lim, S.I. (2004). The effect of sugar, amino acid, metal<br />
ion, <strong>and</strong> NaCl on model Maillard reaction under pH control. Amino<br />
Acids, 27, 85–90.<br />
Lamberts, L., Rombouts, I. & Delcour, J.A. (2008). Study of<br />
nonenzymic browning in [alpha]-amino acid <strong>and</strong> [gamma]aminobutyric<br />
acid ⁄ sugar model systems. Food Chemistry, 111,<br />
738–744.<br />
Lowry, O.H., Rosebrough, N.J., Farr, A.L. & R<strong>and</strong>all, R.J. (1951).<br />
Protein measurement with the Folin reagent. Journal of Biological<br />
Chemistry, 193, 265–275.<br />
Mireles Dewitt, C.A. & Morrissey, M.T. (2002). Pilot plant recovery of<br />
catheptic proteases from surimi wash water. Bioresource Technology,<br />
82, 295–301.<br />
Peralta, E.M., Hatate, H., Kawabe, D. et al. (2008). Improving<br />
antioxidant activity <strong>and</strong> nutritional components of Philippine saltfermented<br />
shrimp paste through prolonged fermentation. Food<br />
Chemistry, 111, 72–77.<br />
Piyadhammaviboon, P. & Yongsawatdigul, J. (2009). Protein crosslinking<br />
ability of sarcoplasmic proteins extracted from threadfin<br />
bream. LWT – Food Science <strong>and</strong> Technology, 42, 37–43.<br />
Rizzi, G.P. (2008). Effects of cationic species on visual color formation<br />
in model maillard reactions of pentose sugars <strong>and</strong> amino Acids.<br />
Journal of Agricultural <strong>and</strong> Food Chemistry, 56, 7160–7164.<br />
Sun, Y., Hayakawa, S., Ogawa, M. & Izumori, K. (2007). Antioxidant<br />
properties of custard pudding dessert containing rare hexose,<br />
d-psicose. Food Control, 18, 220–227.<br />
Villamiel, M., Del Castillo, D. & Corzo, N. (2006). Browning<br />
reactions. In: Food Biochemistry <strong>and</strong> Food Processing (edited by<br />
Y.H. Hui, W.-K. Nip, L.M.L. Nollet, G. Paliyath & B.K. Simpson).<br />
Pp. 71–100. Oxford, UK: Blackwell.<br />
Yanagimoto, K., Lee, K.-G., Ochi, H. & Shibamoto, T. (2002).<br />
Antioxidative activity of heterocyclic compounds found in coffee<br />
volatiles produced by maillard reaction. Journal of Agricultural <strong>and</strong><br />
Food Chemistry, 50, 5480–5484.<br />
Yaylayan, V.A., Ismail, A.A. & M<strong>and</strong>eville, S. (1993). Quantitative<br />
determination of the effect of pH <strong>and</strong> temperature on the keto form<br />
of -fructose by FT IR spectroscopy. Carbohydrate Research, 248,<br />
355–360.<br />
Ó 2010 The Authors. Journal compilation Ó 2010 Institute of Food Science <strong>and</strong> Technology International Journal of Food Science <strong>and</strong> Technology 2010
1702<br />
Antioxidative activity of MRPs C. Thongraung <strong>and</strong> S. Kangsanan<br />
Zamora, R. & Hidalgo, F.J. (2005). Coordinate contribution of lipid<br />
oxidation <strong>and</strong> maillard reaction to the nonenzymatic food browning.<br />
Critical Reviews in Food Science <strong>and</strong> Nutrition, 45, 49–59.<br />
Supporting Information<br />
Additional Supporting Information may be found in the<br />
online version of this article:<br />
Figure S1. Effect of pre-incubation of surimi wash<br />
water at 45 °C on soluble protein in surimi wash water.<br />
Please note: Wiley-Blackwell are not responsible for<br />
the content or functionality of any supporting materials<br />
supplied by the authors. Any queries (other than missing<br />
material) should be directed to the corresponding author<br />
for the article.<br />
International Journal of Food Science <strong>and</strong> Technology 2010 Ó 2010 The Authors. Journal compilation Ó 2010 Institute of Food Science <strong>and</strong> Technology
International Journal of Food Science <strong>and</strong> Technology 2010, 45, 1703–1709 1703<br />
Original article<br />
Equilibrium moisture content <strong>and</strong> heat of desorption of saffron<br />
Hamid Reza Gazor 1 * & Hossein Chaji 2<br />
1 Agricultural Engineering Research Institute, Ministry of Agriculture, PO Box 31585-845, Karaj, Iran<br />
2 Center of Agriculture <strong>and</strong> Natural Resources of Khorasan Razavi Province, Ministry of Agriculture, Mashhad, Iran<br />
(Received 9 February 2010; Accepted in revised form 20 May 2010)<br />
Summary The equilibrium moisture contents of saffron (Crocus sativus L.) stigmas were determined experimentally<br />
using the st<strong>and</strong>ard gravimetric method at temperatures 30, 45 <strong>and</strong> 60 °C <strong>and</strong> water activity ranging from<br />
11% to 83%. The sorption isotherm curves of saffron were sigmoidal in shape <strong>and</strong> decreased with increased<br />
temperature at constant relative humidity. Five selected isotherm models GAB, modified Henderson,<br />
modified Chung-Pfost, modified Halsaey <strong>and</strong> modified Oswin were tested to fit the experimental isotherm<br />
data. Modified Oswin <strong>and</strong> modified Henderson models were found acceptable for predicting desorption<br />
moisture isotherms <strong>and</strong> fitting to the experimental data, respectively. The isosteric heats of desorption,<br />
determined from equilibrium data using the Clausius-Clapeyron equation, were found to be a function of<br />
moisture content. The net isosteric heat of desorption of saffron varied between 1.38 <strong>and</strong> 5.38 kJ mol )1 at<br />
moisture content varying between 2% <strong>and</strong> 20% (d.b).<br />
Keywords Desorption isotherms, equilibrium moisture content, isosteric heat of sorption, saffron.<br />
Introduction<br />
Saffron, the dried stigmas of a flower scientifically<br />
identified as Crocus sativus L., is one of the most<br />
expensive agricultural products. It has been named as<br />
‘red gold’ because of its high economic value. Although<br />
the source of saffron is historically unknown, it apparently<br />
originated in the area of Iran, Turkey <strong>and</strong> Greece<br />
(Bol<strong>and</strong>i & Ghoddusi, 2006; Caballero-Ortega et al.,<br />
2007). While the world’s total annual saffron production<br />
is estimated to be 190 tons, Iran produces about 90% of<br />
the total, accounting for 150–170 tons per year, <strong>and</strong><br />
50 000 ha is already under cultivation with this crop.<br />
This spice is appreciated for its unique colour, bitter<br />
taste <strong>and</strong> aroma, which are the main characteristics<br />
showing its quality (Bol<strong>and</strong>i & Ghoddusi, 2006; Caballero-Ortega<br />
et al., 2007). Drying using microwave oven<br />
appears to be a suitable way to achieve a high quality for<br />
saffron but it is costly. The market value potential <strong>and</strong><br />
farmer interest should be further evaluated (Bol<strong>and</strong>i &<br />
Ghoddusi, 2006). To arrive at a conclusion, the drying<br />
<strong>and</strong> storage conditions are of great importance because<br />
they determine the quality add <strong>and</strong> hence economic<br />
value of the final product (Winterhalter & Straubinger,<br />
2000; Bol<strong>and</strong>i & Ghoddusi, 2006). The stability of<br />
saffron pigments is dependent on the storage conditions<br />
employed. Both increasing temperature <strong>and</strong> water<br />
activity exert a strong influence on the degradation<br />
*Correspondent: E-mail: hgazor@yahoo.com<br />
doi:10.1111/j.1365-2621.2010.02321.x<br />
Ó 2010 Institute of Food Science <strong>and</strong> Technology<br />
kinetics, accelerating the rate of pigment decomposition<br />
(Tsimidou & Biliaderis, 1997; Winterhalter & Straubinger,<br />
2000).<br />
Water activity is a term used to indicate the relation<br />
between a food <strong>and</strong> the equilibrium relative humidity of<br />
the surrounding atmosphere (Barbosa-Ca´novas & Vega-<br />
Mercado, 1996). The equilibrium moisture content is<br />
dependent upon the temperature <strong>and</strong> related humidity<br />
of the environment as well as species, variety <strong>and</strong><br />
maturity of the plant (Iglesias & Chirife, 1982; Rahman,<br />
1995). Accurate information on equilibrium moisture<br />
contents of saffron stigma at various relative humidity<br />
<strong>and</strong> drying temperatures is not available in the literature.<br />
There is also a need for comprehensive study of the<br />
equilibrium moisture contents of saffron stigma to<br />
underst<strong>and</strong> its drying behaviour. The net isosteric heat<br />
of sorption is also an important information for drying.<br />
It can be used to determine the energy requirements <strong>and</strong><br />
provide information on the state of water within the<br />
dried product (Mujumdar, 2000). The moisture content<br />
level of a product at which the net isosteric heat of<br />
sorption reaches the value of latent heat of sorption is<br />
often considered as the indication of the amount of<br />
bound water existing in the product (Wang & Brennan,<br />
1991). The five empirically models Guggenheim-<br />
Anderson-de Boer (GAB), modified Henderson, modified<br />
Chung-Pfost, modified Halsaey <strong>and</strong> modified Oswin<br />
are the most commonly used models for sorption<br />
isotherm determination of food materials (Chen, 2000;<br />
Janjai et al., 2006; Ghodake et al., 2007).
1704<br />
Equilibrium moisture contents of saffron H. R. Gazor <strong>and</strong> H. Chaji<br />
The objectives of this research were the following:<br />
• Determination of the effect of temperature on the<br />
moisture desorption isotherms of saffron stigmas that<br />
here in by abbreviated to saffron in the paper.<br />
• Analysis of the data with the help of five sorption<br />
isotherm models available in the literature <strong>and</strong> find the<br />
most suitable model describing the desorption isotherms<br />
of saffron.<br />
• Calculation of the net isosteric heat of desorption of<br />
moisture from the experimental data.<br />
Materials <strong>and</strong> methods<br />
Experimental procedure<br />
The dried saffron was supplied from a farm in Qaen<br />
(Southern Khorasan province, Iran). Fresh saffron<br />
stigmas were dried at room temperature in the shadow<br />
previously. Naturally dried saffron was conditioned with<br />
distilled water in refrigerator at temperature 4 °C for<br />
2 weeks. Toluene was used in sample preparation to<br />
avoid sample spoilage. The initial moisture content of<br />
the conditioned samples was determined by using the<br />
st<strong>and</strong>ard method number 259-2 (103±2 °C 16 h). It was<br />
found about 54 (% d.b) at experiments start time (ISIR,<br />
2004).<br />
The sorption method used was the static gravimetric<br />
technique, which is based on the use of saturated salt<br />
solutions to maintain a fixed relative humidity when the<br />
equilibrium is reached. The water activity of the food is<br />
identical to the relative humidity of the atmosphere at<br />
equilibrium conditions, <strong>and</strong> the mass transfer between<br />
the product <strong>and</strong> the ambient atmosphere is assured by<br />
natural diffusion of the water vapour. Equilibrium<br />
relative humidity can be present as per cent of water<br />
activity (Rahman, 1995). Seven saturated salt solutions<br />
(Table 1) were prepared corresponding to a wide range<br />
of water activities ranging from 0.11 to 0.83 (Greenspan,<br />
1977; Labuza et al., 1985; Adam et al., 2000).<br />
Table 1 Equilibrium relative humidity of saturated salt solutions at 30,<br />
40, 50 <strong>and</strong> 60 °C*<br />
Salt solutions<br />
Temperature (°C)<br />
30 40 50 60<br />
LiCl 0.1128 0.1121 0.111 0.1095<br />
CHC 3COOK 0.2161 0.204 0.192 0.180<br />
MgCl 2Æ6H 2O 0.324 0.316 0.305 0.293<br />
K2CO3 0.431 0.4330 0.4269 0.4212<br />
Mg(NO3)2 0.514 0.4842 0.4544 0.473<br />
NaCl 0.751 0.747 0.7434 0.745<br />
KaCl 0.836 0.823 0.812 0.8025<br />
*Greenspan (1977); Labuza et al. (1985).<br />
Figure 1 Precision oven <strong>and</strong> sealed glass bottles that used in the<br />
experiments.<br />
Seven sealed glass bottles were used in this research.<br />
Each bottle was provided with a sample holder that was<br />
hanged up in there. Sample holder was kept above<br />
saturated salt solutions to avoid contact of the salt<br />
solution with it. For each of these experiments, about<br />
1.5 g of saffron stigma was taken into the respective<br />
weighing cups. All these seven bottles were put in an<br />
oven with precision 1 °C <strong>and</strong> circulation fan (Fig. 1.)<br />
The loss in weights of all these samples in each bottle<br />
was monitored daily after 10 days. The Equilibrium<br />
Moisture Content (EMC) was acknowledged when three<br />
consecutive weight measurements showed a difference of<br />
Table 2 Sorption isotherm models<br />
Equations Models<br />
hr ¼ exp½ expðC1 þ C2tÞM C3<br />
e Š Modified-Halsey<br />
1 hr ¼ exp½ C1ðt þ C2ÞM C3<br />
e Š Modified Henderson<br />
hr ¼ 1<br />
Modified-Oswin<br />
1þ½ðC1þC2tÞ=MeŠ C3 hr ¼ exp½<br />
C1<br />
tþC2 expð C3MeÞŠ Modified Chung–Pfost<br />
M0C1C2hr<br />
Me ¼ ð1 C2hrÞð1 C2hrþC1C2hrÞ GAB<br />
parameters of the models were determined by least<br />
square estimation <strong>and</strong> STATISTICA software (StatSoft,<br />
Inc, Tulsa, Oklahoma, USA) (version 6.0, 2001).<br />
In this table hr is the relative humidity (decimal), Me is<br />
the equilibrium moisture content or EMC (% d.b) M 0<br />
monolayer moisture content (% d.b), t is the temperature<br />
(°C) <strong>and</strong> C1, C2, C3 are coefficients of models.<br />
The parameters C 1 <strong>and</strong> C 2 in GAB model could be<br />
correlated with temperature using the following Arrhenius-type<br />
equations (Jamali et al., 2006):<br />
C1 ¼ C0 expð DHc<br />
Þ ð1Þ<br />
RT<br />
C2 ¼ K0 expð DHk<br />
Þ ð2Þ<br />
RT<br />
In these equations DHc, the enthalpy difference between<br />
monolayer <strong>and</strong> multilayer sorption (J mol )1 ), DH k the<br />
difference between heat of condensation <strong>and</strong> heat of<br />
sorption of the multilayer sorption (J mol )1 ), T the<br />
temperature (K), C0 the constant, K0 the constant <strong>and</strong> R<br />
the universal gas constant (8.314 J mol )1 K).<br />
Validation of EMC models<br />
The coefficients of the individual equations were determined<br />
by means of a st<strong>and</strong>ard regression estimation.<br />
The various EMC models were evaluated for their<br />
suitability in predicting the EMC of the sample on the<br />
basis of the coefficient of determination (R 2 ), st<strong>and</strong>ard<br />
error of estimate (SEE), mean relative of error (MRE)<br />
<strong>and</strong> r<strong>and</strong>omness of residuals (e) These statistical<br />
parameters were calculated employing the following<br />
equations (Chen, 2000; Basunia & Abe, 2001; Lahsasni<br />
et al., 2003; Mohamed et al., 2004; Ghodake et al.,<br />
2007):<br />
Table 3 Experimental data of desorption<br />
isotherms of saffron 30 °C 45 °C 60 °C<br />
Figure 2 Influence of temperature on saffron<br />
equilibrium moisture content (EMC) vs.<br />
equilibrium relative humidity (ERH).<br />
ERH (decimal) EMC (% d.b) ERH (decimal) EMC (% d.b) ERH (decimal) EMC (% d.b)<br />
0.1128 2.563 0.1116 1.434 0.1095 0.835<br />
0.2161 3.567 0.197 2.575 0.1748 1.837<br />
0.3244 4.920 0.311 4.323 0.2926 3.517<br />
0.4317 6.845 0.4299 5.899 0.4212 4.795<br />
0.514 11.176 0.4693 8.407 0.4726 7.810<br />
0.7509 19.188 0.7452 18.268 0.745 17.678<br />
0.8362 28.441 0.8174 24.211 0.8025 20.025<br />
Saffron EMC (% d.b)<br />
30<br />
25<br />
20<br />
15<br />
10<br />
Equilibrium moisture contents of saffron H. R. Gazor <strong>and</strong> H. Chaji 1705<br />
5<br />
0<br />
30 °C<br />
45 °C<br />
60 °C<br />
0 10 20 30 40 50 60 70 80 90<br />
Ó 2010 Institute of Food Science <strong>and</strong> Technology International Journal of Food Science <strong>and</strong> Technology 2010, 45, 1703–1709<br />
ERH (%)
1706<br />
Equilibrium moisture contents of saffron H. R. Gazor <strong>and</strong> H. Chaji<br />
Parameters<br />
Modified<br />
Henderson<br />
ffiffiffiffiffiffiffiffiffiffiffiffiffiffiffiffiffiffiffiffiffiffiffiffiffiffiffiffiffiffiffiffiffiffiffiffiffiffiffiffiffi<br />
P<br />
SEE ¼<br />
N<br />
ðMi;exp Mi;preÞ<br />
i¼1<br />
2<br />
v<br />
u<br />
t<br />
df<br />
MRE ¼ 100 X<br />
N<br />
N<br />
i¼1<br />
Modified<br />
Chung-Pfost<br />
Mi;exp Mi;pre<br />
Mi;exp<br />
Modified<br />
Halsey<br />
ð3Þ<br />
ð4Þ<br />
e ¼ Mi;exp Mi;pre ð5Þ<br />
Where, Mi,exp is the experimental value of EMC; Mi,pre<br />
is the value predicted by the model; N is the number of<br />
data points; n is the number of coefficients in each<br />
model; df the degrees of freedom of regression model<br />
(N-n). It is generally considered that MRE values below<br />
10% indicate an adequate fit for practical purposes (Liu-<br />
Ping et al., 2005).<br />
Modified<br />
Oswin GAB<br />
C1 0.000834 96.98401 2.063523 10.18627 2.231425<br />
C2 85.32607 287.1498 )0.005016 )0.043299 0.927414<br />
C3 0.869323 10.36660 1.075747 1.390257<br />
M0 6.734712<br />
C0<br />
675579.9<br />
K0 4.17306<br />
DHc )0.33587<br />
DHk<br />
)0.04076<br />
R 2<br />
0.9885 0.9526 0.9826 0.9910 0.9816<br />
SEE 0.9707 1.9104 1.1564 0.6959 1.1914<br />
MRE (%) 11.5269 43.7620 26.5511 11.3176 15.3654<br />
SEE, st<strong>and</strong>ard error of estimate; MRE, mean relative of error.<br />
Saffron EMC (% d.b)<br />
35<br />
30<br />
25<br />
20<br />
15<br />
10<br />
Observed (30 °C)<br />
Pridicted (30 °C)<br />
Observed (45 °C)<br />
5<br />
0<br />
Pridicted (45 °C)<br />
Observed (60 °C)<br />
Pridicted (60 °C)<br />
0 10 20 30 40 50 60 70 80 90<br />
RH (%)<br />
Table 4 Model coefficients <strong>and</strong> statistical<br />
results of equations<br />
Figure 3 Observed values <strong>and</strong> predicted<br />
desorption isotherms by modified Oswin<br />
model for saffron at 30, 45 <strong>and</strong> 60 °C.<br />
Determination of net isosteric heat of desorption<br />
The net isosteric heat of desorption can be determined<br />
from moisture desorption data using the following<br />
equation, which is derived from the Clausius–Clapeyron<br />
equation (Adam et al., 2000; Mohamed et al., 2004;<br />
Janjai et al., 2006; Ghodake et al., 2007):<br />
@ lnðhrÞ<br />
@T<br />
¼ Qst<br />
RT 2<br />
ð6Þ<br />
Assuming that the net isosteric heat of desorption<br />
(Q st) is temperature independent, integrating eqn 3,<br />
gives the following equation:<br />
lnðhrÞ ¼ ð Qst 1<br />
Þ þ K ð7Þ<br />
R T<br />
Where K is a constant. The value of Qst is calculated<br />
from the slope of eqn 7. Using the computer software<br />
International Journal of Food Science <strong>and</strong> Technology 2010, 45, 1703–1709 Ó 2010 Institute of Food Science <strong>and</strong> Technology
Figure 4 Plot of residuals fit of the<br />
modified Oswin <strong>and</strong> the Hendeson models<br />
to desorption data of saffron.<br />
Statistica 6.0 <strong>and</strong> Microsoft Excel, the nonlinear<br />
optimisation method was used to find the best equation<br />
for the saffron desorption isotherms <strong>and</strong> the net isosteric<br />
heat of desorption.<br />
Results <strong>and</strong> discussion<br />
–0.5<br />
–1.5<br />
Desorption curves<br />
Experimental data on desorption isotherm of saffron are<br />
shown in Table 3. Desorption isotherms (points) of<br />
saffron are shown in Fig. 2 at three temperature levels of<br />
30, 45 <strong>and</strong> 60 °C, in the range of 11–83% relative<br />
humidity. The isotherm curves have sigmoid shape <strong>and</strong><br />
similar patterns. EMC values decreases with increase in<br />
temperature at all levels of relative humidity. This means<br />
Residuals<br />
Residuals<br />
1.5<br />
1<br />
0.5<br />
–1<br />
–1.5<br />
–2.5<br />
Residuals for modified Oswin model<br />
0<br />
0 5 10 15 20 25 30 35<br />
2.5<br />
2<br />
1.5<br />
1<br />
0.5<br />
–1<br />
–2<br />
Equilibrium moisture contents of saffron H. R. Gazor <strong>and</strong> H. Chaji 1707<br />
Predicted EMC (% d.b)<br />
Residuals for Modified Henderson model<br />
0<br />
0<br />
–0.5<br />
5 10 15 20 25 30 35<br />
Predicted EMC (% d.b)<br />
that saffron becomes less hygroscopic with increase in<br />
temperature. The decrease in EMC value with the<br />
increase in temperature at constant equilibrium relative<br />
humidity can be explained by the fact that the kinetic<br />
energy associated with water molecules present in<br />
saffron increases with increase in temperature.<br />
This, in turn, resulted in decreasing attractive forces<br />
<strong>and</strong> escaping of water molecules. Consequently that<br />
leads to a decrease in EMC values with increase in<br />
temperature at a given relative humidity. Furthermore,<br />
at constant temperature, EMC value increases with<br />
increase in relative humidity. Several researchers have<br />
reported similar trends for plants <strong>and</strong> food materials<br />
(Basunia & Abe, 2001; Lahsasni et al., 2003; Mohamed<br />
et al., 2004; Janjai et al., 2006; Ghodake et al.,<br />
2007).<br />
Ó 2010 Institute of Food Science <strong>and</strong> Technology International Journal of Food Science <strong>and</strong> Technology 2010, 45, 1703–1709
1708<br />
Equilibrium moisture contents of saffron H. R. Gazor <strong>and</strong> H. Chaji<br />
Heat of desorption (kJ mol –1 )<br />
6<br />
5<br />
4<br />
3<br />
2<br />
1<br />
0<br />
0 5 10 15 20 25<br />
EMC (% d.b)<br />
Fitting of sorption models to experimental sorption data<br />
The desorption curves for saffron are drawn as equilibrium<br />
moisture content against the equilibrium relative<br />
humidity. These curves are used to estimate the coefficients<br />
of different sorption models considered (Table 2).<br />
The coefficients of models, their MRE <strong>and</strong> SEE are<br />
presented in Table 4. It is clear from this table that the<br />
modified Oswin model gives better fit to the experimental<br />
data with highest R 2 <strong>and</strong> lowest values of MRE <strong>and</strong><br />
SEE than other models for desorption isotherms of<br />
saffron for a wide range of water activity. Also, modified<br />
Henderson model has good fitting with experimental<br />
data. Comparison between observed values <strong>and</strong> predicted<br />
desorption isotherms by modified Oswin model<br />
for saffron at 30, 45 <strong>and</strong> 60 °C is shown in Fig. 3.<br />
The analysis of the residual values vs. the predicted<br />
EMC values of desorption is in agreement with the<br />
previous results. Figure 4 shows the residuals of the<br />
predicted equilibrium moisture contents for the modified<br />
Oswin model <strong>and</strong> the Hendeson model. The modified<br />
Oswin model fitted the best to the isotherm data of<br />
saffron, <strong>and</strong> the residuals for the Oswin model are<br />
r<strong>and</strong>om in pattern. Hence, the Oswin model is acceptable.<br />
Heat of desorption<br />
Isosteric heat of desorption of saffron for different<br />
moisture contents was determined using the modified<br />
Oswin model that gave the best fitting of equilibrium<br />
moisture data in the range of temperatures from 30 to<br />
60 °C, in combination with eqn 7. The variations of<br />
isosteric heat of desorption for the different moisture<br />
contents are shown in Fig. 5. It is observed that for the<br />
range of temperatures from 30 to 60 °C <strong>and</strong> moisture<br />
contents from 2% to 20%. (d.b.), isosteric heat of<br />
desorption ranged from 1.38 to 5.38 kJ mol )1 . This<br />
indicates that at low moisture contents, the heat of<br />
desorption is higher than at high moisture contents. The<br />
net isosteric heat of desorption in saffron can be<br />
expressed by an exponential function of moisture<br />
content (Ghodake et al., 2007):<br />
Qst ¼ 6:19331 expðMeÞ 0:8104 R 2 ¼ 0:997 ð8Þ<br />
Conclusions<br />
Figure 5 Net isosteric heat of desorption<br />
isotherms for different moisture contents.<br />
The moisture desorption curves of saffron stigmas<br />
obtained at three temperatures (30, 45, <strong>and</strong> 60 °C)<br />
showed a sigmoid shape, as similar to previous studies.<br />
Desorption equilibrium moisture data have been<br />
collected for an over range of temperatures <strong>and</strong> relative<br />
humidities commonly used in drying of saffron. These<br />
results represent the preliminary stage of study of the<br />
convective drying kinetics of saffron in a conventional<br />
drier working with an auxiliary heating system.<br />
The experimental data of the desorption of saffron<br />
fitted to five isotherm models, so as to determine the best<br />
model for predicting the desorption equilibrium moisture<br />
contents of saffron. Modified Oswin <strong>and</strong> modified<br />
Henderson models were found acceptable for predicting<br />
desorption moisture isotherms <strong>and</strong> fitting to the experimental<br />
data, respectively.<br />
The heat of desorption of saffron decreases with<br />
an increase in moisture content <strong>and</strong> was found to be<br />
an exponential function of moisture content for desorption.<br />
International Journal of Food Science <strong>and</strong> Technology 2010, 45, 1703–1709 Ó 2010 Institute of Food Science <strong>and</strong> Technology
References<br />
Adam, E., Mu¨ hlbaver, W., Esper, A., Wolf, W. & Spieb, W. (2000).<br />
Effect of temperature on water sorption equilibrium of onion<br />
(Allium cepa L). Drying Technology, 18, 2117–2129.<br />
Barbosa-Cánovas, G.V. & Vega-Mercado, H. (1996). Dehydration of<br />
Foods. Pp. 32–33. New York: Chapman & Hall.<br />
Basunia, M.A. & Abe, T. (2001). Thin layer solar drying characteristics<br />
of rough rice under natural convection. Journal of Food Engineering,<br />
47, 295–301.<br />
Bol<strong>and</strong>i, M. & Ghoddusi, H.B. (2006). Flavour <strong>and</strong> colour changes<br />
during processing <strong>and</strong> storage of saffron (Crocus sativus L.).<br />
Developments in Food Science, 43, 323–326.<br />
Caballero-Ortega, H., Pereda-Miran, R. & Abdullaev, F. (2007).<br />
HPLC quantification of major active components from 11 different<br />
saffron (Crocus sativus L.) sources. Food Chemistry, 100, 1126–1131.<br />
Chen, Ch. (2000). A rapid method to determine the sorption isotherm<br />
of peanuts. Journal of Agricultural Engineering Research, 75, 401–<br />
408.<br />
Ghodake, H.M., Goswami, T.K. & Chakraverty, A. (2007). Moisture<br />
sorption isotherms, heat of sorption <strong>and</strong> vaporization of withered<br />
leaves, black <strong>and</strong> green tea. Journal of Food Engineering, 78, 827–<br />
835.<br />
Greenspan, L. (1977). Humidity fixed points of binary saturated<br />
aqueous solutions. Journal of Research of the National Bureau of<br />
St<strong>and</strong>ards – Section A. Physics <strong>and</strong> Chemistry, 81, 89–96.<br />
Iglesias, H.A. & Chirife, J. (1982). H<strong>and</strong> Book of Food Isotherms. Pp.<br />
170–175. New York: Academic Press.<br />
ISIR (2004). Saffron – Test methods. St<strong>and</strong>ard No 259-2 (2nd<br />
revision). Institute of St<strong>and</strong>ards <strong>and</strong> Industrial Research of Iran.<br />
Jamali, A., Kouhila, M., Ait Mohamed, L., Jaouhari, J.T., Idlimam,<br />
A. & Abdenouri, N. (2006). Sorption isotherms of Chenopodium<br />
Equilibrium moisture contents of saffron H. R. Gazor <strong>and</strong> H. Chaji 1709<br />
ambrosioides leaves at three temperatures. Journal of Food Engineering,<br />
72, 77–84.<br />
Janjai, S., Bala, B.K., Tohsing, K. et al. (2006). Equilibrium moisture<br />
content <strong>and</strong> heat of sorption of longan (Dimocarpus longan Lour.).<br />
Drying Technology, 24, 1691–1696.<br />
Labuza, T.P., Kaanane, A. & Chen, Y. (1985). Effect of temperature<br />
on the moisture sorption isotherms <strong>and</strong> water activity shift of two<br />
dehydrated foods. Journal of Food Science, 50, 385–392.<br />
Lahsasni, S., Kouhila, M., Mahrouz, M. & Fliyou, M. (2003).<br />
Moisture adsorption desorption isotherms of prickly pear cladode<br />
(Opuntia ficus indica) at different temperatures. Energy Conversion<br />
<strong>and</strong> Management, 44, 923–936.<br />
Liu-Ping, F., Min, Z., Qian, T. & Gong-Nian, X. (2005). Sorption<br />
isotherms of vacuum-fried carrot chips. Drying Technology, 23,<br />
1569–1579.<br />
Mohamed, L.A., Kouhila, M., Jamali, A., Lahsasni, S. & Mahrouz,<br />
M. (2004). Moisture sorption isotherms <strong>and</strong> heat of sorption of<br />
bitter orange leaves (Citrus aurantium). Journal of Food Engineering,<br />
67, 491–498.<br />
Mujumdar, A.S. (2000). Drying Technology in Agriculture <strong>and</strong> Food<br />
Sciences. Pp. 26–27. Enfield (NH), USA: Science publisher, Inc.<br />
Rahman, M.D.S. (1995). H<strong>and</strong> Book of Food Properties. Pp. 2–11.<br />
New York: CRC Press.<br />
Tsimidou, M. & Biliaderis, C.G. (1997). Kinetic studies of saffron<br />
(Crocus sativus L.) quality deterioration. Journal of Agricultural <strong>and</strong><br />
Food Chemistry, 45, 2890–2898.<br />
Wang, N. & Brennan, J.G. (1991). Moisture sorption isotherm<br />
characteristics of potatoes at four temperatures. Journal of Food<br />
Engineering, 14, 269–282.<br />
Winterhalter, P. & Straubinger, M. (2000). Saffron: renewed interest in<br />
an ancient spice. Food Review International, 16, 39–59.<br />
Ó 2010 Institute of Food Science <strong>and</strong> Technology International Journal of Food Science <strong>and</strong> Technology 2010, 45, 1703–1709
1710<br />
Original article<br />
Use of visible spectroscopy to assess colour development during<br />
ageing of fresh pork from different quality classes<br />
Marta Castro-Giráldez, 1 Pedro J. Fito, 1 Fidel Toldrá 2 & Pedro Fito 1 *<br />
1 Instituto Universitario de Ingeniería de Alimentos para el Desarrollo, Universidad Politécnica de Valencia, Camino de Vera s ⁄ n, 46022 Valencia,<br />
Spain<br />
2 Instituto de Agroquímica y Tecnología de Alimentos (CSIC), PO Box 73, 46100 Burjassot, Valencia, Spain<br />
(Received 9 November 2009; Accepted in revised form 24 May 2010)<br />
Summary The objective of this research was to study the entire visible spectra evolution during meat ageing in different<br />
pork meat quality classes (PSE, DFD <strong>and</strong> RFN). The potential use of the visible spectra for discriminating<br />
low meat quality classes during the 24 hours postmortem (hpm) was also analysed. For these purposes, 26<br />
pork loins were used: 3 PSE (pale, soft <strong>and</strong> exudative), 3 DFD (dark, firm <strong>and</strong> dry) <strong>and</strong> 20 RFN (red, firm<br />
<strong>and</strong> non-exudative). At 12, 24, 48 h <strong>and</strong> 7 days postmortem, reflectance spectra (400–700 nm) were obtained<br />
by a spectrocolorimeter Minolta CM-3600D after one <strong>and</strong> a half hour of blooming time. It was<br />
demonstrated that the ageing time has an influence in colour parameters <strong>and</strong> in blooming ability of RFN<br />
loins. The evolution of visible spectra was influenced by ageing time in PSE <strong>and</strong> RFN loins, while the visible<br />
spectra of DFD loins showed no variation with postmortem time. The results showed the possibility of<br />
separating PSE meats from the other classes by using visible reflectance spectra at 24 hpm.<br />
Keywords Colour, colour development, dark, firm <strong>and</strong> dry meats, pale, soft <strong>and</strong> exudative meats, quality, reflectance spectra, visible<br />
spectroscopy.<br />
Introduction<br />
Colour is one of the most important meat characteristics<br />
that consumers consider before buying, <strong>and</strong> is also<br />
related to the sensory characteristics of meat (Norman<br />
et al., 2003). The colour of pork is influenced by the<br />
pigment content, the different redox states of hemoprotein<br />
myoglobin: deoxymyoglobin (DMb) (purple colour),<br />
oxymyoglobin (MbO2) (bright red colour) <strong>and</strong><br />
metmyoglobin (MetMb) (brown colour) <strong>and</strong> by meat<br />
structure (Lindahl et al., 2001). During meat ageing, any<br />
factor that acts on the myoglobin or indirectly changes<br />
the pH <strong>and</strong> its rate of decline can affect meat colour<br />
evolution (Honikel, 1997).<br />
Abnormal postmortem glycolysis during the conversion<br />
of muscle to meat produces extreme progress in pH,<br />
which affects negatively to water-holding capacity <strong>and</strong><br />
colour (Bendall & Swatl<strong>and</strong>, 1988), defining the main<br />
low quality classes in pork meat. Dark, firm <strong>and</strong> dry<br />
(DFD) meats are characterised by an ultimate pH<br />
higher than the isoelectric point of proteins, which<br />
produces a high water-holding capacity, which is asso-<br />
*Correspondent: Fax: +34 963877369;<br />
e-mail: pfito@tal.upv.es<br />
International Journal of Food Science <strong>and</strong> Technology 2010, 45, 1710–1716<br />
ciated with greater translucence <strong>and</strong> less scatter of<br />
incident light, making the meat appear darker (Mac-<br />
Dougall & Jones, 1981; MacDougall, 1982). Moreover,<br />
at high pH (>6) mitochondrial oxygen consumption is<br />
high <strong>and</strong> remains so during some time post-rigour<br />
(Bendall & Taylor, 1972); consequently, in meat exposed<br />
to air the purple colour of deoxymyoglobin predominates,<br />
being the surface oxymyoglobin layer thin<br />
(Ashmore et al., 1972). On the other h<strong>and</strong>, pale, soft<br />
<strong>and</strong> exudative (PSE) meats are characterised by the fast<br />
decline of pH after slaughtering with a simultaneous<br />
high muscle temperature, producing severe protein<br />
denaturation (Offer et al., 1989) <strong>and</strong>, consequently, high<br />
exudation, which produces a high light scattering <strong>and</strong><br />
reflection over moist surface, giving the pale colour to<br />
this kind of meats. With regard to the myoglobin forms<br />
in this quality class, the pH decline promotes the<br />
inactivation of oxygen-consuming enzymes, which<br />
causes the oxygenation of myoglobin yielding to more<br />
oxymyoglobin formation (Govindarajan, 1973). These<br />
low-quality classes contrast to RFN (red, firm <strong>and</strong> nonexudative)<br />
meats, which are the desirable class to<br />
consumers. These meats have a slower pH decline than<br />
PSE meats, which affects positively to their texture <strong>and</strong><br />
colour. The macromolecular structure is less dense than<br />
doi:10.1111/j.1365-2621.2010.02325.x<br />
Ó 2010 The Authors. Journal compilation Ó 2010 Institute of Food Science <strong>and</strong> Technology
DFD meats, increasing the light scattering in a desirable<br />
way <strong>and</strong> the oxymyoglobin is the predominant pigment<br />
(Offer et al., 1989).<br />
Recently, lots of studies have been made with regard<br />
to colour <strong>and</strong> colour stability of pork. Some parameters<br />
have been studied such as the pre-slaughter stress<br />
(Rosenvold & Andersen, 2003), diet (Hoving-Bolink<br />
et al., 1998; Rosenvold & Andersen, 2003; Tikk et al.,<br />
2008), blooming time (Brewer et al., 2001; Lindahl<br />
et al., 2006a; Skrlep & C<strong>and</strong>ek-Potokar, 2007). However,<br />
the influence of ageing on colour development of<br />
different quality classes has not been widely evaluated.<br />
The aim of this paper has been to study the entire<br />
visible spectra of different meat classes <strong>and</strong> the evolution<br />
of these spectra during meat ageing to evaluate meat<br />
colour development. The relative amounts of the three<br />
myoglobin species have been also studied to compare<br />
the ability of these quality classes to bloom during<br />
ageing. Moreover, the potential use of visible spectroscopy<br />
for discriminating low meat quality classes during<br />
the 24 h after slaughter has been analysed.<br />
Materials <strong>and</strong> methods<br />
Raw material<br />
Twenty-six pigs (L<strong>and</strong>race · Duroc, 16 males <strong>and</strong> 10<br />
females) were slaughtered in a commercial slaughterhouse<br />
located near the Institute of Agrochemistry <strong>and</strong><br />
Food technology (Valencia, Spain). These carcasses<br />
were selected by trained employee from a total of 200<br />
carcasses, trying to obtain loins from the different<br />
quality classes. Carcasses were rapidly chilled at )10 °C<br />
for 45 min <strong>and</strong> the longissimus Dorsi muscle removed.<br />
The muscle was kept at 4 °C until sampled.<br />
Technological meat quality classification<br />
The pork loins were classified based on L24h* coordinate,<br />
pH2h, pH24h <strong>and</strong> drip loss, according to the<br />
classification of Table 1. Samples pH was measured<br />
through a portable pH-meter CRISON PH25 Ò<br />
(CRISON Instruments, SA, Barcelona, Spain) at 2, 4,<br />
6, 8, 24, 48 h <strong>and</strong> 7 days postmortem.<br />
A thick slice (about 100 g) was excised 24 h after<br />
slaughter, suspended within a net in a plastic bag <strong>and</strong><br />
stored at 4 °C. The per cent change in weight over the<br />
Table 1 Meat classification based upon pH2h, pH24h, drip loss <strong>and</strong><br />
L24h* coordinate<br />
Meat quality classes pH2h pH24h Drip loss L24h*<br />
Pale soft exudative 56<br />
Red firm non exudative >5.8
1712<br />
Visible Spectroscopy to assess colour development during ageing of fresh pork M. Castro-Giráldez et al.<br />
Table 2 Meat quality measurements by quality classes for assayed<br />
pork loins<br />
Technologic<br />
parameters<br />
Pale, soft <strong>and</strong><br />
exudative<br />
(n =3)<br />
Results <strong>and</strong> discussion<br />
Dark, firm<br />
<strong>and</strong> dry<br />
(n =3)<br />
Red firm<br />
non exudative<br />
(n = 20)<br />
Drip loss (%) 6.0 a ± 0.3 1.5 b ± 0.3 3.5 c ± 0.4<br />
L 24h* 56.7 a ± 0.8 49.4 b ± 0.2 51.8 b ± 1.8<br />
pH 2 h pm 5.58 a ± 0.13 6.22 b ± 0.09 5.99 c ± 0.05<br />
pH 24 h pm 5.37 a ± 0.10 5.90 b ± 0.06 5.63 c ± 0.04<br />
n, number of pork loins; a,b,c , means in a row with different superscripts<br />
are significantly different (P < 0.05); pm, postmortem.<br />
The pork loins were classified according to the classification<br />
of Table 1. Based on this classification, three<br />
pork loins were classified as PSE, three as DFD <strong>and</strong> 20<br />
as RFN (Table 2).<br />
The pH evolution during postmortem period is shown<br />
in Fig. 1. The rapid drop of pH suffered by PSE samples<br />
immediately after slaughter, from a pH near the<br />
neutrality (in the living animal) to 5.58 at 2 hours<br />
postmortem (hpm), can be appreciated in Fig. 1. RFN<br />
samples showed a pH at 2 hpm of 5.99, indicating a<br />
progressive pH decline from slaughter. DFD samples<br />
showed the highest pH at 2 hpm, the value of which was<br />
6.22. These animals are characterised because the<br />
glycogen reserves are depleted before slaughter, <strong>and</strong><br />
thus, these muscles produce little lactic acid during the<br />
conversion of muscle to meat. Furthermore, in the figure<br />
it can be appreciated that the pH decrease continues<br />
until approximately 8 hpm in the three quality classes,<br />
reaching a final pH close to 5.4 for PSE samples, 5.63 for<br />
RFN samples <strong>and</strong> close to 5.90 for DFD samples. The<br />
decrease of pH from 2 to 24 hpm is more pronounced in<br />
RFN <strong>and</strong> DFD samples than in PSE samples, whose<br />
highest decrease is experimented during the two-first<br />
hpm.<br />
Colour evolution during ageing<br />
L* co-ordinate with regard to postmortem time is<br />
represented in Fig. 2a. The least significance difference<br />
(LSD) intervals (95% confidence) are also shown. L*<br />
co-ordinate represents lightness, where L* = 0 is completely<br />
black, <strong>and</strong> L* = 100 is completely white. L*<br />
co-ordinate at 24 hpm is one of the parameters usually<br />
used for meat quality classification. PSE samples<br />
showed a significantly higher (P < 0.05) L24h*<br />
co-ordinate with respect to the other two quality classes.<br />
In the figure, it can also be observed that L* co-ordinate<br />
of PSE meats remains higher than the L* co-ordinate of<br />
DFD <strong>and</strong> RFN during the 48 hpm. In PSE meats, the<br />
pH decreases rapidly during the first hour after slaughter,<br />
while temperature is still high, resulting in excessive<br />
protein denaturation (Offer & Knight, 1988), so the<br />
water-holding capacity is decreased (Ledward, 1992),<br />
light scattering is increased (Bendall & Swatl<strong>and</strong>, 1988)<br />
<strong>and</strong> L* co-ordinate is increased (Joo et al., 1999). On the<br />
other h<strong>and</strong>, DFD meats present an L* co-ordinate<br />
similar to RFN meats during the 24 h after slaughter as<br />
it was reported by Zhu & Brewer (1998). Above 24 hpm,<br />
RFN meats present higher L* co-ordinate than DFD<br />
meats, which remains almost constant <strong>and</strong> lower. L*<br />
co-ordinate increases gradually during ageing for RFN<br />
meats.<br />
In Fig. 2, the Hue mean angle, a* <strong>and</strong> b* co-ordinates<br />
are represented for each meat quality class during<br />
ageing. In the CIE L*a*b* space, a* represents the<br />
red-green colour <strong>and</strong> b* the yellow-blue colour of the<br />
sample. DFD <strong>and</strong> PSE quality classes do not show<br />
important variations in a* <strong>and</strong> b* colour co-ordinates<br />
during ageing. On the contrary, RFN quality class<br />
shows variations in both a* <strong>and</strong> b* co-ordinates. The<br />
value of a* co-ordinate increases significantly<br />
(P < 0.05) from 48 h to 7 days postmortem; this fact<br />
means that RFN samples showed more red colour after<br />
7 days of ageing than during the 2 days after slaughter.<br />
The b* co-ordinate shows an increase from 24 h to<br />
Figure 1 Evolution of pH means during<br />
ageing, where Dark, firm <strong>and</strong> dry samples<br />
(h), red, firm <strong>and</strong> non-exudative samples<br />
(¤), pale, soft <strong>and</strong> exudative samples ( ).<br />
The st<strong>and</strong>ard deviation of each pH is shown.<br />
International Journal of Food Science <strong>and</strong> Technology 2010 Ó 2010 The Authors. Journal compilation Ó 2010 Institute of Food Science <strong>and</strong> Technology
Figure 2 Evolution of (a) L* co-ordinate,<br />
(b) Hue mean angles, (c) a* co-ordinate,<br />
(c) b*co-ordinate, during ageing where red,<br />
firm <strong>and</strong> non-exudative ( ), Dark, firm <strong>and</strong><br />
dry ( ), <strong>and</strong> pale, soft <strong>and</strong> exudative ( ). In<br />
all figures, the Least Significance Difference<br />
intervals (with 95% confidence) are<br />
represented.<br />
7 days postmortem. Both co-ordinates, a* <strong>and</strong> b*, were<br />
used to calculate the hue mean angle during ageing to<br />
obtain more information about the effect of ageing in<br />
meat colour. In the Fig. 2b, it can be observed that RFN<br />
<strong>and</strong> DFD meats have similar hue mean angles during<br />
ageing (70.39° <strong>and</strong> 68.29°, respectively). On the other<br />
h<strong>and</strong>, PSE samples showed a hue mean angle (80.38°)<br />
significantly higher (P < 0.05) than RFN <strong>and</strong> DFD<br />
meats. Hue angle measures the degree of departure from<br />
the red axis of the CIE colour space (Brewer et al.,<br />
2006). Lower hue angle is related with higher visually<br />
perceived redness. So, RFN <strong>and</strong> DFD samples, which<br />
have a significantly lower (P < 0.05) hue mean angle,<br />
Figure 3 Mean reflectance spectra<br />
(400–700 nm) <strong>and</strong> Least Significance<br />
Difference intervals (with 95% confidence) at<br />
different postmortem times, where: red,<br />
firm <strong>and</strong> non-exudative ( ), Dark, firm <strong>and</strong><br />
dry ( ), <strong>and</strong> pale, soft <strong>and</strong> exudative ( ).<br />
Visible Spectroscopy to assess colour development during ageing of fresh pork M. Castro-Giráldez et al. 1713<br />
(a)<br />
62<br />
59<br />
56<br />
53<br />
50<br />
47<br />
(c) 8<br />
6<br />
4<br />
2<br />
0<br />
12 24 48 168<br />
(b) 88<br />
10<br />
12 24 48 168 12 24 48 168<br />
84<br />
80<br />
76<br />
72<br />
68<br />
64<br />
(d) 16<br />
15<br />
14<br />
13<br />
12<br />
11<br />
12 24 48 168<br />
are characterised by redder colour than PSE meats.<br />
Moreover, from 48 h to 7 days postmortem, the RFN<br />
samples showed a significantly (P < 0.05) decrease in<br />
hue angle, which is related with higher perceived red<br />
colour in those samples after 7 days of ageing.<br />
In Fig. 3, the average reflectance spectra between 400<br />
<strong>and</strong> 700 nm were represented for the studied meat<br />
quality classes at 12, 24, 48 h <strong>and</strong> 7 days postmortem. It<br />
can be observed that at 12 hpm the PSE meats reflectance<br />
spectrum is significantly higher (P < 0.05) than<br />
that of DFD <strong>and</strong> RFN meats at wavelengths above<br />
430 nm. It might be because of the accelerated metabolism<br />
that characterises the exudative meats, which<br />
Ó 2010 The Authors. Journal compilation Ó 2010 Institute of Food Science <strong>and</strong> Technology International Journal of Food Science <strong>and</strong> Technology 2010
1714<br />
Visible Spectroscopy to assess colour development during ageing of fresh pork M. Castro-Giráldez et al.<br />
produces a fast pH-decline while temperature is still<br />
high; this situation produces a decrease in the waterholding<br />
capacity <strong>and</strong> an excessive protein denaturation,<br />
increasing light scattering. The same behaviour can be<br />
observed at 24 <strong>and</strong> 48 hpm. It is important to remark<br />
that RFN meats spectrum is being progressively<br />
increasing with ageing, approaching to PSE spectrum.<br />
This is because of the fact that these kind of samples<br />
have a higher pH at early postmortem when compared<br />
to the PSE samples; moreover, its pH decline is gradual,<br />
approaching progressively to isoelectric point of myosin<br />
with meat ageing, leading to the loss of water-binding<br />
capacity of the protein <strong>and</strong> affecting muscle structure;<br />
owing tothese factors, more incident light is scattered<br />
<strong>and</strong> RFN meat reflectance spectrum is approaching to<br />
PSE spectrum. This phenomenon is reflected in the<br />
48 hpm spectra (Fig. 3), which show differences statistically<br />
significant among the three quality classes.<br />
Otherwise, DFD samples are characterised by a little<br />
production of lactic acid <strong>and</strong>, consequently, by a very<br />
low pH decrease (pH24 near 6.0), higher water-holding<br />
capacity <strong>and</strong> dark colour (Lawrie, 1998). The Fig. 3<br />
shows that at 24 hpm, the reflectance spectra can be<br />
used to discriminate only the PSE meats, not being<br />
useful to the discrimination of DFD meats. For this<br />
discrimination, 48 hpm are needed.<br />
Evolution of myoglobin species during ageing<br />
The evolution of myoglobin species of different pork<br />
classes was investigated (Fig. 4). The relative amounts<br />
of DMb, MbO2 <strong>and</strong> MetMb in meat depend on the<br />
oxygen availability, the autoxidation rate of myoglobin<br />
<strong>and</strong> the MetMb reducing capacity (Ledward, 1992). In<br />
Fig. 4, it can be observed that oxymyoglobin is significantly<br />
higher (P < 0.05) at 7 days postmortem than<br />
during the 48 h after slaughter in RFN meats. After<br />
Figure 4 Effect of ageing on the relative<br />
concentration of the myoglobin species<br />
deoxymyoglobin (DMb), oxymyoglobin<br />
(MbO2) <strong>and</strong> metmyoglobin (MetMb),<br />
calculated from Kubelka–Munk K ⁄ S-ratios<br />
for red, firm <strong>and</strong> non-exudative ( ), Dark,<br />
firm <strong>and</strong> dry ( ), <strong>and</strong> pale, soft <strong>and</strong> exudative<br />
( ) samples. The relative content of DMb was<br />
estimated by the ratio K ⁄ S 474 ‚ K ⁄ S 525, the<br />
relative content of MbO2 by the ratio<br />
K ⁄ S610 ‚ K ⁄ S525 <strong>and</strong> the relative content of<br />
MetMb by the ratio K ⁄ S 572 ‚ K ⁄ S 525. The<br />
mean values <strong>and</strong> the Least Significance<br />
Difference intervals (with 95% confidence)<br />
are represented.<br />
slaughtering, the muscle continues consuming oxygen in<br />
cell respiration (Lanari & Cassens, 1991; Madavi &<br />
Carpenter, 1993). Meat ageing in normal meats promotes<br />
a decrease in respiration owing to the loss of<br />
structural integrity <strong>and</strong> consequently, the oxygen consumption<br />
decrease, allowing it to penetrate into the<br />
muscle (Millar et al., 1994) <strong>and</strong> thus a more pronounced<br />
blooming occurs (Zhu et al., 2001; Lindahl et al.,<br />
2006a,b), leading to a more red colour (Rosenvold &<br />
Andersen, 2003; Lindahl et al., 2006a,b). On the other<br />
h<strong>and</strong>, deoxymyoglobin decrease significantly (P < 0.05)<br />
from 48 to 7 days postmortem for RFN meats; this<br />
phenomenon can be related to the increase in oxymyoglobin<br />
at 7 days postmortem because of the increased<br />
oxygenation (blooming ability) at this time. Moreover,<br />
metmyoglobin suffers a slight increase at 7 days postmortem<br />
in RFN meats; this slight accumulation of<br />
MetMb can be because ofthe decrease in metmyoglobin<br />
reductase activity as time postmortem progresses (Mancini<br />
& Hunt, 2005). These significant changes in myoglobin<br />
species of RFN meats were reflected in a<br />
significant increase of L*, a* <strong>and</strong> b* co-ordinates, <strong>and</strong><br />
a decrease in the hue angle at 7 days postmortem. Thus,<br />
more blooming can be associated with lighter <strong>and</strong> redder<br />
colour as was previously reported by Lindahl et al.<br />
(2001).<br />
On the other h<strong>and</strong>, low-quality meats do not have a<br />
significant increase in oxymyoglobin during meat ageing.<br />
PSE meats have a rapid pH decline, while samples<br />
are still at high temperatures; this situation favours the<br />
auto-oxidation of myoglobin (Gotoh & Shikama, 1974)<br />
to metmyoglobin, which increase significantly<br />
(P < 0.05) at 7 days postmortem (Fig. 4). DFD meats<br />
are characterised by high pH (pH near 6), at which<br />
oxygen-consuming enzymes remain active, so less oxygen<br />
is available to the oxygenation of myoglobin<br />
(Fig. 4). On the other h<strong>and</strong>, this meat class has a very<br />
International Journal of Food Science <strong>and</strong> Technology 2010 Ó 2010 The Authors. Journal compilation Ó 2010 Institute of Food Science <strong>and</strong> Technology
Figure 5 Mean reflectance spectra<br />
(400–700 nm) for each meat quality class<br />
during ageing, where: 12 hours postmortem<br />
(hpm) ( ), 24 hpm ( ), 48 hpm ( ), 7 days<br />
postmortem ( ). The least significance<br />
difference intervals (with 95% confidence)<br />
are represented.<br />
stable colour, <strong>and</strong> no significant variations on myoglobin<br />
states are produced.<br />
When compared the three quality classes in Fig. 4 it<br />
can be observed that DMb is similar during the 48 hpm<br />
in the three classes, while there are significant differences<br />
(P < 0.05) at 7 days postmortem, being higher in<br />
DFD meats than in PSE meats, which are higher than<br />
RFN meats. MbO2 is significantly higher (P < 0.05) in<br />
RFN meats than in the low-quality classes at 7 days<br />
postmortem, which is related with the significantly<br />
(P < 0.05) higher values of a* <strong>and</strong> b* co-ordinates at<br />
7 days postmortem in RFN meats than in the lowquality<br />
classes, indicating a brighter red colour of this<br />
samples at 7 days postmortem. On the other h<strong>and</strong>, PSE<br />
meats have less MbO 2 than the other two classes from<br />
24 h to 7 days postmortem. With regard to the MetMb,<br />
PSE samples have higher MetMb at 7 days postmortem<br />
than the other two quality classes.<br />
In Fig. 5, the evolution of the mean reflectance<br />
spectra (400–700 nm) for each meat quality during<br />
ageing are shown. It can be observed that the reflectance<br />
of RFN samples is increasing with postmortem<br />
time. The 7 days postmortem spectrum has a different<br />
shape from the other spectra. It can be observed that<br />
the bump at around 560 nm is more pronounced at<br />
7 days postmortem which can be associated with an<br />
increase in MbO2, which is typically observed at such<br />
wavelength (Lindahl, 2005). Moreover, a little decrease<br />
in reflectance is observed at around 630 nm, which can<br />
be associated to the slight increase in MetMb (Lindahl,<br />
2005). On the contrary, DFD samples spectra remain<br />
almost constant during the postmortem, which can be<br />
interpreted as very stable colour characteristics of this<br />
Visible Spectroscopy to assess colour development during ageing of fresh pork M. Castro-Giráldez et al. 1715<br />
λ λ<br />
λ<br />
pork meat quality class. There exist only differences at<br />
7 days postmortem spectrum in which the bump at<br />
around 560 nm disappears; it can be associated with the<br />
decrease in MbO2 observed at this time, although this<br />
decrease was not significant (see Fig. 4). PSE samples<br />
presented an increase in reflectance during the 48 h after<br />
slaughter, but the reflectance at 7 days postmortem<br />
decreases significantly (P < 0.05). The 7 days postmortem<br />
spectrum presents a different behaviour<br />
between 600 <strong>and</strong> 700 nm, which can be associated to<br />
the significant (P < 0.05) increase of MetMb (Lindahl,<br />
2005).<br />
Conclusions<br />
The evolution of visible spectra was influenced by ageing<br />
time in PSE <strong>and</strong> RFN loins, while the visible spectra of<br />
DFD loins showed no variation with postmortem time.<br />
A more pronounced blooming was observed in RFN<br />
meats at 7 days postmortem than during the 48 h after<br />
slaughter. This phenomenon was reflected in a significantly<br />
(P < 0.05) higher oxymyoglobin content, L*, a*<br />
<strong>and</strong> b* co-ordinates <strong>and</strong> a significantly (P < 0.05) lower<br />
deoxymyoglobin content, <strong>and</strong> hue angle at 7 days<br />
postmortem with regard to the values of these parameters<br />
in this quality class during the 48 h after slaughter.<br />
Thus, it is possible to conclude that ageing time affects<br />
positively to the colour of RFN meats. PSE samples<br />
showed a significant (P < 0.05) increase in metmyoglobin<br />
at 7 days postmortem, <strong>and</strong> a significant (P < 0.05)<br />
decrease in L* co-ordinate, while DFD meats did not<br />
show significant variation on colour parameters or on<br />
myoglobin states.<br />
Ó 2010 The Authors. Journal compilation Ó 2010 Institute of Food Science <strong>and</strong> Technology International Journal of Food Science <strong>and</strong> Technology 2010
1716<br />
Visible Spectroscopy to assess colour development during ageing of fresh pork M. Castro-Giráldez et al.<br />
Additionally, the results showed the possibility of<br />
separating PSE meats from the other classes by using<br />
visible reflectance spectra at 24 hpm. However, at this<br />
time, it was also demonstrated that discriminating DFD<br />
meats by this method is not possible.<br />
Acknowledgments<br />
Grant from Agroalimed (Conselleria de Agricultura,<br />
Pesca y Alimentacio´n, Valencia, Spain) <strong>and</strong> FPU grant<br />
to MC from Ministry of Science <strong>and</strong> Innovation<br />
(Madrid, Spain) are fully acknowledged. Work prepared<br />
within the Unidad Asociada IIAD (UPV)-IATA (CSIC)<br />
framework.<br />
References<br />
Ashmore, C.R., Parker, W. & Doerr, L. (1972). Respiration of<br />
mitochondria isolated from dark-cutting beef: postmortem changes.<br />
Journal of Animal Science, 34, 46–53.<br />
Bendall, J.R. & Swatl<strong>and</strong>, H.J. (1988). A review of the relationships of<br />
pH with physical aspects of pork quality. Meat Science, 24, 85–126.<br />
Bendall, J.R. & Taylor, A.A. (1972). Consumption of oxygen by the<br />
muscles of beef animals <strong>and</strong> related species. II. Consumption of<br />
oxygen by post-rigor muscle. Journal of the Science of Food <strong>and</strong><br />
Agricultural, 23, 707–711.<br />
Brewer, M.S., Zhu, L.G., Bidner, B., Meisinger, D.J. & McKeith, F.K.<br />
(2001). Measuring pork color: effects of bloom time, muscle, pH <strong>and</strong><br />
relationship to instrumental parameters. Meat Science, 57, 169–176.<br />
Brewer, M.S., Novakofski, J. & Freise, K. (2006). Instrumental<br />
evaluation of pH effects on ability of pork chops to bloom. Meat<br />
Science, 72, 596–602.<br />
CIE. (1978). International Commission on Illumination, Recommendations<br />
on Uniform Colour Spaces, Colour, Difference Equations,<br />
Psychometric Colour Terms. CIE publication No. 15 (Suppl.2), (E-<br />
1.31) 1971 ⁄ (TC-1.3). Paris, France: Bureau Central de la CIE.<br />
Gotoh, T. & Shikama, K. (1974). Autoxidation of oxymyoglobin from<br />
bovine heart muscle. Archives Biochemistry <strong>and</strong> Biophysics, 163,<br />
476–478.<br />
Govindarajan, S. (1973). Fresh meat colour. CRC Critical Reviews in<br />
Food Technology, 4, 117–140.<br />
Honikel, K.O. (1997). Reference methods supported by OECD <strong>and</strong><br />
their use in Mediterranean meat products. Food Chemistry, 59, 573–<br />
582.<br />
Honikel, K.O. (1998). Reference methods for the assessment of<br />
physical characteristics of meat. Meat Science, 49, 447–457.<br />
Hoving-Bolink, A.H., Eikelenboom, G., van Diepen, J.Th.M., Jongbloed,<br />
A.W. & Houben, J.H. (1998). Effect of dietary vitamin E<br />
supplementation on pork quality. Meat Science, 49, 205–212.<br />
Hunt, M.C., Acton, J.C., Benedict, R.C., Calkins, C.R., Cornforth,<br />
D.P. & Jeremiah, L.E., et al. (1991). Guidelines for meat colour<br />
evaluation. In: Proceedings 44 th Annual Reciprocal Meat Conference,<br />
June 9–12, Kansas City University, Manhattan, KS. pp. 1–17.<br />
Chicago, IL, U.S.A.: Publ. National Live Stock <strong>and</strong> Meat Board.<br />
Joo, S.T., Kauffman, R.G., Kim, B.C. & Park, G.B. (1999). The<br />
relationship of sarcoplasmic <strong>and</strong> myofibrillar protein solubility to<br />
colour <strong>and</strong> water-holding capacity in porcine longissimus muscle.<br />
Meat Science, 52, 291–297.<br />
Lanari, M.C. & Cassens, R.G. (1991). Mitochondrial activity <strong>and</strong> beef<br />
muscle colour stability. Journal of Food Science, 56, 1476–1479.<br />
Lawrie, R.A. (1998). Lawrie’s Meat Science, 6th edn. Cambridge, UK:<br />
Woodhead Publishing Limited.<br />
Ledward, D.A. (1992). Colour of raw <strong>and</strong> cooked meat. In: The<br />
Chemistry of Muscle-Based Foods (edited by D. E Johnston, M.K.<br />
Knight & D.A. Ledward). Pp. 128–144. Cambridge, UK: Royal<br />
Society of Chemistry.<br />
Lindahl, G. (2005). Colour characteristics of fresh pork. Doctoral<br />
Thesis. Uppsala (Sweden): Swedish University of Agricultural<br />
Sciences, .<br />
Lindahl, G., Lundström, K. & Tornberg, E. (2001). Contribution of<br />
pigment content, myoglobin forms <strong>and</strong> internal reflectance to the<br />
colour of pork loin <strong>and</strong> ham from pure breed pigs. Meat Science, 59,<br />
141–151.<br />
Lindahl, G., Karlsson, A.H., Lundström, K. & Andersen,<br />
H.J. (2006a). Significance of storage time on degree of blooming<br />
<strong>and</strong> colour stability of pork loin from different crossbreeds. Meat<br />
Science, 72, 603–612.<br />
Lindahl, G., Enfält, A.C., Andersen, H.J. & Lundström, K. (2006b).<br />
Impact of RN genotype <strong>and</strong> ageing time on colour characteristics of<br />
the pork muscles longissimus dorsi <strong>and</strong> semimembranosus. Meat<br />
Science, 74, 746–755.<br />
MacDougall, D.B. (1982). Changes in the colour <strong>and</strong> opacity of meat.<br />
Food Chemistry, 9, 75–80.<br />
MacDougall, D.B. & Jones, S.J. (1981). Translucency <strong>and</strong> colour<br />
defects of dark-cutting meat <strong>and</strong> their detection. In: The Problem of<br />
the Dark-Cutting in Beef (edited by D.E. Hood & P.V. Tarrant). Pp.<br />
328–339. Hague, Netherl<strong>and</strong>s: Martinus Nijhoff Publishers.<br />
Madavi, D.L. & Carpenter, C.E. (1993). Ageing <strong>and</strong> processing affect<br />
colour, metmyoglobin reductase <strong>and</strong> oxygen consumption of beef<br />
muscles. Journal of Food Science, 58, 939–947.<br />
Mancini, R.A. & Hunt, M.C. (2005). Current research in meat colour.<br />
Meat Science, 71, 100–121.<br />
Mancini, R.A., Hunt, M.C. & Kropf, D.H. (2003). Reflectance at<br />
610nm estimates oxymyoglobin content on the surface of ground<br />
beef. Meat Science, 64, 157–162.<br />
Millar, S., Wilson, R., Moss, B.W. & Ledward, D.A. (1994).<br />
Oxymyoglobin formation in meat <strong>and</strong> poultry. Meat Science, 36,<br />
397–406.<br />
Norman, J.L., Berg, E.P., Heymann, H. & Lorenzen, C.L. (2003). Pork<br />
loin colour relative to sensory <strong>and</strong> instrumental tenderness <strong>and</strong><br />
consumer acceptance. Meat Science, 65, 927–933.<br />
Offer, G. & Knight, P. (1988). The structural basis of water-holding in<br />
meat. Part 2: drip losses. In: Development in Meat Science (edited by<br />
R. Lawrie). Vol. 4. Pp. 172–243. London: ElSevier Applied Science.<br />
Offer, G., Knight, P., Jeacoke, R. et al. (1989). The structural basis of<br />
waterholding, appearance <strong>and</strong> toughness of meat <strong>and</strong> meat products.<br />
Food Microstructure, 8, 151–170.<br />
Rosenvold, K. & Andersen, H.J. (2003). The significance of preslaughter<br />
stress <strong>and</strong> diet on colour <strong>and</strong> colour stability. Meat<br />
Science, 63, 199–209.<br />
Skrlep, M. & C<strong>and</strong>ek-Potokar, M. (2007). Pork color measurement as<br />
affected by bloom time <strong>and</strong> measurement location. Journal of<br />
Muscle Foods, 18, 78–87.<br />
Tikk, K., Lindahl, G., Karlsson, A.H. & Andersen, H.J. (2008). The<br />
significance of diet, slaughter weight <strong>and</strong> ageing time on pork colour<br />
<strong>and</strong> colour stability. Meat Science, 79, 806–816.<br />
Zhu, L.G. & Brewer, M.S. (1998). Discoloration of fresh pork as<br />
related to muscle <strong>and</strong> display conditions. Journal of Food Science,<br />
63, 763–767.<br />
Zhu, L.G., Bidner, B. & Brewer, M.S. (2001). Postmortem pH, muscle,<br />
<strong>and</strong> refrigerated storage effects on ability of vacuum-packaged pork<br />
to bloom. Journal of Food Science, 66, 1230–1235.<br />
International Journal of Food Science <strong>and</strong> Technology 2010 Ó 2010 The Authors. Journal compilation Ó 2010 Institute of Food Science <strong>and</strong> Technology
International Journal of Food Science <strong>and</strong> Technology 2010, 45, 1717–1723 1717<br />
Original article<br />
The capability of rosemary extract in preventing oxidation of fish<br />
lipid<br />
Yesim Ozogul, 1 * Deniz Ayas, 2 Hatice Yazgan, 1 Fatih Ozogul, 1 Esmeray K. Boga 1 & Gulsun Ozyurt 1<br />
1 Department of Seafood Processing Technology, Faculty of Fisheries, University of Cukurova, Adana, Turkey<br />
2 Department of Seafood Processing Technology, Faculty of Fisheries, University of Mersin, Mersin, Turkey<br />
(Received 11 January 2010; Accepted in revised form 26 May 2010)<br />
Summary The effects of rosemary extract at different levels (%1, R1, <strong>and</strong> %2, R2) on the quality of vacuum-packed<br />
sardine in terms of sensory, biochemical (thiobarbituric acid, total volatile basic nitrogen, peroxide value <strong>and</strong><br />
free fatty acids) <strong>and</strong> microbiological analyses (total viable counts) were investigated. Fish were filleted <strong>and</strong><br />
divided into three groups. First group was used as the control (C) without rosemary extract, second group<br />
was treated with 1% rosemary extracts (10 g L )1 ) for 2 min (R1), <strong>and</strong> the third was treated with 2%<br />
rosemary extracts (20 g L )1 ) for 2 min (R2). Thirty fillets per litre were used. After that, all groups were<br />
vacuum-packed in polyethylene bags. The samples were stored in the refrigerator condition (4 ± 1 °C) over<br />
the storage period of 20 days. The results showed that the use of rosemary extract improved the sensory<br />
quality of both raw <strong>and</strong> cooked sardine, most preferably sardine treated with 1% of rosemary. Biochemical<br />
analysis showed that the use of 2% of rosemary extract were found to be most effective (P < 0.05) in<br />
controlling the rate of lipid oxidation.<br />
Keywords Lipid oxidation, quality, rosemary extract, sardine, vacuum package.<br />
Introduction<br />
Fish is one of the most highly perishable food products,<br />
<strong>and</strong> the shelf life of such products is limited in the<br />
presence of atmospheric oxygen <strong>and</strong> the growth of<br />
aerobic spoilage microorganisms. Fish oil contains longchain<br />
polyunsaturated fatty acids (PUFA) such as EPA<br />
(eicosapentaenoic acid, C20:5n3) <strong>and</strong> DHA (docosahexaenoic<br />
acid, C22:6n3) that are considered to have a<br />
number of health benefits. However, the desirable<br />
PUFA content in fish oil is highly vulnerable to<br />
oxidative destruction. Lipid oxidation is a series of<br />
chain reaction with molecular oxygen reacting with<br />
unsaturated lipids to form lipid peroxides resulting in<br />
organoleptic changes of flavour, texture <strong>and</strong> aroma of<br />
food (Sarkardei & Howell, 2008). Synthetic antioxidants<br />
such as ethylenediaminetetraacetic acid, butylated<br />
hydroxyanisole <strong>and</strong> butylated hydroxytoluene can be<br />
added to retard fish oil oxidation, but antioxidants from<br />
natural sources may be used to replace synthetic<br />
antioxidants. Recently, there is an increasing dem<strong>and</strong><br />
for natural antioxidants because of the concern about<br />
safety of synthetic antioxidants. This would not only<br />
*Correspondent: Fax: (90) 322 3386439;<br />
e-mail:yozogul@cu.edu.tr<br />
doi:10.1111/j.1365-2621.2010.02326.x<br />
Ó 2010 The Authors. Journal compilation Ó 2010 Institute of Food Science <strong>and</strong> Technology<br />
prevent omega-3 fatty acid oxidation, but also enhance<br />
the health benefits of the foods by having the additional<br />
health-promoting bioactivity from the herbs or spices. It<br />
was also reported that rosemary extracts contain a large<br />
amount of phenolic compounds such as carnosic acid,<br />
carnosol <strong>and</strong> rosmarinic acid, which have antioxidant<br />
potential (Frankel, 1999). Moreover, Tironi et al. (2009)<br />
found that application of rosemary extract at doses of<br />
200 <strong>and</strong> 500 ppm prevents lipid oxidation of chilled sea<br />
salmon.<br />
Corbo et al. (2008, 2009b) have tested thymol, lemon<br />
extract <strong>and</strong> grape fruit seed extract, at 20, 40 <strong>and</strong><br />
80 ppm, against the main spoilage microorganisms<br />
inoculated in fish burgers stored at 5 °C. Results<br />
showed that all compounds have effect in slowing down<br />
the growth of microorganisms, suggesting that they can<br />
be advantageously used to prolong the shelf life of fresh<br />
fish burger. The combined effect of modified atmosphere<br />
packaging (MAP: 40% CO 2 ⁄ 30% O 2 ⁄ 30% N 2)<br />
<strong>and</strong> oregano essential oil on the shelf life of lightly<br />
salted cultured sea bream fillets stored under refrigeration<br />
was studied by Goulas & Kontominas (2007).<br />
They found that oregano essential oil in combination<br />
with MAP <strong>and</strong> light salting was the most effective<br />
treatment for the preservation of sea bream fillets<br />
followed by MAP.
1718<br />
Rosemary extract in preventing oxidation Y. Ozogul et al.<br />
Mahmoud et al. (2006) established a new technology,<br />
using pretreatment with electrolysed NaCl solutions <strong>and</strong><br />
essential oil compounds, to extend the shelf life of carp<br />
fillets. Samples of skinless carp fillets were treated with<br />
100-fold (by weight) of electrolysed NaCl solutions<br />
[cathodic solution, EW()), <strong>and</strong> ⁄ or anodic solution,<br />
EW(+)] <strong>and</strong> 1% oil (0.5% carvacrol + 0.5% thymol)<br />
[1%(C + T)]. Results indicated that treatment with<br />
EW()) ⁄ EW(+) ⁄ 1%(C + T) extended the shelf life of<br />
carp fillets to 16 <strong>and</strong> 1.3 days compared with 4 <strong>and</strong><br />
0.3 days for the control samples during storage at 5 <strong>and</strong><br />
25 °C, respectively. However, it was also reported that<br />
fish preservation, using electrolysed NaCl solutions <strong>and</strong><br />
1% (carvacrol + thymol), did not affect the quality<br />
(nutritional components) of carp fillets <strong>and</strong> could be a<br />
good alternative to synthetic preservatives used in the<br />
food industry (Mahmoud et al., 2007).<br />
Sardine is commercially important fish species in<br />
Turkey as they are caught in large amounts (17.531 tons<br />
in 2008) (Anon., 2008). Sardine are generally consumed<br />
as fresh, canned or used as fish meal <strong>and</strong> oil in Turkey.<br />
There are many researches on the quality of sardine<br />
stored in ice (Campos et al., 2005) <strong>and</strong> under MAP <strong>and</strong><br />
vacuum packed (VP) conditions (O¨ zogul et al., 2004;<br />
Mendes et al., 2008). The use of rosemary as antioxidant<br />
in different fish <strong>and</strong> fish products has also been reported<br />
(Akhtar et al., 1998; Gimenez et al., 2004, 2005; O¨ zogul<br />
et al., 2009). However, no information is available on<br />
the effects of different level of rosemary extract on the<br />
quality of vacuum-packed sardine stored at 4 °C. The<br />
principal objectives of this investigation were (i) to<br />
determine the shelf life of the sardine treated with<br />
different levels of rosemary extract; (ii) to evaluate some<br />
of the existing objective tests as indices of quality <strong>and</strong><br />
degree of spoilage of vacuum-packed sardine; <strong>and</strong> (iii) to<br />
determine antioxidant effects of rosemary extract on<br />
vacuum-packed sardine (Sardinella pilchardus) fillets<br />
during refrigerated storage.<br />
Materials <strong>and</strong> methods<br />
Rosemary extract <strong>and</strong> preparation of fish<br />
Rosemary (Rosmarinus officinalis) used in this project<br />
was a powder <strong>and</strong> presented by Frey-Lau Company<br />
(Henstedt-Ulzburg, Germany). Rosemary extract was<br />
applied to the fish as described by Akhtar et al. (1998).<br />
Fish (26.97 ± 1.49 g <strong>and</strong> 14.13 ± 0.31 cm) were<br />
caught by seine net in Mersin Bay, Turkey. The duration<br />
of time between harvesting <strong>and</strong> arrival of the fish at the<br />
laboratory was
Analytical techniques<br />
The total volatile basic nitrogen (TVB-N) content of<br />
sardine was determined according to the method of<br />
Antonocopoulus (1973) <strong>and</strong> expressed as mg TVB-N per<br />
100 g muscle. The value of TBA was determined<br />
according to Tarladgis et al. (1960) in fish fillets to<br />
evaluate the oxidation stability during storage period,<br />
<strong>and</strong> the results are expressed as TBA value, milligrams<br />
of malondialdehyde per kg flesh. Free fatty acid (FFA)<br />
analysis, expressed as percentage of oleic acid, was<br />
determined by AOAS (1994). Peroxide value (PV)<br />
expressed in milliequivalents of peroxide oxygen per<br />
kg of fat was determined according to AOAS (1994).<br />
Microbiological analysis<br />
Triplicate samples were taken to estimate total viable<br />
counts (TVC) from each of three different groups. Fish<br />
muscle (10 g) was mixed with 90 mL of Ringer solution<br />
<strong>and</strong> then stomached for 3 min. Further decimal dilutions<br />
were made, <strong>and</strong> then 0.1 mL of each dilution was<br />
pipetted onto the surface of plate count agar (Fluka<br />
70152, Steinheim, Switzerl<strong>and</strong>) plates in triplicate. They<br />
were then incubated for 2 days at 30 °C.<br />
Statistical analysis<br />
A completely r<strong>and</strong>omised designed was used. The data<br />
were subjected to analysis of variance <strong>and</strong> Duncan’s<br />
multiple range tests. A SPSS statistical package (version<br />
8.0; SPSS Inc., Chicago, IL, USA) was adapted to a<br />
personal computer.<br />
Results <strong>and</strong> discussion<br />
Sensory analyses<br />
Sensory evaluation of vacuum-packed sardine fillets (C,<br />
R1 <strong>and</strong> R2) reached the limits of acceptance 13, 17 <strong>and</strong><br />
Table 1 Quality index method for sardine in VP<br />
Storage<br />
days<br />
Control (C)<br />
X Sx<br />
0 0.00 ± 0.00 a<br />
3 0.75 ± 0.2 a<br />
6 1.17 ± 0.29 b<br />
10 4.33 ± 0.58 b<br />
13 12.50 ± 2.52 b<br />
17 14.00 ± 1.41 b<br />
20 16.67 ± 0.58 a<br />
R1<br />
X Sx<br />
0.00 ± 0.00 a<br />
0.63 ± 0.21 a<br />
0.87 ± 0.16 a<br />
2.83 ± 0.47 a<br />
6.00 ± 0.65 a<br />
11.83 ± 2.32 ab<br />
16.50 ± 0.55 a<br />
R2<br />
X Sx<br />
0.00 ± 0.00 a<br />
0.63 ± 0.19 a<br />
0.83 ± 0.20 a<br />
2.67 ± 0.51 a<br />
5.50 ± 0.36 a<br />
10.50 ± 1.64 a<br />
16.33 ± 0.58 a<br />
Different letters in the same row indicate significant differences<br />
(P < 0.05).<br />
Maximum demerit point: 17; X Sx, average ± st<strong>and</strong>ard deviation; C,<br />
control; R1, %1 rosemary; R2, 2% rosemary.<br />
Rosemary extract in preventing oxidation Y. Ozogul et al. 1719<br />
20 days of storage, respectively (Table 1). End of shelf life<br />
is usually determined when spoilage-related sensory<br />
attributes such as trimethylamine (TMA), off-odour <strong>and</strong><br />
favour become strong, caused mainly by microbial origin<br />
(Huss, 1995). Sardine contains high level of PUFA, which<br />
is susceptible to autooxidation causing off-odours <strong>and</strong><br />
browning of flesh colour. The off-flavour intensity of the<br />
treatment groups remained at low levels compared to the<br />
control group until the end of the storage period (day 20).<br />
The application of rosemary extract to the vacuumpacked<br />
sardine fillets stored at 4 °C led to an improvement<br />
in the appearance <strong>and</strong> odour of the samples, which<br />
received higher scores than those of the control<br />
(P < 0.05) from day 6 onwards (Table 1). Off-odour<br />
<strong>and</strong> off-flavour were detected towards the end of storage<br />
period as a result of the strong rosemary flavour.<br />
Although the effect of 1% of rosemary extract was lower<br />
in the samples than those treated with 2% rosemary<br />
extract, no significant differences (P >0.05) were found<br />
between samples treated with rosemary extract. The use<br />
of rosemary extract improved the sensory quality of<br />
sardine. Similar results were obtained from the other<br />
studies (Vareltzis et al., 1997; Akhtar et al., 1998;<br />
Gimenez et al., 2004, 2005) .<br />
It was reported that the progress of decomposition<br />
showed off-odour after 9 days for sardine in VP (Özogul<br />
et al., 2004) <strong>and</strong> 8 days for herring in VP (O¨ zogul et al.,<br />
2000). In this research, shelf life of sardine (the control)<br />
without rosemary extract was 13 days. The reason for<br />
this longer shelf life is that fish were iced immediately<br />
after harvesting <strong>and</strong> also the short time between catch<br />
<strong>and</strong> storage ( 0.05) until 6 day. After that, significant<br />
differences (P < 0.05) were found between the control<br />
<strong>and</strong> treatment groups. Significant differences were also<br />
observed (P < 0.05) between R1 <strong>and</strong> R2 on day 17 <strong>and</strong><br />
20. Off-flavour <strong>and</strong> off-odour of the control group, R1<br />
<strong>and</strong> R2 were detected on 13, 17 <strong>and</strong> 20 day of storage,<br />
respectively, as found for raw sardine by QIM. Because<br />
the flavour <strong>and</strong> taste of rosemary extract was much<br />
stronger in R2 than in R1, R1 group was mostly<br />
preferred by the panellists.<br />
Chemical assessment<br />
The proximate composition of the sardine was the<br />
following: 20.60 ± 0.55% protein, 9.15 ± 0.84% lipid,<br />
Ó 2010 The Authors. Journal compilation Ó 2010 Institute of Food Science <strong>and</strong> Technology International Journal of Food Science <strong>and</strong> Technology 2010
1720<br />
Rosemary extract in preventing oxidation Y. Ozogul et al.<br />
Table 2 Sensory analyses of cooked sardine in VP<br />
Storage days Colour X Sx Odour X Sx Taste X Sx Firmness X Sx General acceptance X Sx Groups<br />
0 9.00 ± 0.00 a<br />
9.00 ± 0.00 a<br />
9.00 ± 0.00 a<br />
3 8.57 ± 0.54 a<br />
8.43 ± 0.54 a<br />
8.71 ± 0.49 a<br />
6 7.57 ± 0.54 a<br />
7.57 ± 0.54 a<br />
7.57 ± 0.54 a<br />
10 7.00 ± 0.00 a<br />
7.57 ± 0.54 b<br />
7.57 ± 0.54 b<br />
13 5.43 ± 1.13 a<br />
6.57 ± 0.54 b<br />
6.71 ± 0.49 b<br />
17 1.86 ± 0.90 a<br />
3.29 ± 0.49 b<br />
7.00 ± 0.00 c<br />
20 1.57 ± 0.54 a<br />
2.71 ± 0.49 b<br />
4.00 ± 0.00 c<br />
9.00 ± 0.00 a<br />
9.00 ± 0.00 a<br />
9.00 ± 0.00 a<br />
9.00 ± 0.00 a<br />
8.86 ± 0.38 a<br />
9.00 ± 0.00 a<br />
7.57 ± 0.54 a<br />
8.00 ± 0.00 ab<br />
8.29 ± 0.49 b<br />
6.57 ± 0.54 a<br />
7.57 ± 0.54 b<br />
8.00 ± 0.00 b<br />
4.14 ± 0.90 a<br />
6.86 ± 0.38 b<br />
7.00 ± 0.00 b<br />
2.29 ± 0.49 a<br />
3.57 ± 0.54 b<br />
6.43 ± 0.54 c<br />
1.29 ± 0.49 a<br />
2.29 ± 0.49 b<br />
3.71 ± 0.49 c<br />
9.00 ± 0.00 a<br />
9.00 ± 0.00 a<br />
9.00 ± 0.00 a<br />
8.86 ± 0.38 a<br />
8.86 ± 0.38 a<br />
9.00 ± 0.00 a<br />
7.57 ± 0.54 a<br />
8.00 ± 0.00 a<br />
8.57 ± 0.54 b<br />
6.57 ± 0.54 a<br />
7.86 ± 0.38 b<br />
8.00 ± 0.00 b<br />
4.00 ± 0.82 a<br />
6.57 ± 0.54 b<br />
6.71 ± 0.49 b<br />
2.29 ± 0.49 a<br />
3.57 ± 0.54 b<br />
6.43 ± 0.54 c<br />
1.00 ± 0.00 a<br />
2.71 ± 0.49 b<br />
3.71 ± 0.49 c<br />
68.66 ± 0.35% moisture <strong>and</strong> 1.33 ± 0.23% ash. Variations<br />
in chemical composition of sardine, mainly in<br />
lipid <strong>and</strong> moisture, were reported (O¨ zogul et al., 2004;<br />
Erkan & Ozden, 2008; Mendes et al., 2008). The<br />
variation in the chemical composition of fish is related<br />
to nutrition, living area, fish size, catching season,<br />
seasonal <strong>and</strong> sexual variations as well as other environmental<br />
conditions. Because sardine contains high level<br />
of lipid, care must be taken to preserve the quality as<br />
fresh as possible after harvesting.<br />
TVB-N is a product of bacterial spoilage <strong>and</strong> endogenous<br />
enzymes action, <strong>and</strong> its content is often used as an<br />
index to assess the keeping quality <strong>and</strong> shelf life of<br />
products (EEC, 1995). TVB-N is a general term that<br />
includes the measurement of TMA, dimethylamine,<br />
ammonia <strong>and</strong> other volatile basic nitrogenous compounds<br />
associated with seafood spoilage (Huss, 1995).<br />
In this study, TVB-N concentrations of all groups<br />
are shown in Table 3. TVB-N content of all groups<br />
increased with storage time. The maximum permissible<br />
level of TVB-N in fish <strong>and</strong> fishery products is<br />
35 mg 100 g )1 (EEC, 1995). At the beginning of storage,<br />
the initial TVB-N value was 20.59 mg 100 g )1 flesh <strong>and</strong><br />
increased to 34.29 mg TVB-N 100 g )1 at day 13 for the<br />
control, 33.64 mg TVB-N 100 g )1 at day 17 for R1 <strong>and</strong><br />
35.82 mg TVB-N 100 g )1 , in which all samples in VP<br />
were rejected by the sensory panellists. The lowest TVB-<br />
N value (P < 0.05) was obtained from R2 followed by<br />
R1 <strong>and</strong> the control during storage period. In this study,<br />
9.00 ± 0.00 a<br />
9.00 ± 0.00 a<br />
9.00 ± 0.00 a<br />
8.86 ± 0.38 a<br />
9.00 ± 0.00 a<br />
9.00 ± 0.00 a<br />
7.57 ± 0.54 a<br />
7.57 ± 0.54 a<br />
8.29 ± 0.49 b<br />
6.57 ± 0.54 a<br />
7.29 ± 0.49 b<br />
7.71 ± 0.49 b<br />
4.14 ± 0.90 a<br />
6.86 ± 0.38 b<br />
6.71 ± 0.49 b<br />
1.57 ± 0.54 a<br />
3.57 ± 0.54 b<br />
6.43 ± 0.54 c<br />
1.00 ± 0.00 a<br />
2.14 ± 0.90 b<br />
3.43 ± 0.98 c<br />
Different letters in the same column for each storage days indicate significant differences (P < 0.05).<br />
X Sx, average ± st<strong>and</strong>ard deviation; C, control; R1, 1% rosemary; R2, 2% rosemary.<br />
9.00 ± 0.00 a<br />
9.00 ± 0.00 a<br />
9.00 ± 0.00 a<br />
8.86 ± 0.38 a<br />
9.00 ± 0.00 a<br />
9.00 ± 0.00 a<br />
7.57 ± 0.54 a<br />
8.00 ± 0.00 b<br />
8.00 ± 0.00 b<br />
6.57 ± 0.54 a<br />
7.86 ± 0.38 b<br />
8.00 ± 0.00 b<br />
3.71 ± 0.49 a<br />
6.86 ± 0.38 b<br />
7.00 ± 0.00 b<br />
1.57 ± 0.54 a<br />
3.57 ± 0.54 b<br />
6.43 ± 0.54 c<br />
1.00 ± 0.00 a<br />
2.00 ± 0.00 b<br />
3.71 ± 0.49 c<br />
C<br />
R1<br />
R2<br />
C<br />
R1<br />
R2<br />
C<br />
R1<br />
R2<br />
C<br />
R1<br />
R2<br />
C<br />
R1<br />
R2<br />
C<br />
R1<br />
R2<br />
C<br />
R1<br />
R2<br />
Table 3 Changes in the value of total volatile basic nitrogen in sardine<br />
during storage period<br />
Storage days<br />
0 20.59 ± 1.20 a<br />
3 22.44 ± 0.44 b<br />
6 25.10 ± 0.12 a<br />
10 30.67 ± 0.40 c<br />
13 34.29 ± 0.69 c<br />
17 45.79 ± 1.13 b<br />
20 45.96 ± 1.42 c<br />
Control R1 R2<br />
X Sx X Sx X Sx<br />
20.59 ± 1.20 a<br />
23.10 ± 0.32 c<br />
24.74 ± 1.06 a<br />
28.13 ± 0.41 b<br />
32.80 ± 0.31 b<br />
33.64 ± 0.50 a<br />
40.65 ± 0.43 b<br />
20.59 ± 1.20 a<br />
21.43 ± 0.06 a<br />
24.79 ± 0.26 a<br />
25.78 ± 0.80 a<br />
27.15 ± 0.77 a<br />
33.25 ± 0.37 a<br />
35.82 ± 0.29 a<br />
Different letters in the same row indicate significant differences<br />
(P < 0.05).<br />
X Sx, average ± st<strong>and</strong>ard deviation; C, control; R1, 1% rosemary; R2,<br />
2% rosemary.<br />
when the TVB-N level exceeded the maximum value,<br />
samples were already refused by the panellists. Therefore,<br />
TVB-N values correlated well with the results of<br />
sensory analyses, providing a good index for the<br />
assessment of sardine in VP.<br />
Shelf life of oily fish species is limited because of the<br />
oxidation of lipid. The primary product of lipid<br />
oxidation is fatty acid hydroperoxide, measured as<br />
PV. Peroxides are unstable compounds, <strong>and</strong> they break<br />
down to aldehydes, ketones <strong>and</strong> alcohols that are<br />
volatile products causing off-flavour in products<br />
International Journal of Food Science <strong>and</strong> Technology 2010 Ó 2010 The Authors. Journal compilation Ó 2010 Institute of Food Science <strong>and</strong> Technology
Table 4 Changes in the value of peroxide value in sardine during<br />
storage period<br />
Storage<br />
days<br />
0 4.32 ± 1.10 a<br />
3 19.56 ± 1.62 b<br />
6 10.46 ± 0.71 ab<br />
10 10.24 ± 1.30 b<br />
13 8.72 ± 1.52 a<br />
17 13.48 ± 0.92 b<br />
20 14.28 ± 2.70 b<br />
Control R1 R2<br />
X Sx X Sx X Sx<br />
4.32 ± 1.10 a<br />
11.24 ± 0.21 a<br />
8.06 ± 1.97 a<br />
9.04 ± 0.80 ab<br />
8.93 ± 1.22 a<br />
14.74 ± 1.37 b<br />
10.73 ± 1.21 a<br />
4.32 ± 1.10 a<br />
9.12 ± 1.27 a<br />
11.31 ± 0.47 b<br />
7.12 ± 0.90 a<br />
8.59 ± 0.95 a<br />
10.77 ± 0.35 a<br />
9.51 ± 0.72 a<br />
Different letters in the same row indicate significant differences<br />
(P < 0.05).<br />
X Sx, average ± st<strong>and</strong>ard deviation; C, control; R1, 1% rosemary; R2,<br />
2% rosemary.<br />
(Hamilton et al., 1997). Peroxide <strong>and</strong> thiobarbituric<br />
acid (TBA) values are the major chemical indices to<br />
measure the degree of oxidative rancidity. In this study,<br />
the PV of oil extracted from the sardine fillets treated<br />
with <strong>and</strong> without antioxidants increased up to 3 days<br />
for the control <strong>and</strong> R1 <strong>and</strong> 6 days for R2, after<br />
which the values fluctuated during storage period<br />
(Table 4). Although there were no significant differences<br />
(P > 0.05) among the groups, significant differences<br />
were observed (P < 0.05) on days 3 <strong>and</strong> 20<br />
between samples with antioxidant (R1 <strong>and</strong> R2) <strong>and</strong> the<br />
control without antioxidant. The initial value of<br />
sardine was found, 4.32 meq kg )1 , which was lower<br />
than 27.6 meq kg )1 reported for fresh sardine by Cho<br />
et al. (1989). During storage period, the sardine with<br />
rosemary extract showed generally low lipid oxidation<br />
compared to the control without rosemary extract as<br />
reported for other fish species (Vareltzis et al., 1997;<br />
Gimenez et al., 2004, 2005; Da Silva Afonso &<br />
Santana, 2008; Sarkardei & Howell, 2008; Tironi et al.,<br />
2009).<br />
TBA is second breakdown product of lipid oxidation<br />
<strong>and</strong> widely used as an indicator of degree of lipid<br />
oxidation. The concentration of TBA in freshly caught<br />
fish is typically between 3 <strong>and</strong> 5 mg of malondialdehyde<br />
(MDA) equivalents per kilogram flesh, but levels of<br />
5–8 mg of MDA equivalents per kilogram of flesh are<br />
generally regarded as the limit of acceptability for fish<br />
stored in ice (Nunes et al., 1992). Table 5 also shows<br />
TBA contents in the different treatments during storage.<br />
TBA values indicating rancidity development in the all<br />
fish flesh remained low ( 0.05) in FFA concentrations<br />
were observed between the treatment groups<br />
(R1 <strong>and</strong> R2) throughout storage period. Although the<br />
release of FFA increased from the initial value of 2.88<br />
(expressed as percentage of oleic acid) to the final value<br />
of 7.23 for the control, 5.98 for R1 <strong>and</strong> 6.13 for R2 at<br />
the end of storage period, lipid hydrolysis developed at a<br />
Table 6 Changes in the value of free fatty acids during storage period<br />
Storage days<br />
Rosemary extract in preventing oxidation Y. Ozogul et al. 1721<br />
0 2.88 ± 0.96 a<br />
3 2.79 ± 0.22 a<br />
6 3.11 ± 0.37 a<br />
10 3.40 ± 1.10 a<br />
13 3.39 ± 0.61 a<br />
17 6.67 ± 0.19 b<br />
20 7.23 ± 0.43 a<br />
Control R1 R2<br />
X Sx X Sx X Sx<br />
2.88 ± 0.96 a<br />
2.65 ± 0.26 a<br />
2.83 ± 0.51 a<br />
3.37 ± 0.27 a<br />
3.97 ± 1.82 a<br />
5.34 ± 0.29 a<br />
5.98 ± 1.00 a<br />
2.88 ± 0.96 a<br />
3.03 ± 0.32 a<br />
3.37 ± 0.07 a<br />
3.60 ± 0.26 a<br />
3.10 ± 0.22 a<br />
5.09 ± 0.39 a<br />
6.13 ± 0.90 a<br />
Different letters in the same row indicate significant differences<br />
(P < 0.05).<br />
X Sx, average ± st<strong>and</strong>ard deviation; C, control; R1, 1% rosemary; R2,<br />
2% rosemary.<br />
Ó 2010 The Authors. Journal compilation Ó 2010 Institute of Food Science <strong>and</strong> Technology International Journal of Food Science <strong>and</strong> Technology 2010
1722<br />
Rosemary extract in preventing oxidation Y. Ozogul et al.<br />
Log CFU g –1<br />
12<br />
10<br />
8<br />
6<br />
4<br />
2<br />
0<br />
0 3 6 10<br />
Storage days<br />
13 17 20<br />
slower rate in the samples treated with rosemary extract,<br />
regardless of the level of antioxidant.<br />
Microbiological assessment<br />
TVC content of sardine in VP<br />
Control<br />
R1<br />
R2<br />
Figure 1 Total viable count (TVC) of sardine in VP at 4 °C.<br />
TVC are used as an acceptability index for fish products<br />
because of the effect of bacteria in spoilage. TVC<br />
determined in sardine fillets were initially 4.22 log<br />
CFU g )1 , which was higher than those reported for<br />
sardine (El Marrakchi et al., 1990; O¨ zogul et al., 2004).<br />
Comparison with the proposed limits (5–7 log CFU g )1 )<br />
for fresh fish (ICMSF, 1986) shows that sardine fillets<br />
were of good quality. TVC increased with storage time<br />
for all groups (Fig. 1), <strong>and</strong> the growth of microorganisms<br />
exceeded the limit on day 10 for the control, on<br />
day 13 for R1 <strong>and</strong> on day 17 for R2. It can be<br />
concluded that the shelf life of sardine in VP was<br />
approximately 8–9 days for the control, 11–12 days<br />
for R1 <strong>and</strong> 13–14 for R2, indicating that sensory<br />
analysis did not correlated well with microbiological<br />
analysis.<br />
Lemon extract <strong>and</strong> thymol in combination with MAP<br />
significantly (P < 0.05) reduced the growth rate of<br />
bacterial population compared with the control (Del<br />
Nobile et al., 2009). In this study, changes in TVC<br />
during storage also showed the existence of a reduced<br />
growth in the samples with rosemary extract. The result<br />
obtained from sensory evaluation, after rosemary treatment,<br />
showed a longer shelf life when compared with<br />
microbiological results. The spoilage rate of fish depends<br />
on the species <strong>and</strong> type, the initial microbial flora, the<br />
location of the catch, the content of the catch, processing<br />
methods <strong>and</strong> method of storage. After being caught<br />
<strong>and</strong> h<strong>and</strong>led, fish are exposed to additional contamination<br />
on board fishing vessels. Unhygienic practices,<br />
especially unwashed h<strong>and</strong>s, clothes, equipment, decks<br />
<strong>and</strong> storage facilities, can contaminate fish. To avoid<br />
contamination of fish, all equipment must be cleaned<br />
<strong>and</strong> sanitized.<br />
Conclusion<br />
Based primarily on sensory assessment, vacuum-packed<br />
sardine fillets (C, R1 <strong>and</strong> R2) reached the limits of<br />
acceptance 13, 17 <strong>and</strong> 20 days of storage, respectively.<br />
The use of rosemary extract improved the sensory<br />
quality of both raw <strong>and</strong> cooked sardine, most preferably<br />
sardine treated with 1% of rosemary extract. However,<br />
biochemical analysis showed that the use of 2% of<br />
rosemary extract in combination with VP was found to<br />
be most effective (P < 0.05) in controlling the rate of<br />
lipid oxidation. Rosemary extract could be used in fish<br />
preservation as a natural preservative agent.<br />
References<br />
Akhtar, P., Gray, J.I., Gomaa, E.A. & Boore, A.M. (1998). Effect of<br />
dietary components <strong>and</strong> surface application of oleoresin rosemary<br />
on lipid stability of rainbow trout (Oncorhynchus mykiss) muscle<br />
during refrigerated <strong>and</strong> frozen storage. Journal of Food Lipids, 5,<br />
43–58.<br />
Anon. (2008). Fisheries Statistics. Ankara: State Institute of Statistics,<br />
Prime Ministry Republic of Turkey.<br />
Antonocopoulus, N. (1973). Bestmmung des Flüchhtigen Basensticktoofs.<br />
In: Fische und Fischerzeugnisse (edited by W. Ludorf<br />
& V. Meyer). Pp. 224–225. Berlin und Hamburg: Aulage Verlag Paul<br />
Parey.<br />
AOAC. (1984). Official Methods of Analysis of the Association of the<br />
Official Analysis Chemists. Association of Official Analytical Chemists,<br />
14th edn. Washington, DC: AOAC.<br />
AOAC. (1990). Official Methods of Analysis of the Association of the<br />
Official Analysis Chemists. Association of Official Analytical Chemists,<br />
15th edn. Washington, DC: AOAC.<br />
AOAS. (1994). Official Methods <strong>and</strong> Recommended Practices of the<br />
American Oil Chemists’ Society, the American Oil Chemists’ Society.<br />
Champaign, IL: AOAS.<br />
Bligh, E.C. & Dyer, W.J. (1959). A rapid method of total lipid<br />
extraction <strong>and</strong> purification. Canadian Journal of Biochemistry <strong>and</strong><br />
Physiology, 37, 913–917.<br />
Bonilla, A.C., Sveinsdottir, K. & Martinsdottir, E. (2007). Development<br />
of Quality Index Method (QIM) scheme for fresh cod (Gadus<br />
morhua) fillets <strong>and</strong> application in shelf life study. Food Control, 18,<br />
352–358.<br />
Campos, C.A., Rodríguez, O., Losada, V., Aubourg, S.P. & Barros-<br />
Velázquez, J. (2005). Effects of storage in ozonised slurry ice on the<br />
sensory <strong>and</strong> microbial quality of sardine (Sardina pilchardus).<br />
International Journal of Food Microbiology, 103, 121–130.<br />
Cho, S., Endo, Y., Fujimoto, K. & Kaneda, T. (1989). Oxidative<br />
deterioration of lipids in salted <strong>and</strong> dried sardines during storage at<br />
5 °C. Nippon Suisan Gakkaishi, 55, 541–544.<br />
Corbo, M.R., Speranza, B., Filippone, A. et al. (2008). Study on the<br />
synergic effect of natural compounds on the microbial quality decay<br />
of packed fish hamburger. International Journal of Food Microbiology,<br />
127, 261–267.<br />
Corbo, M.R., Di Giulio, S., Conte, A., Speranza, B., Sinigaglia, M. &<br />
Del Nobile, M.A. (2009a). Thymol <strong>and</strong> modified atmosphere<br />
packaging to control microbiological spoilage in packed fresh cod<br />
hamburgers. International Journal of Food Science & Technology, 44,<br />
1553–1560.<br />
Corbo, M.R., Speranza, B., Filippone, A., Conte, A., Sinigaglia, M. &<br />
Del Nobile, M.A. (2009b). Natural compounds to preserve fresh fish<br />
burgers. International Journal of Food Science <strong>and</strong> Technology, 44,<br />
2021–2027.<br />
Da Silva Afonso, M. & Santana, L.S. (2008). Effects of pretreatment<br />
with rosemary (Rosmarinus officinalis) in the prevention of lipid<br />
International Journal of Food Science <strong>and</strong> Technology 2010 Ó 2010 The Authors. Journal compilation Ó 2010 Institute of Food Science <strong>and</strong> Technology
oxidation in salted tilapia fillets. Journal of Food Quality, 31, 586–<br />
595.<br />
Del Nobile, M.A., Corbo, M.R., Speranza, B., Sinigaglia, M., Conte,<br />
A. & Caroprese, M. (2009). Combined effect of MAP <strong>and</strong> active<br />
compounds on fresh blue fish burger. International Journal of Food<br />
Microbiology, 135, 281–287.<br />
EEC. (1995). Decision 95 ⁄ 149 ⁄ EC. Total volatile basic nitrogen<br />
TVBN limit values for certain categories of fishery products <strong>and</strong><br />
specifying the analysis methods to be used. Official Journal, L 097,<br />
84–87.<br />
El Marrakchi, A., Bouchrit, N., Bennour, N., Hamama, A. & Tagafit,<br />
H. (1990). Sensory, chemical <strong>and</strong> microbiological assessments of<br />
Moroccan sardines (Sardina pilchardus) stored in ice. Journal of<br />
Food Protection, 53, 600–605.<br />
Erkan, N. & Ozden, O. (2008). Quality assessment of whole <strong>and</strong> gutted<br />
sardines (Sardina pilchardus) stored in ice. International Journal of<br />
Food Science <strong>and</strong> Technology, 43, 1549–1559.<br />
Frankel, E.N. (1999). Food antioxidants <strong>and</strong> phytochemicals: present<br />
<strong>and</strong> future perspectives. European Journal of Lipid Science <strong>and</strong><br />
Technology, 101, 450–455.<br />
Gimenez, B., Roncales, P. & Beltran, J.A. (2004). The effects of natural<br />
antioxidants <strong>and</strong> lighting conditions on the quality characteristics of<br />
gilt-head sea bream fillets (Sparus aurata) packaged in a modified<br />
atmosphere. Journal of the Science of Food <strong>and</strong> Agriculture, 84,<br />
1053–1060.<br />
Gimenez, B., Roncales, P. & Beltran, J.A. (2005). The effects of natural<br />
antioxidants <strong>and</strong> lighting conditions on the quality of salmon (Salmo<br />
salar) fillets packaged in modified atmosphere. Journal of the Science<br />
of Food <strong>and</strong> Agriculture, 85, 1033–1040.<br />
Goulas, A.E. & Kontominas, M.G. (2007). Combined effect of light<br />
salting, modified atmosphere packaging <strong>and</strong> oregano essential oil on<br />
the shelf-life of sea bream (Sparus aurata): biochemical <strong>and</strong> sensory<br />
attributes. Food Chemistry, 100, 287–296.<br />
Hamilton, R.J., Kalu, C., Prisk, E., Padley, F.B. & Pierce, H.<br />
(1997). Chemistry of free radicals in lipids. Food Chemistry, 60,<br />
193–199.<br />
Huss, H.H. (1995). Quality <strong>and</strong> Quality Changes in Fresh Fish. Pp. 195.<br />
Rome: FAO.<br />
ICMSF. (1986). Microorganisms in Foods. The International Commission<br />
on Microbiological Specifications for Foods of the International<br />
Union of Biological Societies. Pp. 181–196. Oxford: Blackwell<br />
Scientific Publications.<br />
Mahmoud, B.S.M., Yamazaki, K., Miyashita, K., Shin, I.S., Chong,<br />
D. & Suzuki, T. (2006). A new technology for fish preservation by<br />
combined treatment with 1 electrolyzed NaCl solutions <strong>and</strong> essential<br />
oil compounds. Food Chemistry, 99, 656–662.<br />
Rosemary extract in preventing oxidation Y. Ozogul et al. 1723<br />
Mahmoud, B.S.M., Kawai, Y., Yamazaki, K., Miyashita, K. &<br />
Suzuki, T. (2007). Effect of treatment with electrolyzed NaCl<br />
solutions <strong>and</strong> essential oil compounds on the proximate composition,<br />
amino acid <strong>and</strong> fatty acid composition of carp fillets. Food<br />
Chemistry, 101, 1492–1498.<br />
Mendes, R., Pestana, C. & Gonçalves, A. (2008). The effects of soluble<br />
gas stabilisation on the quality of packed sardine fillets (Sardina<br />
pilchardus) stored in air, VP <strong>and</strong> MAP. International Journal of Food<br />
Science <strong>and</strong> Technology, 43, 2000–2009.<br />
Nunes, M.L., Batista, I. & Morao de Campos, R. (1992). Physical,<br />
chemical <strong>and</strong> sensory analysis of Sardine (Sardine pilchardus) stored<br />
in ice. Journal of Science of Food <strong>and</strong> Agriculture, 59, 37–43.<br />
Özogul, F., Taylor, K.D.A., Quantick, P. & Özogul, Y. (2000). A rapid<br />
HPLC determination of ATP related compounds <strong>and</strong> its application<br />
to herring stored under modified atmosphere. International Journal<br />
of Food Science <strong>and</strong> Technology, 35, 549–554.<br />
Özogul, F., Polat, A. & Özogul, Y. (2004). The effects of modified<br />
atmosphere packaging <strong>and</strong> vacuum packaging on chemical, sensory<br />
<strong>and</strong> microbiological changes of sardines (Sardina pilchardus). Food<br />
Chemistry, 85, 49–57.<br />
Özogul, Y., Ozyurt, G. & Boga, E.K. (2009). Effects of cooking <strong>and</strong><br />
reheating methods on the fatty acid profile of sea bream treated with<br />
rosemary extract. Journal of the Science of Food <strong>and</strong> Agriculture, 89,<br />
1481–1489.<br />
Pastoriza, L., Sampedro, G., Herrera, J.J. & Herrera, L.C.M. (1996).<br />
Effect of modified atmosphere packaging on shelf-life of iced hake<br />
slices. Journal of the Science of Food <strong>and</strong> Agriculture, 71, 541–547.<br />
Paulus, K., Zacharıas, R., Robınson, L. & Geıdel, H. (1979). Kritische<br />
Betrachtungen Zur ‘‘Bewetenden Pru¨ fung Mit Skale’’ Als Einem<br />
Wesentlichen Verfahren Der Sensorichen Analyse. LWT, 12, 52–61.<br />
Sarkardei, S. & Howell, N.K. (2008). Effect of natural antioxidants on<br />
stored freeze-dried food product formulated using horse mackerel<br />
(Trachurus trachurus). International Journal of Food Science <strong>and</strong><br />
Technology, 43, 309–315.<br />
Tarladgis, B., Watts, B.M. & Yonathan, M. (1960). Distillation<br />
method for determination of malonaldehyde in rancid food. Journal<br />
of American Oil Chemistry Society, 37, 44–48.<br />
Tironi, V., Toma´s, M. & An˜ o´n, M. (2009). Lipid <strong>and</strong> protein changes<br />
in chilled sea salmon (Pseudopercis semifasciata): effect of previous<br />
rosemary extract (Rossmarinus officinalis L.) application. International<br />
Journal of Food Science & Technology, 44, 1254–1262.<br />
Vareltzis, K., Koufidis, D., Gavriilidou, E., Papavergou, E. &<br />
Vasiliadour, S. (1997). Effectiveness of a natural Rosemary (Rosmarinus<br />
officinalis) extract on the stability of filleted <strong>and</strong> minced fish<br />
during frozen storage. Zeitschrift fur Lebensmittel –Untersuchung<br />
und -Forschung A, 205, 93–96.<br />
Ó 2010 The Authors. Journal compilation Ó 2010 Institute of Food Science <strong>and</strong> Technology International Journal of Food Science <strong>and</strong> Technology 2010
1724<br />
Original article<br />
Kinetics of ascorbic acid degradation <strong>and</strong> colour change in ground<br />
cashew apples treated at high temperatures (100–180 °C)<br />
Janice R. Lima, 1 * Nadiarid J. Elizondo 2 & Philippe Bohuon 3<br />
1 Embrapa Agroindústria Tropical, R. Dra. Sara Mesquita, 2270, Pici, 60511-110 Fortaleza – CE, Brazil<br />
2 Escuela de Tecnología de Alimentos, Universidad de Costa Rica, Apartado Postal 11501–2060, San Jose´, Costa Rica<br />
3 Montpellier SupAgro, UMR QualiSud, Cirad, 1101 avenue Agropolis, CS 24501, 34093 Montpellier cedex 5, France<br />
(Received 5 March 2010; Accepted in revised form 26 May 2010)<br />
Summary Ascorbic acid (AA) degradation <strong>and</strong> colour changes, measured by the lightness index (L*), were determined<br />
in cashew apples (at low dissolved O 2 concentrations) heated at high temperature (100–180 °C) in a<br />
hermetically sealed cell. A nonisothermal method was developed to estimate thermal degradation kinetics.<br />
The results showed that reaction kinetics during heat treatments were well represented by first-order<br />
reactions. The temperature dependence of the kinetic constants was described by an Arrhenius type equation.<br />
The activation energy (E a) for AA degradation <strong>and</strong> lightness index were 94 ± 3 <strong>and</strong> 98 ± 3 kJ mol )1 ,<br />
respectively. The reaction rate constant at 140 °C for AA degradation (64 · 10 )5 ±3· 10 )5 s )1 ) was twice<br />
that for the lightness index change (33 · 10 )5 ±2· 10 )5 s )1 ). Results allow generating temperature profiles<br />
of heat processes that would help preserve the AA of cashew apples as well as control the colour formation<br />
during high-temperature processes.<br />
Keywords Anacardium occidentale L., browning, heat treatment, modelling, vitamin C.<br />
Introduction<br />
Cashew production represents an important economic<br />
activity for many tropical countries. Although cashew<br />
apples contribute to human nutrition by supplying<br />
ascorbic acid (AA) (averaging 200 mg (100 g) )1 ), they<br />
are often considered as a by-product, wasted <strong>and</strong> left to<br />
rot under trees after the nut harvest (Azoubel & Murr,<br />
2003; Azoubel et al., 2009; Oliveira et al., 2009).<br />
The vitamin C content, including ascorbic <strong>and</strong> dehydroascorbic<br />
acids, besides being an indicator of nutrient<br />
value, can be used as a reliable <strong>and</strong> representative index<br />
for estimating quality deterioration during processing.<br />
Through oxidation, AA is transformed into dehydroascorbic<br />
acid, which is irreversibly hydrolyzed to 2,3diketogulonic<br />
acid, which has no vitamin C activity.<br />
Anaerobic destruction of AA yields carbon dioxide <strong>and</strong><br />
furfural <strong>and</strong> has a slower rate than the aerobic path<br />
(Pa´tkai et al., 2002).<br />
Discolouration <strong>and</strong> browning because of thermal<br />
treatments of fruits result from various reactions. The<br />
Maillard condensation between reducing sugars <strong>and</strong><br />
amino acids, caramelisation, AA browning <strong>and</strong> pigment<br />
*Correspondent: E-mail: janice@cnpat.embrapa.br<br />
International Journal of Food Science <strong>and</strong> Technology 2010, 45, 1724–1731<br />
destruction are some examples (Damasceno et al.,<br />
2008).<br />
Research has been carried out on the AA degradation<br />
<strong>and</strong> colour formation based on isothermal methods at<br />
temperatures up to 100 °C, mainly using first-order<br />
kinetics <strong>and</strong> modelling the temperature dependence by<br />
the Arrhenius equation (Ibarz et al., 1999, 2000; Manso<br />
et al., 2001; Chutintrasri & Noomhorm, 2007; Dhuique-<br />
Mayer et al., 2007). However, certain industrial processes,<br />
such as frying, use temperatures of up to 180 °C.<br />
Above 100 °C, isothermal methods cannot be used to<br />
estimate degradation kinetics as the duration of the<br />
heating up <strong>and</strong> cooling down phases are too large to be<br />
ignored. Garrote et al. (2009) reported the use of<br />
nonlinear regression to obtain kinetics parameters to<br />
successfully predict AA degradation in canned peas<br />
during sterilisation.<br />
The purpose of this study is, first, to experimentally<br />
quantify the AA content [C (t) ] <strong>and</strong> lightness index [L (t) ]<br />
in cashew apples during heat treatments; second, to<br />
develop a kinetic model to describe C (t) <strong>and</strong> L (t) in heat<br />
situations, using a nonisothermal method; <strong>and</strong> third, to<br />
discuss the advantages of using high-temperature shorttime<br />
(HTST) treatments for cashew apple to reduce the<br />
heat impact on product quality during different food<br />
processes.<br />
doi:10.1111/j.1365-2621.2010.02327.x<br />
Ó 2010 The Authors. Journal compilation Ó 2010 Institute of Food Science <strong>and</strong> Technology
Material <strong>and</strong> methods<br />
Cashew apple<br />
The cashew apples were produced from the commercial<br />
early dwarf clones CCP 76, grown at the Pacajus<br />
Experimental Station of Embrapa Tropical Agroindustry,<br />
in Pacajus, Ceara´, Brazil. The cashew apples were<br />
harvested at the commercial maturity stage, frozen <strong>and</strong><br />
sent to France. Then, the cashew apples were ground in<br />
a mixer (Thermomix; Vorwerk & Co. KG, Wuppertal,<br />
Germany) until a homogeneous pulp was obtained, next<br />
they were packed in plastic vessels of 200 g capacity <strong>and</strong><br />
stored at )20 °C. For the thermal tests, the vessels were<br />
let to reach ambient temperature (20 °C), <strong>and</strong> the<br />
ground cashew apple was degasified by bubbling<br />
argon for 15 min; the dissolved oxygen concentration<br />
was
1726<br />
Cashew apples treated at high temperatures J. R. Lima et al.<br />
Selection of the models<br />
The AA content <strong>and</strong> lightness index, expressed as X (t) ,<br />
decreased during heat treatment <strong>and</strong> were described in<br />
terms of irreversible first-order kinetics:<br />
dX ðtÞ<br />
dt ¼ kX X ðtÞ<br />
ð1Þ<br />
The rate constant, kX (s )1 ), varied with the system’s<br />
absolute temperature, T (K), according to the Arrhenius<br />
law, as follows:<br />
kX ¼ kX ref exp EaX<br />
R<br />
1<br />
T ðtÞ<br />
1<br />
Tref<br />
ð2Þ<br />
Where kXref, EaX <strong>and</strong> R were, respectively, the rate<br />
constant (s )1 ) at the reference temperature (T ref), the<br />
apparent activation energy (J mol )1 ) for the rate constant<br />
<strong>and</strong> the gas constant (8.314 J mol )1 K )1 ). The<br />
reference temperature was chosen from the middle of the<br />
temperature range (Tref = 140 °C).<br />
During heat treatment, nonisothermal stages (heating,<br />
maintaining, <strong>and</strong> cooling) were recorded. Each timetemperature<br />
profile (T (t) , Fig. 1) was fitted with a cubic<br />
smoothing spline (MATLAB Ò , version 6.5; The Math-<br />
Works Inc., Natick, MA, USA).<br />
Figure 1 Time-temperature profiles for model development <strong>and</strong><br />
validation trials.<br />
Parameter estimation <strong>and</strong> statistical methods<br />
The nonisothermal degradation of compound X (t) during<br />
heat treatment was taken into account in eqn (1)<br />
with (2). Hence, X (t) value, predicted at time t, noted<br />
^X ðtÞ , was calculated by time integration of eqn (1) with<br />
(2), as follows:<br />
^X ðtÞ =X 0 ¼ expð kX ref bXÞ ð3Þ<br />
Where ^X ðtÞ ¼ ^C ðtÞ , or ^X ðtÞ ¼ ^L ðtÞ , for AA content<br />
kinetic or lightness index kinetic, respectively. bX is the<br />
time–temperature history for X (t) :<br />
b X ¼<br />
Z t<br />
0<br />
exp EaX<br />
R<br />
1<br />
T ðtÞ<br />
1<br />
Tref<br />
dt ð4Þ<br />
The integral of eqn (4) was calculated as the direct<br />
analytical integral of the cubic smoothing spline function<br />
of exp EaXð1=T ðtiÞ 1=TrefÞ=R with a regularisation<br />
parameter of 0.99 (MATLAB Ò , version 6.5). There<br />
were two parameters (kXref <strong>and</strong> EaX) to be estimated<br />
from the collected data.<br />
As the model was nonlinear for parameters, the<br />
parameters could not be solved directly, but must have<br />
been solved by nonlinear regression. The parameters were<br />
iteratively adjusted to the goodness-of-fit merit function,<br />
using the minimisation procedure of the Nelder–Mead<br />
simplex method (Lagarias et al., 1998) using the MAT-<br />
LAB Ò software (MATLAB Ò , version 6.5). This merit<br />
function was the mean square error (MSE) between<br />
experimental (X (t) ) <strong>and</strong> predicted (^X ðtÞ ) data:<br />
MSE ¼<br />
1 X<br />
ðn pÞ<br />
n<br />
i¼1<br />
^X ðtiÞ X ðtiÞ 2<br />
ð5Þ<br />
where, n is the number of data, <strong>and</strong> p is the number of<br />
parameters (here p = 2).<br />
The minimum of the merit function was searched with<br />
different initial values to prevent the parameters from<br />
obtaining a local minimum (van Boekel, 1996). As the<br />
model was nonlinear for parameters, no explicit analytical<br />
solutions could be obtained for the confidence<br />
intervals, resulting only in approximate values (van<br />
Boekel, 1996). Consequently, the confidence interval for<br />
each parameter was determined via Monte Carlo simulations<br />
(Hessler, 1997). There were four steps involved<br />
in our method.<br />
Step 1: The generation of a large number of simulated<br />
data sets from the experimental values. Simulated data<br />
(~X ðtÞ ) was generated by superposition of a pseudo<br />
r<strong>and</strong>om noise on the experimental data (X (t) ). The noise<br />
reflected the experimental uncertainty (u X ðtÞ).<br />
~X ðtÞ ¼ X ðtÞ þ u X ðtÞd ð6Þ<br />
International Journal of Food Science <strong>and</strong> Technology 2010 Ó 2010 The Authors. Journal compilation Ó 2010 Institute of Food Science <strong>and</strong> Technology
where, ~X ðtÞ is the simulated data; u X ðtÞ is the uncertainty<br />
of X (t) , determined experimentally (equivalent to the<br />
st<strong>and</strong>ard deviation for a Gaussian distribution); <strong>and</strong> d is<br />
a r<strong>and</strong>om number whose elements are normally distributed,<br />
with a mean of 0 <strong>and</strong> a variance of 1. All<br />
uncertainties were amplified as follows:<br />
UXðtÞ ¼ uuXðtÞ ð7Þ<br />
where u is the coverage factor (u = 1.96 for 95%<br />
confidence interval) (ISO, 1999).<br />
Step 2: The estimation of kinetic parameters (kXi ref<br />
<strong>and</strong> Ea Xi) from each simulated data set. For a given<br />
operating condition, m sets of AA content (C (t) ) <strong>and</strong><br />
lightness index (L (t) ) data were r<strong>and</strong>omly drawn, using<br />
eqn (6) (m = 2,000). Then, each simulated data set was<br />
fitted to determine the best-fit values of the kinetic<br />
parameters (kXref <strong>and</strong> EaX), <strong>and</strong> the m values of<br />
parameters were identified from m separate data sets.<br />
The kXref <strong>and</strong> EaX were checked for normal distribution,<br />
using the Kolmogorov–Smirnov test.<br />
Step 3: The representation of histograms from the<br />
tabulated kinetic parameters, to obtain discrete<br />
approximations of the model parameters confidence<br />
probability distributions. The results were, therefore,<br />
expressed as mean values of parameters (kXref <strong>and</strong><br />
EaX) associated with their st<strong>and</strong>ard deviation. All<br />
these uncertainties were amplified by the factor<br />
k = 1.96, corresponding to a 95% confidence interval<br />
for the parameters. Relative amplified uncertainty,<br />
expressed as percentage, was calculated with reference<br />
to the mean value obtained after averaging the m<br />
values.<br />
Step 4: Model validation. The C (t) <strong>and</strong> L (t) models<br />
were validated by assessing the prediction accuracy for a<br />
set of validation trials. The validation trials were<br />
conducted under conditions that differed from those<br />
applied to the kinetic parameter determination assays.<br />
The temperatures tested were 110, 130, 150 <strong>and</strong> 170 °C<br />
(Fig. 1).<br />
The equivalent isothermal time<br />
For nonlinear inactivation, the traditional ‘F0 value’ in<br />
heat processes can be replaced by the ‘equivalent<br />
isothermal time’ at a chosen reference temperature.<br />
When the isothermal curves follow the first-order kinetic<br />
model, the ‘equivalent isothermal time’ (tequiv) is calculated<br />
using (Peleg et al., 2008):<br />
tequiv ¼ 1<br />
loge kX ref<br />
^X ðtÞ<br />
X 0<br />
!<br />
ð8Þ<br />
Where kXref is the rate constant at the chosen<br />
reference temperature <strong>and</strong> ( ^X ðtÞ =X 0 ) is the solution of<br />
Eqns (3) <strong>and</strong> (4) for time t.<br />
Cashew apples treated at high temperatures J. R. Lima et al. 1727<br />
Table 1 Initial characteristics of cashew apple used for kinetic experiments<br />
(mean values ±95% confidence interval with n =3)<br />
Results <strong>and</strong> discussion<br />
Characteristics of cashew apples<br />
The initial characteristics of cashew apples are presented<br />
in Table 1. The values of AA obtained in this work were<br />
slightly smaller than those obtained by Maia et al.<br />
(2004), who reported 158 mg (100 g) )1<br />
Ground cashew apple<br />
Water content [g (100 g) )1 ] 84.5 ± 0.1<br />
Total soluble solids (°Brix) 13.5 ± 0.2<br />
Total titratable acidity<br />
(mg citric acid per 100 g)<br />
0.78 ± 0.01<br />
pH 4.9 ± 0.01<br />
Water activity 0.986 ± 0.001<br />
Ascorbic acid (mg (100 g) )1 ) 141.9 ± 1.8<br />
Colour L* (lightness index) 69.1 ± 0.1<br />
Colour a* (redness index) 1.5 ± 0.1<br />
Colour b* (yellowness index) 35.8 ± 0.1<br />
for cashew<br />
apples from CCP 76. It is important to consider that<br />
the samples in this study were frozen to ensure transportation<br />
<strong>and</strong> storage before analysis, which may<br />
diminish overall AA content. Nevertheless, the AA<br />
content was still high, averaging three or four times the<br />
values for lemon [74 mg (100 g) )1 ], grape fruit<br />
[23 mg (100 g) )1 ], kiwi [65 mg (100 g) )1 ] <strong>and</strong> orange<br />
[83 mg (100 g) )1 ] (Lee & Kader, 2000), which are fruits<br />
well known for providing good vitamin C supplies.<br />
Kinetic parameter estimation<br />
The AA content <strong>and</strong> lightness index (L*) were measured<br />
experimentally in cashew apples for different timetemperature<br />
treatments (Fig. 1). The results for a* <strong>and</strong><br />
b* were not considered in this study, as neither one<br />
presented a defined pattern.<br />
The nonisothermal method used to estimate kinetic<br />
parameters for AA <strong>and</strong> lightness showed that the reaction<br />
kinetics during 100–180 °C heat treatments were well<br />
represented by first-order reactions as low coefficients of<br />
variation were obtained between experimental <strong>and</strong> predicted<br />
values. The results are shown in Table 2. The<br />
Table 2 Estimated kinetic parameters (Ea <strong>and</strong> kref) for ascorbic acid<br />
degradation <strong>and</strong> lightness index change in cashew apple (mean<br />
values ± 95% confidence interval). Reference temperature of 140 °C<br />
Reaction Ea (kJ mol )1 ) kref (·10 )5 s )1 ) RMSE R 2<br />
CV (%)<br />
Ascorbic acid 94 ± 3 64 ± 3 0.08 0.94 8.6<br />
Lightness (L*) 98 ± 3 33 ± 2 0.06 0.92 4.2<br />
RMSE, root mean square error between experimental <strong>and</strong> predicted<br />
data; CV, coefficient of variation.<br />
Ó 2010 The Authors. Journal compilation Ó 2010 Institute of Food Science <strong>and</strong> Technology International Journal of Food Science <strong>and</strong> Technology 2010
1728<br />
Cashew apples treated at high temperatures J. R. Lima et al.<br />
confidence intervals of these kinetic parameters were<br />
determined via Monte Carlo simulations, using 2000 data<br />
sets that generate the same number of best-fit values for<br />
the kinetic parameters (kref <strong>and</strong> Ea). Figure 2 depicts a<br />
normal distribution, with an average value <strong>and</strong> st<strong>and</strong>ard<br />
deviation.<br />
Ascorbic acid content<br />
Figure 3 illustrates the good fit obtained between the<br />
experimental data <strong>and</strong> predicted curves, using the<br />
optimised kinetic parameters shown in Table 2. The<br />
temperature impact on AA degradation was not as high<br />
as expected. Ascorbic acid content after heat treatment<br />
at 100 °C <strong>and</strong> 7200 s (120 min) was only 30% lower<br />
than the initial value. At 180 °C, after 365 s (6 min) of<br />
treatment, 23% of the initial AA still remained in the<br />
product. Low oxygen concentration ( nominal<br />
initial AA concentration > temperature. Oey et al.<br />
(2006) studied the pressure <strong>and</strong> temperature stability of<br />
AA in model systems, under different AA <strong>and</strong> oxygen<br />
concentrations. The study showed that the AA degradation<br />
was primarily caused by oxidation, as long as<br />
oxygen was present. When oxygen was consumed,<br />
anaerobic AA degradation occurred <strong>and</strong> this anaerobic<br />
reaction was slower than the aerobic reaction. Lima<br />
et al. (2007) reported that during the thermal processing<br />
Figure 2 Frequency distribution for the values of activation energy<br />
(Ea). Solid lines are normal distributions.<br />
of clarified cashew apple juice, at 100 °C for 50 min,<br />
only 55% of AA was lost, confirming that AA in<br />
cashews did not deplete easily.<br />
The relatively high AA stability may also be explained<br />
by a protecting effect of the cashew apple matrix. The<br />
degradation kinetics of food constituents may be related<br />
to the molecular mobility <strong>and</strong> the glass transition<br />
temperature has been used as the main indicator of this<br />
mobility. The glass transition involves transition from a<br />
solid ‘glassy’ to a liquid-like ‘rubbery’ state <strong>and</strong> is<br />
related to the presence of polysaccharides (Frias &<br />
Oliveira, 2001). Hung et al. (2007) studying the decomposition<br />
of l-ascorbic acid freeze-dried with saccharides<br />
showed that l-ascorbic acid in powder prepared with<br />
soluble soybean polysaccharide or gum arabic decomposed<br />
much faster than in powder prepared with<br />
maltodextrin alone or associated to a-cyclodextrin,<br />
trehalose <strong>and</strong> lactose.<br />
The result obtained in this study for activation energy<br />
(Ea) was higher than that reported in literature for some<br />
fruits (36–71 kJ mol )1 ) (Manso et al., 2001; Dhuique-<br />
Mayer et al., 2007; Garrote et al., 2009), indicating<br />
stronger temperature dependence. However, the reaction<br />
constant at 100 °C (k100 °C = 3.4 · 10 )5 s )1 ) was<br />
lower than values reported for the same authors<br />
(0.12 · 10 )5 to 6.3 · 10 )5 s )1 ), possibly because of the<br />
Figure 3 Degradation kinetics of ascorbic acid in cashew apple during<br />
thermal treatment. Experimental (o) <strong>and</strong> estimated (curves) data.<br />
International Journal of Food Science <strong>and</strong> Technology 2010 Ó 2010 The Authors. Journal compilation Ó 2010 Institute of Food Science <strong>and</strong> Technology
test’s low O2 content condition. It is not possible to<br />
compare the behaviour of the AA degradation at higher<br />
temperatures, as no data have been reported under these<br />
conditions in the literature.<br />
Lightness (L*)<br />
Figure 4 illustrates the good fit obtained between the<br />
experimental data <strong>and</strong> predicted curves, using the<br />
optimised kinetic parameters shown in Table 2. As<br />
observed for AA, the temperature impact on lightness<br />
was not as high as expected. The value of L* after<br />
thermal treatment at 100 °C <strong>and</strong> 7200 s (120 min) was<br />
only 15% lower than the initial value, <strong>and</strong> at 180 °C,<br />
after 365 s (6 min), this value was 56% lower. As L* isa<br />
colour measure on the light-dark axis, this decreasing<br />
value indicates that the samples were turning darker.<br />
The variation in lightness of the heat-treated samples<br />
can be taken as a browning measure.<br />
Chutintrasri & Noomhorm (2007) reported that for<br />
pineapple puree, lightness, based on activation energy,<br />
was the most sensitive measure of colour changes at<br />
temperatures ranging from 95 to 110 °C <strong>and</strong> recommended<br />
that parameter as an on-line quality control<br />
parameter to monitor the processing effects on colour<br />
change during thermal processing. Damasceno et al.<br />
Figure 4 Degradation kinetics of lightness in cashew apple during<br />
thermal treatment. Experimental (o) <strong>and</strong> estimated (curves) data.<br />
Cashew apples treated at high temperatures J. R. Lima et al. 1729<br />
(2008), working with thermal treatment (88–121 °C) on<br />
clarified cashew apple juice, reported that at temperatures<br />
above 100 °C the colour shifted from light yellow to<br />
a dark brown hue, which became more pronounced with<br />
increasing treatment temperature. These authors concluded<br />
that browning in clarified cashew apple juice was<br />
caused by degradation of AA, as there was an inverse<br />
correlation between browning <strong>and</strong> AA concentration.<br />
The activation energy (Ea) <strong>and</strong> reaction constant at<br />
100 °C (k100 °C = 1.5 · 10 )5 s )1 ) obtained were in the<br />
same range than those reported in the literature for<br />
some fruits (Ibarz et al., 1999, 2000; Chutintrasri &<br />
Noomhorm, 2007).<br />
Model validation<br />
To assess the accuracy of the predictive models, six trials<br />
were conducted under different conditions from those<br />
previously applied for developing the models. Different<br />
time-temperature profiles (Fig. 1) were used for the<br />
validation. Figures 5 <strong>and</strong> 6 show the observed <strong>and</strong> fitted<br />
values for AA <strong>and</strong> lightness index obtained from the<br />
assays used to develop the models <strong>and</strong> validation<br />
experiments. Almost all the validation experiments<br />
varied by
1730<br />
Cashew apples treated at high temperatures J. R. Lima et al.<br />
Figure 6 Fitted vs. experimental values of lightness (L ⁄ L 0 ) after heat<br />
treatment. Experimental points for model generation (s) <strong>and</strong> for<br />
validation (h). Dashed lines: 10% variation. Dotted lines: 15%<br />
variation.<br />
Figure 7 Simulated ascorbic acid degradation curves for different<br />
applications: deep-fat frying, conventional <strong>and</strong> high-temperature<br />
short-time (HTST) sterilisation.<br />
ascorbic acid-rich foodstuffs, assuming similar kinetic<br />
parameters (kref <strong>and</strong> Ea) as those obtained in the<br />
present study.<br />
For example, during deep-fat frying, the temperature<br />
range is highly heterogeneous: a dried peripheral region<br />
is submitted to high temperatures (close to oil temperature),<br />
whereas the water-rich core is maintained at<br />
temperatures close to 100 °C. As a result, the degradation<br />
rate is higher in the food’s peripheral regions than<br />
at the centre. Nevertheless, for frying more than 60% of<br />
the initial AA content still remained on the surface of<br />
the product, <strong>and</strong> more than 95% in the core. Other<br />
examples are HTST sterilisation treatments, which cause<br />
almost no AA destruction, <strong>and</strong> conventional sterilisation,<br />
with 90% of the initial ascorbic content at the end<br />
of the process.<br />
Conclusions<br />
The method described in this study will be useful in<br />
determining the change in colour <strong>and</strong> AA content of<br />
cashew apples during nonisothermal process, which can<br />
be a valuable tool to the various industries engaged in<br />
fruit processing. Preservation of cashew apples by heat<br />
treatments, such as frying for producing fruit chips or<br />
HTST for producing concentrated or clarified juice, is a<br />
good alternative for enhancing the general public’s food<br />
quality intake.<br />
Acknowledgments<br />
We are grateful to the EU funding under the PAVUC<br />
Project (contract N° FP6-0015279) <strong>and</strong> to Coordenaça˜ o<br />
de Aperfeic¸oamento de Pessoal de Nı´vel Superior<br />
(CAPES), for their financial support.<br />
References<br />
AOAC (1997). Official Methods of Analysis, 16th edn, 3rd revision.<br />
Gaithersburg, MD: Association of Official Analytical Chemists.<br />
Azoubel, P.M. & Murr, F.E.X. (2003). Optimisation of osmotic<br />
dehydration of cashew apple (Anacardium Occidentale L.) in<br />
sugar solutions. Food Science <strong>and</strong> Technology International, 9,<br />
427–433.<br />
Azoubel, P.M., El-Aouar, A.A., Tonon, R.V. et al. (2009). Effect of<br />
osmotic dehydration on the drying kinetics <strong>and</strong> quality of cashew<br />
apple. International Journal of Food Science <strong>and</strong> Technology, 44,<br />
980–986.<br />
van Boekel, M.A.J.S. (1996). Statistical aspects of kinetic modelling<br />
for food science problems. Journal of Food Science, 61, 477–<br />
485.<br />
Chutintrasri, B. & Noomhorm, A. (2007). Colour degradation kinetics<br />
of pineapple puree during thermal processing. LWT-Food Science<br />
<strong>and</strong> Technology, 40, 300–306.<br />
Damasceno, L.R., Fern<strong>and</strong>es, A.N., Magalhães, M.M.A. & Brito, E.S.<br />
(2008). Non-enzymatic browning in clarified cashew apple juice<br />
during thermal treatment: kinetics <strong>and</strong> process control. Food<br />
Chemistry, 106, 172–179.<br />
Dhuique-Mayer, C., Tbatou, M., Carail, M., Caris-Veyrat, C.,<br />
Dornier, M. & Amiot, M.J. (2007). Thermal degradation of<br />
antioxidant micronutrients in citrus juice: kinetics <strong>and</strong> newly formed<br />
compounds. Journal of Agricultural <strong>and</strong> Food Chemistry, 55, 4209–<br />
4216.<br />
International Journal of Food Science <strong>and</strong> Technology 2010 Ó 2010 The Authors. Journal compilation Ó 2010 Institute of Food Science <strong>and</strong> Technology
Frias, J.M. & Oliveira, J.C. (2001). Kinetic models of ascorbic acid<br />
thermal degradation during hot air drying of maltodextrin solutions.<br />
Journal of Food Engineering, 47, 255–262.<br />
Garrote, R.L., Silva, E.R. & Roa, R.D. (2009). Diffusion <strong>and</strong> thermal<br />
degradation of ascorbic acid during canned fresh green peas<br />
sterilisation. International Journal of Food Science <strong>and</strong> Technology,<br />
44, 1990–1996.<br />
Hessler, J.P. (1997). The use of Monte Carlo simulations to evaluate<br />
kinetic data <strong>and</strong> analytic approximations. International Journal of<br />
Chemical Kinetics, 29, 803–817.<br />
Hung, L., Horagai, Y., Kimura, Y. & Adachi, S. (2007). Decomposition<br />
<strong>and</strong> discoloration of l-ascorbic acid freeze-dried with saccharides.<br />
Innovative Food Science & Emerging Technologies, 8, 500–506.<br />
Ibarz, A., Pagán, J. & Garza, S. (1999). Kinetic models for colour<br />
changes in pear puree during heating at relatively high temperatures.<br />
Journal of Food Engineering, 39, 415–422.<br />
Ibarz, A., Pagán, J. & Garza, S. (2000). Kinetic models of nonenzymatic<br />
browning in apple puree. Journal of the Science of Food<br />
<strong>and</strong> Agriculture, 80, 1162–1168.<br />
ISO, NF ENC 13005 (1999). Détermination de l’incertitude e´largie. In:<br />
Guide pour l’expression de l’incertitude de mesure. Pp. 39–134. Paris:<br />
AFNOR.<br />
Jiménez, N., Bohuon, P., Lima, J., Dornier, M., Vaillant, F. & Pérez,<br />
A.M. (2010). Kinetics of anthocyanin degradation <strong>and</strong> browning in<br />
reconstituted blackberry juice treated at high temperatures (100–<br />
180 °C). Journal of Agricultural <strong>and</strong> Food Chemistry, 58, 2314–2322.<br />
Lagarias, J.C., Reeds, J., Wright, A.M.H. & Wright, P.E. (1998).<br />
Convergence properties of the Nelder–Mead simplex method in low<br />
dimensions. SIAM Journal on Optimization, 9, 112–147.<br />
Cashew apples treated at high temperatures J. R. Lima et al. 1731<br />
Lee, S.K. & Kader, A.A. (2000). Preharvest <strong>and</strong> postharvest factors<br />
influencing vitamin C content of horticultural crops. Postharvest<br />
Biology <strong>and</strong> Technology, 20, 207–220.<br />
Lima, E.S., Silva, E.G., Moita Neto, J.M. & Moita, G.C. (2007).<br />
Redução de vitamina C em suco de caju industrializado e cajuína.<br />
Quı´mica Nova, 30, 1143–1146.<br />
Maia, G.A., Sousa-Filho, M.S.M., Figueiredo, R.W. & Brasil, I.M.<br />
(2004). Caracterização química de pedu´nculos de diferentes clones<br />
de cajueiro anão precoce (Anacardium Occidentale L.). Revista<br />
Cieˆncia Agronoˆmica, 35, 272–278.<br />
Manso, M.C., Oliveira, F.A.R., Oliveira, J.C. & Frias, J.M. (2001).<br />
Modelling ascorbic acid thermal degradation <strong>and</strong> browning in<br />
orange juice under aerobic conditions. International Journal of Food<br />
Science <strong>and</strong> Technology, 36, 303–312.<br />
Oey, I., Verlinde, P., Hendrickx, M. & Van Loey, A. (2006).<br />
Temperature <strong>and</strong> pressure stability of l-ascorbic acid <strong>and</strong> ⁄ or [6s]<br />
5-methyltetrahydrofolic acid: a kinetic study. European Food<br />
Research Technology, 223, 71–77.<br />
Oliveira, M.A., Maia, G.A., Figueiredo, R.W., Souza, A.C.R., Brito,<br />
E.S. & Azeredo, H.M.C. (2009). Addition of cashew tree gum to<br />
maltodextrin-based carriers for spray drying of cashew apple juice.<br />
International Journal of Food Science <strong>and</strong> Technology, 44, 641–645.<br />
Pátkai, G., Kormendy, I. & Kormendy-Domján, A. (2002). Vitamin C<br />
decomposition kinetics in solutions, modelling citrus juices. Acta<br />
Alimentaria, 31, 125–147.<br />
Peleg, M., Norm<strong>and</strong>, M.D. & Corradini, M.G. (2008). Interactive<br />
software for estimating the efficacy of non-isothermal heat preservation<br />
processes. International Journal of Food Microbiology, 126,<br />
250–257.<br />
Ó 2010 The Authors. Journal compilation Ó 2010 Institute of Food Science <strong>and</strong> Technology International Journal of Food Science <strong>and</strong> Technology 2010
1732<br />
Original article<br />
Optimisation of processing variables affecting the osmotic<br />
dehydration of pomegranate arils<br />
Manoj Mundada, 1 Bahadur Singh 1 * & Swati Maske 2<br />
1 Department of Food Engineering <strong>and</strong> Technology, Sant Longowal Institute of Engineering <strong>and</strong> Technology, Longowal 148 106 (Sangrur), India<br />
2 College of Food Technology, Marathwada Agricultural University, Parbhani 431 402, India<br />
(Received 22 March 2010; Accepted in revised form 26 May 2010)<br />
Summary For the optimisation of osmotic dehydration by response surface methodology, the experiments were<br />
conducted according to Central Composite Rotatable Design (CCRD) with three variables at five levels. The<br />
low <strong>and</strong> high levels of the variables were 40 <strong>and</strong> 50 °C for osmotic solution temperature, 45 <strong>and</strong> 55°Bx for<br />
sucrose solution concentration, 60 <strong>and</strong> 100 min for duration of dipping in osmotic solution, respectively. The<br />
fruit to solution ratio was kept 1:4 (w ⁄ w) during all the experiments. Before dipping the arils in sucrose<br />
solution, the freezing of the whole pomegranate at )18 °C was carried out to increase the permeability of the<br />
outer cellular layer of the arils. The arils were further convectively dehydrated at 60 °C air temperature up to<br />
final moisture content of 10% (wb) to make it a shelf stable product. The optimum conditions for osmotic<br />
solution concentration, temperature <strong>and</strong> process duration were 55°Bx, 40 °C <strong>and</strong> 100 min, respectively.<br />
Keywords Anthocyanins, optimisation, osmotic dehydration, pomegranate, response surface methodology, sucrose.<br />
Introduction<br />
The pomegranate (Punica granatum L.) has been<br />
recently acclaimed for its health benefits, in particular<br />
for its disease-fighting antioxidant potential viz. ellagic<br />
acid, gallic acid, <strong>and</strong> punicalagin which promote health<br />
by destroying cell damaging free radicals. These free<br />
radicals can lead to oxidative stress <strong>and</strong> the accelerated<br />
aging of cells, thus leading to premature cell death<br />
(Rosenblat & Aviram, 2006; Negi et al., 2003). Pomegranate<br />
arils also contain other potent antioxidants like<br />
anthocyanins <strong>and</strong> tannins. The edible part (aril) is the<br />
pulp surrounding the seeds. The arils (juice sac) are filled<br />
with juicy red, pink, or whitish (depending on variety)<br />
pulp. The arils contains considerable amount of acids,<br />
sugars, vitamins, polysaccharides, polyphenols, <strong>and</strong><br />
important minerals (Vardin & Fenerciog˘ lu, 2003).<br />
In India, this valuable fruit is available only during<br />
the months – September to January. The fruit is<br />
consumed directly as fresh arils as well as juice. The<br />
arils are used as a garnish for desserts <strong>and</strong> salads (Al-<br />
Maiman & Ahmad, 2002) <strong>and</strong> can also be utilised as an<br />
anardana. An anardana is a product prepared by drying<br />
arils (Kingsly et al., 2006). Among different methods of<br />
drying, the convective dehydration is the most popular<br />
*Correspondent: Fax: 01672 280057;<br />
e-mail:bshathan@yahoo.com<br />
International Journal of Food Science <strong>and</strong> Technology 2010, 45, 1732–1738<br />
<strong>and</strong> efficient way to reduce the moisture content <strong>and</strong><br />
preserve foods (Madamba & Lopez, 2002). The product<br />
quality depending notably on its texture, colour <strong>and</strong><br />
flavour is deteriorated by convective dehydration<br />
(Lenart, 1996). A well-known process to achieve goodquality<br />
product is freeze drying, but it is an expensive<br />
method of food preservation. Therefore, there is a need<br />
for a techno-economic alternate process, which has low<br />
capital investment <strong>and</strong> offers a way to save highly<br />
perishable products <strong>and</strong> make them available for the<br />
regions away from production zones. Osmotic dehydration<br />
is one of these methods (Shi & Le Maguer, 2002).<br />
The osmotic dehydration is the process to remove<br />
some extent of water from cellular material such as<br />
fruits <strong>and</strong> vegetables prior to drying (Lenart, 1996) This<br />
gives rise to two major simultaneous counter-current<br />
mass transfer fluxes, namely water flow from the<br />
product to the surrounding solution <strong>and</strong> solute infusion<br />
into the product (Lewicki & Porzecka-Pawlak, 2005).<br />
There is a third flow of natural solutes such as sugars,<br />
organic acids, minerals, <strong>and</strong> salts leaching from the food<br />
into the solution (Waliszewski et al., 2002), which is<br />
quantitatively negligible, but may be important for the<br />
organoleptic <strong>and</strong> nutritional value of the product<br />
(Sablani et al., 2002). This pretreatment can also minimise<br />
drying colour losses (Nsonzi & Ramaswamy,<br />
1998), as well as reduce nutrient losses (Shi et al., 1999).<br />
The cellular membrane of arils exerts high resistance to<br />
doi:10.1111/j.1365-2621.2010.02328.x<br />
Ó 2010 The Authors. Journal compilation Ó 2010 Institute of Food Science <strong>and</strong> Technology
mass transfer <strong>and</strong> slows down the rate of osmotic<br />
dehydration (Erle & Schubert, 2001). Thus, it is imperative<br />
to utilise simple <strong>and</strong> inexpensive method to<br />
increase the rate <strong>and</strong> efficiency of the process (Falade<br />
& Adelakun, 2006). Freezing has been reported to<br />
enhance mass transfers during osmotic dehydration of<br />
Pumpkin, apple, <strong>and</strong> African Star Apple (Saurel et al.,<br />
1994). Moreover, freezing of whole pomegranate fruit<br />
could be utilised to establish the long-term preservation<br />
of pomegranate arils prior to osmotic dehydration.<br />
The aim of this work was to optimise osmotic<br />
dehydration process of pomegranate arils as a function<br />
of sucrose concentration, osmotic temperature, <strong>and</strong><br />
time, using response surface methodology with the<br />
purpose to achieve maximum possible water loss, solute<br />
gain, <strong>and</strong> retention of anthocyanins.<br />
Materials <strong>and</strong> methods<br />
Experimental design<br />
For the optimisation of osmotic dehydration process,<br />
the experiments were conducted according to Central<br />
Composite Rotatable Design (CCRD) (Khuri & Cornell,<br />
1987) with three variables at five levels each. The<br />
independent variables were process temperature, solute<br />
concentration, <strong>and</strong> duration of osmotic dehydration<br />
process. The low <strong>and</strong> high levels of the independent<br />
variables were 40 <strong>and</strong> 50 °C for temperature, 45 <strong>and</strong><br />
55°Bx for sucrose solution concentration, 60 <strong>and</strong><br />
100 min for duration of osmotic pretreatment, respectively<br />
(Ade-Omowaye et al., 2002). The fruit to solution<br />
ratio was kept 1:4 (w ⁄ w) during all the experiments to<br />
minimise problems related to the management of the<br />
osmotic solutions like reconcentration, microbial contamination,<br />
reutilisation, <strong>and</strong> discharge of the spent<br />
solution (Torreggiani & Bertolo, 2002).<br />
The relationship between levels of different coded <strong>and</strong><br />
uncoded form of independent variables is given in<br />
Table 1. The experiments plan in coded <strong>and</strong> uncoded<br />
form of process variables along with results is as given in<br />
Table 2. The experiments were conducted r<strong>and</strong>omly to<br />
minimise the effects of unexplained variability in the<br />
observed responses because of external factors.<br />
Table 1 The level of different process variables in coded <strong>and</strong><br />
uncoded form for osmotic dehydration<br />
Independent<br />
variables Units<br />
Symbols Levels<br />
Actual Coded )1.68 )1 0 1 1.68<br />
Concentration °Bx X 1 x 1 41.59 45 50 55 58.41<br />
Temperature °C X2 x2 36.59 40 45 50 53.41<br />
Time min X 3 x 3 46.36 60 80 100 113.64<br />
Optimisation of osmotic dehydration by response surface methodology M. Mundada et al. 1733<br />
Preparation of sample<br />
For each experiment, fresh well-graded, whole pomegranates<br />
var. K<strong>and</strong>hari were procured from local market<br />
of Sangrur, Punjab (India) <strong>and</strong> were washed <strong>and</strong> frozen<br />
at )18 °C for minimum time of 24 h. Before osmotic<br />
dehydration, frozen pomegranates were thawed at room<br />
temperature. Thawed pomegranates were immediately<br />
broken to separate arils. The freezing treatment before<br />
osmotic dehydration was given to arils to enhance mass<br />
transfer rate by increasing permeability of outer cellular<br />
layer (Falade & Igbeka, 2007).<br />
Osmotic dehydration<br />
For each experiment, the pomegranate arils of known<br />
weight were put in stainless steel containers having<br />
osmotic solution. The temperature of the osmotic<br />
solution was maintained by hot water bath agitating<br />
at the rate of 50 oscillations per min. Agitation was<br />
given during osmosis for reducing the mass transfer<br />
resistance at the surface of the fruit <strong>and</strong> for good<br />
mixing <strong>and</strong> close temperature control in osmotic<br />
medium (Chopra, 2001). The arils were removed from<br />
the container at the specified time <strong>and</strong> rinsed with<br />
fresh water to remove the excess solute adhered to the<br />
surface. The osmotically dehydrated arils were then<br />
spread on an absorbent paper to remove the free<br />
water present on the outer surface. Then out of the<br />
total osmotically dehydrated arils, about 15–20 g<br />
sample was put in the preweighed Petri dish for<br />
determination of dry matter by oven method. The<br />
remaining part of the sample was dried to final<br />
moisture content of 10% (wb) in hot air dryer at<br />
60 °C air temperature. The dried samples were packed<br />
in high density polyethylene (HDPE) (80 micron) bags<br />
<strong>and</strong> kept at ambient temperature for further analysis<br />
of anthocyanins content.<br />
Statistical analysis <strong>and</strong> optimisation<br />
The second-order polynomial equation was fitted to the<br />
experimental data of each dependent variable as given<br />
below<br />
Yk ¼ bk0 þ Xn<br />
bkixi þ<br />
i¼1<br />
Xn<br />
bkiix i¼1<br />
2 Xn 1 X<br />
i þ<br />
i¼1<br />
n<br />
bkijxixj ð1Þ<br />
j¼iþ1<br />
where Yk = response variable; Y1 = water loss (g) per<br />
100 g fresh arils); Y2 = solute gain (g) per 100 g fresh<br />
arils; Y3 = total anthocyanin content (mg) per 100 g<br />
of dehydrated arils; xi represent the coded independent<br />
variables (x1 = solution concentration, x2 = process<br />
duration, x3 = process temperature); where bko was<br />
the value of the fitted response at the centre point of<br />
the design, i.e. point (0,0,0), bki, bkii, <strong>and</strong> bkij were the<br />
Ó 2010 The Authors. Journal compilation Ó 2010 Institute of Food Science <strong>and</strong> Technology International Journal of Food Science <strong>and</strong> Technology 2010
1734<br />
Optimisation of osmotic dehydration by response surface methodology M. Mundada et al.<br />
Table 2 Central Composite Rotatable Design with experimental values of response variables<br />
Conc<br />
(°Bx)<br />
Time<br />
(min)<br />
Temp<br />
(°C)<br />
Conc<br />
(°Bx)<br />
Time<br />
(min)<br />
Temp<br />
(°C)<br />
linear, quadratic, <strong>and</strong> cross-product regression coefficients,<br />
respectively.<br />
The analysis of the experimental data was carried out<br />
to observe the significant effect of various process<br />
variables on the various responses. The b coefficient is<br />
that the magnitudes of these values help to compare the<br />
relative contribution of each independent variable in the<br />
prediction of the dependent variable. Higher the positive<br />
value of b of a parameter, higher would be the effect of<br />
that parameter <strong>and</strong> vice versa.<br />
The response surface <strong>and</strong> contour plots were generated<br />
for different interaction of any two independent<br />
variables, while holding the value of third variable as<br />
constant (at the central value). Such three-dimensional<br />
surfaces could give accurate geometrical representation<br />
<strong>and</strong> provide useful information about the behaviour of<br />
the system within the experimental design. The optimisation<br />
of the osmotic dehydration process was aimed at<br />
finding the levels of independent variables viz. osmotic<br />
solution concentration, temperature, <strong>and</strong> process duration,<br />
which would give maximum possible water loss,<br />
solute gain, <strong>and</strong> total anthocyanins. When the dehydrated<br />
product has to be rehydrated before final use like<br />
dehydrated vegetables, the optimisation of osmotic<br />
dehydration process is always aimed at minimum solute<br />
gain. But, in present case, the dehydrated product has to<br />
be utilised directly without rehydration. Therefore, the<br />
optimisation was aimed at the maximum solute gain<br />
during osmotic dehydration process. It will also help to<br />
make the product shelf stable at ambient conditions.<br />
Water loss<br />
(g per 100 g<br />
of fresh arils)<br />
Solute gain<br />
(g per 100 g<br />
of fresh arils)<br />
)1.00 )1.00 )1.00 45.00 40.00 60.00 16.19 1.76 68.32<br />
1.00 )1.00 )1.00 55.00 40.00 60.00 22.23 2.53 54.43<br />
)1.00 1.00 )1.00 45.00 50.00 60.00 22.46 1.91 63.05<br />
1.00 1.00 )1.00 55.00 50.00 60.00 28.80 2.83 47.26<br />
)1.00 )1.00 1.00 45.00 40.00 100.00 27.87 3.21 58.97<br />
1.00 )1.00 1.00 55.00 40.00 100.00 33.48 4.52 52.40<br />
)1.00 1.00 1.00 45.00 50.00 100.00 36.95 4.54 49.15<br />
1.00 1.00 1.00 55.00 50.00 100.00 42.80 5.52 46.27<br />
)1.68 0.00 0.00 41.59 45.00 80.00 22.73 2.14 62.48<br />
1.68 0.00 0.00 58.41 45.00 80.00 35.48 3.94 44.59<br />
0.00 )1.68 0.00 50.00 36.59 80.00 19.62 3.75 62.86<br />
0.00 1.68 0.00 50.00 53.41 80.00 31.33 4.81 46.78<br />
0.00 0.00 )1.68 50.00 45.00 46.36 19.25 1.55 66.03<br />
0.00 0.00 1.68 50.00 45.00 113.64 39.80 5.09 48.17<br />
0.00 0.00 0.00 50.00 45.00 80.00 23.52 2.61 54.20<br />
0.00 0.00 0.00 50.00 45.00 80.00 24.89 2.68 53.57<br />
0.00 0.00 0.00 50.00 45.00 80.00 23.97 2.76 53.25<br />
0.00 0.00 0.00 50.00 45.00 80.00 24.15 2.79 52.87<br />
0.00 0.00 0.00 50.00 45.00 80.00 24.64 2.85 53.69<br />
0.00 0.00 0.00 50.00 45.00 80.00 24.57 2.88 52.78<br />
Total anthocyanin<br />
content (mg per 100 g<br />
of dehydrated arils)<br />
Further, increase in sucrose concentration in product<br />
has also been reported to minimise anthocyanin losses<br />
during convective dehydration (Wrolstad et al., 1990).<br />
Response surface methodology was applied to the<br />
experimental data using a commercial statistical package,<br />
Design-Expert version 6.01 (Trial version; Statease<br />
Inc., Minneapolis, MN, USA). The same software was<br />
used for the generation of response surface plots,<br />
superimposition of contour plots, <strong>and</strong> optimisation of<br />
process variables.<br />
Mathematical calculations<br />
Water loss <strong>and</strong> solute gain during osmotic dehydration<br />
The water loss <strong>and</strong> solute gain during osmotic dehydration<br />
were calculated by the equations given by Ozen<br />
et al., 2002; Singh et al., 2007;<br />
Water loss ðgÞ per 100 g of fresh arils<br />
¼ ðWo WtÞþðSt<br />
Wo<br />
SoÞ<br />
100<br />
Solute gain ðgÞ per 100 g of fresh arils ¼ ðSt SoÞ<br />
Wo<br />
ð2Þ<br />
100<br />
ð3Þ<br />
Where Wo is the initial weight of arils (g), Wt is the<br />
weight of arils after osmotic dehydration for any time t<br />
(min), So is the initial weight of solids (dry matter) in the<br />
International Journal of Food Science <strong>and</strong> Technology 2010 Ó 2010 The Authors. Journal compilation Ó 2010 Institute of Food Science <strong>and</strong> Technology
arils (g), <strong>and</strong> S t is the weight of solids (dry matter) of<br />
arils after osmotic dehydration for time t (min).<br />
Estimation of dry matter <strong>and</strong> moisture content<br />
The samples were oven-dried at 103 ± 2 °C with lids<br />
open until a constant weight loss (AOAC, 1965).<br />
Total anthocyanin content<br />
Total anthocyanin content was determined by procedure<br />
given by Ranganna, 1986, which involves extraction of<br />
anthocyanins with ethanolic HCl: 95% ethanol–1.5 N<br />
HCl (85:15) <strong>and</strong> measurement of colour at the wavelength<br />
of maximum absorption (535 nm). The total<br />
anthocyanin was calculated by use of molecular extinction<br />
coefficient values.<br />
The total anthocyanin content was measured by<br />
following formulae:<br />
Total OD per 100g of driedsample<br />
OD volume up of the extract total volume<br />
¼<br />
ml of the extract used wt of sample taken<br />
100<br />
Total anthocyanin content in mg per 100g dried sample<br />
total OD per 100 g of sample<br />
¼<br />
Extinction coefficient<br />
Where the extinction coefficient value is the average of<br />
anthocyanins in alcoholic media at 535 nm for 1%<br />
solution (10 mg mL )1 ) is equal to 982. Therefore,<br />
absorbance of solution containing 1 mg mL )1 is equal<br />
to 98.2.<br />
Results <strong>and</strong> discussion<br />
Diagnostic checking of fitted models <strong>and</strong> response surfaces<br />
The results of second-order response surface model in<br />
the form of analysis of variance (anova) are given in<br />
Tables 3, 4, <strong>and</strong> 5. The results indicated that the fitted<br />
quadratic models accounted for more than 90% of the<br />
variation in the experimental data, which were highly<br />
significant (R 2 > 0.90).<br />
The magnitude of P values from Table 3 revealed that<br />
all linear <strong>and</strong> quadratic terms of process variables have<br />
significant effect at 5% level of significance (P < 0.05)<br />
on water loss during osmotic dehydration. Further,<br />
interaction of ‘temperature <strong>and</strong> time’ has significant<br />
effect on water loss. The model F-value is 198.56, which<br />
implies the model is significant. The relative magnitude<br />
of b values (Table 3) indicates the maximum positive<br />
effect of process duration (b = 6.2954) followed by<br />
osmotic solution temperature (b = 3.7292) <strong>and</strong> concentration<br />
(b = 3.3159) on water loss. The quadratic <strong>and</strong><br />
interaction terms of all the process parameters have least<br />
effect on water loss as compared to the linear terms of<br />
Optimisation of osmotic dehydration by response surface methodology M. Mundada et al. 1735<br />
Table 3 anova table showing the variables as a linear, quadratic, <strong>and</strong><br />
interaction terms on water loss <strong>and</strong> coefficients for the prediction<br />
models<br />
Source df b Sum of squares F-value P-level<br />
Model 9 24.2707 108.9694 198.5582
1736<br />
Optimisation of osmotic dehydration by response surface methodology M. Mundada et al.<br />
Table 5 anova table showing the variables as a linear, quadratic,<br />
<strong>and</strong> interaction terms on total anthocyanin content variable <strong>and</strong><br />
coefficient for the prediction model<br />
Source df b Sum of squares F-value P-level<br />
Model 9 53.4026 885.5648 39.6288
Solute gain(g)/100g of fresh arils<br />
(a) (b)<br />
4.62643<br />
3.83165<br />
3.03686<br />
2.24207<br />
1.44728<br />
100.00<br />
55.00<br />
90.00<br />
52.50<br />
80.00<br />
50.00<br />
70.00<br />
47.50<br />
60.00 45.00<br />
Time (min)<br />
Optimization of osmotic dehydration process<br />
Concentration (°B)<br />
A graphical multiresponse optimization technique was<br />
adopted to determine the workable optimum conditions<br />
for the osmotic dehydration of pomegranate arils. The<br />
contour plots for all responses were superimposed, <strong>and</strong><br />
regions that best satisfy all the constraints were selected<br />
as optimum conditions. The main criterion for constraints<br />
optimization was maximum possible water loss,<br />
solute gain <strong>and</strong> total anthocyanin content. These constraints<br />
resulted in ‘feasible zone’ of the optimum<br />
solutions (shaded area in the superimposed contour<br />
plots). Superimposed contour plots having common<br />
superimposed area for all responses for osmotic dehydration<br />
are as shown in Fig. S1a, b. The points in the<br />
range 50–52.5°Bx of osmotic solution concentration,<br />
Solute gain (g)/100g of fresh arils<br />
5.04924<br />
4.24531<br />
3.44138<br />
2.63745<br />
1.83352<br />
100.00<br />
50.00<br />
90.00<br />
47.50<br />
80.00<br />
45.00<br />
70.00<br />
42.50<br />
60.00 40.00<br />
Time (min)<br />
Temperature (°C)<br />
Figure 2 Influence of process variables on solute gain (a) Sucrose concentration <strong>and</strong> time at 45 °C of osmotic solution temperature (b)<br />
temperature <strong>and</strong> time at 50°Bx of osmotic solution concentration.<br />
Total anthocyanin content<br />
(mg)/100gm of dehydrated arils<br />
(a) (b)<br />
63.19<br />
58.63<br />
54.06<br />
49.50<br />
44.94<br />
55.00<br />
52.50<br />
Concentration (°B)<br />
50.00<br />
47.50<br />
45.00 50.00<br />
47.50<br />
Optimisation of osmotic dehydration by response surface methodology M. Mundada et al. 1737<br />
45.00<br />
42.50<br />
Temperature (°C)<br />
40.00<br />
Total anthocynain content<br />
(mg)/100g of dehydrated arils<br />
62.8423<br />
58.7514<br />
54.6606<br />
50.5698<br />
46.4789<br />
100.00<br />
50.00<br />
90.00<br />
47.50<br />
80.00<br />
45.00<br />
70.00<br />
42.50<br />
60.00 40.00<br />
Time (min)<br />
Temperature (°C)<br />
Figure 3 Influence of process variables on total anthocyanins (a) sucrose concentration <strong>and</strong> temperature for 80 min of process duration (b)<br />
temperature <strong>and</strong> time at 50°Bx of osmotic solution concentration.<br />
40–42.5 °C osmotic solution temperature <strong>and</strong> 98–100<br />
min process duration were found to be optimum for<br />
osmotic dehydration.<br />
To optimise the process conditions for osmotic dehydration<br />
process by numerical optimization technique,<br />
equal importance of ‘3’ was given to all the three process<br />
parameters (viz. osmotic solution concentration, process<br />
duration, <strong>and</strong> solution temperature). However, based on<br />
their relative contribution to quality of final product, the<br />
importance given to different responses was 4, 3, <strong>and</strong> 4 for<br />
water loss, solute gain, <strong>and</strong> anthocyanin content, respectively.<br />
The optimum operating conditions for concentration,<br />
temperature, <strong>and</strong> process duration were 55°Bx,<br />
40 °C, <strong>and</strong> 100 min, respectively. The optimum processing<br />
conditions were experimentally verified <strong>and</strong> proven to<br />
be adequately reproducible with ±0.1% deviation.<br />
Ó 2010 The Authors. Journal compilation Ó 2010 Institute of Food Science <strong>and</strong> Technology International Journal of Food Science <strong>and</strong> Technology 2010
1738<br />
Optimisation of osmotic dehydration by response surface methodology M. Mundada et al.<br />
Conclusion<br />
Response surface methodology was effective in optimising<br />
process parameters for the osmotic dehydration<br />
of pomegranate arils in osmotic aqueous solutions<br />
of sucrose having concentrations in the range 45–<br />
55°Bx, temperature 40–50 °C, <strong>and</strong> process duration<br />
60–100 min. The regression equations obtained in this<br />
study can be used for optimum conditions for desired<br />
responses within the range of conditions applied in this<br />
study. Graphical techniques, in connection with response<br />
surface methodology (RSM), aided in locating<br />
optimum operating conditions, which were experimentally<br />
verified <strong>and</strong> proven to be adequately reproducible.<br />
Optimum solution by numerical optimization obtained<br />
was 55°Bx osmotic solution concentration, 40 °C<br />
osmotic solution temperature, <strong>and</strong> 100 min of process<br />
duration to get maximum possible water loss, solute<br />
gain, <strong>and</strong> total anthocyanin retention.<br />
References<br />
Ade-Omowaye, B.I.O., Rastogi, N.K., Angersbach, A. & Knorr, D.<br />
(2002). Osmotic dehydration behavior of red paprika (Capsicum<br />
annuum L.). Journal of Food Science, 67, 1790–1796.<br />
Al-Maiman, S.A. & Ahmad, D. (2002). Changes in physical <strong>and</strong><br />
chemical properties during pomegranate (Punica granatum L.) fruit<br />
maturation. Food Chemistry, 76, 437–441.<br />
AOAC. (1965). Official Methods of Analysis, 16th edn. Washington,<br />
DC: Association of Official Agricultural Chemists.<br />
Azoubel, P.M. & Murr, F.E.X. (2004). Mass transfer kinetics of<br />
osmotic dehydration of cherry tomato. Journal of Food Engineering,<br />
61, 291–295.<br />
Chopra, C.S. (2001). Osmo-vacuum drying of carrots: effect of salted<br />
syrup on drying behavior <strong>and</strong> product quality. Beverage & Food<br />
World, September, 15–17.<br />
Erle, U. & Schubert, H. (2001). Combined osmotic <strong>and</strong> microwave–<br />
vacuum dehydration of apples <strong>and</strong> strawberries. Journal of Food<br />
Engineering, 49, 193–199.<br />
Falade, K.O. & Adelakun, T.O. (2006). Effect of pre-freezing <strong>and</strong><br />
solutes on mass transfer during osmotic dehydration <strong>and</strong> colour of<br />
oven-dried african star apple during storage. International Journal of<br />
Food Science <strong>and</strong> Technology, 41, 1–9.<br />
Falade, K.O. & Igbeka, J.C. (2007). Osmotic dehydration of tropical<br />
fruits <strong>and</strong> vegetables. Food Reviews International, 23, 373–405.<br />
Khuri, A.I. & Cornell, J.A. (1987). Response Surfaces Design <strong>and</strong><br />
Analysis. New York: Marcel Dekker.<br />
Kingsly, A.R., Singh, B.D., Manikantan, M.R. & Jain, R.K. (2006).<br />
Moisture dependant physical properties of dried pomegranate seeds<br />
(Anardana). Journal of Food Engineering, 75, 492–496.<br />
Lenart, A. (1996). Osmotic-convective drying of fruits <strong>and</strong> vegetables:<br />
technology <strong>and</strong> application. Drying Technology, 18, 951–<br />
966.<br />
Lewicki, P.P. & Porzecka-Pawlak, R. (2005). Effect of osmotic<br />
dewatering on apple tissue structure. Journal of Food Engineering,<br />
66, 43–50.<br />
Madamba, P.S. & Lopez, R.I. (2002). Optimization of the osmotic<br />
dehydration of mango (Mangifera indica l.) slices. Drying Technology,<br />
20, 1227–1242.<br />
Negi, P.S., Jayaprakasha, G.K. & Jena, B.S. (2003). Antioxidant <strong>and</strong><br />
antimutagenic activities of pomegranate peel extracts. Food Chemistry,<br />
80, 393–397.<br />
Nsonzi, F. & Ramaswamy, S. (1998). Quality evaluation of osmoconvective<br />
dried blueberries. Drying Technology, 16, 705–723.<br />
Ozen, B.F., Dock, L.L., Ozdemir, M. & Floros, J.D. (2002). Processing<br />
factors affecting the osmotic dehydration of diced green peppers.<br />
International Journal of Food Science <strong>and</strong> Technology, 37, 497–502.<br />
Panades, G., Fito, P., Aguiar, Y., Nunez de Villavicencio, M. &<br />
Acosta, V. (2006). Osmotic dehydration of guava: influence of<br />
operating parameters on process kinetics. Journal of Food Engineering,<br />
72, 383–389.<br />
Panagiotou, N.M., Karathanos, V.T. & Maroulis, Z.B. (1999). Effect<br />
of osmotic agent on osmotic dehydration of fruits. Drying Technology,<br />
17, 175–189.<br />
Ranganna, S. (1986). H<strong>and</strong>book of Analysis <strong>and</strong> Quality Control for<br />
Fruits <strong>and</strong> Vegetable Products. New Delhi: Tata McGraw-Hill.<br />
Rosenblat, M. & Aviram, M. (2006). Antioxidative properties of<br />
pomegranate: in vitro studies. In: Pomegranates Ancient Roots to<br />
Modern Medicine (edited by N.P. Seeram, R.N. Schulman & D.<br />
Heber). Pp. 31–43. Boca Raton, FL: CRC Press.<br />
Sablani, S.S., Rahman, M.S. & Al-Sadeiri, D.S. (2002). Equilibrium<br />
distribution data for osmotic drying of apple cubes in sugar-water<br />
solution. Journal of Food Engineering, 52, 193–199.<br />
Saurel, R., Raoult-Wack, A.L., Rios, G. & Guilbert, S. (1994). Mass<br />
transfer phenomena during osmotic dehydration of apple I: fresh<br />
plant tissue. International Journal of Food Science <strong>and</strong> Technology,<br />
29, 531–542.<br />
Shi, J. & Le Maguer, M. (2002). Osmotic dehydration of foods: mass<br />
transfer modeling aspects. Food Reviews International, 18, 305–335.<br />
Shi, J., Le Maguer, M., Kakuda, Y., Liptay, A. & Niekamp, F. (1999).<br />
Lycopene degradation <strong>and</strong> isomerization in tomato dehydration.<br />
Food Research International, 32, 15–21.<br />
Singh, B., Kumar, A. & Gupta, A.K. (2007). Study of mass transfer<br />
kinetics <strong>and</strong> effective diffusivity during osmotic dehydration of<br />
carrot cubes. Journal of Food Engineering, 79, 471–480.<br />
Tonon, R.V., Brabet, C. & Hubinger, M.D. (2008). Influence of<br />
process conditions on the physicochemical properties of acai<br />
(Euterpe oleraceae Mart.) powder produced by spray drying. Journal<br />
of Food Engineering, 88, 411–418.<br />
Torreggiani, D. & Bertolo, G. (2002). The role of an osmotic step:<br />
combined processes to improve quality <strong>and</strong> control functional<br />
properties functional properties in fruits <strong>and</strong> vegetables. In: Engineering<br />
<strong>and</strong> Food for 21st Century (edited by W. Chanes, V. Gustavo<br />
& J.M. Aguilera). Pp. 1–19. Boca Raton: CRC Press.<br />
Vardin, H. & Fenerciog˘ lu, H. (2003). Study on the development of<br />
pomegranate juice processing technology: clarification of pomegranate<br />
juice. Nahrung, 47, 300–303.<br />
Waliszewski, K.N., Pardio, V.T. & Ramirez, M. (2002). Effect of<br />
EDTA on colour during osmotic dehydration of banana slices.<br />
Drying Technology, 20, 1291–1298.<br />
Wang, S.Y. (2007). Fruits with high antioxidant activity with<br />
functional foods. In: Functional Food Ingredients <strong>and</strong> Nutraceuticals:<br />
Processing Technologies (edited by J. Shi). Pp. 371–413. New York:<br />
Taylor <strong>and</strong> Francis group.<br />
Wrolstad, R.E., Wightman, J.D. & Durst, R.W. (1990). Glycosidase<br />
activitiy of enzyme preparations used in fruit juice processing. Food<br />
Technology, 48, 92.<br />
Supporting Information<br />
Additional supporting Information may be found in the<br />
online version of this article<br />
Figure S1. (a) Overlaid contour plots of (a) osmotic<br />
solution concentration <strong>and</strong> temperature (b) time <strong>and</strong><br />
osmotic solution temperature.<br />
Please note: Wiley-Blackwell are not responsible for<br />
the content or functionality of any supporting information<br />
supplied by the authors. Any queries (other than<br />
missing material) should be directed to the corresponding<br />
author for the article.<br />
International Journal of Food Science <strong>and</strong> Technology 2010 Ó 2010 The Authors. Journal compilation Ó 2010 Institute of Food Science <strong>and</strong> Technology
International Journal of Food Science <strong>and</strong> Technology 2010, 45, 1739–1745 1739<br />
Original article<br />
Response surface optimisation for the extraction of phenolics <strong>and</strong><br />
flavonoids from a pink guava puree industrial by-product<br />
Kin-Weng Kong, 1 Abdul Razak Ismail, 1 Seok-Tyug Tan, 1 Krishna Murthy Nagendra Prasad 1 & Amin Ismail 1,2 *<br />
1 Department of Nutrition <strong>and</strong> Dietetics, Faculty of Medicine <strong>and</strong> Health Sciences, Universiti Putra Malaysia, 43400 UPM Serdang, Selangor,<br />
Malaysia<br />
2 Laboratory of Analysis <strong>and</strong> Authentication, Halal Products Research Institute, Universiti Putra Malaysia, 43400 Serdang, Selangor, Malaysia<br />
(Received 17 March 2010; Accepted in revised form 27 May 2010)<br />
Summary Pink guava puree industry produces huge amount of by-products that have potential as sources for<br />
polyphenols. Response surface methodology was implemented to optimise the extraction conditions for<br />
phenolics (Y1) <strong>and</strong> flavonoids (Y2) from a by-product of the guava industry. A three-factor inscribed central<br />
composite design was employed to determine the effects of three independent variables, namely pH (X 1: 2–6),<br />
temperature (X 2: 40–60 °C) <strong>and</strong> time (X 3: 1–5 h), on the response variables. The corresponding predicted<br />
values for phenolics <strong>and</strong> flavonoids were 336.30 <strong>and</strong> 427.35 mg 100 g )1 , respectively. Predicted values for<br />
extraction rates of phenolics agreed well with experiment values; R 2 of 0.902. However, the model derived for<br />
flavonoids extraction was less reliable; R 2 of 0.983. Increase in time <strong>and</strong> temperature was found significant in<br />
increasing the extraction rate. The optimum conditions for extracting phenolics by ethanolic solvent<br />
occurred at a pH of 2 <strong>and</strong> 60 °C for a 5-h extraction.<br />
Keywords Extraction, flavonoids, phenolics, Psidium guajava by-products, response surface methodology.<br />
Introduction<br />
The food industry generates large amounts of byproducts<br />
from fruits <strong>and</strong> vegetables containing high<br />
amounts of polyphenolic antioxidants (Peschel et al.,<br />
2006). The use of these by-products in the food industry<br />
has become widespread <strong>and</strong> is attractive because of their<br />
lower cost <strong>and</strong> availability in large quantities (Schieber<br />
et al., 2001). In coping with increased productivity, the<br />
transformation of polyphenol-rich by-products into<br />
functional ingredients is an effective <strong>and</strong> efficient way<br />
of managing these by-products.<br />
The polyphenols from these by-products must first be<br />
extracted with suitable solvents to obtain their useful<br />
effects. Besides, the extraction conditions must be<br />
optimised because the solvent concentration, extraction<br />
time, temperature, pressure, solid to liquid ratio <strong>and</strong> pH<br />
of the extraction solvent significantly influence the<br />
extraction efficiency (Prasad et al., 2009). The conventional<br />
one-factor approach for performing optimisation<br />
is very time consuming. In this method, the interactions<br />
among various factors are not taken into consideration,<br />
<strong>and</strong> hence, the chances of obtaining the optimum<br />
*Correspondent: Fax: +603 89426769;<br />
e-mail: amin@medic.upm.edu.my<br />
doi:10.1111/j.1365-2621.2010.02335.x<br />
Ó 2010 Institute of Food Science <strong>and</strong> Technology<br />
conditions are slim (Liyana-Pathirana & Shahidi,<br />
2005). Response surface methodology (RSM) enables<br />
the outcome of many variables, as well as the interactions<br />
between them, to be evaluated. The use of RSM<br />
has been successful in optimising the extraction of<br />
phenolic compounds from food products such as apple<br />
pomace (Wijngaard & Brunton, 2010), wheat (Liyana-<br />
Pathirana & Shahidi, 2005), peanut skins (Ballard et al.,<br />
2009) <strong>and</strong> grape seeds (Karvela et al., 2009).<br />
Pink guava puree production is accompanied by an<br />
important quantity of by-product residues accounted<br />
for 25% of the fruits’ total loading weight. Three types<br />
of by-products are derived during the crushing, refining<br />
<strong>and</strong> sieving stages namely guava refiner (12%), guava<br />
siever (8%) <strong>and</strong> guava decanter (5%), respectively<br />
(Kong & Ismail, 2010). The first fraction, guava refiner<br />
is the green-brownish fraction that mainly consists of<br />
peels <strong>and</strong> seeds. However, guava siever <strong>and</strong> guava<br />
decanter are mostly consisting the pulps with slightly red<br />
in colour. Previously, these by-products had been<br />
explored as a potential source for antioxidants (Amin<br />
& Mukhrizah, 2006). Our previous work also reported<br />
that guava decanter <strong>and</strong> guava refiner by-products can<br />
potentially serve as the functional sources for lycopene<br />
<strong>and</strong> polyphenolic antioxidants (Kong et al., 2010a,b).<br />
However, there is little data concerning the effects of
1740<br />
Phenolic extraction from guava by-product K.-W. Kong et al.<br />
different extraction parameters on the polyphenolic<br />
components from the refined pink guava by-product<br />
(guava refiner). Thus, the current study was carried out<br />
to extract these compounds using the RSM with a<br />
central composite design (CCD) to optimise the extraction<br />
conditions <strong>and</strong> obtain maximum phenolic <strong>and</strong><br />
flavonoid compounds from the guava refiner.<br />
Materials <strong>and</strong> methods<br />
Chemicals<br />
Ethanol <strong>and</strong> sodium hydroxide (NaOH) were purchased<br />
from Fisher Scientific (Leicestershine, UK). The Folin-<br />
Ciocalteu reagent <strong>and</strong> citric acid were obtained from<br />
BDH Ltd. (Poole, Engl<strong>and</strong>). Butylated hydroxytoluene<br />
(BHT), sodium bicarbonate (NaHCO3), sodium nitrate<br />
(NaNO2), aluminium chloride (AlCl3), gallic acid <strong>and</strong><br />
rutin were purchased from Sigma Chemical Co.<br />
(St. Louis, MO, USA).<br />
Sample<br />
Refined pink guava (Psidium guavajava var. Sungkai<br />
Beaumont) puree industry by-product (guava refiner,<br />
particle size 1.2 mm) was conveniently sampled from<br />
Golden Hope Food <strong>and</strong> Beverages Sdn. Bhd., Perak,<br />
Malaysia. About 20 kg of sample was collected in frozen<br />
formed of 2.5 kg each <strong>and</strong> transported using the<br />
iceboxes to Laboratory of Nutrition, Universiti Putra<br />
Malaysia. Then, it was directly stored in )20 °C for<br />
5 weeks until further used.<br />
Extraction procedure<br />
Sample (1 g) was placed into a 15-mL falcon tube, <strong>and</strong><br />
10 mL of acidified 80% aqueous ethanol containing<br />
citric acid (0.1%) was added. The pH was then<br />
adjusted to the desired level using 1 m citric acid or<br />
NaOH. The extraction was conducted using an orbital<br />
shaker (Heidolph Unimax 1010, Schwabach, Germany)<br />
at 200 rpm, using the time <strong>and</strong> temperature<br />
dictated by the experimental design. The optimisation<br />
procedure was designed based on a three-factor<br />
inscribed CCD consisting of extraction pH (2–6),<br />
temperature (40–60 °C) <strong>and</strong> time (1–5 h) using five<br />
levels of each variable (Table 1). The extract was<br />
then centrifuged (Universal 32R; Hettich Zentrifugen,<br />
Tuttlingen, Germany) at 900 · g at 4 °C, <strong>and</strong> the<br />
supernatant was collected to determine the phenolic<br />
<strong>and</strong> flavonoid contents.<br />
Determination of phenolic content<br />
The phenolic content was determined according to the<br />
method of Singleton & Rossi (1965). The sample extract<br />
Table 1 Levels of independent variables for the extraction process<br />
based on central composite design<br />
Independent variables<br />
Coded variable level<br />
1 0 )1 axial ()a) axial (+a)<br />
X 1: Acetic acid (pH) 5.22 4.00 2.78 2.00 6.00<br />
X2: Temperature (°C) 56.12 50.00 43.88 40.00 60.00<br />
X 3: Time (h) 4.22 3.00 1.78 1.00 5.00<br />
(0.2 mL) was mixed with 1.5 mL of Folin-Ciocalteu<br />
reagent <strong>and</strong> was allowed to st<strong>and</strong> at room temperature<br />
for 5 min. Then, 1.5 mL of sodium bicarbonate solution<br />
(0.566 m) was added to the mixture, <strong>and</strong> the absorbance<br />
was read at 725 nm using a UV-VIS spectrophotometer<br />
(UV-1601; Shimadzu Corporation, Victoria, Australia)<br />
after a 90-min reaction time. The st<strong>and</strong>ard calibration<br />
curve of gallic acid (0.02–0.10 mg mL )1 ) was plotted to<br />
calculate the results. Results were expressed in terms of<br />
fresh weight basis as mg gallic acid equivalents (GAE)<br />
per 100 g of the guava refiner.<br />
Determination of flavonoid content<br />
The flavonoid content was measured spectrophotometrically<br />
using the method of Zhishen et al. (1999). The<br />
sample extract (1 mL) was mixed with 4 mL deionised<br />
water. After 5 min, 0.3 mL of 5% NaNO2 was added to<br />
the mixture <strong>and</strong> was subsequently mixed with 0.3 mL of<br />
10% AlCl3. After 6 min, 2 mL of 1 m NaOH was<br />
added, <strong>and</strong> the mixture was diluted to a volume of<br />
10 mL using deionised water. A reagent blank was<br />
conducted by replacing the sample extract with deionised<br />
water. The absorbance of the mixture was<br />
measured at 510 nm by subtracting the absorbance of<br />
the blank. A st<strong>and</strong>ard calibration curve of rutin<br />
(0.02–0.10 mg mL )1 ) was plotted to calculate the<br />
results. The flavonoid content was expressed in terms<br />
of fresh weight as the mg rutin equivalent (RE) per<br />
100 g of guava refiner.<br />
Experimental design<br />
A three-factor inscribed CCD was developed to optimise<br />
the extraction process for the phenolics <strong>and</strong> flavonoids<br />
of the guava refiner. The experiment was also implemented<br />
to determine the effects of the three independent<br />
variables namely, pH (X1: 2–6), temperature (X2: 40–<br />
60 °C) <strong>and</strong> time (X3: 1–5 h), on the phenolic content<br />
(Y1) <strong>and</strong> the flavonoid contents (Y2). Twenty r<strong>and</strong>omised<br />
experiments were assigned based on the secondorder<br />
CCD, <strong>and</strong> the centre points were repeated six<br />
times. The experimental design obtained from the CCD<br />
is presented in Table 2.<br />
International Journal of Food Science <strong>and</strong> Technology 2010, 45, 1739–1745 Ó 2010 Institute of Food Science <strong>and</strong> Technology
Table 2 Experimental design for the extraction process from central<br />
composite design<br />
Extraction Blocks pH (X1) Temperature (°C) (X2) Time (h) (X3)<br />
1 1 5.22 43.88 4.22<br />
2 a<br />
1 4.00 50.00 3.00<br />
3 1 2.78 56.12 4.22<br />
4 1 5.22 56.12 1.78<br />
5 1 2.78 43.88 1.78<br />
6 a<br />
1 4.00 50.00 3.00<br />
7 3 4.00 40.00 3.00<br />
8 3 2.00 50.00 3.00<br />
9 a<br />
3 4.00 50.00 3.00<br />
10 3 4.00 50.00 1.00<br />
11 a<br />
3 4.00 50.00 3.00<br />
12 3 6.00 50.00 3.00<br />
13 3 4.00 50.00 5.00<br />
14 3 4.00 60.00 3.00<br />
15 2 5.22 43.88 1.78<br />
16 2 2.78 56.12 1.78<br />
17 2 5.22 56.12 4.22<br />
18 a<br />
2 4.00 50.00 3.00<br />
19 a<br />
2 4.00 50.00 3.00<br />
20 2 2.78 43.88 4.22<br />
a Centre points.<br />
Statistical analysis<br />
The Minitab 14 statistical package (Minitab Inc., State<br />
College, PA, USA) was used to conduct the experimental<br />
design <strong>and</strong> the statistical analysis. Results for the<br />
contents of phenolics <strong>and</strong> flavonoids were expressed as<br />
means ± st<strong>and</strong>ard deviations. A response surface analysis<br />
<strong>and</strong> analysis of variance (anova) was employed to<br />
determine the regression coefficients, statistical significance<br />
of the model terms <strong>and</strong> to fit the mathematical<br />
models of the experimental data that aimed to optimise<br />
the overall region for both response variables. A secondorder<br />
polynomial model was applied to predict the<br />
response variables as given below:<br />
Y ¼ b0 þ b1X1 þ b2X2 þ b3X3 þ b 2 1X21 þ b22 X22 þ b 2 3X23 þ b1b2X1X2<br />
ð1Þ<br />
þ b1b3X1X3 þ b2b3X2X3<br />
where Y is the predicted dependent variable; b0 is a<br />
constant that fixed the response at the central point of<br />
the experiment; b1, b2 <strong>and</strong> b3 are the regression coefficients<br />
for the linear effect terms; b1 2 , b2 2 <strong>and</strong> b3 2 are the<br />
quadratic effect terms; <strong>and</strong> b1b2, b1b3 <strong>and</strong> b2b3 are the<br />
interaction effect terms, respectively.<br />
The adequacy of the model was predicted through the<br />
regression analysis (R 2 ) <strong>and</strong> the anova analysis<br />
(P < 0.05). The significance of the regression coefficients<br />
was analysed through a t-test, <strong>and</strong> non-significant coefficients<br />
were removed to obtain a reduced model. The<br />
relationship between the independent variables (X1, X2<br />
<strong>and</strong> X3) <strong>and</strong> the response variables (Y1 <strong>and</strong> Y2) was<br />
Phenolic extraction from guava by-product K.-W. Kong et al. 1741<br />
demonstrated by the response surface plots. The response<br />
optimiser was implemented for both graphical <strong>and</strong><br />
numerical optimisations to attain the optimum conditions<br />
<strong>and</strong> predicted values for the response variables.<br />
Verification of the model<br />
Experimental data for the contents of phenolics <strong>and</strong><br />
flavonoids were obtained accordingly to the recommended<br />
optimum conditions. Verification of the<br />
response surface model was conducted by comparing<br />
the experimental value obtained from an independent<br />
set of samples with the predicted value obtained from<br />
the optimised model.<br />
Results <strong>and</strong> discussion<br />
Sample <strong>and</strong> extraction parameters selection<br />
Guava refiner was selected because it is the largest<br />
fraction produced <strong>and</strong> exhibited the highest total<br />
phenolic content compared to other by-products of<br />
pink guava (Kong & Ismail, 2010; Kong et al., 2010a).<br />
This fraction consisted of seeds <strong>and</strong> the peels of pink<br />
guava fruits. Previous studies have shown that seeds <strong>and</strong><br />
peels from fruits are rich in polyphenolic antioxidants<br />
such as grape seeds (Karvela et al., 2009), orange peels<br />
(Khan et al., 2009) <strong>and</strong> litchi peels (Prasad et al., 2009).<br />
Seeds <strong>and</strong> peels may have higher polyphenolic components<br />
than the fruit pulp. According to Jime´nez-Escrig<br />
et al. (2001), guava peels are twice as high in total<br />
phenols compared to the guava pulp.<br />
The efficiency <strong>and</strong> effectiveness of the polyphenolic<br />
extraction process are generally manipulated by multiple<br />
variables such as extraction time, temperature, pH <strong>and</strong><br />
solvent composition (Alothman et al., 2009). The lower,<br />
middle <strong>and</strong> upper levels of the three significant extraction<br />
parameters, namely pH (X1: 2–6), temperature (X2: 40–60 °C) <strong>and</strong> time (X3: 1–5 h) were subsequently<br />
selected. The experimental values, as well as the<br />
predicted values for the response variables, are shown<br />
in Table 3. The data attained was employed to predict<br />
an optimal set of extraction parameters for the production<br />
of guava refiner extract with high phenolic content<br />
(Y1) <strong>and</strong> flavonoid content (Y2).<br />
Fitting the response surface models<br />
The experimental values of phenolic content (Y1) <strong>and</strong><br />
flavonoid content (Y2) were employed in a multiple<br />
regression analysis performed using response surface<br />
analysis to fit the second-order polynomial equations<br />
(Table 3). In this study, the values obtained experimentally<br />
for both response variables are near to the<br />
predicted values (Table 3). Regression coefficients, coefficients<br />
of determination (R 2 ), adjusted R 2 values,<br />
Ó 2010 Institute of Food Science <strong>and</strong> Technology International Journal of Food Science <strong>and</strong> Technology 2010, 45, 1739–1745
1742<br />
Phenolic extraction from guava by-product K.-W. Kong et al.<br />
Table 3 Experimental <strong>and</strong> predicted data obtained for the dependent<br />
variables<br />
Extraction<br />
Phenolic content (Y1)<br />
(mg GAE per 100 g<br />
guava refiner)<br />
Experimental<br />
value<br />
probability values (P) <strong>and</strong> lack of fit values for both<br />
dependent variables are shown in Table 4. The quality<br />
of fit to the second-order polynomial models was<br />
confirmed based on the coefficients of determination<br />
(R 2 ), which were 0.815 <strong>and</strong> 0.967 for phenolic <strong>and</strong><br />
flavonoid content, respectively. These results indicated<br />
that the models can significantly (P < 0.05) explain<br />
more than 80% (R 2 > 0.80) of the response variation.<br />
The ‘‘fitness’’ of the model was evaluated through the<br />
lack of fit test (P > 0.05), which indicated the adequacy<br />
of models to accurately predict the variation.<br />
Influence of extraction parameters on phenolic content<br />
The influence of three independent variables on the<br />
phenolic content was reported through the significant<br />
(P < 0.05) coefficient of the second-order polynomial<br />
regression equation. Solvent pH, extraction temperature<br />
<strong>and</strong> time showed significant first-order effects (linear<br />
term in X1, X2 <strong>and</strong> X3), second-order effects (quadratic<br />
term in X2 2 ) <strong>and</strong> interactive effects (interactive term in<br />
X1X3) for phenolic content (Y1). The predicted model<br />
obtained for Y1 was as follows:<br />
Y1 ¼ 171:795 35:527X1 þ 16:460X2 þ 27:710X3<br />
þ 27:345X 2 2<br />
Predicted<br />
value<br />
10:394X1X3<br />
Flavonoid content (Y 2) (mg<br />
RE per 100 g guava refiner)<br />
Experimental<br />
value<br />
Predicted<br />
value<br />
1 151.17 ± 5.01 150.82 294.02 ± 8.57 295.08<br />
2 a<br />
156.94 ± 5.21 171.80 269.70 ± 33.10 265.14<br />
3 265.00 ± 0.97 252.40 310.98 ± 22.69 306.65<br />
4 157.20 ± 2.08 151.66 251.96 ± 1.63 254.99<br />
5 179.71 ± 10.47 168.10 213.12 ± 15.21 205.19<br />
6 a<br />
165.86 ± 2.63 171.80 269.05 ± 13.63 265.14<br />
7 178.99 ± 2.45 182.68 233.56 ± 3.46 239.00<br />
8 185.59 ± 5.00 204.29 238.60 ± 3.65 250.64<br />
9 a<br />
171.49 ± 2.73 171.80 263.92 ± 5.19 265.14<br />
10 133.58 ± 3.27 143.64 230.34 ± 4.22 233.36<br />
11 a<br />
178.34 ± 16.03 171.80 266.48 ± 17.57 265.14<br />
12 136.96 ± 3.52 133.23 233.52 ± 9.10 225.52<br />
13 194.16 ± 3.07 199.06 299.50 ± 22.63 300.52<br />
14 204.32 ± 10.81 215.60 344.99 ± 15.05 343.60<br />
15 152.17 ± 4.55 154.79 184.46 ± 5.28 186.09<br />
16 190.19 ± 0.13 180.56 337.16 ± 8.02 333.40<br />
17 177.06 ± 1.74 178.69 289.75 ± 30.59 294.99<br />
18 a<br />
183.36 ± 9.86 171.80 265.57 ± 12.29 265.14<br />
19 a<br />
179.78 ± 3.37 171.80 257.48 ± 9.25 265.14<br />
20 213.38 ± 3.24 208.94 253.18 ± 34.66 247.44<br />
a Centre points.<br />
ð2Þ<br />
The response surface plots explained the relationships<br />
between the phenolic content <strong>and</strong> the three extraction<br />
parameters involved (Fig. 1a–c). According to the linear<br />
<strong>and</strong> quadratic coefficients in Equation 2, positive coefficients<br />
for X2 <strong>and</strong> X3 <strong>and</strong> negative for X1, indicating<br />
phenolic content was increased with the increase in<br />
extraction temperature (40–60 °C) <strong>and</strong> time (1–5 h), but<br />
reduced when the solvent pH (2–6) increased. This was<br />
agreed by Lapornik et al. (2005), who found that<br />
polyphenols yielded from grape, black <strong>and</strong> red currant<br />
by-products from an ethanol extraction solvent, increased<br />
when the extraction time increased. In addition, higher<br />
temperatures can improve the phenolic content through<br />
the increase in phenolic solubility, diffusion rate, mass<br />
transfer rate, extraction rate <strong>and</strong> reduced solvent viscosity<br />
<strong>and</strong> surface tension (Richter et al., 1996). Moreover,<br />
increased temperatures may enhance the concurrent<br />
decomposition of the compounds, including those mobilised<br />
at lower temperatures (Wettasinghe & Shahidi,<br />
1999). Thus, it will be helpful in increasing the extraction<br />
rate, as well as decreasing the extraction time (Cacace &<br />
Mazza, 2002). Conversely, a decrease in the polyphenol<br />
content may also occur at high temperatures because of<br />
the interference of compound stability caused by chemical<br />
<strong>and</strong> enzymatic degradation or reactions with other plant<br />
components that hinder their extraction efficiencies<br />
(Moure et al., 2001; Kiassos et al., 2009).<br />
The interaction coefficient showed that increase in<br />
extraction pH <strong>and</strong> time will cause the reduction in<br />
phenolic content. This was in agreement with Mylonaki<br />
et al. (2008) that a linear decline was found on phenolic<br />
content while pH value was increasing. In acidic<br />
condition, higher extractability for phenolic compounds<br />
was reported (Aliakbarian et al., 2009). A hydrolysis<br />
mechanism may occur to disintegrate the phenolic<br />
compounds that bound to their polymers or cell wall<br />
elements (Chirinos et al., 2007). Although previous<br />
study stated higher pH value could increase the polarity<br />
of polyphenols by enhancing the dissociation of the<br />
mainly acidic phenolic –OH groups <strong>and</strong> subsequently<br />
promote the solubility of polyphenols, but indirectly it<br />
will facilitate the oxidation process (Mylonaki et al.,<br />
2008). Additionally, prolong extraction time may expose<br />
the phenolic compounds to oxidative degradation<br />
(Madhujith & Shahidi, 2006).<br />
Influence of extraction parameters on flavonoid contents<br />
The regression equation significantly (P < 0.05) explained<br />
the variation of flavonoids (Y2) in the function<br />
of different extraction parameters. For flavonoid extraction,<br />
the pH, temperature <strong>and</strong> time were found to be<br />
significant for three linear effects (X1, X2 <strong>and</strong> X3), two<br />
quadratic effects (X1 2 <strong>and</strong> X2 2 ) <strong>and</strong> three interactive<br />
effects (X1X2, X1X3 <strong>and</strong> X2X3). The predicted model<br />
obtained for Y2 is given below:<br />
International Journal of Food Science <strong>and</strong> Technology 2010, 45, 1739–1745 Ó 2010 Institute of Food Science <strong>and</strong> Technology
Table 4 Regression coefficients, R 2 values, adjusted R 2 values <strong>and</strong> probability values for dependent variables<br />
Regression coefficient<br />
Phenolic content (Y1) 171.795 a<br />
Flavonoid content (Y2) 265.143 a<br />
R 2<br />
Constant Linear Quadratic Interaction<br />
b0 b1 b2 b3 b1 2<br />
)35.527 a<br />
)12.561 a<br />
16.460 a<br />
52.303 a<br />
27.710 a<br />
33.578 a<br />
b2 2<br />
)3.035 27.345 a<br />
)27.060 a<br />
26.155 a<br />
b3 2<br />
Y2 ¼ 265:143 12:561X1 þ 52:303X2 þ 33:578X3<br />
27:060X 2 1 þ 26:155X2 2<br />
þ 44:494X1X3 46:002X2X3<br />
b1b2 b1b3 b2b3<br />
)0.441 )10.394 )29.874 a<br />
1.798 )39.536 a<br />
44.494 a<br />
39:536X1X2<br />
20.669<br />
)46.002 a<br />
R 2 (adj) Regression (P value) Lack of fit<br />
0.902 0.815 0.001 0.204<br />
0.983 0.967 0.000 0.068<br />
a The regression coefficients showed a significant (P < 0.05) relationship.<br />
(a)<br />
Phenolic content<br />
(mg GAE/100 g guava refiner)<br />
(b)<br />
Phenolic content<br />
(mg GAE/100 g guava refiner)<br />
(c)<br />
Phenolic content<br />
(mg GAE/100 g guava refiner)<br />
250<br />
200<br />
150<br />
250<br />
200<br />
150<br />
2<br />
4<br />
50<br />
pH<br />
6<br />
40<br />
Temperature (°C)<br />
40 4.0<br />
50<br />
2.5<br />
60<br />
1.0<br />
Temperature (°C) Time (h)<br />
250<br />
200<br />
150<br />
2<br />
4<br />
pH<br />
6<br />
1.0<br />
4.0<br />
2.5<br />
Time (h)<br />
Figure 1 Response surface plot showing the effects of extraction (i)<br />
pH, (ii) temperature <strong>and</strong> (iii) time on the phenolic content of guava<br />
refiner.<br />
60<br />
5.5<br />
5.5<br />
Phenolic extraction from guava by-product K.-W. Kong et al. 1743<br />
ð3Þ<br />
Response surface plots explaining the relationships<br />
between flavonoid content <strong>and</strong> the three extraction<br />
parameters are shown in Fig. 2a–c. According to the<br />
linear <strong>and</strong> quadratic coefficients, the extraction temperature<br />
<strong>and</strong> time promoted the extraction of flavonoids, but<br />
solvent pH had an inverse relationship with flavonoid<br />
extraction (Equation 3). However, a positive interaction<br />
effect was observed for pH <strong>and</strong> time, where flavonoid<br />
content increased when both parameters increased. A<br />
previous study demonstrated that the extraction of<br />
flavonoids from mashua tubers was higher in less acidic<br />
solvents (Chirinos et al., 2007). Although higher yields of<br />
total flavonoids were found at pH values of 4.5 to 6, the<br />
flavonoid content was found to be consistent (Karvela<br />
et al., 2009). These polyphenols are easily oxidised at<br />
higher pH levels (Mylonaki et al., 2008).<br />
Interestingly, the interaction between pH <strong>and</strong> temperature<br />
<strong>and</strong> between temperature <strong>and</strong> time was<br />
inversely related to the flavonoid content. These results<br />
clearly indicated that the influences of pH <strong>and</strong> time on<br />
the flavonoid yield were dependent on temperature.<br />
Hence, additional time is not useful in extracting more<br />
flavonoid compounds because it will implicate the<br />
degradation of the compounds when a longer extraction<br />
time <strong>and</strong> a higher temperature are applied (Silva et al.,<br />
2007). Although increase temperature may enhance the<br />
extraction but extreme temperatures will cause a reduction<br />
in the flavonoid content because of flavonoids are<br />
the thermo labile compounds that should be extracted at<br />
low temperatures of approximately 60 °C (Silva et al.,<br />
2007). However, the time <strong>and</strong> pH were the important<br />
factors for monitoring the stability of these compounds.<br />
Verification of the models<br />
To obtain a guava refiner extract with high phenolic <strong>and</strong><br />
flavonoid compounds, the optimal level of extraction<br />
Ó 2010 Institute of Food Science <strong>and</strong> Technology International Journal of Food Science <strong>and</strong> Technology 2010, 45, 1739–1745
1744<br />
Phenolic extraction from guava by-product K.-W. Kong et al.<br />
(a)<br />
Flavonoid content<br />
(mg RE/100 g guava refiner)<br />
(b)<br />
Flavonoid content<br />
(mg RE/100 g guava refiner)<br />
(c)<br />
Flavonoid content<br />
(mg RE/100 g guava refiner)<br />
350<br />
300<br />
250<br />
200<br />
360<br />
300<br />
240<br />
180<br />
60<br />
5.5<br />
4.0<br />
2.5<br />
1.0<br />
40<br />
50<br />
Time (h) Temperature (°C)<br />
300<br />
250<br />
200<br />
150<br />
2 50<br />
4<br />
6<br />
40<br />
pH Temperature (°C)<br />
2<br />
pH<br />
4<br />
Time (h)<br />
Figure 2 Response surface plot showing the effects of extraction (i)<br />
pH, (ii) temperature <strong>and</strong> (iii) time on the flavonoid content of guava<br />
refiner.<br />
parameters was generated based on two single response<br />
variables <strong>and</strong> the two response variables together. Three<br />
optimal conditions were developed for the responses,<br />
which were as follows: a pH of 2 at 60 °C for 5 h for the<br />
phenolic content; a pH of 2 at 60 °C for 1 h for the<br />
flavonoids content; <strong>and</strong> a pH of 2 at 60 °C for 3.2 h for<br />
the responses combination. Under these optimum conditions,<br />
the predicted response values for phenolic <strong>and</strong><br />
flavonoid contents were 336.30 mg GAE per 100 g <strong>and</strong><br />
427.35 mg RE per 100 g, respectively. However, the<br />
predicted values obtained for the combination of both<br />
responses, the phenolic content <strong>and</strong> the flavonoid<br />
6<br />
1.0<br />
2.5<br />
4.0<br />
60<br />
5.5<br />
content were 265 mg GAE per 100 g <strong>and</strong> 363.91 mg<br />
RE per 100 g, respectively.<br />
The experiments were run in accordance with the<br />
recommended optimal conditions for two responses <strong>and</strong><br />
the combined responses. The observed values for phenolic<br />
content <strong>and</strong> flavonoids were 324.84 ± 33.49 mg<br />
GAE per 100 g <strong>and</strong> 316.15 ± 12.77 mg RE per 100 g,<br />
respectively. The combination of both responses<br />
indicated that phenolic <strong>and</strong> flavonoid contents were<br />
238.27 ± 43.46 mg GAE per 100 g <strong>and</strong> 186.89 ±<br />
2.08 mg RE per 100 g, respectively. The response surface<br />
models were verified by comparing the observed values<br />
with the predicted values. No significant difference<br />
(P > 0.05) was found between the experimental <strong>and</strong><br />
predicted values of the phenolic content, but a significant<br />
difference (P < 0.05) was observed between the experimental<br />
<strong>and</strong> predicted flavonoid content. However, in the<br />
combination of responses, only phenolic content did not<br />
exhibit a significant difference between the experimental<br />
<strong>and</strong> predicted values. Therefore, only the phenolic<br />
content model was preferred because of an insufficiency<br />
in the verified model for flavonoid content <strong>and</strong> the<br />
combined responses. Although the models generated for<br />
the flavonoid content <strong>and</strong> the combined responses were<br />
inadequate in predicting the expected values, the optimal<br />
conditions were similar in two parameters at a pH of 2<br />
<strong>and</strong> a temperature of 60 °C.<br />
Conclusion<br />
The RSM was successfully implemented for the optimisation<br />
of phenolic compounds from pink guava puree<br />
by-product. The most efficient set of extraction condition<br />
was a pH of 2 <strong>and</strong> a temperature of 60 °C for 5 h to<br />
achieve the maximum extraction of phenolic content<br />
from the refined pink guava by-product. In terms of<br />
flavonoids, a more selective study is needed to study the<br />
specific extraction conditions for flavonoid components.<br />
Further studies on other higher technologies to assist<br />
extraction <strong>and</strong> increase the recovery of polyphenols<br />
from this guava refinery by-product are also warranted.<br />
Acknowledgments<br />
The authors would like to thank from the Ministry of<br />
Science, Technology <strong>and</strong> Innovation of Malaysia (Project<br />
No. 03-01-04-SF0011) for financial support, the<br />
Golden Hope Food <strong>and</strong> Beverages (M) Sdn. Bhd.<br />
Malaysia for providing the samples, <strong>and</strong> the Universiti<br />
Putra Malaysia for providing the laboratory facilities.<br />
References<br />
Aliakbarian, B., Dehghani, F. & Perego, P. (2009). The effect of citric<br />
acid on the phenolic contents of olive oil. Food Chemistry, 116, 617–<br />
623.<br />
International Journal of Food Science <strong>and</strong> Technology 2010, 45, 1739–1745 Ó 2010 Institute of Food Science <strong>and</strong> Technology
Alothman, M., Bhat, R. & Karim, A.A. (2009). Antioxidant<br />
capacity <strong>and</strong> phenolic content of selected tropical fruits from<br />
Malaysia, extracted with different solvents. Food Chemistry, 115,<br />
785–788.<br />
Amin, I. & Mukhrizah, O. (2006). Antioxidant capacity of methanolic<br />
<strong>and</strong> water extracts prepared from food-processing by-products.<br />
Journal of the Science of Food <strong>and</strong> Agriculture, 86, 778–784.<br />
Ballard, T.S., Mallikarjunan, P., Zhou, K. & O’keefe, S.F. (2009).<br />
Optimizing the extraction of phenolic antioxidants from peanut<br />
skins using response surface methodology. Journal of Agricultural<br />
<strong>and</strong> Food Chemistry, 57, 3064–3072.<br />
Cacace, J.E. & Mazza, G. (2002). Extraction of anthocyanins <strong>and</strong><br />
other phenolics from black currants with sulfured water. Journal of<br />
Agricultural <strong>and</strong> Food Chemistry, 50, 5939–5946.<br />
Chirinos, R., Rogez, H., Campos, D., Pedreschi, R. & Larondelle, Y.<br />
(2007). Optimization of extraction conditions of antioxidant<br />
phenolic compounds from mashua (Tropaeolum tuberosum Ruíz<br />
& Pavón) tubers. Separation <strong>and</strong> Purification Technology, 55, 217–<br />
225.<br />
Jiménez-Escrig, A., Rincón, M., Pulido, R. & Saura-Calixto, F. (2001).<br />
Guava fruit (Psidium guajava L.) as a new source of antioxidant<br />
dietary fiber. Journal of Agricultural <strong>and</strong> Food Chemistry, 49, 5489–<br />
5493.<br />
Karvela, E., Makris, D.P., Kalogeropoulos, N., Karathanos, V.T. &<br />
Kefalas, P. (2009). Factorial design optimisation of grape (Vitis<br />
vinifera) seed polyphenol extraction. European Food Research <strong>and</strong><br />
Technology, 229, 731–742.<br />
Khan, M.K., Abert-Vian, M., Fabiano-Tixier, A.-S., Dangles, O. &<br />
Chemat, F. (2009). Ultrasound-assisted extraction of polyphenols<br />
(flavanone glycosides) from orange (Citrus sinensis L.) peel. Food<br />
Chemistry, 119, 851–858.<br />
Kiassos, E., Mylonaki, S., Makris, D.P. & Kefalas, P. (2009).<br />
Implementation of response surface methodology to optimise<br />
extraction of onion (Allium cepa) solid waste phenolics. Innovative<br />
Food Science <strong>and</strong> Emerging Technologies, 10, 246–252.<br />
Kong, K.W. & Ismail, A. (2010). Lycopene content <strong>and</strong> lipophilic<br />
antioxidant capacity of by-products from Psidium guajava fruits<br />
produced during puree production industry. Food <strong>and</strong> Bioproducts<br />
Processing, doi:10.1016/j.fbp.2010.02.004 (Article in press)<br />
Kong, K.W., Emmy, H.K.I., Azizah, O., Amin, I. & Tan, C.P. (2010a).<br />
Effect of steam blanching on lycopene <strong>and</strong> total phenolics in pink<br />
guava puree industry by-products. International Food Research<br />
Journal, 17, 461–468.<br />
Kong, K.W., Ismail, A., Tan, C.P. & Rajab, N.F. (2010b). Optimization<br />
of oven drying conditions for lycopene content <strong>and</strong> lipophilic<br />
antioxidant capacity in a by-product of the pink guava puree<br />
industry using response surface methodology. LWT-Food Science<br />
<strong>and</strong> Technology, 43, 729–735.<br />
Phenolic extraction from guava by-product K.-W. Kong et al. 1745<br />
Lapornik, B., Prosˇ ek, M. & Wondra, A.G. (2005). Comparison of<br />
extracts prepared from plant by-products using different solvents<br />
<strong>and</strong> extraction time. Journal of Food Engineering, 71, 214–222.<br />
Liyana-Pathirana, C. & Shahidi, F. (2005). Optimization of extraction<br />
of phenolic compounds from wheat using response surface methodology.<br />
Food Chemistry, 93, 47–56.<br />
Madhujith, T. & Shahidi, F. (2006). Optimization of the extraction of<br />
antioxidative constituents of six barley cultivars <strong>and</strong> their antioxidant<br />
properties. Journal of Agricultural <strong>and</strong> Food Chemistry, 54,<br />
8048–8057.<br />
Moure, A., Cruz, J.M., Franco, D. et al. (2001). Natural antioxidants<br />
from residual sources. Food Chemistry, 72, 145–171.<br />
Mylonaki, S., Kiassos, E., Makris, D.P. & Kefalas, P. (2008).<br />
Optimisation of the extraction of olive (Olea europaea) leaf<br />
phenolics using water ⁄ ethanol-based solvent systems <strong>and</strong> response<br />
surface methodology. Analytical <strong>and</strong> Bioanalytical Chemistry, 392,<br />
977–985.<br />
Peschel, W., Sánchez-Rabaneda, F., Diekmann, W. et al. (2006). An<br />
industrial approach in the search of natural antioxidants from<br />
vegetable <strong>and</strong> fruit wastes. Food Chemistry, 97, 137–150.<br />
Prasad, N.K., Yang, B., Zhao, M., Wang, B., Chen, F. & Jiang, Y.<br />
(2009). Effects of high pressure treatment on the extraction yield,<br />
phenolic content <strong>and</strong> antioxidant activity of litchi (Litchi chinensis<br />
Sonn.) fruit pericarp. International Journal of Food Science <strong>and</strong><br />
Technology, 44, 960–966.<br />
Richter, B.E., Jones, B.A., Ezzell, J.L., Porter, N.L., Avdalovic, N. &<br />
Pohl, C. (1996). Accelerated solvent extraction: a technique for<br />
sample preparation. Analytical Chemistry, 68, 1033–1039.<br />
Schieber, A., Stintzing, F.C. & Carle, R. (2001). By-products of plant<br />
food processing as a source of functional compounds-recent<br />
developments. Trends in Food Science <strong>and</strong> Technology, 12, 401–413.<br />
Silva, E.M., Rogez, H. & Larondelle, Y. (2007). Optimization of<br />
extraction of phenolics from Inga edulis leaves using response<br />
surface methodology. Separation <strong>and</strong> Purification Technology, 55,<br />
381–387.<br />
Singleton, V.L. & Rossi, J.A. (1965). Colorimetry of total phenolics<br />
with phosphomolybdic-phosphotungstic acid reagents. American<br />
Journal of Enology <strong>and</strong> Viticulture, 16, 144–158.<br />
Wettasinghe, M. & Shahidi, F. (1999). Evening primrose meal: a<br />
source of natural antioxidants <strong>and</strong> scavenger of hydrogen peroxide<br />
<strong>and</strong> oxygen-derived free radicals. Journal of Agricultural <strong>and</strong> Food<br />
Chemistry, 47, 1801–1812.<br />
Wijngaard, H.H. & Brunton, N. (2010). The optimisation of solidliquid<br />
extraction of antioxidants from apple pomace by response<br />
surface methodology. Journal of Food Engineering, 96, 134–140.<br />
Zhishen, J., Mengcheng, T. & Jianming, W. (1999). The determination<br />
of flavonoid contents in mulberry <strong>and</strong> their scavenging effects on<br />
superoxide radicals. Food Chemistry, 64, 555–559.<br />
Ó 2010 Institute of Food Science <strong>and</strong> Technology International Journal of Food Science <strong>and</strong> Technology 2010, 45, 1739–1745
1746<br />
Original article<br />
Effect of tigernut (Cyperus esculentus) flour addition on the quality<br />
of wheat-based cake<br />
Chiemela Enyinnaya Chinma, 1* Joseph Oneh Abu 2 & Yusuf Aisha Abubakar 1<br />
1 Department of Food Science <strong>and</strong> Nutrition, Federal University of Technology, Minna, Nigeria<br />
2 Department of Food Science <strong>and</strong> Technology, University of Agriculture, Makurdi, Nigeria<br />
(Received 12 March 2010; Accepted in revised form 2 June 2010)<br />
Summary The effect of substituting tigernut flour for wheat flour on the proximate, mineral <strong>and</strong> pasting properties of<br />
the resultant blends <strong>and</strong> cake quality were studied. The proximate composition of flour blends increased with<br />
increasing level of tigernut. Protein increased from 22.30 to 26.93% <strong>and</strong> fat from 4.17 to 7.21% resulting in<br />
an increase in energy value from 342.09 to 390.93 kcal. The pasting properties of the flour blends were<br />
affected significantly (P £ 0.05) by tigernut substitution. Pasting peak time <strong>and</strong> temperature decreased with<br />
increasing level of tigernut. Mineral elements such as iron <strong>and</strong> calcium increased from 3.13 to 4.19 <strong>and</strong> 54.01<br />
to 56.41 (mg 100 g )1 ) respectively, with tigernut substitution. The weight <strong>and</strong> volume of cakes increased with<br />
tigernut level while batter density <strong>and</strong> volume index decreased. Acceptable cakes can be made with up to<br />
30% tigernut flour substitution. Such composite cakes may help in reducing protein energy <strong>and</strong><br />
micronutrient deficiencies.<br />
Keywords Mineral composition pasting, physical <strong>and</strong> sensory properties, proximate, tigernut flour, wheat flour.<br />
Introduction<br />
The current global economic meltdown has partly<br />
resulted in an upsurge in the number of well-informed<br />
consumers who put into consideration the health <strong>and</strong><br />
nutritional benefits of food products they consume. This<br />
has contributed to the stimulation of research into<br />
alternative food crops with functional or health benefits<br />
to be incorporated as composite flour in wheat-based<br />
bakery products.<br />
Tigernut (Cyperus esculentus) is a tuber crop that<br />
belongs to the family Cyperaceae, which is cultivated<br />
throughout the world <strong>and</strong> is widely found in the<br />
northern parts of Nigeria. It has been found to contain<br />
appreciable quantities of the fatty acids; myristic acid,<br />
oleic acid, linoleic acid (Eteshola & Oraedu, 1996).<br />
Tigernuts have been reported as helping in the prevention<br />
of heart attacks <strong>and</strong> thrombosis by enhancing<br />
blood circulation. In addition, tigernuts are believed to<br />
assist in reducing the risk of colon cancer (Anonymous,<br />
2005).<br />
Tigernuts are rich in energy content (starch, fat,<br />
sugars <strong>and</strong> protein), mineral (phosphorus, potassium)<br />
<strong>and</strong> vitamins E <strong>and</strong> C (Anonymous, 2005). According to<br />
Umerie & Enebeli (1997), tigernut is valued for its high<br />
dietary fibre content. Dietary fibre plays an important<br />
*Correspondent: E-mail: chinmachiemela@yahoo.com<br />
International Journal of Food Science <strong>and</strong> Technology 2010, 45, 1746–1752<br />
role in the human health because of the prevention,<br />
reduction <strong>and</strong> treatment of some disease such as<br />
diverticular disease, colorectal cancer, diabetes, obesity<br />
or cardiovascular disease (Escudero & Gonza´lez, 2006).<br />
However, tigernut is toxicologically safe for human<br />
consumption, <strong>and</strong> products such as starch, ice cream,<br />
milk <strong>and</strong> kunnu (a non-alcoholic beverage consumed in<br />
Nigeria) have been prepared using tigernut seed (Umerie<br />
& Obi, 1997; Onovo & Ogaraku, 2007; Belewu &<br />
Abodurin, 2008).<br />
Several flour samples such as African yam bean,<br />
banana <strong>and</strong> chickpea have been incorporated into wheat<br />
flour for cake preparation to provide better overall<br />
essential amino acid balance, combat the world protein<br />
calorie malnutrition problem <strong>and</strong> micronutrient deficiency,<br />
enhance sensory property <strong>and</strong> reduce total<br />
dependence on imported wheat flour (Go´mez et al.,<br />
2008; Alozie et al., 2009; Eke et al., 2009). There is no<br />
research work on the effect of incorporating tigernut<br />
flour in wheat-based cakes. Considering the welldocumented<br />
health benefits of tigernut, substitution of<br />
wheat flour with tigernut flour for cake preparation<br />
might increase the nutritional status of the populace,<br />
reduce over-dependence on imported wheat flour<br />
because wheat cannot be grown in commercial quantity<br />
in Nigeria because of the country’s climatic condition,<br />
save foreign exchange <strong>and</strong> increase the utilisation of<br />
tigernuts in developing countries like Nigeria.<br />
doi:10.1111/j.1365-2621.2010.02334.x<br />
Ó 2010 The Authors. Journal compilation Ó 2010 Institute of Food Science <strong>and</strong> Technology
The objectives of this study were to determine the<br />
effect of substitution of tigernut flour for wheat flour on<br />
proximate composition <strong>and</strong> pasting properties of wheat<br />
<strong>and</strong> tigernut flour blends, <strong>and</strong> to determine the chemical,<br />
physical <strong>and</strong> sensory properties of cakes prepared from<br />
their blends.<br />
Materials <strong>and</strong> methods<br />
Materials<br />
Three kilograms of freshly harvested tigernut seeds <strong>and</strong><br />
three kilograms of wheat flour (Golden Penny) <strong>and</strong><br />
other ingredients were purchased from Minna Central<br />
Market, Minna, Nigeria.<br />
Preparation tigernut flour<br />
Brown tigernut seeds were sorted, winnowed <strong>and</strong><br />
washed using cold tap water, dried at 60 °C in an<br />
air-draft oven (Gallenkamp 300 plus series, Engl<strong>and</strong>)<br />
<strong>and</strong> then ground into flour using attrition mill (Globe P<br />
44, China). The flour samples were passed through a<br />
0.45 mm mesh size sieve. It was then packaged in an air<br />
tight polyethylene bag <strong>and</strong> stored in a plastic container<br />
with lid <strong>and</strong> then stored in a freezer at )18 °C from<br />
where samples were taken for analysis.<br />
Formulation of blends<br />
Wheat <strong>and</strong> tigernut flours were mixed at different<br />
proportions (100: 0%; 90 : 10%; 80 : 20%; 70 : 30%;<br />
60 : 40% <strong>and</strong> 50 : 50%) where 100% wheat flour<br />
served as control. A Kenwood mixer was used for<br />
mixing samples at speed 6 for 5 min to achieve uniform<br />
mixing.<br />
Proportion of ingredients<br />
The proportion of ingredients used consists of flour<br />
(100 g), sugar (62.5 g), margarine (62.5 g), (47.9 g),<br />
baking powder (5.7 g) <strong>and</strong> vanilla essence (three drops)<br />
as described by Akubor (2004).<br />
Preparation of cake<br />
The method of Akubor (2004) was adopted for the<br />
preparation of cake. The margarine <strong>and</strong> sugar were<br />
creamed manually for 2 min in a bowl until soft <strong>and</strong><br />
fluffy. The egg was beaten for 3 min, added to the<br />
mixture <strong>and</strong> mixed manually for 3 min. Flour samples<br />
from various composite blends were separately sieved,<br />
<strong>and</strong> baking powder was then added <strong>and</strong> mixed lightly by<br />
h<strong>and</strong> until soft dough was formed. The dough was<br />
transferred to a greased baking pan <strong>and</strong> baked in a preheated<br />
oven at 200 °C for 30 min.<br />
Effect of tigernut (Cyperus esculentus) flour on wheat-based cake C. E. Chinma et al. 1747<br />
Chemical analysis<br />
Moisture, protein, crude fibre, fat, ash, carbohydrate,<br />
energy <strong>and</strong> mineral contents of flour blends <strong>and</strong> baked<br />
cake samples were determined according to AOAC<br />
(1995).<br />
Determination of pasting properties using rapid visco<br />
analyzer<br />
Pasting parameters was determined using rapid visco<br />
analyzer (RVA) (Newport Scientific Pty Ltd., Warriewood<br />
NSW 2102, Australia). A 2.5 g of starch samples<br />
was weighed into a dried empty canister; then 25 mL of<br />
distilled water was dispensed into the canister containing<br />
the sample. The suspension was thoroughly mixed, <strong>and</strong><br />
the canister was fitted into the RVA. Each suspension<br />
was kept at 50 °C for 1 min <strong>and</strong> then heated up to 95 °C<br />
at 12.2 °C min )1 <strong>and</strong> held for 2.5 min at 95 °C. It was<br />
then cooled to 50 °C at 11.8 °C min ) <strong>and</strong> kept for 2 min<br />
at 50 °C.<br />
Determination of physical properties of cakes<br />
Batter density was determined with a measuring cylinder<br />
<strong>and</strong> expressed as the relation between the weight of<br />
batter <strong>and</strong> the same volume of distilled water. Volume<br />
of cake was determined by seed displacement method as<br />
described by AACC (2000). Volume index of cake<br />
samples was measured according to AACC (2000). In<br />
this method, cake is cut vertically through the centre <strong>and</strong><br />
the heights of the cake sample were measured at three<br />
different points (B, C <strong>and</strong> D) along the cross-sectioned<br />
cakes using the template. According to this method,<br />
volume index was determined by the following formula:<br />
Volume index ¼ B þ C þ D<br />
where C is the height of the cake at the center point, <strong>and</strong><br />
B <strong>and</strong> D are the heights of the cake at the points 2.5 cm<br />
away from the center towards the left <strong>and</strong> right sides of<br />
the cake, respectively. Weight of cake was determined by<br />
weight measurement using the electronic digital balance.<br />
Sensory evaluation<br />
A trained twenty-member panel consisting of students<br />
<strong>and</strong> members of Food Science option, Department of<br />
Animal Production Federal University of Technology,<br />
Minna, Nigeria was selected based on their experience<br />
<strong>and</strong> familiarity with cake for the sensory evaluation.<br />
Cake samples prepared from each flour blend were<br />
presented in coded white plastic plates. The order of<br />
presentation of samples to the panel was r<strong>and</strong>omised.<br />
Tap water was provided to rinse the mouth between<br />
evaluations. The panelists were instructed to evaluate<br />
the coded samples for appearance, crust colour, crumb<br />
Ó 2010 The Authors. Journal compilation Ó 2010 Institute of Food Science <strong>and</strong> Technology International Journal of Food Science <strong>and</strong> Technology 2010
1748<br />
Effect of tigernut (Cyperus esculentus) flour on wheat-based cake C. E. Chinma et al.<br />
colour, crumb grain, texture, aroma <strong>and</strong> overall acceptability.<br />
Each sensory attribute was rated on a 9-point<br />
Hedonic scale (1 = disliked extremely while 9 = liked<br />
extremely).<br />
Statistical analysis<br />
Data were analysed by analysis of variance (Steel &<br />
Torrie, 1980). The difference between mean values was<br />
determined by least significant difference test. Significance<br />
was accepted at 5% probability level.<br />
Results <strong>and</strong> discussion<br />
Proximate composition of flour blends<br />
The result of the proximate composition of flour blends<br />
presented in Table 1 shows that substitution of tigernut<br />
flour for wheat flour in the blends had no significant<br />
(P ‡ 0.05) effect on the moisture content of the composite<br />
blends, which were generally within the safe level<br />
of 10% recommended by St<strong>and</strong>ards Organisation of<br />
Nigeria (SON, 1988) for flour samples. The protein<br />
content of the composite blends was slightly higher than<br />
that of wheat flour owing to the higher protein of<br />
tigernut flour (11.05%) compared to wheat flour<br />
(10.05%). In addition, fat, crude fibre <strong>and</strong> ash content<br />
Table 1 Proximate composition of wheat <strong>and</strong> tigernut flour blends<br />
of the flour blends increased significantly with increasing<br />
level of tigernut flour substitution because of the<br />
addition effect of tigernut flour with higher fat, crude<br />
fibre <strong>and</strong> ash content than 100% wheat flour. On the<br />
other h<strong>and</strong>, substitution of wheat flour by tigernut flour<br />
caused a reduction in carbohydrate content of composite<br />
blends owing to the dilution effect of tigernut flour as<br />
wheat flour had higher carbohydrate content than<br />
tigernut flour.<br />
Pasting properties of flour blends<br />
The pasting properties of wheat <strong>and</strong> tigernut flour<br />
blends are presented in Table 2. The RVA properties<br />
of flour samples showed that wheat-tigernut flour<br />
blends had the highest peak viscosity, trough, breakdown,<br />
final viscosity <strong>and</strong> setback value than wheat<br />
flour. There were significant (P £ 0.05) differences in<br />
peak viscosity, trough, breakdown, final viscosity,<br />
setback <strong>and</strong> pasting temperature among flour blends.<br />
In addition, peak time <strong>and</strong> peak temperature decreased<br />
with increasing level of tigernut flour substitution<br />
possibly indicating a lesser energy requirement owing<br />
to the shortened time <strong>and</strong> temperature required for<br />
spontaneous increase in viscosity during the processing<br />
of the flour blends when compared to wheat flour<br />
alone.<br />
Flour blends<br />
Wheat:Tigernut Moisture (%) Protein (%) Fat (%) Crude fibre (%) Ash (%) Carbohydrate (%)<br />
100:0 (control) 10.05 a ± 0.16 10.19 c ± 0.21 1.37 e ± 0.05 0.94 d ± 0.42 1.03 c ± 0.07 76.42 a ± 1.08<br />
0:100 8.33 c ± 0.18 11.25 a ± 0.56 6.04 a ± 0.85 5.10 a ± 0.04 3.17 a ± 0.11 66.11 f ± 1.75<br />
90:10 8.60 bc ± 0.46 10.43 bc ± 0.02 3.13 d ± 0.30 1.14 d ± 0.03 1.78 b ± 0.12 74.92 b ± 0.84<br />
80:20 8.84 bc ± 0.70 10.59 b ± 0.19 3.35 d ± 0.53 2.03 c ± 0.11 1.94 ab ± 0.34 73.25 c ± 0.51<br />
70:30 8.72 bc ± 0.63 10.77 a ± 0.34 3.82 c ± 0.89 2.99 bc ± 0.5 2.42 ab ± 0.25 71.35 d ± 1.09<br />
60:40 9.18 b ± 0.15 10.85 a ± 0.09 4.46 b ± 1.01 3.30 a ± 0.01 2.65 ab ± 0.13 69.56 e ± 0.97<br />
50:50 9.31 b ± 0.03 10.91 a ± 0.60 4.58 b ± 0.45 3.74 b ± 0.50 2.80 a ± 0.08 68.66 e ± 1.43<br />
Values are means <strong>and</strong> st<strong>and</strong>ard deviation of three determinations (n = 3).<br />
Values followed by different superscript in a column are significantly (P £ 0.05) different from each other.<br />
Table 2 Pasting properties of wheat <strong>and</strong> tigernut flour blends<br />
Blend ratio<br />
Wheat:Tigernut<br />
Peak viscosity<br />
(RVU)<br />
Trough<br />
(RVU)<br />
Breakdown<br />
(RVU)<br />
Final viscosity<br />
(RVU)<br />
Set back<br />
(RVU)<br />
Peak time<br />
(min)<br />
Pasting temperature<br />
(°C)<br />
100:0 (control) 57.10 f ± 0.91 33.47 f ± 0.56 23.63 f ± 0.28 81.23 f ± 0.41 47.76 f ± 0.70 5.81 a ± 0.00 89.1 a ± 0.11<br />
90:10 125.24 e ± 1.22 80.14 e ± 0.34 45.10 e ± 0.61 130.53 e ± 1.07 50.39 e ± 0.51 5.50 a ± 0.00 86.30 b ± 0.32<br />
80.20 141.30 d ± 0.73 83.25 d ± 0.49 58.05 d ± 0.87 138.68 d ± 0.55 55.43 d ± 0.97 5.42 a ± 0.00 85.05 c ± 0.05<br />
70:30 167.92 c ± 0.69 103.97 c ± 1.51 63.95 c ± 1.03 164.53 c ± 0.91 60.56 c ± 1.14 5.33 ab ± 0.00 86.69 b ± 0.40<br />
60:40 182.50 b ± 1.25 110.46 b ± 0.97 72.04 b ± 0.56 184.76 b ± 1.37 74.30 b ± 0.89 5.25 b ± 0.01 83.01 d ± 0.63<br />
50:50 231.63 a ± 2.09 145.29 a ± 1.15 86.34 a ± 0.71 230.37 a ± 1.61 85.08 a ± 0.72 5.17 b ± 0.00 82.94 e ± 0.91<br />
Values are means <strong>and</strong> st<strong>and</strong>ard deviation of three determinations (n = 3).<br />
Values followed by different superscript in a column are significantly (P £ 0.05) different from each other.<br />
International Journal of Food Science <strong>and</strong> Technology 2010 Ó 2010 The Authors. Journal compilation Ó 2010 Institute of Food Science <strong>and</strong> Technology
Peak viscosity is the ability of starch to swell freely<br />
before their physical breakdown (Sanni et al., 2004).<br />
Peak viscosity of the flours increased with increasing<br />
substitution of tigernut flour in the blends. This may be<br />
possibly because of the low amylose <strong>and</strong> phosphorus<br />
contents of tigernut flours as Zaidul et al. (2007) <strong>and</strong><br />
Blennow et al. (2001) found high peak viscosity to be<br />
associated with low amylose <strong>and</strong> low phosphorus<br />
contents in flour <strong>and</strong> starch samples. In addition, high<br />
protein <strong>and</strong> fat contents in food samples are known to<br />
influence pasting properties (Eliasson et al., 1981). In<br />
this study, however, the increases recorded in protein<br />
<strong>and</strong> fat contents with increasing levels of tigernut<br />
substitutions did not seem to influence trough, breakdown,<br />
final viscosity <strong>and</strong> setback value.<br />
The setback values for the flours in general were low<br />
although the values of composite blends were higher<br />
than 100% wheat flour. According to Go´mez et al.<br />
(2008), a low setback value is an indication of softer<br />
crumb. This implies that such composite blends when<br />
used in bakery should produce products with soft<br />
crumb, a desirable attributes in cakes.<br />
Pasting temperature was observed to be higher in<br />
wheat flour than composite blends. The high pasting<br />
temperature of wheat flour when compared to wheattigernut<br />
flour blends indicates the presence of starch that<br />
is highly resistant to swelling. Pasting temperature in the<br />
range 81.00–84.05 °C has been previously reported for<br />
instant yam-breadfruit blends (Adebowale et al., 2008).<br />
The results of pasting properties obtained in this study<br />
are in agreement with the results of Zaidul et al. (2007)<br />
<strong>and</strong> Adebowale et al. (2008).<br />
Proximate composition of cakes<br />
Table 3 shows the proximate composition of cakes<br />
processed from tigernut <strong>and</strong> wheat flour blends. The<br />
addition of tigernut flour to wheat flour increased<br />
the contents of protein from (22.30–26.93%), fat<br />
(4.17–7.21%), crude fibre (3.12–5.79%), ash (1.94–3.81%)<br />
<strong>and</strong> energy value (342.09–390.93 Kcal) while moisture<br />
<strong>and</strong> carbohydrate contents decreased with the addi-<br />
tion of tigernut flour from (14.63–11.20%) <strong>and</strong><br />
(54.58–48.67%), respectively. Moisture in foods facilitates<br />
various reactions, which determine the shelf-life<br />
<strong>and</strong> microbial susceptibility of food products. The<br />
higher moisture content of cakes prepared from composite<br />
blends than 100% wheat flour may be attributed<br />
to high water-binding properties of wheat flour than<br />
tigernut flour.<br />
Increased protein, fat, crude fibre, ash <strong>and</strong> energy<br />
value of cake samples prepared from composite blends<br />
as observed also in flour blends may be because of the<br />
addition effect of tigernut flour. Increase in protein<br />
content with increased tigernut flour in cakes was as a<br />
result of the higher protein content of tigernut flour. In<br />
addition, the increased protein content of the cakes<br />
when compare to the composite flours could have been<br />
because of the added ingredients such as egg during cake<br />
preparation. The moisture, ash <strong>and</strong> protein contents of<br />
cake samples obtained in this study was comparable to<br />
the values of 14.00–14.40% (moisture) <strong>and</strong> 3.70–5.50%<br />
(ash) reported by Alozie et al. (2009) for wheat- African<br />
yam bean cake as well as 11.00–24.70% (protein)<br />
reported by Akubor (2004) for wheat-cowpea cake.<br />
Mineral composition of cakes<br />
Table 3 Proximate composition of cake samples prepared from wheat <strong>and</strong> tigernut flour blends<br />
Blends<br />
Wheat:Tigernut<br />
Moisture<br />
(%)<br />
Protein<br />
(%)<br />
Fat<br />
(%)<br />
The result of mineral compositions of cakes prepared<br />
from wheat <strong>and</strong> tigernut flour blends is presented<br />
in Table 4. Addition of tigernut flour to wheat flour<br />
increased the contents of copper (0.10–0.13 mg 100 g )1 ),<br />
manganese (12.30–64.77 mg 100 g )1 ), iron (3.13–4.19 mg<br />
100 g )1 ), sodium (286.34–335.45 mg 100 g )1 ), calcium<br />
(54.01–56.41 mg 100 g )1 ) in cakes while phosphorus<br />
contents in cakes decreased with the addition of tigernut<br />
flour (308.01–300.00 mg 100 g )1 ). Increase in mineral<br />
contents of cakes as a result of tigernut flour addition to<br />
wheat flour could be attributed to the relatively higher<br />
mineral contents of the former. The importance of these<br />
minerals in human system cannot be over-emphasised.<br />
For instance, calcium helps in bone development <strong>and</strong> its<br />
deficiency can lead to improper development of bone in<br />
growing children leading to various deformities of the<br />
Crude fibre<br />
(%)<br />
Ash<br />
(%)<br />
Carbohydrate<br />
(%)<br />
Energy value<br />
(Kcal)<br />
100:0 (control) 14.63 b ± 0.17 22.30 c ± 0.32 4.17 d ± 0.01 3.12 c ± 0.18 1.94 c ± 0.01 53.84 a ± 0.54 342.09 c ± 1.93<br />
90:10 11.50 a ± 0.30 24.96 b ± 0.16 4.39 c ± 0.67 3.96 c ± 0.02 2.22 c ± 0.01 52.97 b ± 1.27 351.23 b ± 0.55<br />
80:20 11.66 a ± 0.24 25.15 b ± 0.11 5.07 b ± 0.09 4.43 b ± 0.15 2.95 b ± 0.05 50.74 c ± 0.94 349.19 c ± 2.80<br />
70:30 11.79 a ± 0.06 25.74 b ± 0.52 5.92 a ± 0.62 4.81 ab ± 0.43 3.07 b ± 0.01 48.67 d ± 0.73 350.92 a ± 1.12<br />
60:40 11.20 a ± 0.33 26.49 a ± 0.21 6.34 a ± 0.81 5.35 a ± 0.22 3.57 a ± 0.03 52.95 e ± 1.14 374.82 a ± 2.19<br />
50:50 11.84 a ± 0.10 26.93 a ± 0.58 7.21 a ± 0.05 5.79 a ± 0.03 3.81 a ± 0.01 54.58 f ± 2.01 390.93 b ± 0.86<br />
Values are means <strong>and</strong> st<strong>and</strong>ard deviation of three determinations (n = 3).<br />
Values followed by different superscript in a column are significantly (P £ 0.05) different from each other.<br />
Effect of tigernut (Cyperus esculentus) flour on wheat-based cake C. E. Chinma et al. 1749<br />
Ó 2010 The Authors. Journal compilation Ó 2010 Institute of Food Science <strong>and</strong> Technology International Journal of Food Science <strong>and</strong> Technology 2010
1750<br />
Effect of tigernut (Cyperus esculentus) flour on wheat-based cake C. E. Chinma et al.<br />
Table 4 Mineral contents of cakes prepared from wheat <strong>and</strong> tigernut flour blends<br />
Blends<br />
Wheat:Tigernut<br />
Cu<br />
(mg 100 g )1 )<br />
Mn<br />
(mg 100 g )1 )<br />
Fe<br />
(mg 100 g )1 )<br />
skeletal system (Gahlawat & Sehgel, 1993). Calcium<br />
contributes towards bone <strong>and</strong> teeth formation, muscle<br />
contraction <strong>and</strong> blood clotting (Igoe, 1989). Iron is<br />
necessary for the prevention of anaemia, (Igoe, 1989).<br />
Zinc functions as a nutrient <strong>and</strong> dietary supplement <strong>and</strong><br />
is believed to be necessary for nucleic acid metabolism,<br />
protein synthesis <strong>and</strong> cell growth (Igoe, 1989). Phosphorus<br />
is an important mineral associated with calcium in<br />
bone. The calcium ⁄ phosphorus ratio in bone is 2:1. The<br />
imbalance of these minerals may lead to bone disorder<br />
known as osteoporosis, which is a major public health<br />
problem, as it may cause serious complication leading to<br />
incapacitation <strong>and</strong> requiring costly medical care (Spencer<br />
& Karmer, 1988). Manganese functions as a nutrient <strong>and</strong><br />
dietary supplement. It is needed in a very small amount<br />
(Robinson, 1973).<br />
The values of manganese, iron, phosphorus, calcium<br />
<strong>and</strong> sodium values obtained in this study were<br />
higher than manganese (14.60–16.30 mg 100 g )1 ), iron<br />
(0.61–2.21 mg 100 g )1 ), phosphorus (119.50–300.00 mg<br />
100 g )1 ), calcium (8.50–18.30 mg 100 g )1 ) <strong>and</strong> sodium<br />
(246.00–306.00 mg 100 g )1 ) reported by Eke et al.<br />
(2008) for some Nigerian cakes. The result of mineral<br />
contents of cakes indicates that cakes prepared from<br />
wheat-tigernut flour blends contain appreciable levels of<br />
minerals <strong>and</strong> could contribute to mineral intake of<br />
consumers.<br />
Physical properties of batter <strong>and</strong> cakes<br />
The physical properties of batter <strong>and</strong> cakes prepared<br />
from wheat-tigernut flour blend are presented in<br />
Table 5. The weight (31.25–33.58 g) <strong>and</strong> volume<br />
(232.60–242.43 cm 3 ) of tigernut flour supplemented cake<br />
increased, whereas batter density <strong>and</strong> volume index of<br />
cakes decreased from (0.98–0.84) <strong>and</strong> 107.69–86.35)<br />
with increasing level of tigernut flour. Increase in weight<br />
<strong>and</strong> volume of cakes with increasing the level of tigernut<br />
flour in wheat flour may be attributed to low batter<br />
density or increased bulk density of flour blends because<br />
of high bulk density of tigernut flour. This is in line with<br />
the earlier report of Chinma et al. (2007) that weight<br />
Mg<br />
(mg 100 g )1 )<br />
Table 5 Physical properties of batter <strong>and</strong> cakes<br />
Blend<br />
Wheat:<br />
Tigernut<br />
Batter<br />
density<br />
Na<br />
(mg 100 g )1 )<br />
Cake<br />
weight<br />
(g)<br />
<strong>and</strong> volume of snack products depends on bulk density<br />
of the flour blends in the product. Also, increased water<br />
retention in cakes as a result of increasing level of<br />
tigernut flour substitution may be responsible for such<br />
increase in weight of cake samples while high peak<br />
viscosity in composite blends could be responsible for<br />
high gas retention <strong>and</strong> high expansion of the product<br />
resulting to an increase in cake volume. Such cakes that<br />
are heavier with large volume attributes will be desirable<br />
by consumers because cake products with increased<br />
volume <strong>and</strong> weight are preferred. The decrease in batter<br />
density may be because of the fact that increasing the<br />
level of tigernut flour decreased air incorporation in the<br />
batter. Similar observation has been reported by Go´mez<br />
et al. (2008) for wheat-chickpea cake.<br />
Sensory properties of cakes<br />
Ca<br />
(mg 100 g )1 )<br />
Cake<br />
volume<br />
(cm 3 )<br />
P<br />
(mg 100 g )1 )<br />
100:0 (control) 0.10 b ± 0.17 12.30 c ± 0.32 3.13 c ± 0.01 60.09 f ± 0.18 286.34 f ± 0.01 54.01 c ± 0.54 308.01 a ± 1.93<br />
90:10 0.10 a ± 0.30 19.51 b ± 0.16 3.22 b ± 0.05 83.65 e ± 0.02 302.11 e ± 0.01 55.19 b ± 1.27 303.07 d ± 0.55<br />
80:20 0.12 a ± 0.24 27.75 b ± 0.11 3.47 b ± 0.01 104.09 d ± 0.15 316.05 d ± 0.05 55.42 b ± 0.94 305.90 c ± 2.80<br />
70:30 0..14 a ± 0.06 42.04 b ± 0.52 3.68 b ± 0.12 118.82 c ± 0.43 323.10 c ± 0.01 55.80 b ± 0.73 300.00 a ± 1.12<br />
60:40 0.14 a ± 0.33 55.50 a ± 0.21 3.92 a ± 0.10 135.13 b ± 0.22 335.45 a ± 0.03 55.97 b ± 1.14 306.40 b ± 2.19<br />
50:50 0.13 a ± 0.10 64.77 a ± 0.58 4.19 a ± 0.05 152.46 a ± 0.03 328.81 b ± 0.01 56.41 a ± 2.01 303.67 d ± 0.86<br />
Values are means <strong>and</strong> st<strong>and</strong>ard deviation of three determinations (n = 3).<br />
Values followed by different superscript in a column are significantly (P £ 0.05) different from each other.<br />
Cake<br />
volume<br />
index<br />
100:0<br />
(control)<br />
0.98 a ± 0.01 31.25 c ± 0.01 232.60 e ± 0.34 107.69 a ± 0.05<br />
90:10 0.96 a ± 0.01 31.79 bc ± 0.14 236.35 d ± 0.09 94.52 b ± 0.01<br />
80:20 0.93 a ± 0.00 32.25 b ± 0.05 240.17 c ± 1.15 86.55 d ± 0.01<br />
70:30 0.90 a ± 0.00 32.60 b ± 0.01 241.84 b ± 0.78 88.01 c ± 0.05<br />
60:40 0.87 a ± 0.05 32.41 b ± 0.36 241.79 b ± 0.05 86.35 d ± 0.01<br />
50:50 0.84 a ± 0.01 33.58 a ± 0.01 242.43 a ± 1.64 88.84 c ± 0.03<br />
Values are means <strong>and</strong> st<strong>and</strong>ard deviation of three determinations (n = 3).<br />
Values followed by different superscript in a column are significantly<br />
(P £ 0.05) different from each other.<br />
Table 6 shows the sensory properties of cakes. Crust<br />
colour of cake samples increased with increasing level of<br />
tigernut flour substitution. There was no significant<br />
(P ‡ 0.05) difference in crust colour between control<br />
sample cake <strong>and</strong> cakes prepared from composite blend<br />
from 20% tigernut flour substitution. The crust colour<br />
of cakes is usually a result of the Maillard reactions<br />
between sugars <strong>and</strong> amino acids, <strong>and</strong> the caramelisation<br />
International Journal of Food Science <strong>and</strong> Technology 2010 Ó 2010 The Authors. Journal compilation Ó 2010 Institute of Food Science <strong>and</strong> Technology
Table 6 Sensory properties of cakes prepared from wheat <strong>and</strong> tigernut<br />
flour blends<br />
Blend<br />
Wheat:<br />
Tigernut<br />
Crust<br />
colour<br />
100:0 (control) 7.5 a<br />
90:10 5.9 bc<br />
80:20 6.1 b<br />
70:30 6.4 b<br />
60:40 6.9 b<br />
50:50 7.1 a<br />
Crumb<br />
colour<br />
7.2 a<br />
6.8 a<br />
7.1 a<br />
7.0 a<br />
6.9 a<br />
7.0 a<br />
Crumb<br />
grain Texture Aroma<br />
6.7 a<br />
6.5 a<br />
6.0 a<br />
6.1 a<br />
5.7 b<br />
5.4 b<br />
6.0 a<br />
5.9 a<br />
6.2 a<br />
6.2 a<br />
6.0 a<br />
6.0 a<br />
7.0 a<br />
5.9 b<br />
6.8 a<br />
7.3 a<br />
7.3 a<br />
7.0 a<br />
Overall<br />
acceptability<br />
7.4 a<br />
7.0 a<br />
7.1 a<br />
7.2 a<br />
7.2 a<br />
7.4 a<br />
Mean value of twenty-member panelist.<br />
Values followed by different superscript in a column are significantly<br />
(P £ 0.05) different from each other.<br />
process of sugars during the baking process. Increasing<br />
crust <strong>and</strong> crumb colour of cake observed as the level of<br />
tigernut flour substitution in wheat flour increased may<br />
be attributed to the high protein content of the<br />
composite flours compared to the wheat flour.<br />
Crumb colour scores showed no significant (P ‡ 0.05)<br />
difference among samples. The crumb colour score<br />
increased slightly with increasing level of tigernut flour<br />
substitution. Crumb of baked products such as cakes<br />
<strong>and</strong> bread are not exposed to temperatures above<br />
100 °C which implies that Maillard or browning reaction<br />
may not take place at such temperatures. On this<br />
basis, it means that the slight increase in crumb colour in<br />
composite cakes with increasing tigernut substitution<br />
may be mainly because of the colour of the tigernut<br />
interactions of added ingredients. The crumb grains of<br />
100% wheat cake compared favourably with composite<br />
cakes at up to 30% tigernut flour substitution. Significant<br />
difference (P £ 0.05) was recorded in crumb grain<br />
of cakes prepared with up to 40% <strong>and</strong> 50% tigernut<br />
flour substituted flour. However, these blends showed<br />
significant (P £ 0.05) difference in crumb grain with<br />
other cake samples. Crumb grain score of 100% wheat<br />
cake was higher than cakes prepared from composite<br />
flour blends <strong>and</strong> decreased as the level of tigernut flour<br />
substitution in wheat flour increased. This could be<br />
attributed to high particle size of tigernut flour than<br />
wheat flour, which became pronounced as the level<br />
(from 40%) of tigernut substitution increases in the<br />
blend.<br />
Texture of cake improved with tigernut flour substitution.<br />
The increase in texture scores for cakes with<br />
increasing level of tigernut flour substitution in wheat<br />
flour could be because of the higher crude fibre content<br />
of tigernut flour.<br />
The aroma of cakes increased with increasing level of<br />
tigernut flour. Food aroma is usually associated with the<br />
interaction of flavour compounds when food products<br />
are subjected to high temperatures.<br />
Effect of tigernut (Cyperus esculentus) flour on wheat-based cake C. E. Chinma et al. 1751<br />
There were no significant (P ‡ 0.05) differences in<br />
overall acceptability among samples. However, when<br />
other sensory parameters are put into consideration,<br />
cakes prepared from 70:30 (wheat:tigernut) flour blend<br />
showed higher scores in all the sensory parameters<br />
evaluated by panelists Overall, 70:30 (wheat: tigernut)<br />
flour blend enjoyed high sensory score in all sensory<br />
parameters evaluated <strong>and</strong> compared favourably with<br />
100% wheat cake.<br />
Conclusions<br />
It can be inferred from this study that substitution of<br />
tigernut flour in wheat flour for cake preparation is<br />
possible. The proximate, mineral <strong>and</strong> pasting properties<br />
of wheat flour improved as a result of tigernut flour<br />
substitution. Cakes prepared from such composite flours<br />
could help in reducing protein energy <strong>and</strong> micronutrient<br />
deficiency prevalent in developing countries such as<br />
Nigeria.<br />
References<br />
AACC. (2000). Approved methods of the American Association of<br />
Cereal Chemists, method 10 91, 10th edn. St. Paul, MN: American<br />
Association of Cereal Chemists, Inc.<br />
Adebowale, A.A., Sanni, S.A. & Oladapo, F.O. (2008). Chemical,<br />
functional <strong>and</strong> sensory properties of instant yam-bread fruit flour.<br />
Nigerian Food Journal, 26, 2–12.<br />
Akubor, P.I. (2004). Protein contents, physical <strong>and</strong> sensory properties<br />
of Nigerian snack food (cake, Chin-chin <strong>and</strong> puff-puff) prepared<br />
from cowpea-wheat flour blends. International Journal of Food<br />
Science <strong>and</strong> Technology, 39, 419–424.<br />
Alozie, Y.A., Udofia, S., Lawal, O. & Ani, I.F. (2009). Nutrient<br />
composition <strong>and</strong> sensory properties of cakes made from wheat <strong>and</strong><br />
African yam bean flour blends. Journal of Food Technology, 7, 115–<br />
118.<br />
Anonymous (2005). Tigernut <strong>and</strong> health. Available at: http://www.<br />
tigernut.com/salud.html (last accessed 4th June 2009).<br />
AOAC (1995). Official Methods of Analysis, 16th edn. Washington<br />
DC.: Association of official analytical chemist.<br />
Belewu, M.A. & Abodurin, O.A. (2008). Preparation of kunu from<br />
unexploited rich source tigernut. Pakistan Journal of Nutrition, 7,<br />
109–111.<br />
Blennow, A., Bay-Smidt, A.M. & Bauer, R. (2001). Amylopectin<br />
aggregation as a function of starch phosphate content studied by<br />
size exclusion chromatography <strong>and</strong> on-line refractive index <strong>and</strong> light<br />
scattering. International Journal of Biological Macromolecules, 28,<br />
409–420.<br />
Chinma, C.E., Ingbian, E.K. & Akpapunam, M.A. (2007). Processing<br />
<strong>and</strong> acceptability of fried cassava balls (‘‘Akara-akpu’’) supplemented<br />
with melon <strong>and</strong> soyabean flour. Journal of Food Processing<br />
<strong>and</strong> Preservation, 31, 143–156.<br />
Eke, J., Achinewhu, S.C. & Sanni, L. (2008). Nutritional <strong>and</strong><br />
sensory qualities of some Nigerian cakes. Nigerian Food Journal,<br />
26, 12–17.<br />
Eke, J., Sanni, S.A. & Owuno, F. (2009). Proximate <strong>and</strong> sensory<br />
properties of banana cakes. Nigerian Food Journal, 27, 102–106.<br />
Eliasson, A.C., Carlson, T.L.-G., Larsson, K. & Miezis, Y. (1981).<br />
Some effects of starch lipids on the thermal <strong>and</strong> rheological<br />
properties of wheat starch. Starch ⁄ Starke, 33, 130–134.<br />
Escudero, E. & González, P. (2006). La fibra diete¢tica. Nutricio¢<br />
Hospitalaria, 21, 61–72.<br />
Ó 2010 The Authors. Journal compilation Ó 2010 Institute of Food Science <strong>and</strong> Technology International Journal of Food Science <strong>and</strong> Technology 2010
1752<br />
Effect of tigernut (Cyperus esculentus) flour on wheat-based cake C. E. Chinma et al.<br />
Eteshola, E. & Oraedu, A.C.I. (1996). Fatty acids composition of<br />
Tigernut tubers (Cyperus esculentus L.), baobab seeds (Adansonia<br />
digitata L.) <strong>and</strong> their mixtures. Journal of the American Oil Chemists<br />
Society, 73, 255–267.<br />
Gahlawat, P. & Sehgel, S. (1993). The influence of roasting <strong>and</strong><br />
malting on the total <strong>and</strong> extractable mineral contents of human<br />
weaning mixtures prepared from Indian raw materials. Food<br />
Chemistry, 46, 253–256.<br />
Go´mez, M., Oliete, B., Rosell, C.M., P<strong>and</strong>o, V. & Fernández, E.<br />
(2008). Studies on cake quality made of wheat-chickpea flour blends.<br />
LWT-Food Science <strong>and</strong> Technology, 41, 1701–1709.<br />
Igoe, R.S. (1989). Dictionary of Food Ingredients. New York: Vas Nost<br />
<strong>and</strong> Reinhoed.<br />
Onovo, J.C. & Ogaraku, A.O. (2007). Studies on some microorganisms<br />
associated with exposed tigernut milk. Journal of Biological Science,<br />
7, 1548–1550.<br />
Robinson, C.H. (1973). Fundamentals of Normal Nutrition, 2nd edn.<br />
New York: London Collier Macmillan Publishers.<br />
Sanni, L.O., Kosoko, S.B., Adebowale, A.A. & Adeoye, R.J. (2004).<br />
The influence of palm oil <strong>and</strong> chemical modification on the pasting<br />
<strong>and</strong> sensory properties of fufu flour. International Journal of Food<br />
properties, 7, 229–237.<br />
Spencer, H. & Karmer, L. (1988). Calcium, phosphorus <strong>and</strong> fluoride.<br />
In: Trace Minerals in Foods (edited by K.T. Smith). Pp. 40–46. New<br />
York <strong>and</strong> Basel: Marcel <strong>and</strong> Dekker, Inc.<br />
St<strong>and</strong>ard Organization of Nigeria (SON) (1988). Nigerian Industrial<br />
st<strong>and</strong>ard for gari. 188–189.<br />
Steel, R.D.G. & Torrie, J.H. (1980). Principle <strong>and</strong> Procedures of<br />
Statistics. A Biometrical Approach, 2nd edn. P. 623. New York:<br />
McGraw Hill Co.<br />
Umerie, S.C. & Enebeli, J.N. (1997). Malt caramel from the nuts of<br />
Cyperus esculentus. Journal of Bioresource Technology, 52, 215–<br />
216.<br />
Umerie, S.C. & Obi, N.A.N. (1997). Short communication: isolation<br />
<strong>and</strong> characterization of starch from Cyperus esculentus tubers.<br />
Journal of Bioresource Technology, 62, 63–65.<br />
Zaidul, I.S.M., Yamauchi, H., Kim, S.J., Hashimoto, N. & Noda, T.<br />
(2007). RVA study of mixtures of wheat flour <strong>and</strong> potato starches<br />
with different phosphorus content. Food Chemistry, 102, 1105–<br />
1111.<br />
International Journal of Food Science <strong>and</strong> Technology 2010 Ó 2010 The Authors. Journal compilation Ó 2010 Institute of Food Science <strong>and</strong> Technology
International Journal of Food Science <strong>and</strong> Technology 2010, 45, 1753–1754 1753<br />
Book review<br />
The obesity epidemic <strong>and</strong> its management<br />
By T. Maguire, D. Haslam<br />
London, UK: Pharmaceutical Press, 2010.<br />
ISBN-978-0-85369-786-2; Price: £29.99.<br />
The book, entitled The Obesity Epidemic <strong>and</strong> its Management<br />
(264 pp) is aimed at primary healthcare<br />
professionals <strong>and</strong> provides a basic underst<strong>and</strong>ing of<br />
obesity, explaining why it is a major public health<br />
problem. This underst<strong>and</strong>ing will assist primary healthcare<br />
workers in supporting their patients <strong>and</strong> clients to<br />
make healthier choices in their daily lives <strong>and</strong> modify<br />
their lifestyles. The book covers all aspects of the obesity<br />
<strong>and</strong> the components of its management. It is broadly<br />
divided into two parts; Part 1 states the problem <strong>and</strong><br />
Part 2 considers some solutions.<br />
Part 1 discusses the background <strong>and</strong> epidemiology<br />
of obesity. This section approaches obesity as a public<br />
health problem <strong>and</strong> addresses the different aspects of<br />
the problem in six chapters. Chapter 1 introduces the<br />
problem using current epidemiological data <strong>and</strong><br />
explains why it has become such a major public<br />
health crisis over the last 30 years. Chapter 2 considers<br />
the definitions of obesity <strong>and</strong> the measurements<br />
used to define the problem. The use of anthropometrical<br />
<strong>and</strong> clinical measurements at different age groups<br />
is discussed to show how effective these measurements<br />
are in practice. Chapter 3 explains the medical <strong>and</strong><br />
social impacts of obesity <strong>and</strong> its burden using the<br />
robust data. Since obesity is accepted as an independent<br />
risk factor for major diseases such as coronary<br />
heart disease, type 2 diabetes mellitus <strong>and</strong> cancers, the<br />
chapter covers the explanations about all these medical<br />
conditions. Chapter 4 discusses the complex<br />
relationship between nutrition, exercise, food politics<br />
<strong>and</strong> public health. The chapter gives a short history of<br />
food policy <strong>and</strong> politics of food. Food labelling is<br />
suggested as an effective solution in making healthy<br />
choices. In Chapter 5, the metabolic basis of nutrition<br />
is explained to provide a background to underst<strong>and</strong>ing<br />
of what constitutes a healthy diet. Carbohydrates,<br />
proteins, fats <strong>and</strong> cholesterol are described, <strong>and</strong> the<br />
metabolic processes of these nutrients are given<br />
briefly. The science of appetite regulation, especially<br />
with regard to obesity is discussed in Chapter 6. The<br />
discussion covers physiological <strong>and</strong> genetic factors<br />
which can influence hunger, appetite <strong>and</strong> satiety. The<br />
role of FTO gene is explained as a part of genetic<br />
factors. The physiological factors cover strong <strong>and</strong><br />
weak signals of meal initiation, maintenance of eating<br />
<strong>and</strong> meal ending. The roles of endocannabinoid<br />
doi:10.1111/j.1365-2621.2010.02287.x<br />
Ó 2010 The Author. Journal compilation Ó 2010 Institute of Food Science <strong>and</strong> Technology<br />
system, cholecystokinin <strong>and</strong> leptin are discussed in<br />
detail.<br />
Part 2 focuses on the approaches to the management<br />
of obesity, including various psychological,<br />
pharmacological <strong>and</strong> surgical interventions, <strong>and</strong> examines<br />
evidence of their effectiveness. Chapter 7 is the<br />
first chapter of Part 2 <strong>and</strong> addresses the developing<br />
public-health-based approach to support people who<br />
are already overweight or obese, <strong>and</strong> to stop normalweight<br />
individuals becoming overweight or obese<br />
in the future. The chapter discusses public health<br />
campaigns as a part of the management <strong>and</strong> gives<br />
‘Five-a-day’ <strong>and</strong> ‘Change4Life’ as examples. In addition<br />
to campaigns, it also enlightens the spectrum of<br />
services offered that address the obesity problem. This<br />
includes obesity management services <strong>and</strong> primary<br />
care based programmes. The topic of Chapter 8 is<br />
behavioural modification techniques. The chapter<br />
describes the role of behavioural interventions in<br />
weight management <strong>and</strong> explains effective techniques<br />
which are used in one-to-one intervention or in a<br />
group context. Chapter 9 focuses on physical activity<br />
<strong>and</strong> exercise as a part of intervention <strong>and</strong> explains the<br />
exercise patterns <strong>and</strong> types of activities in detail. The<br />
chapter also includes practical tips for avoiding injury<br />
<strong>and</strong> keeping up the exercise. The topics of Chapter 10<br />
are nutrition <strong>and</strong> diet. The chapter considers the key<br />
components of a healthy diet in a general manner,<br />
<strong>and</strong> explains starvation diets, food energy, vitamins<br />
<strong>and</strong> minerals. It also provides the links of websites<br />
which gives nutritional guidance for pharmacists. The<br />
pharmacological interventions are covered in Chapter<br />
11. The chapter firstly explains who should use<br />
pharmacotherapy <strong>and</strong> then discusses the anti-obesity<br />
agents <strong>and</strong> other pharmacological agents. The two<br />
currently licensed anti-obesity agents, orlistat <strong>and</strong><br />
sibutramine, <strong>and</strong> rimonabant are discussed in detail<br />
using the NICE guidance. Metformin, topiramate,<br />
tesofensine <strong>and</strong> lorcaserin are also given under the<br />
title of other pharmacological agents. Chapter 12<br />
covers the surgical management of obesity <strong>and</strong><br />
describes the surgical procedures intended to induce<br />
weight loss. Firstly, the patients who are eligible for<br />
bariatric surgery are described, <strong>and</strong> then the procedures,<br />
gastric b<strong>and</strong>ing, gastric bypass surgery, biliopancreatic<br />
diversion <strong>and</strong> sleeve gastrectomy, are<br />
discussed. The chapter also includes the role of<br />
primary care <strong>and</strong> pharmacy for surgery <strong>and</strong> explains<br />
the process after surgery. Chapter 13 covers fad diets<br />
<strong>and</strong> considers the facts behind the failure of many<br />
commercial diets to support sustainable weight loss.
1754<br />
Book review<br />
Atkins Diet, South Beach Diet, Ornish Diet, Zone<br />
Diet <strong>and</strong> F-Plan Diet are some of the diets discussed<br />
in this chapter. Besides fad diets, the chapter describes<br />
the ideal diet <strong>and</strong> explains the importance of the diet<br />
quality. Chapter 14, ‘Over-the-counter slimming aids’,<br />
covers the dietary slimming aids. Firstly, historical<br />
background of the use of these aids is given, <strong>and</strong><br />
evidence for the efficiency of slimming aids is discussed.<br />
Ephedra sinica, chitosan, hoodia gordanii,<br />
chromium picolinate, L-carnitine, green tea, conjuagated<br />
linoleic acid, hydroxycitric acid, herbal diuretics,<br />
lecithin, guarana <strong>and</strong> yerba mate, hydroxmethylbutyrate,<br />
5-hydroxytryptophan, pyruvate <strong>and</strong> orlistat are<br />
discussed in detail. The chapter points the huge<br />
market for a range of over-the-counter slimming aids<br />
sold in the US <strong>and</strong> in Europe, mainly through<br />
pharmacies <strong>and</strong> health stores, <strong>and</strong> also draws attention<br />
on the role of pharmacists in the market.<br />
In summary, the book is a very useful resource for<br />
healthcare professionals providing a basic underst<strong>and</strong>ing<br />
of the background <strong>and</strong> management of obesity. It is<br />
well-structured <strong>and</strong> well-written by two knowledgeable<br />
<strong>and</strong> experienced authors. It offers an approachable <strong>and</strong><br />
easy reading introduction to all aspects of the obesity.<br />
The Obesity Epidemic <strong>and</strong> its Management can be<br />
recommended as a source book for intermediate classes<br />
in clinical <strong>and</strong> public health nutrition as well as a<br />
reference for researchers <strong>and</strong> academicians.<br />
Dr Zehra Buyuktuncer<br />
Lecturer in Nutrition <strong>and</strong> Dietetics,<br />
Department of Biological Sciences,<br />
University of Chester, Parkgate Road,<br />
Chester CH1 4BJ, UK<br />
E-mail: zehra.buyuktuncer@chester.ac.uk<br />
International Journal of Food Science <strong>and</strong> Technology 2010 Ó 2010 The Author. Journal compilation Ó 2010 Institute of Food Science <strong>and</strong> Technology


