Research Article - International Journal of Pharmaceutical Sciences ...
Research Article - International Journal of Pharmaceutical Sciences ...
Research Article - International Journal of Pharmaceutical Sciences ...

Create successful ePaper yourself
Turn your PDF publications into a flip-book with our unique Google optimized e-Paper software.
Volume 8, Issue 2, May – June 2011; <strong>Article</strong>-004 ISSN 0976 – 044X<br />
<strong>Research</strong> <strong>Article</strong><br />
SPECTROPHOTOMETRIC SIMULTANEOUS ANALYSIS OF AMBROXOL HYDROCHLORIDE, GUAIFENESIN<br />
AND TERBUTALINE SULPHATE IN LIQUID DOSAGE FORM (SYRUP)<br />
Ritu Kimbahune*, Sunil K, Prachi Kabra, Kuldeep Delvadiya, Sanjay Surani<br />
Department <strong>of</strong> Quality Assurance, Nargund College <strong>of</strong> Pharmacy, Dattatreyanagar, Bangalore - 560 085, India.<br />
Accepted on: 06-03-2011; Finalized on: 28-05-2011.<br />
ABSTRACT<br />
This study proposes a method for simultaneous estimation <strong>of</strong> Ambroxol HCl, Guaifenesin and Terbutaline sulphate in syrup form.<br />
The study was done by combining three spectrophotometric methods viz use <strong>of</strong> specific absorbance [A 1%, 1cm], second order<br />
derivative and colorimetry. Absorption <strong>of</strong> Guaifenesin and Terbutaline sulphate were found to be zero at 307.5nm, thus enabling the<br />
measurement <strong>of</strong> Ambroxol HCl, using specific absorbance in zero order spectrum. Applying the second order derivative, the<br />
amplitude <strong>of</strong> Guaifenesin was measured at 279.4nm, while Ambroxol HCl and Terbutaline sulphate were at zero cross point. For<br />
colorimetric measurement <strong>of</strong> Terbutaline Sulphate, a colored substance was obtained by coupling the oxidized product <strong>of</strong><br />
Terbutaline sulphate with 4-aminoantipyrine and its absorption was measured at 550nm. The proposed method was statistically<br />
validated in accordance with ICH guidelines and results were found to be satisfactory for accuracy, precision and specificity.<br />
Keywords: Ambroxol HCl, Guaifenesin and Terbutaline sulphate, second order derivative, colorimetric method.<br />
INTRODUCTION<br />
Ambroxol hydrochloride (AB) [trans-4-[(2-amino-3,5dibromobenzyl)amino]cyclohexanol<br />
hydrochloride] is a<br />
semi-synthetic derivative <strong>of</strong> vasicine obtained from Indian<br />
shrub Adhatodavasica. It is a metabolic product <strong>of</strong><br />
bromhexine and possesses mucokinetic (improvement in<br />
mucus transport) and secretolytic (liquifies secretions)<br />
properties. It promotes the removal <strong>of</strong> tenacious<br />
secretions in the respiratory tract and reduces mucus<br />
stasis (arresting the secretion <strong>of</strong> mucus) 1 . Guaifenesin<br />
(GF), (RS)-3-(2-methoxyphenoxy) propane-1, 2-diol<br />
reportedly increases the volume and reduces the<br />
viscosity <strong>of</strong> tenacious sputum 2 . Terbutaline sulfate (TBS)<br />
[(tert-butylamino) methyl]-3, 5-dihydroxybenzyl alcohol<br />
sulfate is a synthetic 2-adrenoceptor which<br />
predominantly stimulates β2-receptors and is used as a<br />
bronchodilator in the treatment <strong>of</strong> bronchial asthma 3 .<br />
The above combination is indicated for clinical relief <strong>of</strong><br />
cough associated with bronchitis, bronchial asthma,<br />
emphysema and other bronchopulmonary disorders<br />
where bronchospasm, mucous plugging and problems <strong>of</strong><br />
expectoration co-exist.<br />
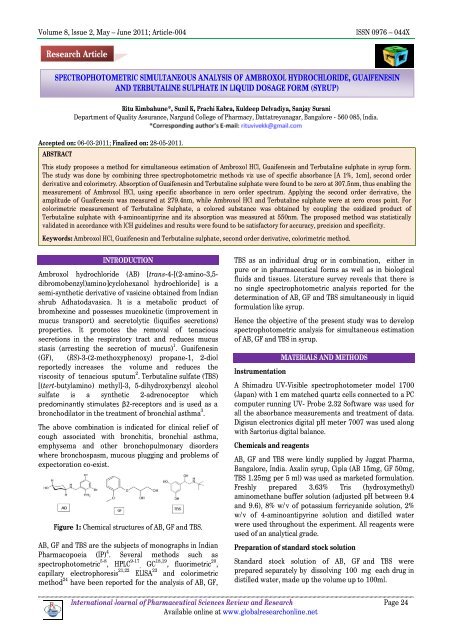
Figure 1: Chemical structures <strong>of</strong> AB, GF and TBS.<br />
AB, GF and TBS are the subjects <strong>of</strong> monographs in Indian<br />
Pharmacopoeia (IP) 4 . Several methods such as<br />
spectrophotometric 5-8 , HPLC 9-17<br />
, GC 18,19 , fluorimetric 20 ,<br />
capillary electrophoresis 21,22 ELISA 23 and colorimetric<br />
method 24 have been reported for the analysis <strong>of</strong> AB, GF,<br />
TBS as an individual drug or in combination, either in<br />
pure or in pharmaceutical forms as well as in biological<br />
fluids and tissues. Literature survey reveals that there is<br />
no single spectrophotometric analysis reported for the<br />
determination <strong>of</strong> AB, GF and TBS simultaneously in liquid<br />
formulation like syrup.<br />
Hence the objective <strong>of</strong> the present study was to develop<br />
spectrophotometric analysis for simultaneous estimation<br />
<strong>of</strong> AB, GF and TBS in syrup.<br />
Instrumentation<br />
MATERIALS AND METHODS<br />
A Shimadzu UV-Visible spectrophotometer model 1700<br />
(Japan) with 1 cm matched quartz cells connected to a PC<br />
computer running UV- Probe 2.32 S<strong>of</strong>tware was used for<br />
all the absorbance measurements and treatment <strong>of</strong> data.<br />
Digisun electronics digital pH meter 7007 was used along<br />
with Sartorius digital balance.<br />
Chemicals and reagents<br />
AB, GF and TBS were kindly supplied by Juggat Pharma,<br />
Bangalore, India. Axalin syrup, Cipla (AB 15mg, GF 50mg,<br />
TBS 1.25mg per 5 ml) was used as marketed formulation.<br />
Freshly prepared 3.63% Tris (hydroxymethyl)<br />
aminomethane buffer solution (adjusted pH between 9.4<br />
and 9.6), 8% w/v <strong>of</strong> potassium ferricyanide solution, 2%<br />
w/v <strong>of</strong> 4-aminoantipyrine solution and distilled water<br />
were used throughout the experiment. All reagents were<br />
used <strong>of</strong> an analytical grade.<br />
Preparation <strong>of</strong> standard stock solution<br />
Standard stock solution <strong>of</strong> AB, GF and TBS were<br />
prepared separately by dissolving 100 mg each drug in<br />
distilled water, made up the volume up to 100ml.<br />
<strong>International</strong> <strong>Journal</strong> <strong>of</strong> <strong>Pharmaceutical</strong> <strong>Sciences</strong> Review and <strong>Research</strong> Page 24<br />
Available online at www.globalresearchonline.net
Volume 8, Issue 2, May – June 2011; <strong>Article</strong>-004 ISSN 0976 – 044X<br />
Determination <strong>of</strong> wavelengths <strong>of</strong> absorbance<br />
The stock solutions <strong>of</strong> AB, GF and TBS were further<br />
diluted with distilled water to get concentration <strong>of</strong><br />
30µg/ml. These solutions were scanned in the range 200-<br />
400nm.<br />
Figure 2: Overlay <strong>of</strong> AB, GF, TBS<br />
Preparation <strong>of</strong> calibration curve<br />
The stock solution <strong>of</strong> AB was appropriately diluted<br />
with distilled water to obtain concentration range <strong>of</strong><br />
20-120µg/ml and the absorbance were measured at<br />
307.5nm.<br />
The solutions <strong>of</strong> GF were prepared in the range <strong>of</strong> 10-<br />
80µg/ml and scanned in range 200 - 350nm and all the<br />
spectra were converted to second order derivative<br />
spectra (∆λ=1, scaling factor=10), and absorbance were<br />
measured at 279.4nm.<br />
Assay <strong>of</strong> marketed formulation<br />
25ml <strong>of</strong> marketed syrup (Axalin, Cipla) was measured and<br />
transferred in 50ml volumetric flask and made up to the<br />
mark with distilled water. This solution was filtered<br />
through whatman filter paper. This stock solution further<br />
diluted to get final concentration 15µg/ml <strong>of</strong> AB and<br />
50µg/ml <strong>of</strong> GF. This solution was scanned in UV-Visible<br />
region <strong>of</strong> 200-350nm for estimation <strong>of</strong> AB and GF.<br />
For determination <strong>of</strong> TBS concentration in syrup 4ml <strong>of</strong><br />
stock solution was transferred in 50ml volumetric flask,<br />
35 ml <strong>of</strong> a buffer solution and 1.0 ml <strong>of</strong> 4-aminoantipyrine<br />
solution were added and mixed. Further 1.0 ml <strong>of</strong><br />
potassium ferricyanide solution was transferred with<br />
vigorous swirling and then sufficient buffer solution was<br />
added to produce 50.0 ml. TBS standard solution<br />
(0.0125%) was prepared, diluted simultaneously in similar<br />
manner. Exactly after 75 seconds <strong>of</strong> the addition <strong>of</strong><br />
potassium ferricyanide solution, the absorbance <strong>of</strong> the<br />
resulting solution was measured at the maximum <strong>of</strong> 550<br />
nm using blank, prepared in the same manner omitting<br />
TBS. (Table 1)<br />
Method Validation<br />
Recovery studies: To study the accuracy <strong>of</strong> the<br />
proposed method, recovery studies were carried out<br />
by standard addition method <strong>of</strong> drug at three different<br />
levels (50%, 100% and 150%). A known amount <strong>of</strong> AB, GF<br />
and TBS were added to pre-analysed syrup separately and<br />
% recoveries were calculated. (Table 2)<br />
Precision: The precision <strong>of</strong> the method was<br />
determined by repeatability (intra-day) and<br />
intermediate precision (inter-day) and expressed as<br />
relative standard deviation (RSD). Intra-day precision was<br />
evaluated by analyzing concentration <strong>of</strong> AB (15 µg/ml), GF<br />
(50µg/ml) and TBS (10µg/ml) at three different time<br />
intervals under the same experimental conditions on the<br />
same day. Intermediate precision (inter-day precision)<br />
was determined by analyzing above mentioned<br />
concentrations <strong>of</strong> each drug on three consecutive days.<br />
(Table 3)<br />
Specificity <strong>of</strong> colorimetric method: This was carried out<br />
by analyzing the standard TBS solutions after spiking with<br />
appropriate amount <strong>of</strong> AB and GF. The concentration <strong>of</strong><br />
TBS solution was determined by performing the assay as<br />
per the procedure mentioned in assay <strong>of</strong> marketed<br />
formulation (Table 4).<br />
RESULTS AND DISCUSSION<br />
First and foremost, the selection <strong>of</strong> solvent for the<br />
analysis was carried out by preparing the standard<br />
solution <strong>of</strong> AB, GF, and TBS in traditional solvents like<br />
0.1N sodium hydroxide, 0.1N hydrochloric acid, and<br />
distilled water. Since the overlain spectra in all solvents<br />
was found to be almost identical, double distilled water<br />
chosen as it <strong>of</strong>fered better solubility and stability.<br />
As shown in figure 2, the wavelengths <strong>of</strong> absorption for<br />
AB were found to be at 244.5nm and 307.5nm. Since the<br />
absorbance <strong>of</strong> GF and TBS were found to be almost zero<br />
in their wide range <strong>of</strong> concentration at 307.5nm, the<br />
content <strong>of</strong> AB was determined by taking 70 as the value<br />
<strong>of</strong> A (1%, 1cm) at about 307.5nm. The linearity <strong>of</strong> AB at<br />
307.5nm was found to be in the range <strong>of</strong> 20-120 µg/ml.<br />
The percentage assay (99.23%) and recovery (101.4%) <strong>of</strong><br />
AB in syrup were found to be satisfactory as tabulated in<br />
Table 1 and 2.<br />
Figure 3: Second derivative spectrum showing common<br />
zero point <strong>of</strong> AB and TBS and GF absorbing prominently at<br />
279.4nm.<br />
<strong>International</strong> <strong>Journal</strong> <strong>of</strong> <strong>Pharmaceutical</strong> <strong>Sciences</strong> Review and <strong>Research</strong> Page 25<br />
Available online at www.globalresearchonline.net
Volume 8, Issue 2, May – June 2011; <strong>Article</strong>-004 ISSN 0976 – 044X<br />
Table 1: Assay <strong>of</strong> marketed formulation (Axalin syrup)<br />
Label claim (mg/5ml) Mean Amount found (mg/5ml) Mean Amount found (%) R.S.D. (%) n=3<br />
AB 15 14.88 99.23 0.052039<br />
GF 50 45.22 90.45 1.265881<br />
TBS 1.25 1.29 103.26 0.6651<br />
Table 2: Recovery Studies<br />
Percent <strong>of</strong> amount <strong>of</strong> the drug found in preanalysed syrup solution(n=3)<br />
50 % Add n ± RSD 100% Add n ± RSD 150 % Add n ±RSD<br />
AB 102.76± 2.1547 101.16±1.7413 101.36±1.2413<br />
GF 105.26±3.9504 106.80±3.5084 105.36±2.6169<br />
TBS 96.86+2.8154 95.41+1.7621 95.41+1.3241<br />
Table 3: Results <strong>of</strong> Precision Studies (Intra-day and Inter-day)<br />
Component Concentrations (µg/ml)<br />
Intra-day precision<br />
Conc. Found µg/ml (n=3) % RSD<br />
Inter-day Precision<br />
Conc. Found µg/ml (n=3) % RSD<br />
TBS 10 10.2 1.879 8.92 5.86<br />
AB 15 30.09 3.09 30.04 3.93<br />
GF 50 49.27 1.26 48.98 1.15<br />
Table 4: Results <strong>of</strong> Specificity<br />
Sr. No Con <strong>of</strong> AB (µg/ml) Con <strong>of</strong> GF (µg/ml) Con <strong>of</strong> TBS (µg/ml) Absorbance at 550nm (n=3) + RSD<br />
1 0 0 10 0.478<br />
2 0 50 0 0.00<br />
3 15 0 0 0.005<br />
4 15 50 10 0.474<br />
Parameters<br />
Table 5: Analytical Validation Parameters<br />
AB GF TBS<br />
Wavelengths (nm) 307.5 279.4 * 550<br />
Beer’s law range(µg/ml) 20-120 10-80 5-25<br />
Standard regression equations (n=9) y= 0.007059x+ 0.002683 y = -0.004423x- 0.0008 y = 0.0452x + 0.0074<br />
Standard absorbance value, A [1%, 1cm] 70.5 - 452.00<br />
Correlation Coefficient 0.9998 0.9994 0.9993<br />
LOD(µg/ml) 0.00035 0.000177 0.00002<br />
LOQ(µg/ml) 0.00106 0.000536 0.000063<br />
Sandel’s sensitivity(µg/ml)<br />
*Results <strong>of</strong> second order derivative<br />
0.1418 0.22609 0.00185<br />
While GF showed prominent absorption in the range <strong>of</strong><br />
210-293nm, AB and TBS were also found to be absorbing,<br />
making it difficult to determine the exact concentration <strong>of</strong><br />
GF. Therefore, to measure GF, zero order spectrum <strong>of</strong> AB,<br />
GF and TBS were converted to its first, second and higher<br />
derivatives. Wavelength <strong>of</strong> 279.4nm <strong>of</strong> second order<br />
derivative was chosen for estimation <strong>of</strong> GF as TB and AB<br />
were showing zero cross point at this wavelength.<br />
To optimize second order derivative method, different<br />
wavelength intervals (∆λ=1, 2, 4, 8) and scaling factors (1,<br />
5, 10, 20) were studied. Quantitative estimation <strong>of</strong> GF in<br />
syrup was performed by second order derivative at about<br />
279.4nm (∆λ=1, scaling factor=10). Linearity <strong>of</strong> GF was<br />
found to be in the concentration range <strong>of</strong> 10-80 µg/ml.<br />
While percentage recovery was found to be 105.8% (table<br />
2), the assay <strong>of</strong> GF in syrup was found to be 90.45% (table<br />
1).<br />
It is a well known fact that liquid formulation like syrup<br />
contains many excipients viz colors, preservative,<br />
solubilizing agent. These excipients, mainly color may<br />
interfere in estimation <strong>of</strong> GF. There was no improvement<br />
in assay <strong>of</strong> GF despite adopting methods like derivative<br />
spectrophotometry and derivative ratio<br />
<strong>International</strong> <strong>Journal</strong> <strong>of</strong> <strong>Pharmaceutical</strong> <strong>Sciences</strong> Review and <strong>Research</strong> Page 26<br />
Available online at www.globalresearchonline.net
Volume 8, Issue 2, May – June 2011; <strong>Article</strong>-004 ISSN 0976 – 044X<br />
spectrophotometry, where the blank was prepared<br />
assuming the excipients.<br />
While the proposed study addresses the issue <strong>of</strong><br />
estimation <strong>of</strong> GF in presence <strong>of</strong> AB and TBS in syrup, there<br />
is definite scope for further analysis and research to<br />
improve upon the proposed method.<br />
Estimation <strong>of</strong> TBS was a challenging task as the<br />
concentration <strong>of</strong> TBS in the mixture was very low<br />
(1.25mg/5ml) when compared to GF (50mg/5ml) and AB<br />
(15mg/5ml). Due to low concentration <strong>of</strong> TBS, derivative<br />
spectroscopy could not be applied for the current<br />
composition. Increasing the concentration levels <strong>of</strong> TBS in<br />
sample solution resulted in proportional increase in the<br />
concentration <strong>of</strong> GF and AB, thus failing the Beer-<br />
Lambert’s law.<br />
Hence colorimetric method was adopted for estimation <strong>of</strong><br />
TBS in presence <strong>of</strong> AB and GF. In this proposed method<br />
TBS was converted into colored complex by alkaline<br />
oxidation <strong>of</strong> phenol group by ferricyanide and then<br />
coupled with 4-aminoantipyrine. This reaction was carried<br />
out in tris buffer in the pH range <strong>of</strong> 9.4-9.6. The<br />
wavelength <strong>of</strong> absorption was found to be at about<br />
550nm. The method was validated for specificity by<br />
adding calculated amount <strong>of</strong> AB and GF in the same ratio<br />
as in the original formulation. No interference <strong>of</strong> AB and<br />
GF were noted.<br />
It was observed that TBS obeyed Beer-lambert’s law in<br />
the range <strong>of</strong> 5-25 µg/ml; %assay and recovery were found<br />
in the range 103.62% and 95.54% respectively (Table 1<br />
and 2).<br />
Precision was determined by inter- and intra-day studies<br />
<strong>of</strong> the solution <strong>of</strong> GF, TBS and AB. For inter- and intra -day<br />
studies <strong>of</strong> TBS, the stock solution was stored and<br />
converted into coloured product at the time <strong>of</strong><br />
measurement. RSD <strong>of</strong> observations was found to be less<br />
than 3%.<br />
CONCLUSION<br />
To conclude, the proposed analytical method is simple,<br />
specific, accurate and precise for simultaneous analysis <strong>of</strong><br />
AB, GF and TBS in syrup formulation.<br />
Acknowledgements: The authors shall remain grateful to<br />
Juggat Pharma Ltd., Bangalore, India for providing AB, GF<br />
and TBS in the form <strong>of</strong> ‘Gift sample’ and Nargund College<br />
<strong>of</strong> Pharmacy, Bangalore for providing lab and research<br />
facilities to complete this work.<br />
REFERENCES<br />
1. Trivedi A. and Banerjee L., “Development <strong>of</strong> modified<br />
spectrophotometric and HPLC method for simultaneous<br />
estimation <strong>of</strong> ambroxol hydrochloride and cetirizine<br />
hydrochloride in tablet dosage forms”, <strong>Journal</strong> <strong>of</strong><br />
<strong>Pharmaceutical</strong> <strong>Research</strong>, 2010, 3(6): 1398-1401.<br />
2. Abdallah O.M., “Sensitive spectrophotometric method for<br />
quantitation <strong>of</strong> guaifenesin and dropropizine in Their<br />
Dosage Forms”, <strong>International</strong> <strong>Journal</strong> <strong>of</strong> Analytical<br />
Chemistry, 2010, 2010: 10.<br />
3. Daraghmeh N., Al-Omari M.M., Sara Z., Badwan A.A. and<br />
Jaber A.M.Y., “ Determination <strong>of</strong> terbutaline sulfate and its<br />
degradation products in pharmaceutical formulations using<br />
LC”, <strong>Journal</strong> <strong>of</strong> <strong>Pharmaceutical</strong> and Biomedical Analysis,<br />
2002, 29: 927–937.<br />
4. Indian Pharmacopoeia, Controller <strong>of</strong> Publication, Delhi,<br />
2010, 2:792, 1429 and 3: 2195.<br />
5. Gangwal S. and Trivedi P., “Simultaneous determination <strong>of</strong><br />
terbutaline sulphate, bromhexine hydrochloride and<br />
guaiphenesin in three-component tablet formulation by UV<br />
spectrophotometry”, Indian <strong>Journal</strong> <strong>of</strong> <strong>Pharmaceutical</strong><br />
<strong>Sciences</strong> , 1999,61(2): 128-130.<br />
6. Lakshmana P. S., Shirwaikar A. A., Shirwaikar A., Dinesh K.<br />
C. and Aravind K. G. , “Simultaneous UV<br />
spectrophotometric estimation <strong>of</strong> ambroxol hydrochloride<br />
and levocetirizine dihydrochloride”, Indian <strong>Journal</strong> <strong>of</strong><br />
<strong>Pharmaceutical</strong> <strong>Sciences</strong>, 2008, 70(2): 236-238.<br />
7. Lakshmana P. S., Thiagarajan S., Srinivasan M. and Marina<br />
Q., “Simultaneous estimation <strong>of</strong> gatifloxacin and ambroxol<br />
hydrochloride by UV -spectrophotometry”, Indian <strong>Journal</strong><br />
<strong>of</strong> <strong>Pharmaceutical</strong> <strong>Sciences</strong>, 2010, 3(2):22.<br />
8. Neela M. B., Ganbavale S. K., Bhatia M. S., More H. N. and<br />
Kokil S. U.,<br />
“RP-HPLC and spectrophotometric estimation <strong>of</strong> ambroxol<br />
hydrochloride and cetirizine hydrochloride in combined<br />
dosage form”, Indian <strong>Journal</strong> <strong>of</strong> <strong>Pharmaceutical</strong> <strong>Sciences</strong>,<br />
2008,70(5): 603-608.<br />
9. Ehab F. E., “Simultaneous determination <strong>of</strong> dicl<strong>of</strong>enac<br />
potassium and methocarbamol in ternary mixture with<br />
guaifenesin by reversed phase liquid chromatography”,<br />
Talanta, 2010, 82: 1604–1607.<br />
10. Laura C., “Simultaneous determination <strong>of</strong> acetaminophen,<br />
guaifenesin, pseudoephedrine, pholcodine, and paraben<br />
preservatives in cough mixture by high-performance liquid<br />
chromatography”, <strong>Journal</strong> <strong>of</strong> <strong>Pharmaceutical</strong> <strong>Sciences</strong>,<br />
1983, 72(2):196–198.<br />
11. Sinan S., Cemal A., and Semsettin C., “Simultaneous<br />
determination <strong>of</strong> guaiphenesin and codeinephosphate in<br />
tablets by high-performance liquid chromatography”, Il<br />
Farmaco, 1999, 54:705–709.<br />
12. Patil K. M., Bhoir I. C., Raman B. and Sundaresan M.,<br />
“Concurrent assay <strong>of</strong> acetaminophen, pseudoephedrine,<br />
guaifenesin and dextromethorphan in formulations by<br />
packed column supercritical fluid chromatography”, Indian<br />
<strong>Journal</strong> <strong>of</strong> <strong>Pharmaceutical</strong> <strong>Sciences</strong>, 2001, 63(6):468-472.<br />
13. Artem U. K. and Aleksey G. V., “Simultaneous<br />
determination <strong>of</strong> paracetamol, caffeine, guaifenesin and<br />
preservatives in syrups by micellarLC”, Chromatographia,<br />
2008, 67: 5-6.<br />
14. Kyeong H. K. , Hyun J. K., Jeong-Hwan K., Joo H. L. and Sang<br />
C.L., “Determination <strong>of</strong> the optical purity <strong>of</strong> (R)-terbutaline<br />
by1H-NMR and RP-LC using chiral derivatizing agent, (S)-<br />
(−)-_-methylbenzylisocyanate”, <strong>Journal</strong> <strong>of</strong> <strong>Pharmaceutical</strong><br />
and Biomedical Analysis, 2001, 25: 947–956.<br />
15. Zhang Y. and Zhang Z. R., “Simple determination <strong>of</strong><br />
terbutaline in dog plasma by column-switching liquid<br />
<strong>International</strong> <strong>Journal</strong> <strong>of</strong> <strong>Pharmaceutical</strong> <strong>Sciences</strong> Review and <strong>Research</strong> Page 27<br />
Available online at www.globalresearchonline.net
Volume 8, Issue 2, May – June 2011; <strong>Article</strong>-004 ISSN 0976 – 044X<br />
chromatography”, <strong>Journal</strong> <strong>of</strong> Chromatography B, 2004,<br />
805: 211–214.<br />
16. Vanessa L. H. and Julie A. J., “Simple method for<br />
determination <strong>of</strong> terbutaline plasma concentration by highperformance<br />
liquid chromatography”, <strong>Journal</strong> <strong>of</strong><br />
Chromatography B, 2000, 741: 307–312.<br />
17. Mehdi A., Maryam K. and Mohammad S., “Simultaneous<br />
quantitation <strong>of</strong> theophylline and guaifenesin in syrup by<br />
HPLC, derivative and derivative ratio spectrophotometry<br />
for quality control purposes”, Iranian <strong>Journal</strong><br />
<strong>Pharmaceutical</strong> Technology, 2006, 5: 67-72.<br />
18. Schmid J., “Assay <strong>of</strong> ambroxol in biological fluids by<br />
capillary gas-liquid chromatography”, <strong>Journal</strong> <strong>of</strong><br />
Chromatography B, 1987, 414: 65-75.<br />
19. Maged H .M. S. and Dwight D. S., “Determination <strong>of</strong><br />
guaifenesin in human serum by capillary gas<br />
chromatography and electron capture detection”, <strong>Journal</strong><br />
<strong>of</strong> <strong>Pharmaceutical</strong> and Biomedical Analysis, 2004, 35(4):<br />
801.<br />
*********************<br />
20. Rau H. L., Aroor A. R. and. Rao P. G, “Fluorimetric<br />
estimation <strong>of</strong> terbutalinesulphate in dosage forms”, Indian<br />
<strong>Journal</strong> <strong>of</strong> <strong>Pharmaceutical</strong> <strong>Sciences</strong>, 1990,52(5): 255-6.<br />
21. Shuting L., Janshi W. and Shulin Z., “Determination <strong>of</strong><br />
terbutalinesulfate by capillary electrophoresis with<br />
chemiluminescence detection”, <strong>Journal</strong> <strong>of</strong> Chromatography<br />
B, 2009, 877: 155–158.<br />
22. Roiga M., Berge´sa R., Venturaa R., Fitchc K. D., Mortonc A.<br />
R. and Seguraa J.. “Quantification <strong>of</strong> terbutaline in urine by<br />
enzyme-linked immunosorbent assay and capillary<br />
electrophoresis after oral and inhaled administrations”,<br />
<strong>Journal</strong> <strong>of</strong> Chromatography B, 2002, 768:315–324.<br />
23. Yi L., Zhujun Z., Yufei H., Deyong H. and Shuhua H., “A novel<br />
chemiluminescence method for determination <strong>of</strong><br />
terbutaline sulfate based on potassium ferricyanide<br />
oxidation sensitized by rhodamine 6G”, <strong>Journal</strong> <strong>of</strong><br />
<strong>Pharmaceutical</strong> and Biomedical Analysis , 2003,32: 555-<br />
556.<br />
24. Rao K. E. , Sastry C. S. P., “New spectrophotometric<br />
determination <strong>of</strong> terbutaline sulfate”,Micro Chemical<br />
<strong>Journal</strong>, 1985,32(3):293.<br />
<strong>International</strong> <strong>Journal</strong> <strong>of</strong> <strong>Pharmaceutical</strong> <strong>Sciences</strong> Review and <strong>Research</strong> Page 28<br />
Available online at www.globalresearchonline.net